Nitrate in Foodstuffs: Analytical Standardisation and...
46
Nitrate in Foodstuffs: Analytical Standardisation and Monitoring and Control in Leafy Vegetables Leonardo Merino Department of Food Science Uppsala Licentiate thesis Swedish University of Agriculture Sciences Uppsala 2009
-
Upload
hoangduong -
Category
Documents
-
view
219 -
download
1
Transcript of Nitrate in Foodstuffs: Analytical Standardisation and...
Nitrate in Foodstuffs: Analytical Standardisation and Monitoring
and Control in Leafy Vegetables
Leonardo Merino
Department of Food Science Uppsala
Licentiate thesis
Swedish University of Agriculture Sciences Uppsala 2009

ISBN 978-91-86197-34-6 © 2009 Leonardo Merino, Uppsala Tryck: SLU Service/Repro, Uppsala 2009
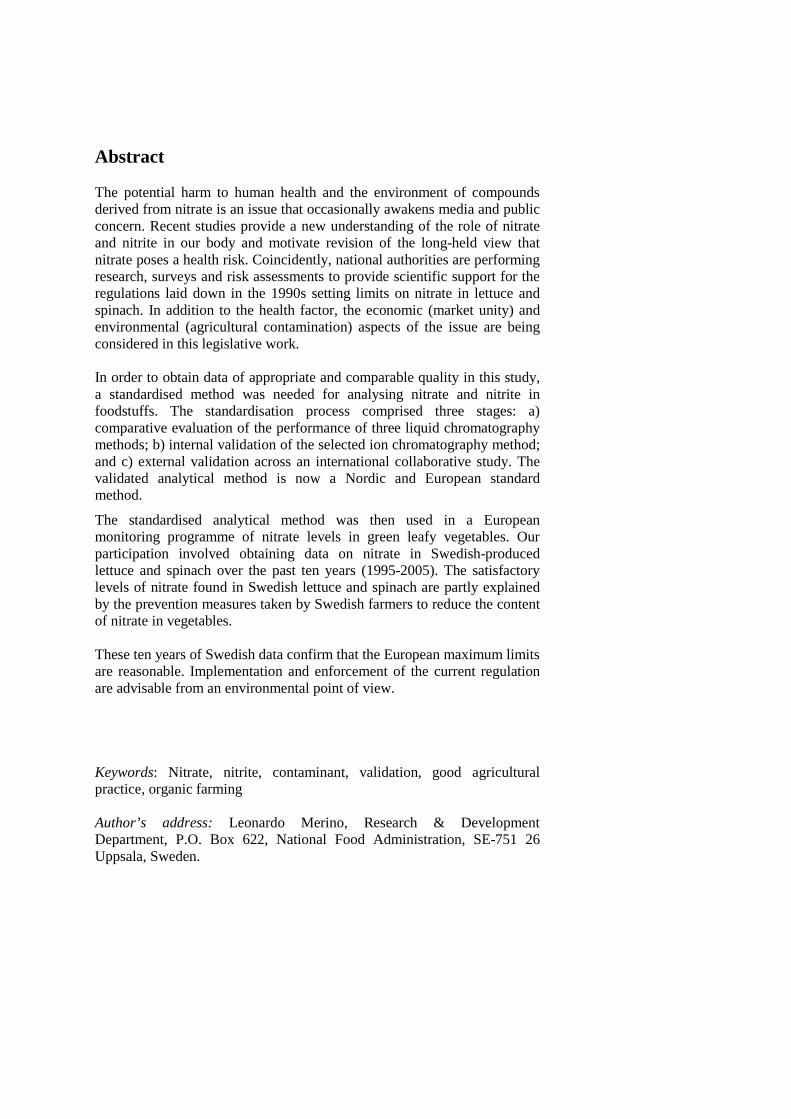
Abstract The potential harm to human health and the environment of compounds derived from nitrate is an issue that occasionally awakens media and public concern. Recent studies provide a new understanding of the role of nitrate and nitrite in our body and motivate revision of the long-held view that nitrate poses a health risk. Coincidently, national authorities are performing research, surveys and risk assessments to provide scientific support for the regulations laid down in the 1990s setting limits on nitrate in lettuce and spinach. In addition to the health factor, the economic (market unity) and environmental (agricultural contamination) aspects of the issue are being considered in this legislative work. In order to obtain data of appropriate and comparable quality in this study, a standardised method was needed for analysing nitrate and nitrite in foodstuffs. The standardisation process comprised three stages: a) comparative evaluation of the performance of three liquid chromatography methods; b) internal validation of the selected ion chromatography method; and c) external validation across an international collaborative study. The validated analytical method is now a Nordic and European standard method.
The standardised analytical method was then used in a European monitoring programme of nitrate levels in green leafy vegetables. Our participation involved obtaining data on nitrate in Swedish-produced lettuce and spinach over the past ten years (1995-2005). The satisfactory levels of nitrate found in Swedish lettuce and spinach are partly explained by the prevention measures taken by Swedish farmers to reduce the content of nitrate in vegetables. These ten years of Swedish data confirm that the European maximum limits are reasonable. Implementation and enforcement of the current regulation are advisable from an environmental point of view. Keywords: Nitrate, nitrite, contaminant, validation, good agricultural practice, organic farming Author’s address: Leonardo Merino, Research & Development Department, P.O. Box 622, National Food Administration, SE-751 26 Uppsala, Sweden.

Sammanfattning Risken för skador på människors hälsa och miljö, orsakade av föreningar som bildas från nitrat, är ett ämne som då och då väcker pressens och allmänhetens intresse. Nyligen genomförda studier ger dock en ny förståelse av nitrat och nitrit i kroppen. Detta reviderar vår 60-åriga uppfattning av nitrat som hälsorisk. Samtidigt bedriver myndigheter och institutioner forskning för att vetenskapligt belägga de nuvarande gränsvärdena för nitrat i sallad och spenat som fastställdes på 90-talet. Vid överväganden gällande gränsvärden tas dock också hänsyn till ekonomiska (handelshinder) och miljömässiga aspekter (jordbruksförorening). För att få pålitliga data av jämförbar kvalitet har en kromatografisk metod för att analysera nitrat och nitrit i livsmedel standardiserats. Studien gjordes i tre steg: a) jämförande utvärdering av tre vätskekromatografiska metoder, b) intern validering av en jon kromatografisk metoden, och c) extern validering i en internationell avprovning. Den validerade metoden är numera en nordisk och europeisk standardmetod. Därefter användes den standardiserade analysmetoden i en europeisk kartläggning av nitrathalterna i gröna bladgrönsaker. Vårt deltagande var inriktat på att skaffa data om nitrat i svensk-producerad sallad och spenat. Resultat från 10 år presenteras (1995-2005). De tillfredställande resultaten gällande den svenska produktionen av sallad och spenat kan delvis förklaras av de förebyggande åtgärder som vidtagits av svenska lantbrukare för att minska innehållet av nitrat i grönsaker. Tio år av svensk erfarenhet stärker uppfattningen att de europeiska gränsvärdena är rimliga. Implementering och tillämpning av den gällande förordningen är också gynnsam ur miljösynpunkt.

List of publications The present thesis is based on the following papers, which are referred to in the text by their Roman numerals: I. Merino, L., Edberg, U., Fuchs, G. & Åman, P. (2000). Liquid
chromatographic determination of residual nitrite/nitrate in foods: NMKL collaborative study. Journal of AOAC International 83 (2): 365-375
II. Merino, L., Darnerud, P.O., Edberg, U., Åman, P. & Castillo, M.D.P.
(2006). Levels of nitrate in Swedish lettuce and spinach over the past 10 years. Food Additives and Contaminants 23(12):1283-1289.
Papers I and II are reproduced by permission of the publishers.
Key to abbreviations AOAC Association of Official Analytical Chemists CEN European Committee for Standardisation EC European Commission EU European Union EFSA European Food Safety Authority EPA Environmental Protection Agency GAP Good Agricultural Practice Hb Haemoglobin HPLC High Performance Liquid Chromatography IP Integrated Production LOD Limit of Detection ML Maximum Level NMKL Nordic Committee of Food Analysis NFA Swedish National Food Administration RNI Reactive Nitrogen Intermediates RSDR Reproducibility Standard Deviation RSDr Repeatability Standard Deviation SD Standard Deviation SNK Swedish National Committee
Contents 1. Introduction 11 2. Background 13 2.1 Occurrence of nitrate and nitrite 13 2.1.1 Nitrate/nitrite in the environment 12 2.1.2 Exogenous sources of nitrate/nitrite 13 2.1.2.1 Nitrate/nitrite as contaminant (drinking water) 14 2.1.2.2 Nitrate/nitrite as additive (meat products) 14 2.1.2.3 Nitrate/nitrite as natural contaminant (vegetables) 15 2.1.3 Endogenous sources of nitrate/nitrite 17 2.2 Standardisation of analytical methods 19 2.3 Control of natural contaminants 20 3. Objectives 21 4. Materials and methods 22 4.1 Paper I - Liquid chromatographic determination of residual nitrite/nitrate in foods: NMKL collaborative study 22
4.1.1 Selecting the method 22 4.1.2 Single-validation study 24 4.1.3 Collaborative Study 25
4.2 Paper II - Levels of nitrate in Swedish lettuce and spinach over the past 10 years 25
4.2.1 Sampling and sample preparation 25 4.2.2 Analytical methods 26
5. Results and discussion 26 5.1 Paper I - Liquid chromatographic determination of residual nitrite/nitrate in foods: NMKL collaborative study 26
5.1.1 Selecting the method 26 5.1.2 Single-validation study 29 5.1.3 Collaborative study 29
5.2 Paper II - Levels of nitrate in Swedish lettuce and spinach over the past 10 years 31
5.2.1 Performance of the analytical method 31 5.2.2 Monitoring and control of nitrate in lettuce and spinach 31
6. Conclusions 37 7. Future research 39 8. References 40 9. Acknowledgments 45

11
1. Introduction Nitrate is a contaminant1, natural contaminant2 and food additive3 that is relatively non-toxic to humans. The importance of monitoring and control of nitrate and its reduction product nitrite has long been recognised, but the reason for this has changed in recent years. The discovery of the beneficial effects of the L-arginine-NO-synthase and nitrate-nitrite-NO pathways in human metabolism is having a profound impact on our current view of these ions (Benjamin, 2000; Gladwin et al., 2005; Lundberg et al., 2008). In these pathways, the nitric oxide plays the principal role and the nitrate and nitrite ions act as products and precursors of several biochemical reactions. Furthermore, the old view of nitrate/nitrite as a health threat has been questioned, since the hypothesis suggesting a link between the intake of nitrate and cancer risk has still not been clearly demonstrated. Previous studies show only a very slightly negative, very slightly positive or no correlation, indicating that there is no convincing evidence of a causal association with any cancer disease (L’hirondel, 2006). Re-examination of cases of methaemoglobinaemia associated with the use of drinking water with a high nitrate concentration also shows conflicting evidence. New research suggests that gastrointestinal infections, i.e. bacteria instead of nitrate itself, may have been the major factor involved in many reported cases of blue-baby syndrome (Addiscott, 2006). However, the concern about the potentially adverse health implications of the breakdown products of nitrate, i.e. nitrites and nitrosamines, have led the health authorities to set upper limits for nitrate in drinking water and regulate the use of nitrate and nitrite as food additives. In the 1960s, 1970s and 1980s, a number of national and international regulations were introduced. In the 1990s it was decided that maximum tolerances for nitrate in vegetables – which account for 50-75% of the overall dietary intake – should also be established.
1 A contaminant is a substance that is either present in an environment where it does not belong or present at levels that might cause harmful effects to humans or the environment (GreenFacts, 2009). 2 A natural contaminant is a chemical present in the environment that is either a part of a food’s natural growing conditions or that cannot be controlled by intervention (NZFSA, 2009). 3 A food additive is a substance added intentionally to foodstuffs to perform certain technological functions, for example to colour, sweeten or preserve (European Commission, 2009)
12
In 1993 the EU agreed to lay down procedures for certain contaminants in food (European Commission regulation 315/93, 1993). Regarding nitrate, the regulation harmonised the nitrate limits, meeting the demand of some member states (Netherlands and Belgium) to avoid trade barriers created by national legislation (e.g. Germany). As a result, in 1997 the EU set limits for nitrate in lettuce and spinach (Directive 97/194/EC, 1997). In order to provide an up-to-date scientific base for achieving the legislative requirements, the official organisations of the member states are taking appropriate action, for example by standardisation of analytical methods (European Commission regulation 1882/2006, 2006), monitoring programmes for nitrate content in salad vegetables, promoting good agricultural practice (GAP), clarifying health issues through risk-benefit analysis, etc. (EFSA, 2008). This thesis summarises the work carried out at the National Food Administration in Sweden concerning: 1) the selection and standardisation of an analytical method to analyse nitrate/nitrite in foodstuffs; and 2) the monitoring and control of nitrate in Swedish lettuce and spinach.
13
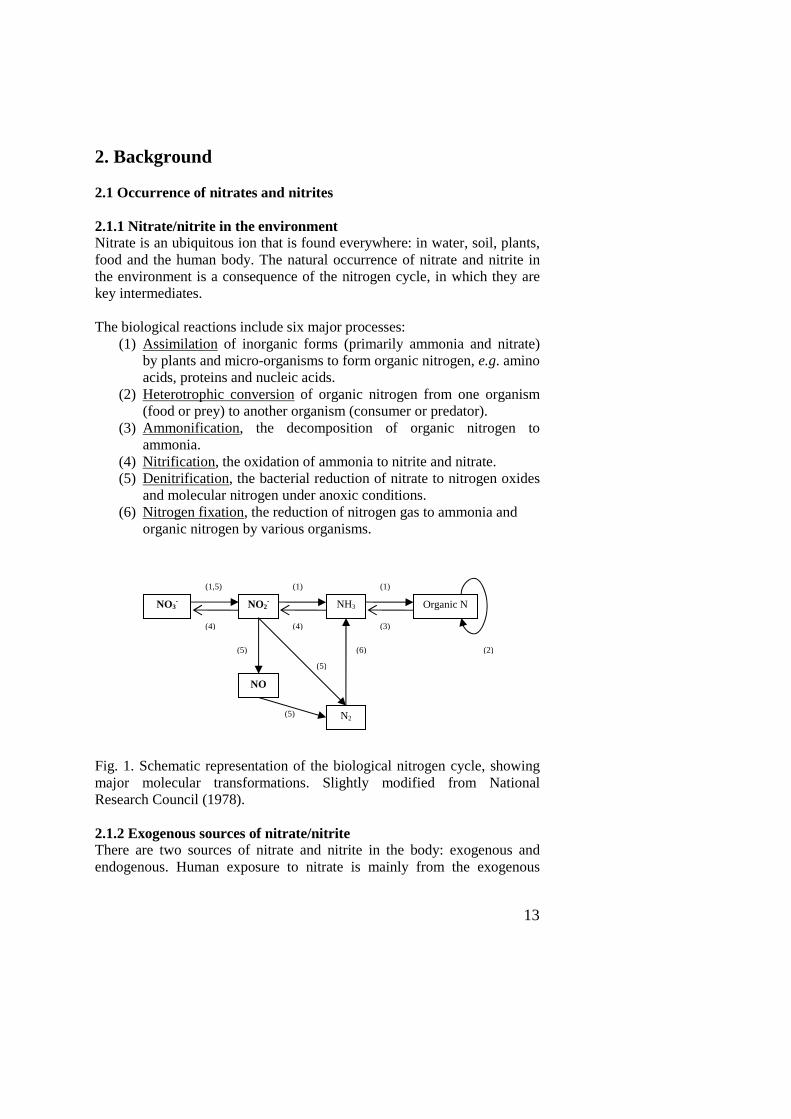
2. Background 2.1 Occurrence of nitrates and nitrites 2.1.1 Nitrate/nitrite in the environment Nitrate is an ubiquitous ion that is found everywhere: in water, soil, plants, food and the human body. The natural occurrence of nitrate and nitrite in the environment is a consequence of the nitrogen cycle, in which they are key intermediates. The biological reactions include six major processes:
(1) Assimilation of inorganic forms (primarily ammonia and nitrate) by plants and micro-organisms to form organic nitrogen, e.g. amino acids, proteins and nucleic acids.
(2) Heterotrophic conversion of organic nitrogen from one organism (food or prey) to another organism (consumer or predator).
(3) Ammonification, the decomposition of organic nitrogen to ammonia.
(4) Nitrification, the oxidation of ammonia to nitrite and nitrate. (5) Denitrification, the bacterial reduction of nitrate to nitrogen oxides
and molecular nitrogen under anoxic conditions. (6) Nitrogen fixation, the reduction of nitrogen gas to ammonia and
organic nitrogen by various organisms.
Fig. 1. Schematic representation of the biological nitrogen cycle, showing major molecular transformations. Slightly modified from National Research Council (1978). 2.1.2 Exogenous sources of nitrate/nitrite There are two sources of nitrate and nitrite in the body: exogenous and endogenous. Human exposure to nitrate is mainly from the exogenous
NO3- NO2
- Organic N
N2
NO
NH3
(1,5)
(4)
(1)
(4)
(1)
(3)
(5)
(5)
(5)
(6) (2)
14
source, while exposure to nitrite is mainly endogenous, through nitrate metabolism. The intake of exogenous nitrates and nitrites is mainly via food – vegetables and meat products – and drinking water. 2.1.2.1 Nitrate/nitrite as contaminant (drinking water) The nitrate concentration in surface water and groundwater is normally low, but increasing levels have been detected in many European countries since the 1950s (Dudley, 1990). Water pollution by nitrates has worsened since the introduction of intensive farming methods (including excess application of chemical fertiliser and manures) and livestock production. Nitrate contamination of aquifers (eutrophication) occurs as a result of leaching or runoff from agricultural land and contamination from sewage discharge (human and animal wastes) (Directive 91/676/EEC, 1991). In drinking water the primary health concern for the legislation regarding nitrate and nitrite is the protection against methaemoglobinaemia in infants. Methaemoglobinaemia is characterised by reduced ability of the blood to carry oxygen because of reduced levels of normal haemoglobin. Infants are most often affected and may seem healthy, but show signs of blueness around the mouth, hands and feet, hence the common name ‘blue baby syndrome’ (World Health Organisation, 2009). Intake of high levels of nitrate with drinking water has also been associated with cancer and adverse reproductive outcomes such as spontaneous abortion and premature birth (Ward et al., 2005). The WHO guideline of 50 mg NO3
- per litre is protective for bottle-fed infants and, consequently, other parts of the population (World Health Organisation, 2008). When nitrate levels in drinking water exceed 50 mg/L, water can overtake vegetables as the major source of total nitrate intake in people’s diets. 2.1.2.2 Nitrate/nitrite as additive (meat products) Nitrate and nitrite are used as food additives in cured meats to stabilise the colour of red meat, inhibit some spoilage and food poisoning organisms and contribute to flavour development. Nitrate is also used in the preservation of fish products and production of cheese (Slorach, 1981). Nitrate and nitrite are listed as officially accepted preservatives in EU directives (Directive 95/2/EC, 1995). Following EFSA recommendations, the level of nitrates and nitrites in meat products is set in amended legislation as ‘added amount’ rather than ‘residual amount’, since it is the added amount which contributes to the inhibitory activity against C. botulinum (Directive 2006/52/EC, 2006). This
15
revision aims to keep levels of nitrosamines as low as possible whilst maintaining the microbiological safety of food. As regards official controls (Regulation No 882/2004, 2004) in the future these are to be based on added amounts rather than residual amounts. The concentration limits for nitrate (E 251 = NaNO3, E 252 = KNO3, expressed as NaNO2) that may be added during processing range from 150 mg/kg in milk for cheese-making and non-heat-treated meat products to 300 mg/kg for several cured meat products. Furthermore, a maximum amount of 500 mg/kg is permitted for preserved pickled herring and sprat. However, the new legislation allows certain traditional products to be produced based on residual amounts, with the maximum residual amount ranging from 10-250 mg/kg for traditionally cured meat products. The legislative limit for the use of nitrite (E 249 = KNO2, E 250 = NaNO2, expressed as NaNO2) in meat products is 150 mg/kg and in sterilised meat products to a maximum amount added of 100 mg/kg. The maximum residual amount for several traditional products ranges from 50-175 mg/kg. 2.1.2.3 Nitrate/nitrite as natural contaminant (vegetables) The concentration of nitrate in vegetables depends on genetic factors, environmental variables (season, light, temperature, etc.) and agricultural practices (Maynard et al., 1976). However, most vegetables usually have low levels of nitrate, with leafy vegetables clearly having the highest concentration (European Food Standards Authority, 2008). In contrast, only trace levels of nitrite are present in vegetables. Exceptions to this are poorly stored vegetables or vegetables stored for extended periods (at concentrations well below 10 mg/kg). The potential hazard of nitrate for consumers, mainly associated with the generation of carcinogenic N-nitrosamines (Fernlöf & Darnerud, 1996), has led health authorities in several EU member states to set maximum limits on nitrate in certain vegetables. Subsequently, in order to protect public health, reduce wherever possible the presence of contaminants and ensure market unity, the European Commission has established maximum levels for nitrate in vegetables (Directive 97/194/EC, 1997). At the start of this legislative work, the existing national regulations provided the legal framework for the European common limits (European Parliament, 1984). So far, the current legislation has been amended several times to take into account the differences between varieties, seasons, growing conditions and processing methods (European Community regulation 1881/06, 2006).
16
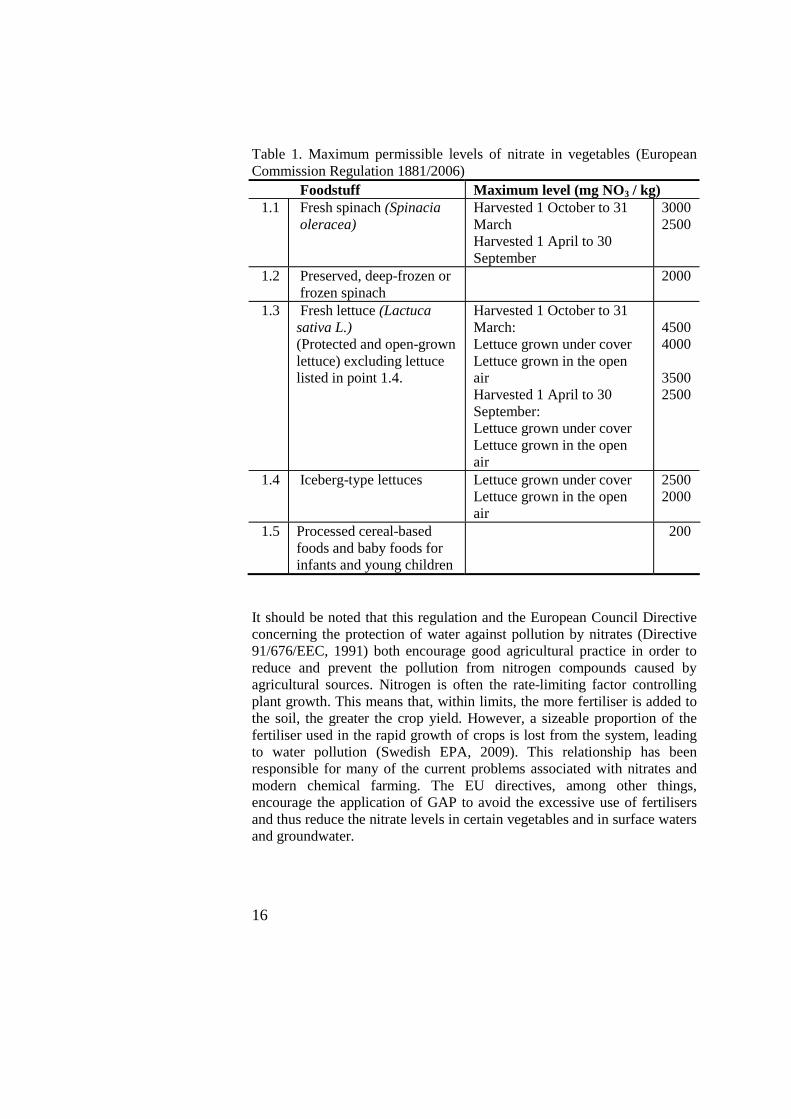
Table 1. Maximum permissible levels of nitrate in vegetables (European Commission Regulation 1881/2006)
Foodstuff Maximum level (mg NO3 / kg) 1.1 Fresh spinach (Spinacia
oleracea)
Harvested 1 October to 31 March Harvested 1 April to 30 September
3000 2500
1.2 Preserved, deep-frozen or frozen spinach
2000
1.3 Fresh lettuce (Lactuca sativa L.) (Protected and open-grown lettuce) excluding lettuce listed in point 1.4.
Harvested 1 October to 31 March: Lettuce grown under cover Lettuce grown in the open air Harvested 1 April to 30 September: Lettuce grown under cover Lettuce grown in the open air
4500 4000 3500 2500
1.4 Iceberg-type lettuces Lettuce grown under cover Lettuce grown in the open air
2500 2000
1.5 Processed cereal-based foods and baby foods for infants and young children
200
It should be noted that this regulation and the European Council Directive concerning the protection of water against pollution by nitrates (Directive 91/676/EEC, 1991) both encourage good agricultural practice in order to reduce and prevent the pollution from nitrogen compounds caused by agricultural sources. Nitrogen is often the rate-limiting factor controlling plant growth. This means that, within limits, the more fertiliser is added to the soil, the greater the crop yield. However, a sizeable proportion of the fertiliser used in the rapid growth of crops is lost from the system, leading to water pollution (Swedish EPA, 2009). This relationship has been responsible for many of the current problems associated with nitrates and modern chemical farming. The EU directives, among other things, encourage the application of GAP to avoid the excessive use of fertilisers and thus reduce the nitrate levels in certain vegetables and in surface waters and groundwater.
17
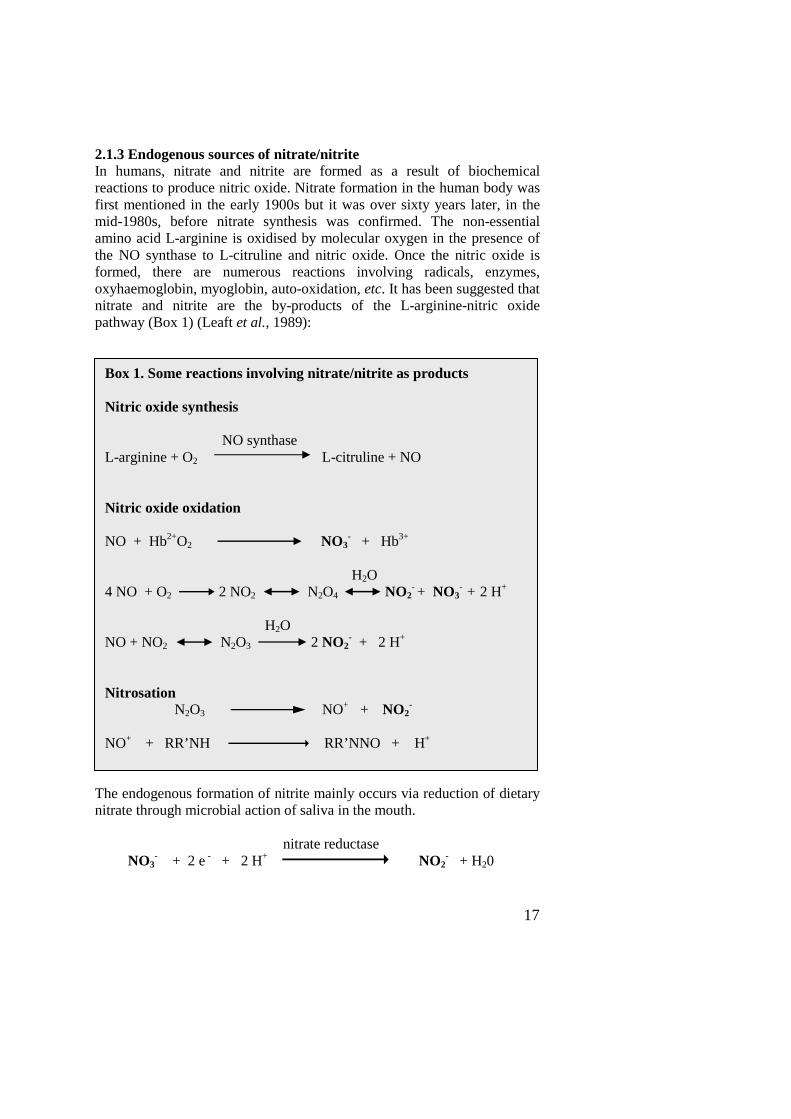
2.1.3 Endogenous sources of nitrate/nitrite In humans, nitrate and nitrite are formed as a result of biochemical reactions to produce nitric oxide. Nitrate formation in the human body was first mentioned in the early 1900s but it was over sixty years later, in the mid-1980s, before nitrate synthesis was confirmed. The non-essential amino acid L-arginine is oxidised by molecular oxygen in the presence of the NO synthase to L-citruline and nitric oxide. Once the nitric oxide is formed, there are numerous reactions involving radicals, enzymes, oxyhaemoglobin, myoglobin, auto-oxidation, etc. It has been suggested that nitrate and nitrite are the by-products of the L-arginine-nitric oxide pathway (Box 1) (Leaft et al., 1989): The endogenous formation of nitrite mainly occurs via reduction of dietary nitrate through microbial action of saliva in the mouth. nitrate reductase NO3
- + 2 e - + 2 H+ NO2- + H20
Box 1. Some reactions involving nitrate/nitrite as products Nitric oxide synthesis NO synthase L-arginine + O2 L-citruline + NO Nitric oxide oxidation NO + Hb2+O2 NO3
- + Hb3+ H2O 4 NO + O2 2 NO2 N2O4 NO2
- + NO3- + 2 H+
H2O NO + NO2 N2O3 2 NO2
- + 2 H+ Nitrosation N2O3 NO+ + NO2
-
NO+ + RR’NH RR’NNO + H+
18
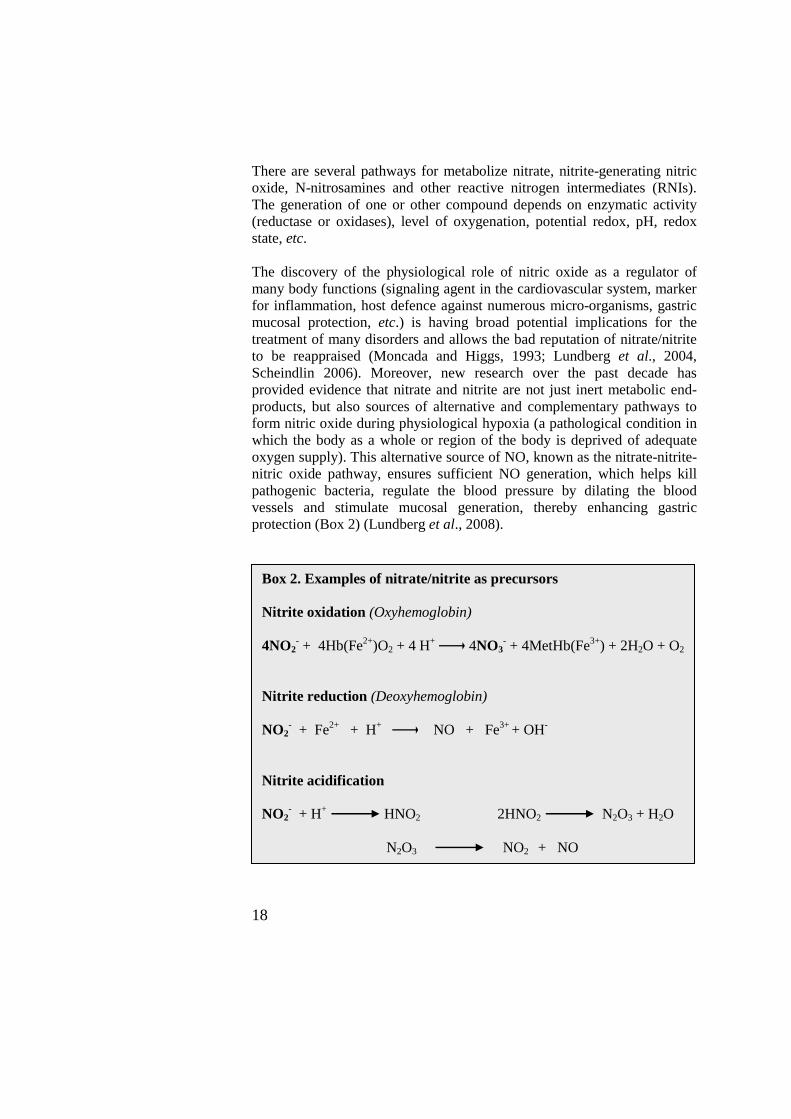
There are several pathways for metabolize nitrate, nitrite-generating nitric oxide, N-nitrosamines and other reactive nitrogen intermediates (RNIs). The generation of one or other compound depends on enzymatic activity (reductase or oxidases), level of oxygenation, potential redox, pH, redox state, etc. The discovery of the physiological role of nitric oxide as a regulator of many body functions (signaling agent in the cardiovascular system, marker for inflammation, host defence against numerous micro-organisms, gastric mucosal protection, etc.) is having broad potential implications for the treatment of many disorders and allows the bad reputation of nitrate/nitrite to be reappraised (Moncada and Higgs, 1993; Lundberg et al., 2004, Scheindlin 2006). Moreover, new research over the past decade has provided evidence that nitrate and nitrite are not just inert metabolic end-products, but also sources of alternative and complementary pathways to form nitric oxide during physiological hypoxia (a pathological condition in which the body as a whole or region of the body is deprived of adequate oxygen supply). This alternative source of NO, known as the nitrate-nitrite-nitric oxide pathway, ensures sufficient NO generation, which helps kill pathogenic bacteria, regulate the blood pressure by dilating the blood vessels and stimulate mucosal generation, thereby enhancing gastric protection (Box 2) (Lundberg et al., 2008).
Box 2. Examples of nitrate/nitrite as precursors Nitrite oxidation (Oxyhemoglobin) 4NO2
- + 4Hb(Fe2+)O2 + 4 H+ 4NO3- + 4MetHb(Fe3+) + 2H2O + O2
Nitrite reduction (Deoxyhemoglobin) NO2
- + Fe2+ + H+ NO + Fe3+ + OH- Nitrite acidification NO2
- + H+ HNO2 2HNO2 N2O3 + H2O N2O3 NO2 + NO
19
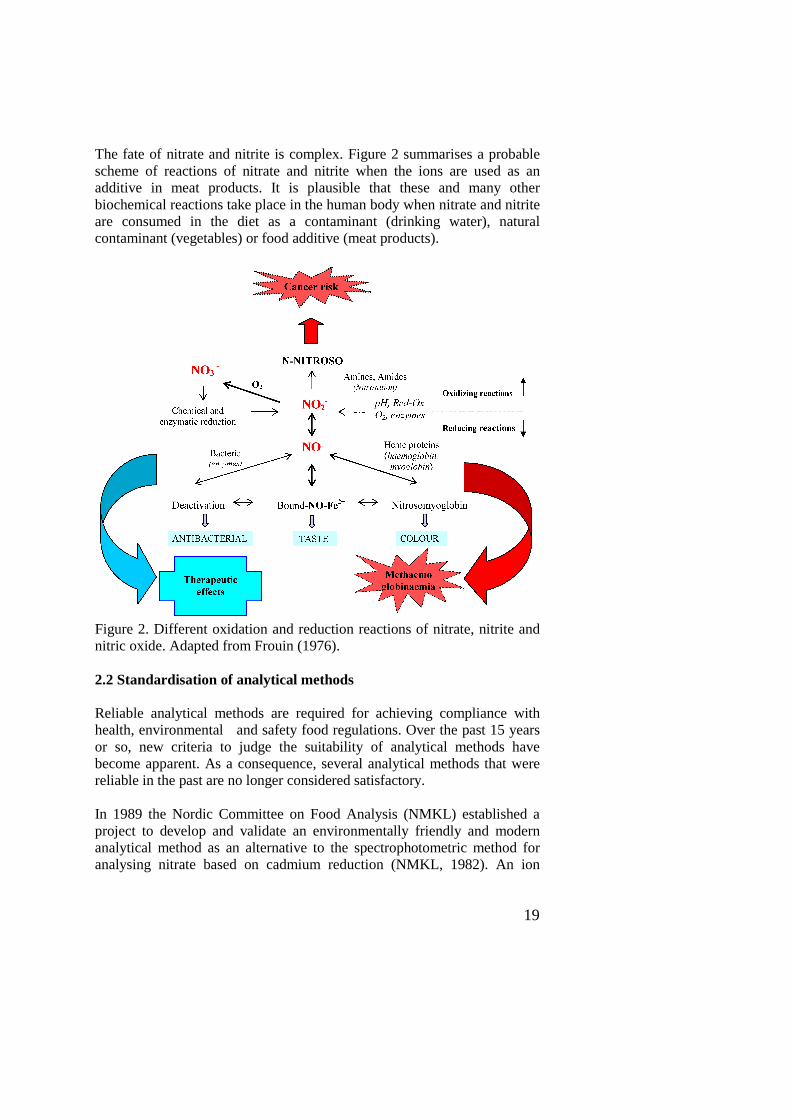
The fate of nitrate and nitrite is complex. Figure 2 summarises a probable scheme of reactions of nitrate and nitrite when the ions are used as an additive in meat products. It is plausible that these and many other biochemical reactions take place in the human body when nitrate and nitrite are consumed in the diet as a contaminant (drinking water), natural contaminant (vegetables) or food additive (meat products).
Figure 2. Different oxidation and reduction reactions of nitrate, nitrite and nitric oxide. Adapted from Frouin (1976). 2.2 Standardisation of analytical methods Reliable analytical methods are required for achieving compliance with health, environmental and safety food regulations. Over the past 15 years or so, new criteria to judge the suitability of analytical methods have become apparent. As a consequence, several analytical methods that were reliable in the past are no longer considered satisfactory. In 1989 the Nordic Committee on Food Analysis (NMKL) established a project to develop and validate an environmentally friendly and modern analytical method as an alternative to the spectrophotometric method for analysing nitrate based on cadmium reduction (NMKL, 1982). An ion
20
chromatography method (Eggers and Cattle, 1986) was proposed and validated in two Nordic collaborative studies carried out in 1992 and 1993. Due to the poor recovery and uncertainty obtained in these studies, the proposed analytical method was not approved by NMKL experts. The reasons for this unsatisfactory performance were not fully understood (SNK, 1993). Meanwhile, in 1991 the European Committee for Standardisation (CEN) created a technical committee in order to approve European standard methods in the field of food [CEN (European Committee for Standardisation), 1991]. As a result, in 1993 CEN set up a working group to adopt European horizontal methods, i.e. reliable for analysing a broad range of foodstuffs to determine nitrate and nitrite content. Due to differences in levels, matrices and sample preparation for the matrices, the experts concluded that no horizontal method was available and decided instead to adopt a number of vertical methods (by matrices). Twenty seven existing methods were selected for inclusion in the work programme and were assessed according to approved analytical criteria, matrices and requirements of the current legislation. The experts also concluded that it would be desirable to have an HPLC method as European Standard and avoid the use of the cadmium reduction principle, which still has wide application in analysis of different kind of foods, including water and dairy products [CEN (European Committee for Standardisation), 1993]. 2.3 Control of natural contaminants Preliminary surveys on the nitrate content in different kind of vegetables were carried out by the EU member states to provide background to the discussion on the draft regulation setting maximum levels for nitrate in lettuce and spinach (European Commission Doc VI/1695/96, 1996). Subsequently, national monitoring programmes for nitrate in lettuce and spinach were initiated. In order to obtain comparable results, guidelines on the sampling and performance criteria for methods of analysis to be applied by the laboratories were also provided. It was planned to revise the maximum nitrate contents, and if necessary to lower them, on the basis of the results of the monitoring programme (European Commission Doc VI/4784/96-EN, 1996). All member states of the European Community had to report annually to the Commission the results of their monitoring and any measures taken with regard to the application of the code of good agricultural practice to reduce nitrate levels (Directive 97/194/EC, 1997).
21
3. Objectives The objectives of the present work were:
1. Selection and single-laboratory validation of a method for the determination of nitrate and nitrite in foodstuffs.
2. External validation of the selected method in a collaborative study. 3. Monitoring and control of nitrate in Swedish lettuce and spinach
using the standardised method.
22
4. Materials and methods 4.1 Paper I - Liquid chromatographic determination of residual nitrite/nitrate in foods: NMKL collaborative study 4.1.1 Selecting the method Three liquid chromatography (LC) methods were assessed:
Reversed-phase LC. Weak anionic exchanger. (CEN-pr ENV 12014-Part 2, 1998).
Ion chromatography LC. Strong anionic exchanger. ‘NMKL method’. (Eggers et al., 1986).
Ion chromatography LC. Strong anionic exchanger. (CEN-prEN 12014-Part 4, 1998).
Assays were carried out to comparatively assess the type of column, sample preparation (extraction, clarification) and mobile phase of the three selected methods. Reversed-phase LC. Weak anionic exchanger column (CEN-Part 2). In some experiments the pH and solvent strength were varied with the aim of obtaining better separation of the nitrate and nitrite peaks. Thus, the mobile phase was adjusted from acid (pH 3) to basic conditions (pH 9). The solvent strength was changed through increasing the concentration of acetonitrile and decreasing the concentration of H2KPO4 (Table 2, column 1) Ion chromatography LC. Strong anionic exchanger column. The two methods (here referred to as ‘NMKL method’ and ‘CEN-Part 4’) use the same high-capacity polymethacrylate gel anion-exchange (quaternary ammonium) column and UV detection, but different mobile phase and sample preparation (Table 2, columns 2 and 3). The sample preparation, mobile phase and column size of the ion chromatography methods were compared using extracts of meat products. The recovery was calculated by analyses of fortified samples. Sample preparation: Extraction Nine commercial mixtures of meat products were obtained from retail outlets. Samples were homogenised and stored at 7 C prior to analysis. Meat products (10 g) were minced and fortified with a standard solution of nitrate and nitrite (1000 mg/L). The samples were extracted following the procedure described by the CEN method. One minor procedural change was made to the CEN method since the homogenisation was carried out
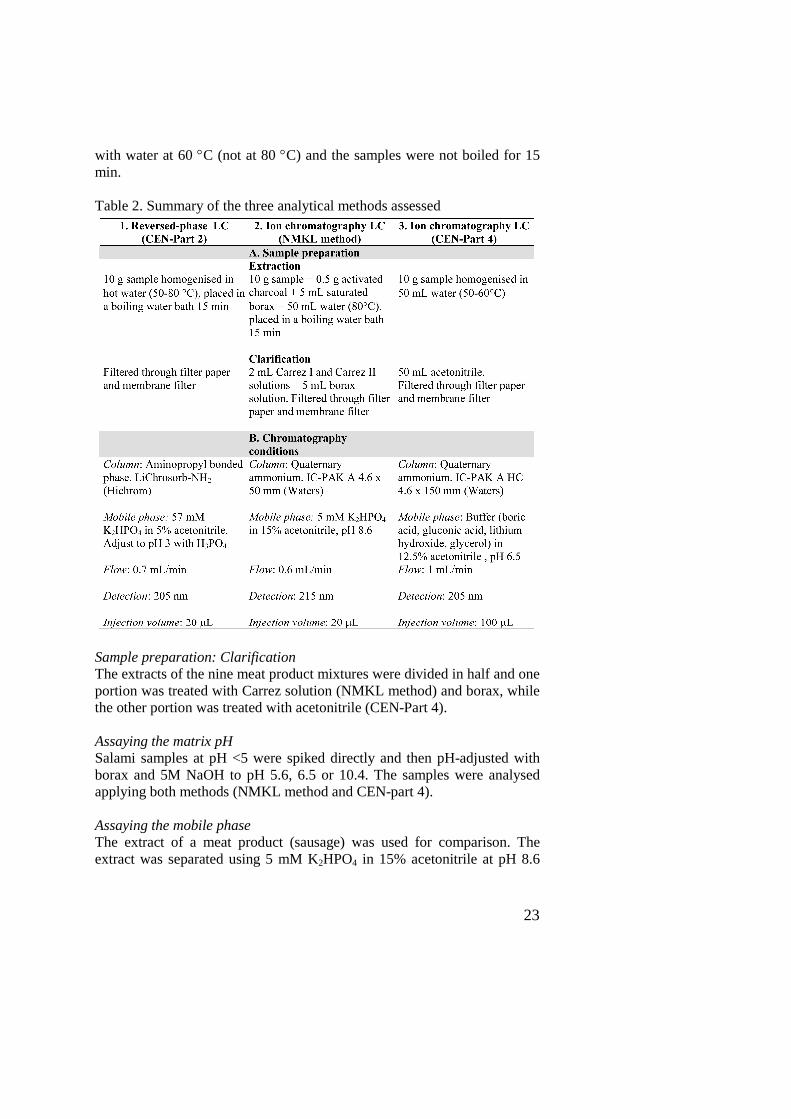
23
with water at 60 C (not at 80 C) and the samples were not boiled for 15 min. Table 2. Summary of the three analytical methods assessed
Sample preparation: Clarification The extracts of the nine meat product mixtures were divided in half and one portion was treated with Carrez solution (NMKL method) and borax, while the other portion was treated with acetonitrile (CEN-Part 4). Assaying the matrix pH Salami samples at pH <5 were spiked directly and then pH-adjusted with borax and 5M NaOH to pH 5.6, 6.5 or 10.4. The samples were analysed applying both methods (NMKL method and CEN-part 4). Assaying the mobile phase The extract of a meat product (sausage) was used for comparison. The extract was separated using 5 mM K2HPO4 in 15% acetonitrile at pH 8.6
24
(NMKL method-mobile phase) and buffer (boric acid, gluconic acid, lithium hydroxide and glycerol) in 12.5% acetonitrile at pH 6.5 (CEN-Part 4-mobile phase). 4.1.2 Single-validation study Method validation was performed to examine the applicability of the method for several foodstuffs (horizontal method). Meat products (sausage, corned beef, ham, chorizo), a vegetable (potato), a dairy product (cheese) and baby food purchased from a local market were homogenised and fortified with standard solutions of nitrate and nitrite. Samples were stored at 4 C. An experimental design based on analysis of variance was used (Wilson and Hunt, 1986). Key performance parameters such as intermediate precision (repeatability and reproducibility), recovery and limit of detections were calculated. The analyses were carried out in five batches over a time period of one month. Each batch consisted of replicated analysis of samples, fortified samples, blanks and standard solutions. Bias was evaluated by measuring a sample before and after adding a known amount of analyte (spiking). Samples were analysed in duplicate on the day of preparation. The precision (repeatability) was estimated for the analyses of duplicate samples of fortified samples immediately after spiking. Linearity was addressed by preparing standard solutions of nitrate and nitrite at five levels (1, 3, 5, 10, 20 mg/L). Linear regression was used to calculate the slope and y-intercept of the calibration curve for each batch of analysis. Identification of systematic error The approach described by Linnig (Linnig et al., 1954; Ellison and Thompson, 2008) for identifying relative (translational) and constant-type (rotational) systematic error was applied. Thus, minced meat samples fortified at eight concentration levels of nitrate and nitrite were analysed. A calibration function was calculated from the regression analysis of calibration data. Comparison of the selected method with another standard method Minced samples fortified with five concentration levels of nitrite (2, 10, 30, 50 and 100 mg/kg) were analysed by CEN-Part 4 and a spectrophotometric method based on the Griess reaction, i.e. diazotisation of sulphanilamide
25
and coupling with N-(1-naphthyl)ethylene diamine dichloride (CEN, prEN 12014-Part 3, 1998). 4.1.3 Collaborative study The selected ion chromatography method was validated in two collaborative studies involving 17 European laboratories. Samples (before and after spiking) of sausage, cabbage and baby food were selected for collaborative study 1 and samples of salami, pâté, lettuce and cheese for collaborative study 2. To ensure stability before spiking, 5M NaOH and borax were added to the test materials to increase the pH to above 7. A standard solution was also provided as a blind sample to the participating laboratories in order to identify possible systematic errors of the calibration curve during the study. The test materials were sent to the participating laboratories with instructions regarding storage of the samples and the day on which the analyses were to be carried out. No changes were made to the official draft procedure (CEN, prEN 12014-Part 4, 1998) except for the use of a disposable filter membrane device (0.45 µm) to ensure protection of the column. The test results from participating laboratories were evaluated for the presence of individual systematic errors using the Cochran and Grubbs test, as described in the Collaborative Study Guidelines (AOAC, 1995). 4.2 Paper II - Levels of nitrate in Swedish lettuce and spinach over the past 10 years 4.2.1 Sampling and sample preparation A total of 377 samples, including fresh lettuce (159), iceberg lettuce (71), fresh spinach (63), frozen spinach (70) and fresh organically produced lettuce (14), were obtained during the Swedish monitoring programme. Soil, outer non-edible and damaged leaves were removed from each unit. The fresh lettuce, iceberg lettuce and fresh spinach samples contained at least ten plants or weighed at least 1 kg (whichever was greater). The frozen spinach samples comprised two retail packages of aggregate samples. All samples were homogenised as a whole and kept frozen at -18 C until analysis.
26
During the course of this study, the Swedish National Food Administration started a survey to compare how production method (organic or conventional) influences product quality. Samples were collected from central and southern Sweden during the summer season (Staffas and Grönholm, 2002). The results of this survey for lettuce were compared with the data obtained in the EU monitoring programme. Nitrate was extracted from the sample with hot water (50-60 ºC) and the test solution treated with acetonitrile to remove suspended material (NMKL No. 165, 2000; CEN European Standard N 12014-part 4, 2005). 4.2.2 Analytical methods The samples of the monitoring programme were analysed according to:
The European standard HPLC method (CEN prEN 12014-2, 1995) was used in the period 1995-1997.
The Nordic and European standard ion chromatography method (NMKL No. 165, 2000; CEN European Standard N 12014-part 4, 2005) was used in the period 1998-2005.
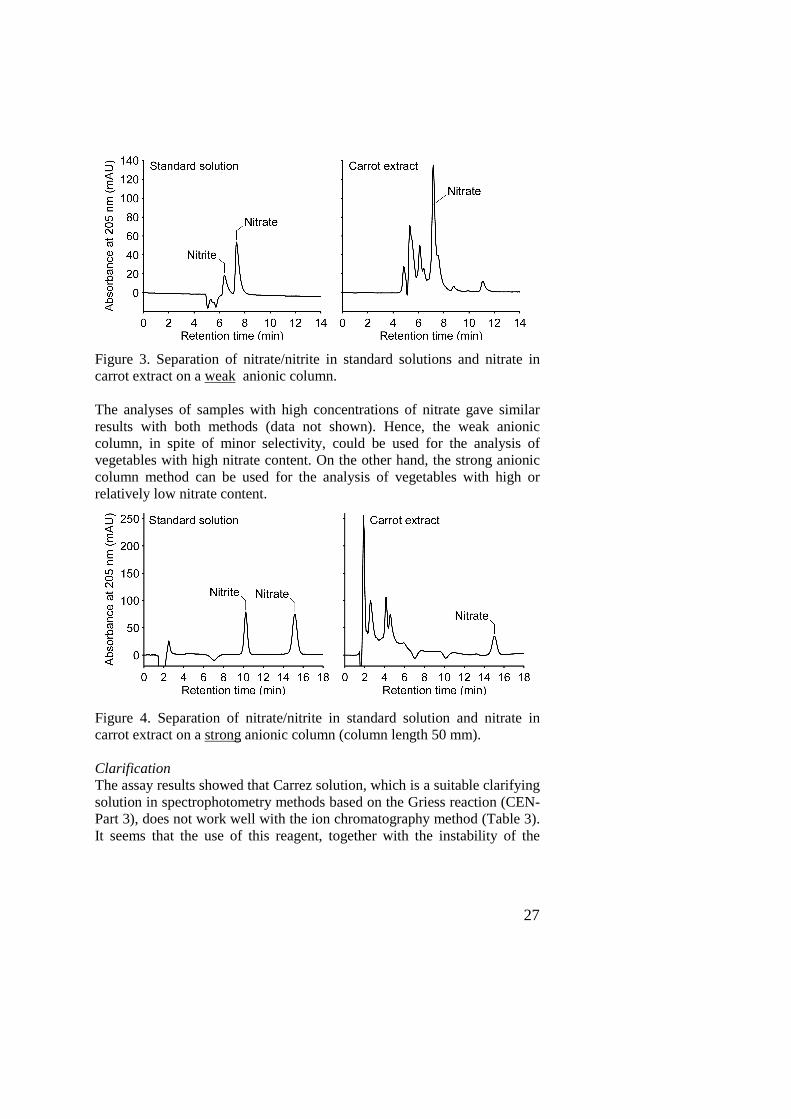
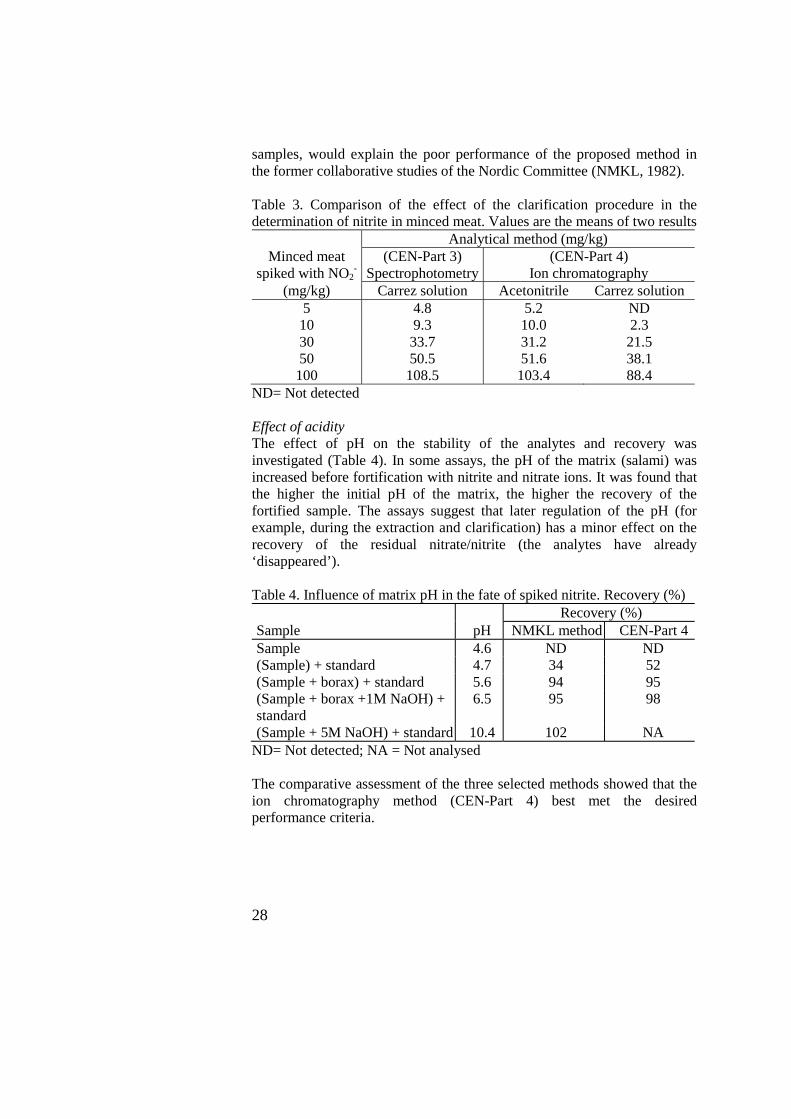
5. Results and discussion 5.1 Paper I - Liquid chromatographic determination of residual nitrite/nitrate in foods: NMKL collaborative study 5.1.1 Selecting the method Selectivity The resolution of the nitrate and nitrite peaks showed poor selectivity for the reversed-phase LC method (CEN-Part 2) (Fig. 3). All trial-and-error experiments with the intention of separating the nitrate and nitrite peaks on standard solutions and the nitrate peaks from other interferences for carrot, onion, cucumber and potato samples were unsuccessful. It was concluded that this method is not suitable for analysis of low concentrations of nitrate (<100 mg/kg). However, in the analyses of lettuce and spinach, which commonly have a high concentration of nitrate (> 2000 mg/kg) these interferences, although present, were negligible. Therefore, the method is still fit-for-purpose. On the other hand, good separation of nitrate and nitrite peaks was obtained when standard solutions and extracts of onion, carrot, cucumber and potato were separated in the strong anionic column (CEN-Part 4) (Fig. 4).
27
Figure 3. Separation of nitrate/nitrite in standard solutions and nitrate in carrot extract on a weak anionic column. The analyses of samples with high concentrations of nitrate gave similar results with both methods (data not shown). Hence, the weak anionic column, in spite of minor selectivity, could be used for the analysis of vegetables with high nitrate content. On the other hand, the strong anionic column method can be used for the analysis of vegetables with high or relatively low nitrate content.
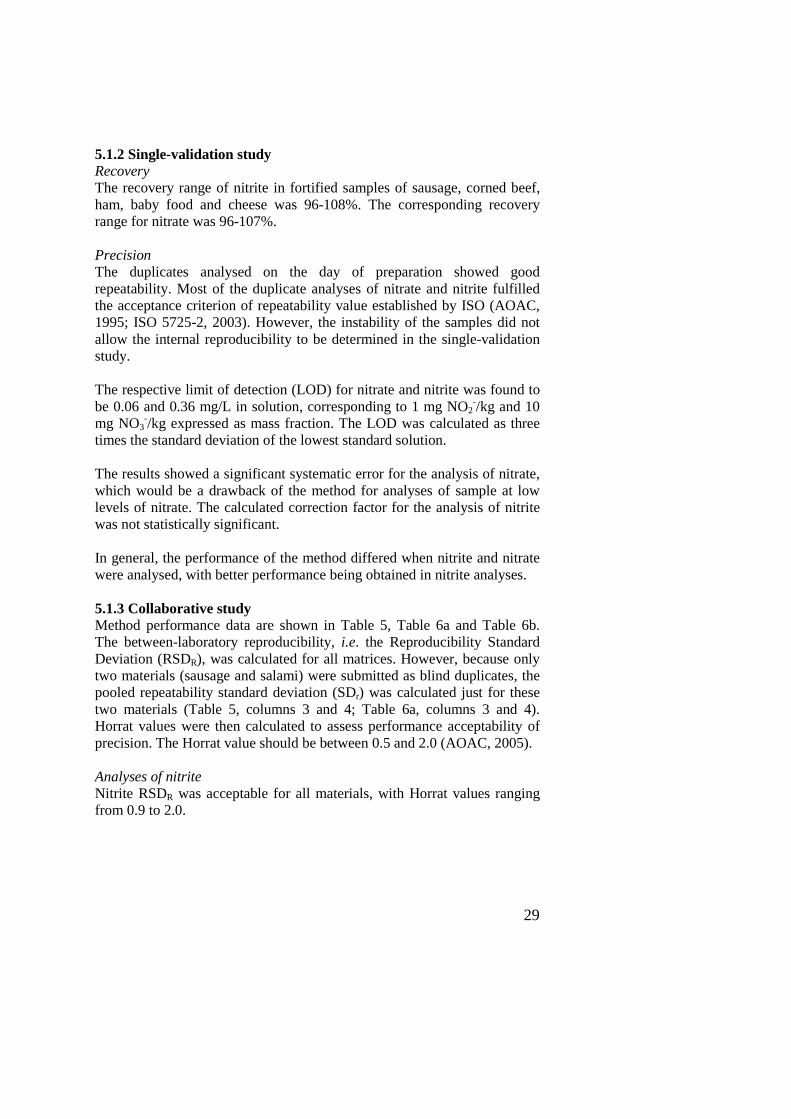
Figure 4. Separation of nitrate/nitrite in standard solution and nitrate in carrot extract on a strong anionic column (column length 50 mm). Clarification The assay results showed that Carrez solution, which is a suitable clarifying solution in spectrophotometry methods based on the Griess reaction (CEN-Part 3), does not work well with the ion chromatography method (Table 3). It seems that the use of this reagent, together with the instability of the
28
samples, would explain the poor performance of the proposed method in the former collaborative studies of the Nordic Committee (NMKL, 1982). Table 3. Comparison of the effect of the clarification procedure in the determination of nitrite in minced meat. Values are the means of two results
Analytical method (mg/kg) Minced meat
spiked with NO2-
(CEN-Part 3) Spectrophotometry
(CEN-Part 4) Ion chromatography
(mg/kg) Carrez solution Acetonitrile Carrez solution 5 4.8 5.2 ND 10 9.3 10.0 2.3 30 33.7 31.2 21.5 50 50.5 51.6 38.1 100 108.5 103.4 88.4
ND= Not detected Effect of acidity The effect of pH on the stability of the analytes and recovery was investigated (Table 4). In some assays, the pH of the matrix (salami) was increased before fortification with nitrite and nitrate ions. It was found that the higher the initial pH of the matrix, the higher the recovery of the fortified sample. The assays suggest that later regulation of the pH (for example, during the extraction and clarification) has a minor effect on the recovery of the residual nitrate/nitrite (the analytes have already ‘disappeared’). Table 4. Influence of matrix pH in the fate of spiked nitrite. Recovery (%) Recovery (%) Sample pH NMKL method CEN-Part 4 Sample 4.6 ND ND (Sample) + standard 4.7 34 52 (Sample + borax) + standard 5.6 94 95 (Sample + borax +1M NaOH) + standard
6.5 95 98
(Sample + 5M NaOH) + standard 10.4 102 NA ND= Not detected; NA = Not analysed The comparative assessment of the three selected methods showed that the ion chromatography method (CEN-Part 4) best met the desired performance criteria.
29
5.1.2 Single-validation study Recovery The recovery range of nitrite in fortified samples of sausage, corned beef, ham, baby food and cheese was 96-108%. The corresponding recovery range for nitrate was 96-107%. Precision The duplicates analysed on the day of preparation showed good repeatability. Most of the duplicate analyses of nitrate and nitrite fulfilled the acceptance criterion of repeatability value established by ISO (AOAC, 1995; ISO 5725-2, 2003). However, the instability of the samples did not allow the internal reproducibility to be determined in the single-validation study. The respective limit of detection (LOD) for nitrate and nitrite was found to be 0.06 and 0.36 mg/L in solution, corresponding to 1 mg NO2
-/kg and 10 mg NO3
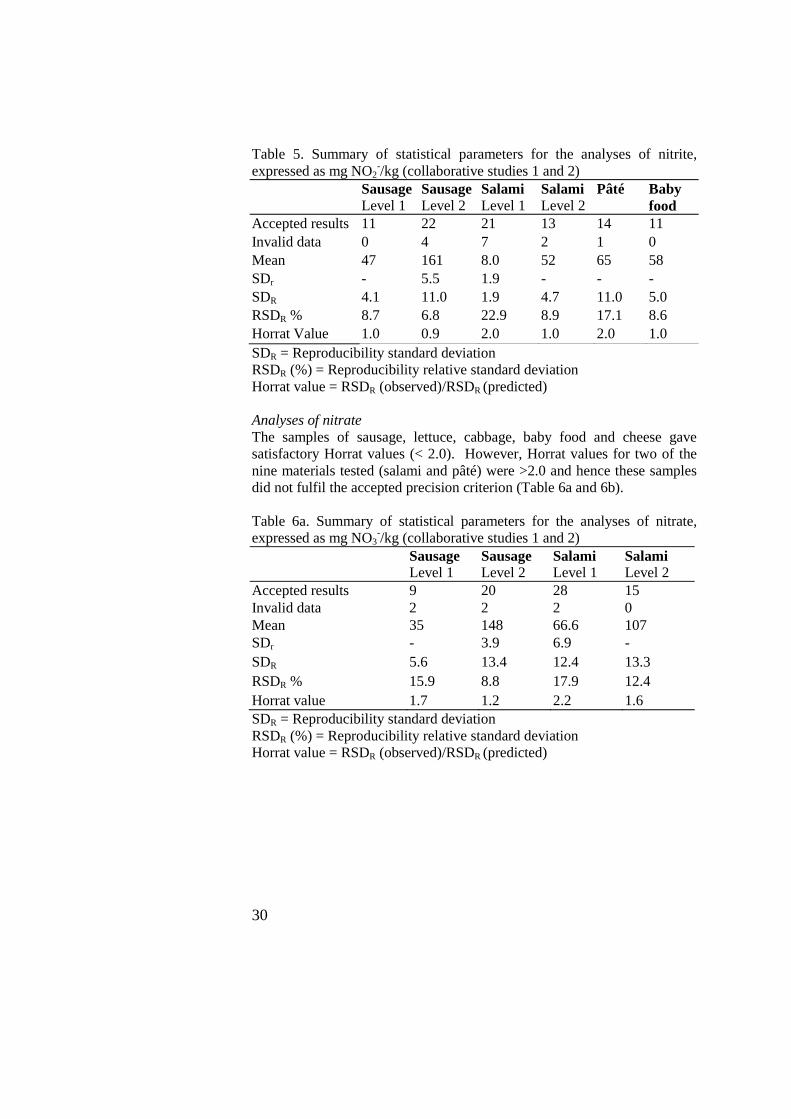
-/kg expressed as mass fraction. The LOD was calculated as three times the standard deviation of the lowest standard solution. The results showed a significant systematic error for the analysis of nitrate, which would be a drawback of the method for analyses of sample at low levels of nitrate. The calculated correction factor for the analysis of nitrite was not statistically significant. In general, the performance of the method differed when nitrite and nitrate were analysed, with better performance being obtained in nitrite analyses. 5.1.3 Collaborative study Method performance data are shown in Table 5, Table 6a and Table 6b. The between-laboratory reproducibility, i.e. the Reproducibility Standard Deviation (RSDR), was calculated for all matrices. However, because only two materials (sausage and salami) were submitted as blind duplicates, the pooled repeatability standard deviation (SDr) was calculated just for these two materials (Table 5, columns 3 and 4; Table 6a, columns 3 and 4). Horrat values were then calculated to assess performance acceptability of precision. The Horrat value should be between 0.5 and 2.0 (AOAC, 2005). Analyses of nitrite Nitrite RSDR was acceptable for all materials, with Horrat values ranging from 0.9 to 2.0.
30
Table 5. Summary of statistical parameters for the analyses of nitrite, expressed as mg NO2
-/kg (collaborative studies 1 and 2) Sausage
Level 1 SausageLevel 2
Salami Level 1
Salami Level 2
Pâté Baby food
Accepted results 11 22 21 13 14 11 Invalid data 0 4 7 2 1 0 Mean 47 161 8.0 52 65 58 SDr - 5.5 1.9 - - - SDR 4.1 11.0 1.9 4.7 11.0 5.0 RSDR % 8.7 6.8 22.9 8.9 17.1 8.6 Horrat Value 1.0 0.9 2.0 1.0 2.0 1.0 SDR = Reproducibility standard deviation RSDR (%) = Reproducibility relative standard deviation Horrat value = RSDR (observed)/RSDR (predicted) Analyses of nitrate The samples of sausage, lettuce, cabbage, baby food and cheese gave satisfactory Horrat values (< 2.0). However, Horrat values for two of the nine materials tested (salami and pâté) were >2.0 and hence these samples did not fulfil the accepted precision criterion (Table 6a and 6b). Table 6a. Summary of statistical parameters for the analyses of nitrate, expressed as mg NO3
-/kg (collaborative studies 1 and 2) Sausage
Level 1 Sausage Level 2
Salami Level 1
Salami Level 2
Accepted results 9 20 28 15 Invalid data 2 2 2 0 Mean 35 148 66.6 107 SDr - 3.9 6.9 - SDR 5.6 13.4 12.4 13.3 RSDR % 15.9 8.8 17.9 12.4 Horrat value 1.7 1.2 2.2 1.6 SDR = Reproducibility standard deviation RSDR (%) = Reproducibility relative standard deviation Horrat value = RSDR (observed)/RSDR (predicted)
31
Table 6b. Summary of statistical parameters for the analyses of nitrate, expressed as mg NO3
-/kg (collaborative studies 1 and 2) Pâté Lettuce Cabbage Baby food Cheese Accepted results 15 12 11 10 13 Invalid data 0 2 0 1 2 Mean 115 2233 301 68 133 SDr - - - - - SDR 21.1 125 21.3 8.2 19.5 RSDR % 18.4 5.6 7.1 12.2 14.7 Horrat value 2.4 1.1 1.0 1.4 1.9 The collaborative studies demonstrated that the CEN Part 4 ion chromatography method can be applied for analysing foodstuffs other than meat and meat products, e.g. baby food, vegetables and cheese. However the proposal presented by the Swedish Working Group to the CEN to approve this method as European horizontal method was not accepted. It was supported by France (French Working Group, 1999) but opposed by Germany (German Working Group, 1999), which argued that the collaborative study did not include sufficient matrices and concentration levels. However, a final compromise was reached and an informative annex stating that the method is also applicable for the determination of nitrate in matrices other than meat products was added (CEN European Standard N 12014-part 4, 2005). 5.2 Paper II - Levels of nitrate in Swedish lettuce and spinach over the past 10 years 5.2.1 Performance of the analytical method The reliability of the method (CEN-part 4) was demonstrated across the internal and external validation studies (see Paper I). In addition, following the recommended internal quality control given by the European Commission, our laboratory participated satisfactorily in proficiency testing schemes. Corrections based on recovery percentages were not performed because the recovery factor was not statistically significant. The uncertainty calculated in the collaborative study was used to determine compliance with the European regulation. 5.2.2 Monitoring results All median values for the samples were well below the maximum levels established by the European Commission (Table 7).
32
Table 7. Median values of nitrate (mg NO3/kg) in leafy vegetables and incidence of nitrate concentrations above maximum level (ML) in Swedish monitoring programme 1995-2005 Type No. of
samples Median (mg/kg)
Range (mg/kg)
No. above ML
Fresh lettuce 159 2684 58-5406 4 Iceberg lettuce 71 931 94-2017 0 Fresh spinach 63 1747 47-5975 12 Frozen spinach 70 551 213-1862 0 Fresh lettuce (organic farming)*
14 826 442-2038 0
Iceberg lettuce (integrated production)*
39 672 139-1187 0
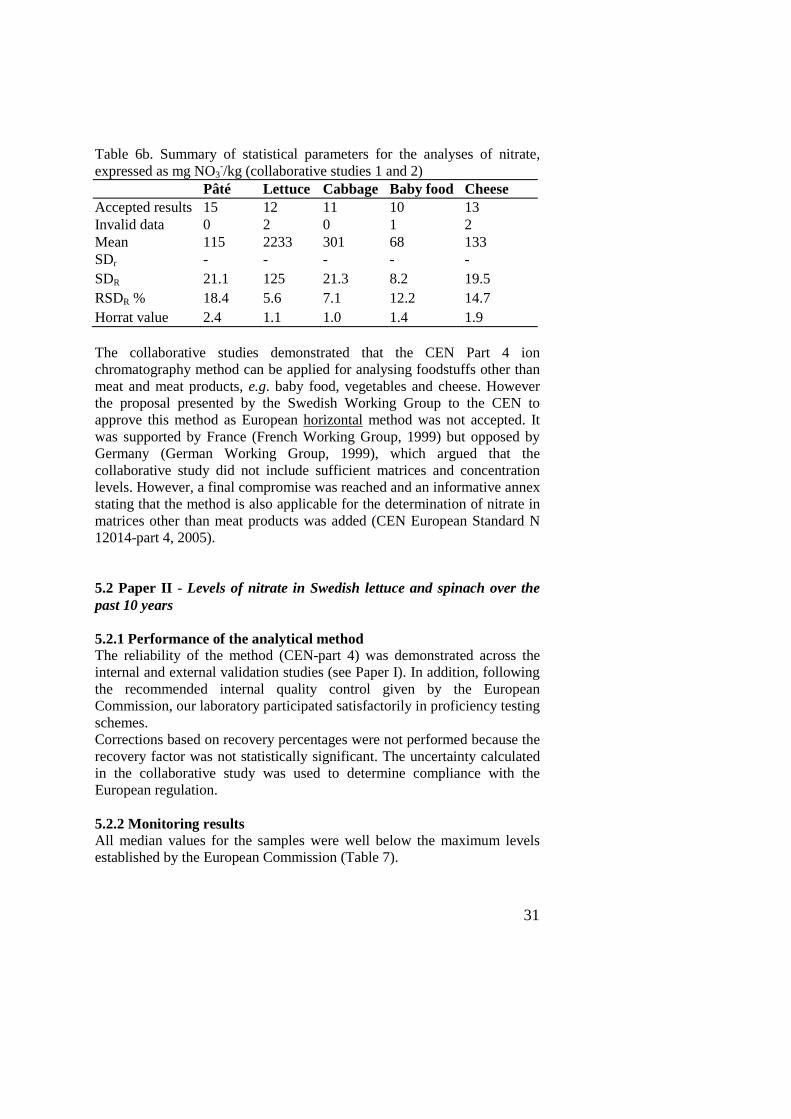
* Samples not included in the monitoring programme The fresh lettuce was cultivated under cover during winter and summer and the iceberg lettuce on uncovered fields in the summer. Some differences in levels were observed during the 10-year observation period, but no clear-cut time trend emerged (Table 7, Figs. 5 and 6).
Fre s h le ttuc e grown unde r c ove r
1995 -96 -97 -98 -99 2000 -01 -02 -03 -04 -05 O rganic
0
1000
2000
3000
4000
5000
6000
Winter
Summer
Maximum level
Sampling year
mg
NO
3/k
g
Figure 5. Nitrate content of fresh Swedish-grown lettuce during the period 1995-2005. Four samples exceeded the maximum limit, one in summer 1996, one in summer 1998 and two in winter 2000.
33
1995 -96 -97/99 2000 -01 -02 -03 -04 -05 O rganic0
5 00
1 000
1 500
2 000
2 500
Ma xim um le vel
Ic e be rg le ttuce g rown in the o pe n air
S am plin g ye a r
mg
NO
3/k
g)
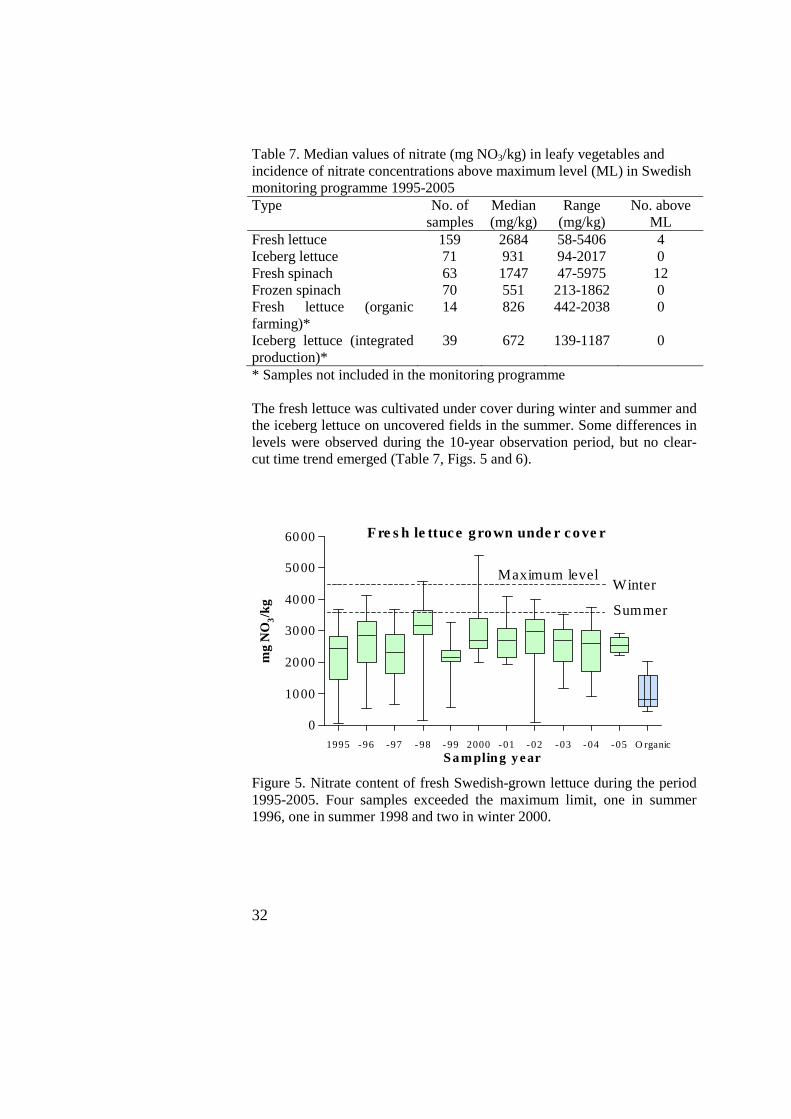
Figure 6. Nitrate content of Swedish-grown iceberg lettuce during the period 1995-2005. All values were below the regulatory limits, including one value of 1996 according to the established rules for assessment of compliance. At the beginning of the monitoring programme for spinach (1996), 12 samples exceeded the threshold of 2500 mg NO3/kg imposed by European regulations (Table 7, Fig. 7). Although these samples were destined for processing and not for direct consumption in the market, the producer was informed for corrective action.
1996-97 1998-99 2000-01 2002-03 2004-050
1000
2000
3000
4000
5000
6000
SummerWinter
Fre sh spinach grown in the ope n air
Maximum level
Sampling year
mg
NO
3/k
g
Figure 7. Nitrate content in fresh spinach grown in the open air during the period 1996-2005. Twelve samples exceeded the ML in 1996-97 and one
34
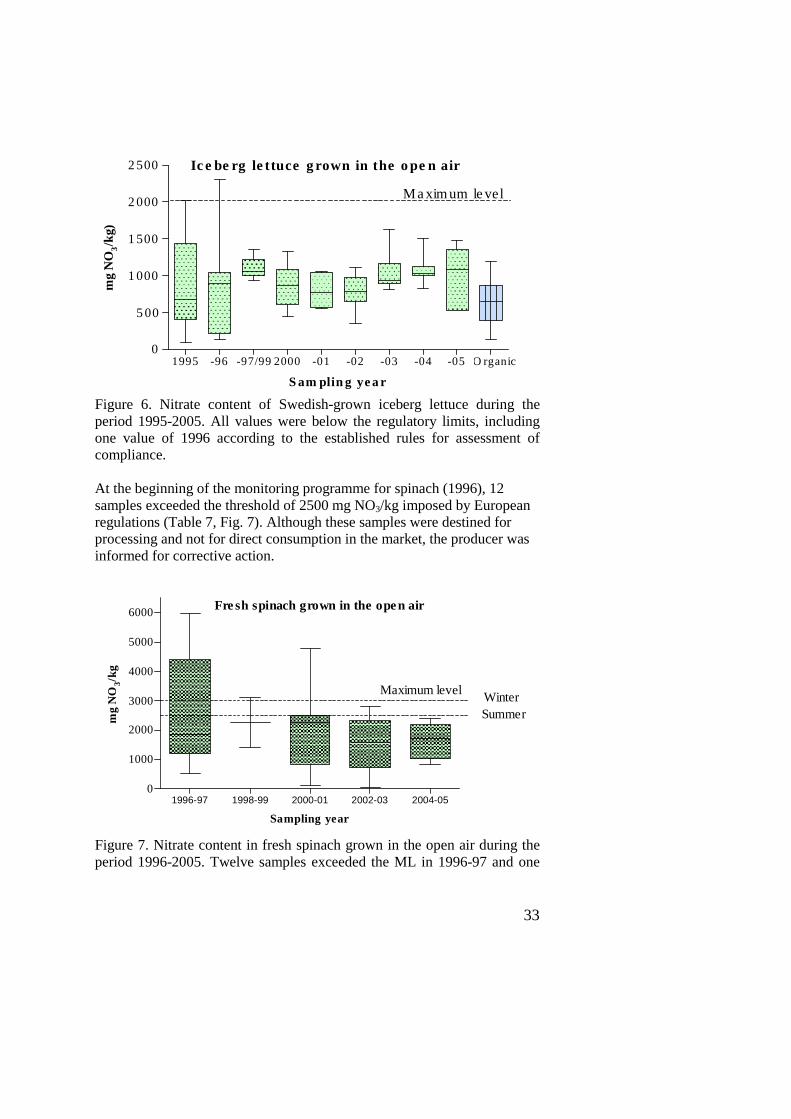
sample in 2000-01. During 1998-99 only two samples of fresh spinach were analysed (ML summer = 2500 mg/kg). The results for 70 frozen spinach samples, with a median concentration of 551 mg NO3/kg (Table 7, Fig. 8), confirmed that as expected, the nitrate content in processed vegetables was much less than in fresh vegetables, due to the loss of nitrate during the blanching process (Maynard et al., 1976).
1996-97 1998-99 2000-01 2002-03 2004-050
500
1000
1500
2000
2500 Froze n spinach
Maximum level
Sampling ye ar
mg
NO
3/k
g
Figure 8. Nitrate content in frozen spinach during the period 1996-2005. All samples were below the maximum level (ML = 2000 mg/kg). Comparisons of the nitrate content in organically and conventionally grown lettuce showed that organic growing significantly decreased the nitrate concentration in this type of leafy vegetable. However, the results for iceberg lettuce did not reveal any significant difference between conventional and organic growing, showing that the impact of agricultural production method on the nitrate content of crops is restricted by genetic factors. Further research is needed in this field. In theory, the adverse climate conditions in Sweden, with low light intensity, may promote high levels of nitrates in plants (Cantliffe, 1972). However, nitrate concentrations were below the maximum permissible level in 96% of the samples analysed during the 10 years of the Swedish monitoring programme.
35
The available data did not show a clear-cut time trend in nitrate levels in lettuce and spinach during the 10-year monitoring period. Good agriculture practice, which in Sweden is implemented as Integrated Production (IP) (Green Production, 2005) or organic farming, controlled by KRAV (http:/www.krav.se), could be the reason why Swedish farmers are able to produce lettuce and spinach fulfilling the European regulations. The Swedish IP criteria are revised every two years and contain instructions that specifically address how to reduce nitrate levels in lettuce. It is to be noted that the Swedish results are in accordance with the results for lettuce reported from 20 Member States and Norway covering the period from 2000 to 2007. Thus, the EFSA report shows that the 95th percentile of the results of nitrate in lettuce varieties as influenced by season, production system and region reported by the Member States were below the established maximum levels. However, regarding the levels of nitrate in spinach, the same report shows that the production of this vegetable in Europe has difficulties to fulfil the current regulation (EFSA, 2008). Protection from nitrates As mentioned above (see section 2) there are changing and controversial opinions about the hazard posed by nitrate to human health. Therefore, it is difficult to draw definitive conclusions on this issue. However, regarding the other question of how much harm excess nitrate does to the environment, there is less disagreement and controversy in the face of mounting evidence of eutrophication of waters. It is generally accepted that all forms of farming activity lose nitrate and that application of fertiliser, which has been continuously increasing for decades, is a factor in nitrate pollution. It is estimated that on average, 33% of nitrogen fertiliser applied to arable land brings no benefit, since it is not absorbed by the crops and stored in the soil as organic residues. More than half of this surplus leaches out into surrounding waters (Naturvårdsverket, 2008). Since our dependence on fertiliser for the production of food is basically unavoidable, optimising the ratio of food produced to nitrate released into the environment through the judicious and efficient use of fertiliser (GAP), instead of just aiming to maximise yield, could substantially reduce the amounts of nitrate entering the environment. A number of actions are being taken in many European countries to reduce nitrate pollution. For example, the Swedish Parliament has adopted 16 environmental quality objectives to be achieved by 2020. One of these 16 objectives is Zero eutrophication, which establishes that ‘nutrients levels in
36
soil and water must not be such that they adversely affect human health, the conditions for biological diversity or the possibility of varied use of land and water’. This objective presupposes a state of the environment relatively unaffected by eutrophication (Swedish Environmental Objectives Council, 2008). Although new surveys show that the total anthropogenic load of nutrients – including nutrients leaching from agricultural land in Sweden and certain other parts of Europe – is falling (Johansson, 2008), new actions and commitments on an international level are necessary to continue the downward trend. However, it must be recognised that there is no single solution for the multi-faceted problem of eutrophication. The political, economic and social aspects involved make resolution of this problem difficult.
37
6. Conclusions This study formed part of efforts to establish an official method to determine nitrate and nitrite in foodstuffs. The method selected and validated is actually a standard method of the Nordic Committee of Food Analysis (NMKL) and the European Committee of Normalisation (CEN). A second phase of the study provided data to the European Commission on Swedish-produced lettuce and spinach over a 10-year period (1995-2005). These data, together with the results from other member states, are being used by the Commission to establish the European maximum level for nitrate in lettuce and spinach. The findings can be summarised as follows:
Analytical standardisation The CEN-Part 4 ion chromatography method (CEN European
Standard N 12014-part 4, 2005) was shown to be suitable for the determination of nitrate and/or nitrate in various kinds of matrices since the precision of the method fulfils the criteria recommended by AOAC Guidelines (AOAC, 2005) and European Committee for Standardisation (CEN/TC 275/WG 7 N 103, 1997).
The range of percentage recovery of nitrite in meat products, vegetables, cheese and baby food using the CEN-Part 4 method was 96-108%. The corresponding range for nitrate recovery was 96-107%.
The detection limits for nitrite and nitrate ions with the method were 1 mg/kg and 10 mg/kg, respectively. The method proved highly selective for both ions. However, better performance was obtained for nitrite determination.
Systematic errors of both constant and relative-type were found in the analysis of nitrite and nitrate in minced meat. The magnitude of the constant systematic error is a drawback for application of this method in the analysis of meat products with low concentrations of nitrate. Further refinement of the method is necessary.
The Carrez solution, which is a good and common clarification solution in several methods, showed a disturbing effect with the ion chromatography column.
The CEN-Part 4 method was successfully applied to quantify nitrate content in lettuce and spinach in the European monitoring programme.
38
Monitoring and control of nitrate in leafy vegetables The EU monitoring programme is an effective tool for mapping
nitrate levels in lettuce and spinach. The advances made to harmonise sampling, sampling preparation and methods of analysis during the organisation of the monitoring programme are allowing for better and more reliable comparison of the data provided by EU member states.
Analytical data from the Swedish monitoring programme show a persistently low concentration of nitrate in lettuce and spinach cultivated in Sweden.
Lower nitrate levels were found in organically grown fresh lettuce than in conventional, but not in iceberg lettuce. This suggests that the effect of growing system on nitrogen utilisation could be limited by genetic factors.
The specific instruction regarding nitrate reduction in lettuce production introduced by Swedish producer organisations may be an important factor in explaining the relatively low content of nitrate in lettuce and spinach cultivated in Sweden.
The maximum levels for nitrate in vegetables can be an effective way of assessing progress in applying measures for rational use of fertiliser (GAP). These maximum levels should be maintained, rather than removed as some member states propose.
The ten years of Swedish data show that the current maximum limits are reasonable and there is no technical reason to raise the European maximum level for nitrate in lettuce established in 1997.
39
7. Future research The current interest in investigating the beneficial role of nitrate and nitrite in the human body and the analysis of certain foodstuffs makes it necessary to develop methods for the determination of nitrate and nitrite in complex matrices at low concentration ranges. Since several European standard methods are not suitable for laboratories with meagre resources because they require expensive instruments and/or chemicals, efforts should be made to develop economical and environmentally friendly methods that are also accessible to laboratories in developing countries. Such work would support their attempts to replace old methods using toxic chemicals, which are still widely applied. In the literature on the occurrence of nitrites in foods on the Swedish market, there is a lack of data on the levels of nitrite in cured meat products and baby food. However, a survey of 595 Swedish children (4-year-olds) regarding consumption of meat product based on information given by parents and the maximum amount permitted that may be added, has shown that exposure to nitrite levels higher than the Acceptable Daily Intake (ADI) can occur (Rikskrubbet, 2005). Consequently, a study providing reliable data on the potential risk of excess nitrite exposure in Swedish infants is recommended.
40
8. References Addiscott, J. (2006). Is it nitrate that threatens life or the scare about
nitrate? J Sci food Agric 86:2005-2009. AOAC International. (1995). Guidelines for collaborative study procedures
to validate characteristics of a method of analysis. J. Assoc. Off. Anal. Chem. 78: 143A-160A.
AOAC International. (2005). Guidelines for collaborative study procedures to validate characteristics of a method of analysis. J. Assoc. Off. Anal. Chem. 78: 143A-160A.
Benjamin, N. (2000. Nitrates in human diet – good or bad? Ann. Zootech 49:207-216.
Cantliffe, D. 1972). Nitrate accumulation in vegetables crops as affected by photoperiod and light duration. Journal of the American Society for Horticultural Science 97(3):414-418.
CEN (European Committee for Standardisation). (1991). CEN/TC 275 N 16. Food Analysis-Horizontal methods. Resolutions-First meeting 28 February 1991.
CEN (European Committee for Standardisation). (1993). CEN/TC 275 WG 7- Food Analysis-Horizontal methods-Nitrate, Nitrite. Resolutions, First meeting 26 March 1993.
CEN (European Committee for Standardisation). (1998) European Prestandard pr ENV 12014-Part 2. HPLC/IC method for the determination of nitrate content of vegetables and vegetables products. Brussels.
CEN (European Committee for Standardisation). (1998). European Prestandard pr ENV 12014-Part 3. Spectrometric determination of nitrate and nitrite content of meat products after enzymatic reduction of nitrate to nitrite. Brussels.
CEN (European Committee for Standardisation). (2005). European Standard EN 12014-Part 4. Ion-exchange chromatographic (IC) method for the determination of nitrate and nitrite content of meat products. Brussels.
CEN (European Committee for Standardisation). (1998). European Prestandard pr ENV 12014-Part 4. IC method for the determination of nitrate and nitrite content of meat products. Brussels.
CEN/TC 275/WG 7 N 103. (1997) Report of the 6th meeting of the CEN/TC 275/WG 7 N 103, Annex B.
Directive 2006/52/EC. (2006). Amending Directive 95/2/EC on food additives other than colours and sweeteners and Directive 94/35/EC on sweeteners for use in foodstuffs. OJ L 204/10.
41
Directive 91/676/EEC. (1991). Concerning the protection of waters against pollution caused by nitrates from agricultural sources. OJ L 375.
Directive 95/2/EC (1995). Directive on food additives other than colours and sweeteners. OJ No L61.
Directive 97/194/EC. (1997). Setting maximum levels for certain contaminants in foodstuffs. Official Journal of the European Communities No. L 31/49.
Dudley, N. (1990). Nitrates: The Threat to Food and Water. Green Print, London.
Eggers, N. & Cattle, D. (1986). High-performance liquid chromatographic method for the determination of nitrate and nitrite in cured meat. Journal of Chromatography 35:490-494.
Ellison, S. & Thompson, M. (2008). Standard additions: myth and reality. Analyst 133:992-997.
European Commission. (2009). Food Safety: from the Farm to the Fork. Food additives. http://ec.europa.eu/food/fs/sfp/flav_index_en.html Accessed 3 Feb 2009.
European Commission Regulation 1881/06. (2006). Setting maximum levels for certain contaminants in foodstuffs. Official Journal of the European Communities L 364/15.
European Commission Regulation 1882/06. (2006). Laying down methods of sampling and analysis for the official control of the levels of nitrates in certain foodstuffs. Official Journal of the European Communities L 364/25.
European Commission. Doc VI/1695/96. (1996). Contaminants in food (nitrates in certain vegetables) – Sampling and analytical methods. Draft regulation on Nitrate. Meeting of the Committee of experts.
European Commission. VI/4784/96-EN. (1996). Survey on nitrate in vegetables. Sampling and analytical methods. Brussels, 15 March 1996
EFSA (European Food Safety Authority). (2008). Nitrate in vegetables, scientific opinion of the Panel on Contaminants in the Food Chain. EFSA Journal 689:1-79.
European Parliament. (1984). Written question No. 337/83 Official journal of the European Communities No. C 320/1.
Fernlöf, G. & Darnerud, P.O. (1996). N-nitroso compounds and precursors in food-level, intake and health effect data and evaluation of risk. SLV-Rapport 15. Available from: http:/www.slv.se
French Working Group. (1999). Letter from French Working Group to Swedish Working Group 16/09/1999.
Frouin, A. (1976). Nitrates and nitrite: reinterpretation of analytical data by means of bound nitrous oxide. Proc. 2nd int. Symp. Nitrite Meat Produc., Zeist, 1976. Pudoc, Wageningen
42
German Working Group. (1999). Letter from German Working Group to Swedish Working Group 04/03/1999.
Gladwin, M.T., et al. (2005). The emerging biology of the nitrate anion. Natural Chemical Biology 1(6):308-314.
Green Production. (2005). Available from: http://www.gronproduktion.se. Accessed 2006 February 9.
GreenFacts. (2009). Facts on Health and the Environment. http://www.greenfacts.org/glossary/abc/contaminant.htm . Accessed 25 February 2009.
ISO 5725-2. (2003). Accuracy (trueness and precision) of measurement methods and results – Part 2: basic method for the determination of repeatability and reproducibility of a standard measurement method. Geneva. Switzerland.
Johansson, H. (2008). Eutrophication-Current projects. SLU. Environmental monitoring and assessment. http://www.slu.se/environ/eutrophication. Accessed March 18 2009.
Krav-Framtidens mat. (2008). Available from: http:/www.krav.se. Accessed 2008 Feb 18.
L’hirondel, J.L. (2001). Nitrate and Man: Toxic, Harmless or Beneficial? Wallingford, Oxfordshire, OX108DE, UK.
Leaft, C., Wishnok, S. & Tannembaum, S. (1989). L-Arginine is a precursor for nitrate biosynthesis in humans. Biochemical and Biophysical Research Communications 163(2):1032-1037.
Linnig, F., Mandel, J. & Peterson, J.M. (1954). Analytical Chemistry 26:1102-1115.
Lundberg, J. Weitzberg, E. & Gladwin, T. (2008). The nitrate-nitrite-nitric oxide pathway in physiology and therapeutics. Nature Reviews Drug Disc 7:156-167.
Lundberg, J., et al. (2005). The emerging biology of the nitrite anion. Nature Chemical Biology 1(6):308-314.
Lundberg, J., Weitzberg, E., Cole, J. & Benjamin, N. (2004). Nitrate, bacteria and human health. Nature Review Microbiology 2, 593-602.
Maynard, D., Barker, A., Minotti, P. & Peck, N. (1976). Nitrate accumulation in vegetables. In: Advances in Agronomy, American Society of Agronomy. Vol. 28. Academic Press, New York.
Moncada, S. & Higgs, A. (1993). The L-Arginine-Nitric Oxide pathway. The New England Journal of Medicine 329:2002-2012.
National Research Council. (1978). Nitrates: An Environmental Assessment. National Academy of Science, Washington, D.C.
Naturvardsverket. (2008). Ingen övergödning. Rapport 5840. Available from: http://www.naturvardsverket.se/sv/Nedre-meny/Webbokhandeln/ISBN/5800/978-91-620-5840-1/. Accessed 2009 June 17
43
NMKL (Nordic Committee of Food Analysis). (1982). Nitrat och nitrit: Vätskekromatografisk bestämning I köttvaror. Beslutning 8.2.3 från NMKL.
NMKL (Nordic Committee of Food Analysis). (2000). Nitrite and nitrate in foodstuffs by ion chromatography. NMKL No. 165. Available from: http:/www.nmkl.org.
NZFSA (2009). New Zealand Food Safety Authority. Naturally occurring food contaminants. Available from: http://www.nzfsa.govt.nz/consumers/chemicals-nutrients-additives-and-toxins/index.htm#P48_4445. Accessed 3 Feb 2009.
Petersson, J. (2008). Nitrate, Nitrite and Nitric Oxide in gastric Mucosal Defence. Dissertation for the degree of Doctor in Philosophy (Faculty of Medicine). Acta Universitatis Upsaliensis Uppsala-Sweden.
Regulation No 882/2004. (2004). Regulation of the European Parliament and the Council on official controls performed to ensure the verification of compliance with feed and food law, animal health and animal welfare rules. Official Journal of the European Communities L 191/1.
Rikskrubbet. (2005). Intag av benzoate (E210-E213) och nitrit (E249-E250) bland fyraåringar. SLV-Intern rapport
SCF (Scientific Committee on Food). (1990). Opinion on nitrate and nitrite, expressed on 19 October 1990. Ed. by European Commission, Brussels.
Scheindlin, S. (2006). When she says yes, but he needs NO: Some reflections on Nitric Oxide. Interventions 6 (1): 8-13
Slorach, S. (1981). Changes in the Swedish regulations on the use of nitrate and nitrite as food additives. Vår Föda suppl 33(2):185-195.
SNK (Svenska National Kommitten). (1993). Letter from SNK to referent, 8/09/1993.
Staffas, A. & Grönhholm, R. (2002). Sallat & Vitaminer. Vår Föda 1:28-29. Available from: http:/www.slv.se
Swedish Environmental Objectives Council, (2008). Sweden’s Environmental Objectives – no time to lose. Available from: http://www.naturvardsverket.se/sv/Nedre-meny/Webbokhandeln/ISBN/1200/978-91-620-1266-3. Accessed 22 June 2009.
Swedish EPA. (2009). Nutrients-Eutrophication. Available from: http://www.naturvardsverket.se/en/In-English/Menu/State-of-the-environment/Emission-data/Water-pollutants/Nutrients--eutrophication/. Accessed 2009 Feb 23.
Ward, M. H., et al. (2005). Workgroup Report: Drinking-Water nitrate and Health – Recent Findings and Research Needs. Environmental Health Perspectives 113(11):1607-1614.
44
Wilson, A.L., & Hunt, D.T.H. (1986) The Chemical Analysis of Water. The Royal Society of Chemistry. Burlington House, London W1V 0BN.
World Health Organization. (2008). Guidelines for Drinking-water Quality. http://www.who.int/water_sanitation_health/dwq/gdwq0506.pdf. Accessed 4 Feb 2009.
World Health Organization. (2009). Water-related diseases. http://www.who.int/water_sanitation_health/diseases/methaemoglob/en/(accessed. Accessed 12 June 2009.
45
9. Acknowledgments I wish to thank my supervisors, Professor Per Åman and Associate Professor Roger Andersson, for understanding, guidance and pleasant discussions. My sincere thanks also go to: My supervisor Associate Professor Ulla Edberg, Head of Chemistry Division 2, for her leading, trust and always open door support. Associate Professor Georg Fuchs, my co-supervisor, who introduced me to the Swedish academic world. My colleagues in Chemistry Division 2 at the Swedish National Food Administration for making this a nice place to work (tack för att det alltid finns något gott till kaffet). My friends Humberto, Gladys and Johnny José for making me feel that I do not need other friends. Last but in fact first! To the memory of my grandmother (abuelita), who in the Amazon rain forest taught me to read, despite the fact she couldn’t.