NITI-RMI India Report · 2 | india leaps ahead: transformative mobility solutions for all authors &...
134
INDIA LEAPS AHEAD: TRANSFORMATIVE MOBILITY SOLUTIONS FOR ALL R O C K Y M O U N T A I N I N S T I T U T E MAY 2017
Transcript of NITI-RMI India Report · 2 | india leaps ahead: transformative mobility solutions for all authors &...

INDIA LEAPS AHEAD: TRANSFORMATIVE MOBILITY SOLUTIONS FOR ALL
RO
C
KY MOUNTAIN
INSTIT UTE
MAY 2017

2 | INDIA LEAPS AHEAD: TRANSFORMATIVE MOBILITY SOLUTIONS FOR ALL
AUTHORS & ACKNOWLEDGMENTS
SUGGESTED CITATIONNITI Aayog and Rocky Mountain Institute. India Leaps Ahead: Transformative mobility solutions for all.
2017. https://www.rmi.org/insights/reports/transformative_mobility_solutions_india
ACKNOWLEDGMENTSThe authors would like to thank the following individuals for their contribution.
Adnan Ansari, Albright Stonebridge Group
Manuel Esquivel, Independent Consultant
Jules Kortenhorst, Rocky Mountain Institute
Amory Lovins, Rocky Mountain Institute
Robert McIntosh, Rocky Mountain Institute
Jesse Morris, Rocky Mountain Institute
Greg Rucks, Rocky Mountain Institute
Anand Shah, Albright Stonebridge Group
Samhita Shiledar, Independent Consultant
Vindhya Tripathi, BTC Productions
Jonathan Walker, Rocky Mountain Institute
Jeruld Weiland, Rocky Mountain Institute
Supporters: The authors would also like to thank ClimateWorks Foundation, the Grantham Foundation for the
Protection of the Environment, George Krumme, and Wiancko Charitable Foundation for their generous
support that made this report possible.
AUTHORSNITI Aayog:Amit Bhardwaj
Shikha Juyal
Sarbojit Pal
Dr. Manoj Singh
Shashvat Singh
Rocky Mountain Institute:Marshall Abramczyk
Aman Chitkara
Ryan Laemel
James Newcomb
Clay Stranger
* Authors listed alphabetically
Art Director: Romy Purshouse
Designer: Michelle Fox
Designer: Laine Nickl
Editorial Director: Cindie Baker
Editor: David Labrador
Marketing Manager: Todd Zeranski
CONTACTSFor more information, please contact:
Shikha Juyal, [email protected]
Clay Stranger, [email protected]
The views and opinions expressed in this document are those of the authors and do not necessarily reflect the
positions of the institutions or governments. The specific solutions listed in chapter five were generated by a group of
75 stakeholders during the NITI Aayog and RMI Transformative Mobility Solutions Charrette in New Delhi in February
2017. While every effort has been made to verify the data and information contained in this report, any mistakes or
omissions are attributed solely to the authors and not to the organizations they represent.
Most recent update: 25 May 2017

3 | INDIA LEAPS AHEAD: TRANSFORMATIVE MOBILITY SOLUTIONS FOR ALL
With rapidly evolving technologies and business models, there is need to adopt new and
fundamentally different pathways to provide clean, cost-effective, and efficient mobility services
that are safe, create new jobs, reduce dependence on oil imports, and achieve more efficient
land-use in cities with the least environmental footprints and impacts on human health. A rapidly
developing India is at the cusp of making such a transition to new mobility solutions.
To help draw up strategies to enable making this transition with the collective wisdom of a
multitude of stakeholders, RMI and NITI Aayog took on the ambitious assignment of organizing a first of its kind charrette
dialogue process in February 2017. This document summarizes the key actionable solutions merging out of the charrette
process that can enable India to make this transition.
As is evident from the strategies put forward in this outcome document, India is uniquely positioned to take advantage
of developments due to a set of advantageous conditions and capabilities. The main elements for India’s mobility
transformation are system integration, shared infrastructure development, and scaled manufacturing. There is need to
capture economically-viable opportunities at a national scale and demonstrate emerging opportunities at a state level to
speed the deployment and integration of solutions.
The ideas put forward in this document should provide basis for engaging discussions and dialogues, and for helping
India collectively march towards a sustainable mobility pathway.
—Dr. Arvind Panagariya, Vice Chairman, NITI Aayog
MESSAGE FROM DR. ARVIND PANAGARIYA

4 | INDIA LEAPS AHEAD: TRANSFORMATIVE MOBILITY SOLUTIONS FOR ALL
MESSAGE FROM DR. AMORY LOVINS
General, later U.S. President, Eisenhower advised us to make tough problems soluble not by
chopping them into smaller pieces but by expanding their boundaries to encompass what the
solution requires. Thus it’s easier to solve the mobility and electricity problems together than
separately. India, by enlarging and integrating its vision of personal mobility, can leverage its many
strengths—a diverse set of mode options, strong IT capabilities, ambitious renewable energy
targets. Bold adoption can thereby deliver access, save money, clean the air, reduce congestion,
save lives, improve urban and rural life, increase equity, and displace oil. It can protect the climate,
strengthen national security, speed the shift from coal to renewable electricity, move from energy deficit towards long-
term surplus, and empower the whole economy. To those ends, leaders of India’s government, private sector, and civil
society came together in 2017 in an innovative workshop, drawing on best practices from around the world. This report
of their recommendations for envisioning and working towards a shared, electric, and connected mobility future launches
an exciting journey to transform the mobility of all Indian citizens. My colleagues and I are honoured by this opportunity
and confident India’s achievements will lead and amaze the world.
—Dr. Amory Lovins, Cofounder and Chief Scientist, RMI RO
CKY MOUNTA
IN
INSTIT UTE
5 | INDIA LEAPS AHEAD: TRANSFORMATIVE MOBILITY SOLUTIONS FOR ALL
TABLE OF CONTENTS
Executive summary ........................................................................................................................7
01: Introduction ...............................................................................................................................16
02: Summary of charrette process .......................................................................................20
03: Vision and opportunity....................................................................................................... 25
04: Three-phased approach to change .............................................................................. 35
05: Actionable solutions ............................................................................................................45
06: Impact of the transformation ........................................................................................... 96
07: Conclusion: A change model to scale solutions rapidly ...................................... 108
Glossary ......................................................................................................................................... 118
Appendix ........................................................................................................................................ 121
Endnotes .......................................................................................................................................132

EXECUTIVE SUMMARYES

7 | INDIA LEAPS AHEAD: TRANSFORMATIVE MOBILITY SOLUTIONS FOR ALL
A whole-system approach to mobility transformationES: EXECUTIVE SUMMARY
Elem
ents
of I
ndia
’s m
obili
ty tr
ansf
orm
atio
n
System integration
Assembling the pieces1. Mobility as a Service
2. Interoperable transport data
Shared infrastructure development
Scaled manufacturing
Building the ecosystem
3. Mobility-oriented development
4. Vehicle-grid integration
Creating the supply
5. Product manufacturing
6. Electric vehicle deployment
Shared
Electric
Connected
OPPORTUNITY AREAS NEW MOBILITY PARADIGM

8 | INDIA LEAPS AHEAD: TRANSFORMATIVE MOBILITY SOLUTIONS FOR ALL
India can save 64% of anticipated passenger road-based, mobility-related
energy demand and 37% of carbon emissions in 2030 by pursuing a shared,
electric, and connected mobility future. This would result in an annual
reduction of 156 Mtoe in diesel and petrol consumption for that year, saving
Rs 3.9 lakh crore or USD ~60 billion (at USD 52/bbl of crude). Cumulative
savings between 2017–2030 are 876 Mtoe for petrol and diesel, worth
Rs 22 lakh crore or USD ~330 billion, and 1 gigatonne for carbon-dioxide
emissions. This reduction in energy consumption results from a synergistic
impact of improvements in:
• Systems integration: Enabling wide-scale adoption of mobility
solutions through ubiquitous availability and sharing of interoperable
transport data (ITD).
• Scaled manufacturing: Facilitating market creation through policies
and mechanisms that enable manufacturing of electric vehicles (EVs)
and necessary components in successive segments based on their
market readiness.
• Shared infrastructure development: Better urban design, where a larger
fraction of mobility demand is met by nonmotorized transit and public
transit, and access to vehicle-charging infrastructure enables higher
penetration of EVs.
In addition to reducing energy demand, this transformation yields other
benefits, including lower congestion as shared, public, and nonmotorized
modes of transportation serve an increasing share of mobility demand.
With a larger share of the fleet running on electricity, it leads to lower
local emissions, improving public health. This has significant implications
for India’s electricity sector and economy, supporting India’s ambitious
renewable energy goals while saving money, providing jobs, and
strengthening Indian industry.
ES: EXECUTIVE SUMMARY
Making India’s passenger mobility shared, electric, and connected can cut its energy demand by 64% and carbon emissions by 37%
FIGURES ES-1 - ES-2:
MODELED ENERGY
REQUIREMENT FOR
PASSENGER MOBILITY
(LEFT) AND RESULTANT
CO2 EMISSIONS (RIGHT)
FOR “BUSINESS-AS-
USUAL” (BAU) AND
“TRANSFORMATIVE”
SCENARIOS, 2015–2030
* Data presented on this slide are based on RMI’s modeling of a medium-growth scenario. This scenario is based on historical macroeconomic data, including GDP/capita from the World Bank and a 2015–2030 GDP compound annual growth rate of 6.7%, which aligns with NITI Aayog’s IESS 2047 modeling effort.
BAU TRANSFORMATIVE
250
200
150
100
50
02015 2017 2022 2024 2030
ENERGY CONSUMPTION FROM MOTORIZED PASSENGER TRANSPORT
Ener
gy re
quire
men
t (M
toe)
600500400300200100
02015 2018 2021 2024 2027 2030
CO2 EMISSIONS FROM MOTORIZED
Mill
ion
tonn
es C
O2 p
er y
ear
BAU TRANSFORMATIVE
-64%
-37%

9 | INDIA LEAPS AHEAD: TRANSFORMATIVE MOBILITY SOLUTIONS FOR ALL
Rapidly evolving technologies and business models are transforming the mobility sector. New and
fundamentally different pathways are emerging to provide clean, cost-effective mobility services that
create new jobs, reduce dependence on oil imports, and achieve more efficient land use in cities.
INDIA HAS A LEAPFROG OPPORTUNITY:
• Existing capabilities—including India’s dynamic public- and private-sector leadership, entrepreneurial
culture, ability to build infrastructure right the first time, and a unique confluence of IT and
manufacturing skills—could enable it to lead the world in advanced mobility solutions.
• India’s current mobility system reflects many of the underlying properties of the emerging mobility
paradigm. India could leapfrog the conventional mobility model and achieve a shared, electric, and
connected mobility future by capitalizing on these existing conditions and building on foundational
government programmes and policies.
• Recent policy announcements, private-sector activity, and headline news indicate significant
convergence among key stakeholders.
• A transformed mobility future will require participation and collaboration across diverse
stakeholder groups.
INDIA CAN AVOID FALLING INTO THE TRAPS OF THE TRADITIONAL MOBILITY PARADIGM:
• Despite a relatively small but growing per-capita automobile fleet, traffic congestion and pollution are
presenting serious issues.
• India imported 80.9% of its oil in 2015–16, up from 77.6% in 2013–14.1 But total cost of crude imports
was USD 81.5 billion lower in 2015–16 (USD 73.9 billion) than in 2014–15 (USD 155.4 billion) due to
historically low global oil prices.
• Traffic accidents cause around 1.5 lakh deaths annually on Indian roads.2
ES: EXECUTIVE SUMMARY
Supportive conditions and existing capabilities position India to lead the world in advanced mobility solutions
OBJECTIVES OF THIS REPORT
In February 2017, NITI Aayog and Rocky Mountain Institute (RMI) convened a two-day charrette titled “Transformative Mobility Solutions for India.” The charrette brought together 75 leaders from government, the private sector, and civil society to collaboratively identify actionable and specific solutions for India’s future mobility system.
This report draws on the ideas generated at the charrette and serves three primary purposes:
• Establishing a vision for the future of India’s mobility system
• Describing a prioritized set of near-term solutions designed to capture this vision
• Proposing a change model to support rapid scaling and deployment of these solutions and many others already underway and to come

10 | INDIA LEAPS AHEAD: TRANSFORMATIVE MOBILITY SOLUTIONS FOR ALL
ES: EXECUTIVE SUMMARY
A set of actionable and specific solutions can accelerate India’s leadership in advanced mobility (1/2)
Governance
SOLUTION CATEGORY ACTIONABLE OPPORTUNITIES*
• Establish a unified metropolitan planning authority that harnesses India’s IT and mobile application skills to deliver better modal integration through more cohesive planning.
• Create metropolitan planning councils within city governments to combine transport, public-transit, and land-use agencies and accelerate mobility-oriented development (MOD) solutions through integrated planning.
• Develop networked city-level innovation and incubation centres within city and/or state governments throughout India to identify, test, evaluate, and scale MOD solutions.
Policies and incentives
• Institute feebates to complement CAFE regulations and provide continuous, technology-agnostic incentives for vehicle efficiency improvements. Feebates are rebates for efficient new vehicles paid for by fees on inefficient ones.
• Introduce zero-emission vehicle (ZEV) credits at the state or national level to complement feebates with another supply-side, market-based incentive programme.
• Structure policies that encourage Mobility as a Service (MaaS) to disincentivize privately owned internal-combustion engine (ICE) vehicles, electrify more passenger kilometres, and provide more accessible, higher-quality mobility services at lower cost.
• Roll out enhanced fiscal incentives to make EVs more profitable for automakers and more affordable for consumers as domestic production scales and costs come down.
• Design nonfiscal incentives , such as easier registration and preferred electricity tariffs, to support fiscal incentives and further speed EV adoption.
* Numbers in parentheses correspond to the numbered list on page 46

11 | INDIA LEAPS AHEAD: TRANSFORMATIVE MOBILITY SOLUTIONS FOR ALL
ES: EXECUTIVE SUMMARY
A set of actionable and specific solutions can accelerate India’s leadership in advanced mobility (2/2)
Infrastructure
SOLUTION CATEGORY ACTIONABLE OPPORTUNITIES*
• Design regulations that enable electric vehicle supply equipment (EVSE) deployment and vehicle-grid integration (VGI) , empowering a Forum of Regulators (FOR) to create regulatory frameworks that make EV charging ubiquitous, affordable, and a grid asset.
• Develop integrated transport hubs around the country to enhance mode integration and first- and last-mile connectivity through transit-oriented zoning, better urban design, and streamlined data solutions.
Business models
• Establish a manufacturer consortium for batteries, common components, and platforms to develop battery cell technologies and packs and to procure common components for Indian original equipment manufacturers (OEMs).
• Create standardized, smart, swappable batteries for 2- and 3-wheelers to electrify these important vehicle segments as quickly as possible through a pay-per-use business model and an integrated payment, tracking, and smart-charging system.
Data access• Establish a central data sharing institution incubated by NITI Aayog to create national data standards, formulate rules for
data sharing, and build capacity within the government and private sector to handle data use, monitoring, and issue resolution. This institution could also create and maintain a central database for relevant data.
* Numbers in parentheses correspond to the numbered list on page 46

12 | INDIA LEAPS AHEAD: TRANSFORMATIVE MOBILITY SOLUTIONS FOR ALL
The specific solutions identified during the charrette were designed for near-term implementation; the report authors have taken additional steps to frame and
sequence these solutions. While the solutions in Phase 1 are not exhaustive, the opportunities contained in this report are intended to serve as a resource for
India’s transition towards a shared, electric, and connected mobility system. This phased approach emphasizes the need for flexibility as market conditions
evolve and experimentation and learning inform future policy and market design.
ES: EXECUTIVE SUMMARY
A three-phased approach to enable durable change
PHASE 12017–2019
“NOTCHING THE ARROW”
PHASE 22020–2023
“DRAWING THE BOW”
PHASE 32024–2032
“LETTING THE ARROW FLY”
Overview and
Objectives
• Capture opportunities that are already economic and capable of rapid scaling, while cultivating actions that are nearly economic.
• Improve and scale actions introduced in Phase 1. “Nearly economic” actions from Phase 1 become ready for deployment.
• Simultaneously, public- and private-sector actions continue to enhance the economics and feasibility of future actions.
• All segments are market-ready for electrification and deployment is underway nationally.
• Feedback and lessons from previous phases inform and enable comprehensive adoption and scaling of mobility solutions at the national level.
Key Actions • Prioritize institutional capacity building and aggregating ITD, as they enable subsequent solutions. A series of structural reforms and policy interventions follow to support the adoption of mobility services, better urban planning, and open data sharing.
• Manufacturers and consumers receive appropriate incentives to seed market confidence.
• As markets grow, infrastructure and production capabilities develop in tandem, paving the way for more innovative business models and policies.
• System-wide mobility solutions are deployed in multiple states.
• Immaterial incentives are phasing out as costs are coming down.
• Indian industry is meeting a majority of domestic demand and beginning to serve global markets.
• Regulatory and policy mechanisms are fully mature and enabling competitive markets.

13 | INDIA LEAPS AHEAD: TRANSFORMATIVE MOBILITY SOLUTIONS FOR ALL
• Establishing a learning platform could support
resource sharing, build strategic alignment, and
harmonize priorities of the Indian government
and private sector.
• Composed of representatives from central
government, state governments, private sector,
academia, and NGOs, a learning platform could
serve as a connection hub between state-led
and regional efforts and central government
planning and policies.
• A learning platform could provide states and
cities with tools to move from demonstration
projects to scale, serve as a central resource
library for new mobility solutions, and function
as a platform for ongoing discussion and debate
among diverse stakeholders.
• The learning platform further supports and
reinforces a phased approach by creating
institutional memory and acting as a knowledge
and resource repository.
ES: EXECUTIVE SUMMARY
A national learning platform can enable coordination and collaboration among diverse mobility-sector stakeholders
FIGURE ES-3: NATIONAL LEARNING PLATFORM FOR
INDIA’S MOBILITY SYSTEM DESIGNED TO SCALE
SOLUTIONS RAPIDLY THROUGH EXPERIMENTATION,
LEARNING, KNOWLEDGE EXCHANGE, COOPERATION,
AND CAPACITY BUILDING
CIVIL SOCIETY
Representation from stakeholders of the mobility system
Information flows in and outof the learning platform
CENTRALGOVERNMENT
NATIONALLEARNINGPLATFORM
Too
ls a
nd
Re
sou
rce
s
Cre
ate
s S
ha
red
Drive
s Stra
tegic
Alig
nment
Coordinates Policy
Formulation
Ca
pacity
Bu
ilds Te
chnical
Establishes Network
of Pilot Projects
STATE/REGIONALGOVERNMENTPRIVATE SECTOR
The learning platformhas several key functions

14 | INDIA LEAPS AHEAD: TRANSFORMATIVE MOBILITY SOLUTIONS FOR ALL
ES: EXECUTIVE SUMMARY
Market transformation and lighthouse regions accelerate scaling
INDIA REACHES A TIPPING POINTin the deployment of shared,
electric, and connected mobility
MARKET TRANSFORMATIONby targeting successive sets of economic market segments
STATE/REGIONAL LEVEL EXPERIMENTATION AND INTEGRATION to assemble whole systems solutionsin lighthouse regions
CurrentlyEconomic
NearlyEconomic
EventuallyEconomic
Scaled Manufacturing
State/RegionalGovernments
SystemIntegration
SharedInfrastructureDevelopemt
NATIONAL LEARNING PLATFORM integrates interdependent and reinforcing aspects of the change model to support India's mobility system transformation
Experimentation and Integration
Feedback loops deliver information and learningback to the market and state/regionalgovernments for integration
Change Model v.5bThe learning platform supports mobility transformation as economic market segments are captured, and insights from state/regional experimentation and integration are applied.
Inputs from ongoing market segment transformation inform the process, creating the foundation for national change
Insights from state/regional experimentation continuously support system-wide integration
FIGURE ES-4: TWO-TRACK
CHANGE MODEL DESIGNED TO
TRANSFORM INDIA’S MOBILITY
SYSTEM THROUGH DEPLOYMENT
OF MARKET-READY SOLUTIONS
NATIONALLY AND INTEGRATION
OF THESE SOLUTIONS IN
LIGHTHOUSE REGIONS

INTRODUCTION01

16 | INDIA LEAPS AHEAD: TRANSFORMATIVE MOBILITY SOLUTIONS FOR ALL
Rapidly evolving technologies and business models for delivering mobility
services have dramatic potential to transform the global transportation
sector in the years ahead. New and fundamentally different pathways are
emerging to provide clean, cost-effective mobility services, creating new
jobs, reducing oil import dependence, achieving more efficient land use
in cities, and improving public health. India is uniquely positioned to take
advantage of these developments due to a set of advantageous conditions
and capabilities.
In contrast to supportive forces, India faces challenges perpetuated by the
trend towards privately owned vehicles, reinforcing the importance of an
alternative mobility future. Every day, nearly 50,000 new motor vehicles
(2-, 3-, and 4-wheelers) register in India, with a 10% increase in vehicle
registration annually for the past decade. Despite a very low number of
vehicles per capita, traffic congestion and pollution are already serious
issues in India. According to a 2016 World Health Organization study, India
is home to 10 of the world’s 20 most polluted cities. In 2015, India imported
more than 80% of its oil at a cost of Rs 4.2 lakh crore.3 Traffic accidents
cause around 1.5 lakh deaths per year on Indian roads.
In February 2017, NITI Aayog and Rocky Mountain Institute jointly hosted a
two-day charrette with diverse and senior participation from government
and industry to explore India’s potential to lead the world in shared, electric,
and connected mobility solutions. During the event, participants identified
actionable and specific solutions that could catalyse India’s mobility
transformation. The outcome of the charrette and additional research and
engagement confirmed that India is poised to leapfrog private-vehicle
ownership and traditional development pathways and to move faster than
any other nation towards a new model. Yet concerted action at the central,
state, and local government levels, enhanced coordination among central-
government ministries, and collaboration with the private sector will be
required for India to realize the full potential of a mobility transformation.
The convergence of low-cost technologies, smart design and integration,
innovative business models, and supportive policies has established certain
market segments as economically viable today. Capturing those segments
immediately can lay a supportive foundation for the nation to build on.
Assembling the components of the mobility transformation in a few leading
geographies (i.e., “lighthouse regions”) can support rapid learning about
system integration to prepare India for scaling and deploying integrative
solutions. While a shared, electric, and connected mobility system is the
pinnacle and end goal of India, additional xEV technologies (i.e., EVs,
including hybrids, or HEVs, and plug-in hybrid electric vehicles, or PHEVs)
can play important roles in cleaning the air, reducing congestion, saving
lives, improving access, and strengthening India’s economy today.
01: INTRODUCTION
India is poised to lead the world in advanced passenger mobility

17 | INDIA LEAPS AHEAD: TRANSFORMATIVE MOBILITY SOLUTIONS FOR ALL
This report serves three primary purposes:
1. Establishes a vision for the future of India’s mobility system.
2. Describes a prioritized set of near-term solutions designed to
capture this vision.
3. Defines a change model to support rapid scaling and
deployment of solutions
The vision described for India’s mobility future and the solutions and actions
detailed in this report were developed by a group of 75 people over a
two-day period at the charrette coconvened in New Delhi by NITI Aayog
and Rocky Mountain Institute on 27–28 February 2017. Participants in the
charrette represented over 25 private companies, 15 government agencies,
and 10 civil society and academic institutions. The objective of the event
was to generate actionable and specific solutions that could be pursued
immediately to catalyse a mobility transformation and create lasting value.
Following the charrette, RMI and NITI Aayog engaged in a consultative
process to formulate a change model designed to accelerate deployment
01: INTRODUCTION
About this report
and scale at a pace matched to India’s ambition. This report sequences
and stages solutions across a three-phase, fifteen-year time horizon from
2017 to 2032. Phase 1 (2017–2019) focuses on near-term actions that
build political will and market confidence, capturing economically-viable
opportunities and establishing an initial set of “lighthouse regions”. Phase
2 (2020–2024) captures additional market segments as they become
economic, and assembles and integrates solutions in an expanded set of
geographies through a learning platform. Drawing on lessons from the
regional lighthouse cases, Phase 3 (2025–2032) integrates all economically-
viable solutions to reach scale at a national level.
Many important developments are already underway in India, and this
report attempts to contribute new insights to support existing programmes
and create additional momentum towards a new mobility future. This
report is not intended to capture all possible actions or solutions, neither
is it meant to be a comparative study of various vehicle technologies that
could further India’s mobility transformation. Instead, it is a compilation of
ideas and solutions developed by a diverse set of stakeholders, framed
in a strategically-sequenced format. The authors invite your comment
and engagement to further refine, improve, and implement the ideas
contained within.

18 | INDIA LEAPS AHEAD: TRANSFORMATIVE MOBILITY SOLUTIONS FOR ALL
ABOUT NITI AAYOG The National Institution for Transforming India, also called NITI Aayog, was
formed via a resolution of the Union Cabinet on 1 January 2015. NITI Aayog
is the premier policy ‘Think Tank’ of the Government of India, providing
both directional and policy inputs. While designing strategic and long-
term policies and programmes for the Government of India, NITI Aayog
also provides relevant technical advice to the Centre and States. The
Government of India, in keeping with its reform agenda, constituted the
NITI Aayog to replace the Planning Commission instituted in 1950. This was
done in order to better serve the needs and aspirations of the people of
India. An important evolutionary change from the past, NITI Aayog acts as
the quintessential platform of the Government of India to bring States to act
together in national interest, and thereby fosters Cooperative Federalism.
01: INTRODUCTION
About the authors
RO
C
KY MOUNTAIN
INSTIT UTE
ABOUT ROCKY MOUNTAIN INSTITUTE Rocky Mountain Institute is an independent, apolitical, nonprofit think-and-
do tank that transforms global energy use to create a clean, prosperous,
and secure future. For more than three decades, RMI’s work in the
transportation sector has described and helped to concretely advance
solutions that are both visionary and pragmatic, ranging from advanced
vehicle designs to new mobility-services concepts. RMI’s staff of scientists,
engineers, and business leaders has helped governments, utilities, large
corporations, innovative startups, and communities understand and benefit
from the new energy economy with the imaginative application of rigorous
technical and economic analysis. In recent years, RMI has developed
electric vehicle deployment plans to reach 100% EV penetration for the U.S.
and China. Cofounded by Amory Lovins in 1982, RMI has been a leader in
energy efficiency and renewable energy for 35 years.

ABOUT THE CHARRETTE02

20 | INDIA LEAPS AHEAD: TRANSFORMATIVE MOBILITY SOLUTIONS FOR ALL
WHAT IS A CHARRETTE?A charrette is an intensive, interactive, and transdisciplinary working
session in which all stakeholders in a system collaborate to conceive,
design, and develop solutions. A charrette often starts by building a shared
understanding among key stakeholders about the biggest opportunities
and obstacles. Then participants explore collaborative solutions to
overcome barriers and spark action.
LOCATION AND TIMING: New Delhi, 27–28 February 2017
HIGH-LEVEL OBJECTIVES:
• Understand the role and impact of emerging and disruptive trends in
mobility solutions in the Indian context.
• Establish a working understanding of the new mobility paradigm and the
“size of the prize” in India.
• Identify and initiate specific actions that build on existing efforts and
priorities, and can position India to be a world leader in advanced
passenger mobility.
• Identify champions to carry forward specific implementation work and
support the development of pilot cities or regions committed to pursuing
end-to-end mobility transformation.
PARTICIPANTS:
• The charrette was attended by senior government officials from five
ministries and C-level business leaders.
• Five Ministers keynoted the inaugural dinner:
» Shri M. Venkaiah Naidu, Hon’ble Minister of Urban Development,
Information and Broadcasting, Housing and Urban Poverty
Alleviation
» Shri Nitin Gadkari, Hon’ble Minister of Shipping, Road Transport and
Highways
» Shri Anant Gangaram Geete, Hon’ble Minister of Heavy Industries
and Public Enterprises
» Shri Suresh Prabhakar Prabhu, Hon’ble Minister of Railways
» Dr. Arvind Panagariya, Vice Chairman, NITI Aayog
OUTCOMES:The charrette applied a systems approach to the mobility sector and
produced a set of specific and actionable solutions designed to accelerate
progress towards a mobility transformation. These solutions are detailed in
the following pages of this report.
02: ABOUT THE CHARRETTE
NITI Aayog and RMI convened a high-level workshop to test India’s ability to leapfrog to a new mobility paradigm

21 | INDIA LEAPS AHEAD: TRANSFORMATIVE MOBILITY SOLUTIONS FOR ALL
India can achieve a mobility leapfrog by pursuing and integrating opportunities across six core areas: mobility services to support the shift from ownership
to usership; electric mobility to provide a clean fleet; EV-grid integration to provide a clean fleet and make the grid more flexible, helping deploy modern
renewables; product manufacturing to develop domestic supply; and both mobility-oriented development and interoperable transport data to enable seamless
integration and enhanced efficiency. An integrated approach can unlock additional value and drive faster, more balanced scaling.
The six themes described above were represented by working groups at the charrette, at which a group of 75 individuals from the government, private sector,
and civil society identified near-term actionable solutions that collectively function as a catalyst capable of accelerating India’s mobility leapfrog.
02: ABOUT THE CHARRETTE
Participants were divided into six interrelated working groups in an attempt to represent the full mobility system
SHAREDINFRASTRUCTUREDEVELOPMENT
SYSTEMINTEGRATION
SCALEDMANUFACTURING
Mobility-OrientedDevelopment
ElectricMobility
MobilityServices
InteroperableTransport Data
EV-GridIntegration
Products and Technology
FIGURE 1: MOBILITY ECOSYSTEM DIAGRAM
SHOWING SIX INTERACTIVE COMPONENTS
OF CHANGE—MOBILITY SERVICES,
INTEROPERABLE TRANSPORT DATA,
MOBILITY-ORIENTED DEVELOPMENT, EV-GRID
INTEGRATION, PRODUCTS AND TECHNOLOGY,
AND ELECTRIC MOBILITY—GROUPED BY
THREE OVERARCHING OPPORTUNITY
AREAS: SYSTEM INTEGRATION, SHARED
INFRASTRUCTURE DEVELOPMENT, AND
SCALED MANUFACTURING

22 | INDIA LEAPS AHEAD: TRANSFORMATIVE MOBILITY SOLUTIONS FOR ALL
02: ABOUT THE CHARRETTE
Charrette participants identified a diverse set of solutions
SOLUTION CATEGORY ACTIONABLE OPPORTUNITIES*
• Interoperable transport data: unified metropolitan planning authority
• Metropolitan planning councils
• Networked city-level innovation and incubation centres
Governance
SYSTEM OBJECTIVE
Stakeholder coordination
• Regulations that enable EVSE deployment and VGI
• Integrated transport hubsInfrastructure Shared
infrastructure
• Feebates
• ZEV credits
• Policies that encourage MaaS
Policies and incentives
Accelerated adoption
• Manufacturer consortium for batteries, common components, and platforms
• Standardized, swappable batteries for 2- and 3-wheelersBusiness models Cost reduction
• Interoperable transport data: central data sharing institutionData accessSystem
integration
• Enhanced fiscal incentives
• Nonfiscal incentives
* Numbers in parentheses correspond to the numbered list on page 46
Each solution listed on this page is detailed in chapter 5

23 | INDIA LEAPS AHEAD: TRANSFORMATIVE MOBILITY SOLUTIONS FOR ALL
02: ABOUT THE CHARRETTE
Charrette participants
National Highways Authority of India
Indian Highway Management Company Ltd.
International Road Federation
Ministry of Electronics and IT
Ministry of Housing and Urban Poverty Alleviation
Ministry of New and Renewable Energy
Ministry of Railways
Ministry of Shipping, Road Transport and Highways
Ministry of Urban Development
Mumbai Railway Vikas Corporation
National Payments Corporation
Power System Operation Corporation
Private SectorAmpere
Ather
Bangalore Autonomous Car Project
Bangalore Electricity Supply Company
BMW
Carl Pope Associates
Differentiated Energy
Ford Motor Company
Goldstone Infratech Ltd.
HERO Electric
Jangid Motors
KPIT
Lithium
Mahindra
Maini Group
Maruti
Nippon Audiotronix Ltd.
Nissan
FIGURE 2: BREAKDOWN OF PARTICIPANTS BY
SECTOR; SECTOR SIZES BASED ON NUMBER
OF ORGANIZATIONS
Ola
Osmosis
Prasanna Purple
RideCell
Ridlr
Shell
Shuttl
Society of Indian Automobile Manufacturers
SoftBank
Tata Motors
Toyota
Uber
Volvo
Workxpace
Civil Society, Academia, and NGOsBrookings India
Centre for Science and Environment
ClimateWorks Foundation
Indian Institute of Technology-Delhi
Indian Institute of Technology-Madras
Indian School of Business
India Smart Grid Forum
Insight Strategy Group
Institute for Transportation and Development Policy
Institute of Urban Transport
IRU Smart Move High Level Group
Lawrence Berkeley National Laboratory
Mahindra Electric
Shakti Sustainable Energy Foundation
The Energy and Resources Institute (TERI)
World Resources Institute (WRI)
GovernmentBangalore Metropolitan Transport Corporation
Bhubaneswar Smart City
Bangalore Electric Supply Company (BESCOM)
Central Electricity Regulatory Commission
Centre for Development and Advanced Computing
Delhi Development Authority
Delhi Integrated Multi-Modal Transit System Ltd.
Department of Heavy Industry and Public Enterprise
Department of Science and Technology
CIVIL SOCIETY
PRIVATE SECTOR
GOVERNMENT

VISION AND OPPORTUNITY03

25 | INDIA LEAPS AHEAD: TRANSFORMATIVE MOBILITY SOLUTIONS FOR ALL
India is at a critical juncture in its infrastructure, energy, and mobility
development. While many Western countries have developed a system
dominated by private-vehicle ownership and sprawl, India is home to a
number of supporting conditions that make it possible to take a different
path. The second most populous country in the world, India’s potential to
create a shared, electric, and connected mobility system could produce
major benefits domestically and globally.
A shared system based on usership, not ownership, can increase utilisation
and decrease congestion, providing better service and greater access at
lower cost. Smarter planning and data ubiquity can allow service providers
and travelers to connect seamlessly and efficiently between modes. Shared
and connected systems can enhance vehicle economics and propel the
deployment of electric mobility, which in turn can reduce tailpipe emissions
and cut even more at the source by supporting the integration of renewable
energy onto the grid.
India’s current mobility system reflects many of the underlying properties
of this new mobility paradigm. These elements include a high share of
nonmotorized transit, low private-vehicle ownership, a diverse set of mode
options, and strong IT capabilities. As India continues to develop at a rapid
pace, it is essential to maintain and invest in these attributes, as they serve
as the foundation of a shared, electric, and connected mobility system.
This strong starting point enables India to leapfrog towards ambitious goals
of 6–7 million xEVs by 2020 and 175 GW of renewable energy by 2022.
Today, many of the technologies and business models that support this
vision are already cost-effective, high-quality, and convenient. For example,
many HEVs, PHEVs, and battery electric vehicles (BEVs), which represent a
progression of increasing intensity of vehicle electrification, are becoming
cost-competitive and can become more so through bulk procurement of
their common assembly- and subassembly-level parts. The affirmation
of the NEMMP-2020 roadmap and continuation of the FAME scheme are
important indicators for OEMs that play critical roles in bringing more xEV
products to the Indian marketplace.
With collective ambition from stakeholders across the private sector and
government, India has the potential to turn this vision into reality and
emerge as a global role model in advanced mobility solutions.
03: VISION AND OPPORTUNITY
India has a leapfrog opportunity in mobility

26 | INDIA LEAPS AHEAD: TRANSFORMATIVE MOBILITY SOLUTIONS FOR ALL
SHRI PIYUSH GOYAL, MINISTER OF STATE WITH INDEPENDENT CHARGE FOR POWER, COAL, NEW AND RENEWABLE ENERGY, AND MINES:
“India can become the first country of its size
which will run 100% of electric vehicles.”
SHRI ANANT GANGARAM GEETE, MINISTER OF HEAVY INDUSTRIES AND PUBLIC ENTERPRISES:
“In the last many years we have seen that
coordination that was required among the
various ministers of the government...was not to
be seen. But now for the first time it is seen…we
have all got together and are working towards
a collective responsibility to face the challenges
and come out of it with a solution.”
03: VISION AND OPPORTUNITY
Government and industry leaders are converging on a vision for India’s mobility future
SHRI AMITABH KANT, NITI AAYOG CEO:
“Three trends in mobility which are making
profound impact are electrification, shared
mobility, and automation….If we prepare
ourselves for these trends and become early
adopters by deploying emerging transportation
technologies and business models, it will help
us in leapfrogging traditional approaches and
leading the world in new mobility solutions.”
SHRI CHETAN MAINI, MAINI GROUP:
“The workshop looked at a range of issues from
energy security to a thrust on renewable energy
and brought together multiple stakeholders. This
hasn't happened before. I see everything coming
together.”

27 | INDIA LEAPS AHEAD: TRANSFORMATIVE MOBILITY SOLUTIONS FOR ALL
03: VISION AND OPPORTUNITY
Parts of the mobility puzzle are emerging but have yet to be assembled in a single geography
SHARED INFRASTRUCTURE DEVELOPMENT SYSTEM INTEGRATION SCALED MANUFACTURING
Portland, Oregon: Smart-growth city
Austin, Texas: Mobility transformation
Curitiba, Brazil: World’s first BRT
France, Norway: Leaders in EV deployment
Denmark, Sweden, Norway: Standardized Exchange of Transport Information (SUTI)
Delhi, India: Shuttl
Chennai, India: Ashok-Leyland Electric Bus
Hong Kong: Octopus Card
Reno, Nevada: Tesla Gigafactory

28 | INDIA LEAPS AHEAD: TRANSFORMATIVE MOBILITY SOLUTIONS FOR ALL
03: VISION AND OPPORTUNITY
India could leapfrog the challenges of established mobility development patterns
SUPPORTIVE ATTRIBUTES OF INDIA’S CURRENT MOBILITY SYSTEM High share of non-motorized transit, low private-vehicle ownership, prevalence of mobility services
SINGLE-USER, VEHICLE-CENTRICexpensive, polluting, unsafe, inaccessible, ine�cient
SHARED, ELECTRIC, CONNECTEDa�ordable, clean, safe, accessible, e�cient
NEW MOBILITY PARADIGM
TRADITIONAL MOBILITY PARADIGM
India has a unique set of conditions that enable it to leapfrog the traditional mobility paradigm.
New mobility paradigm
India’s current mobility system
Traditional mobility system
Ability to build right the first time
Dynamic entrepreneurial culture
Public and private sector leadership
Confluence of IT and manufacturing skills
FIGURE 3: LEAPFROG OPPORTUNITY:
SCHEMATIC SHOWING HOW BUILDING ON
INDIA’S EXISTING SUPPORTING CONDITIONS
CAN SET THE COUNTRY’S TRAJECTORY
TOWARDS AN ADVANCED MOBILITY FUTURE
THAT IS AFFORDABLE, CLEAN, SAFE,
AND ACCESSIBLE, LEAPFROGGING THE
TRADITIONAL MOBILITY PARADIGM

29 | INDIA LEAPS AHEAD: TRANSFORMATIVE MOBILITY SOLUTIONS FOR ALL
03: VISION AND OPPORTUNITY
Fast-paced transformations in mobile phones, LEDs, and solar PV have demonstrated India’s ability to rapidly scale solutions
Overview
SOLUTION CATEGORY MOBILE TELEPHONY
• Nationwide replacement of incandescent lights with LEDs totaling 3.5 crore street lights and 77 crore household lights by 2019
• India’s ambitious “National Solar Mission” has sparked a decade of capacity growth
• India aims to install 100 GW of solar by 2022, a core part of its NDC
• Led mostly by the private sector, growth in mobile telephony leapfrogged the transition to landlines
LEDS SOLAR PHOTOVOLTAICS (PV)
Scaling mechanism
• Aggregated demand and procurement lowered bulb costs 76% in 2014 alone
• Outreach, turnkey implementation, and energy-savings monetization accelerated adoption
• India is home to some of the world’s largest projects and benefits from economies of scale and bulk purchasing
• Competitive auctions are placing Indian solar bids among the world’s lowest
• In addition to technological improvements, liberalisation of the telecom sector (1991)
• Competitive collaboration among telcos in the area of infrastructure development
Impact
• Reducing energy use by 114 TWh, peak load by 21.5 GW, and emissions by 85 MTCO2/y in 2019, saving residential and municipal consumers Rs 455 crore per year
• India’s installed capacity reached 6.8 GW in 2016, sustaining a 59% CAGR since 2013
• In 2017 India may become the world’s third-largest solar market
• 100 crore mobile phone subscribers and 22 crore smartphone users
• High share of digital transactions with 63.8 lakh transactions valued at Rs 2,425 crore in the month of March 2017
LESSON: GOVERNMENT TARGET SETTING, BULK PROCUREMENT, AND ECONOMIC LIBERALISATION CAN HELP GROW NEW MARKETS QUICKLY

30 | INDIA LEAPS AHEAD: TRANSFORMATIVE MOBILITY SOLUTIONS FOR ALL
03: VISION AND OPPORTUNITY
India has a growing portfolio of programmes supporting a mobility leapfrog
Make in India
PROGRAMME DESCRIPTION SUPPORTIVE ASPECTS OF THE PROGRAMME
A major national initiative designed to facilitate investment, foster innovation, enhance skill development, protect intellectual property, and build best-in-class manufacturing infrastructure.
Of the 25 sectors covered by Make in India, several are directly related to a mobility transformation, including: Automobile, Automobile Components, Aviation, Roads and Highways, Railways, and Renewable Energy.
Digital India Digital India is a flagship programme of the Government of India with a vision to transform India into a digitally-empowered society and knowledge economy.
Digital India has enabled mobile and digital transactions that support a shared mobility model by making digital identities and cashless payments ubiquitous and secure.
FAME
DHI’s initiative FAME (Faster Adoption and Manufacturing of Electric Vehicles) has extended demand incentives at Rs 127.77 crore for purchase of 1,11,897 electric and hybrid vehicles since inception of the scheme on 1 April 2015 through February 2017.
The FAME scheme has been extended through 2020, with the exact allocation yet to be determined, and now includes new focus areas of technology development, demand creation, pilot projects, and charging infrastructure.
Green Mobility Fund
MoUD’s recently announced Rs 80,000 crore fund is accessible to cities with populations above five lakh and all state capitals, covering more than 50% of India’s urban population.
The fund will be directed at mass-transit projects, nonmotorized modes of transport, use of nonfossil fuels, and creation of last-mile connectivity. Cities can apply for funding by submitting a green mobility plan.
Smart Cities Mission
Smart Cities Mission is an urban renewal programme of MoUD with a mission to develop 100 cities all over the country making them citizen-friendly and sustainable.
Three of the eight criteria of the Mission link directly to mobility solutions, including: promoting mixed land use, creating walkable localities, and promoting a variety of transport options.

31 | INDIA LEAPS AHEAD: TRANSFORMATIVE MOBILITY SOLUTIONS FOR ALL
03: VISION AND OPPORTUNITY
India’s capabilities establish a foundation for a shared, electric, and connected mobility future
IT and manufacturing
CAPABILITIES DESCRIPTION ENABLING CONDITION
Indian companies bring decades of manufacturing and IT experience, and Indian automakers also have core software-development expertise.
India’s existing manufacturing and software expertise position India to lead in the development and manufacturing of new mobility solutions.
Public and private sector
leadership
India’s business and political leaders have affirmed that a transformation is possible and desirable.
Alignment of vision and purpose across public and private sectors can help foster collaboration, build markets, and establish supportive policy frameworks.
Dynamic entrepreneurial
culture
Startups and new ventures in the mobility space are multiplying rapidly, creating new jobs and employment opportunities.
New companies and business models are focused on vehicle technology, as well as how they are used and connected to users, supporting economic applications for EVs (e.g., commuting, high-mileage vehicles, real-time data and user experience).
Ability to build right the first
time
India has an opportunity to avoid the “lock-in” effects of a system defined by high costs, heavy pollution, and inefficiency.
Some analysts expect that by 2030, India will:
• Build 700–900 million sq. ft. of new floor space every year
• Add 7,400 km of metros and subways
• Pave 2.5 billion sq km of roads4
An opportunity exists to design a system that avoids the trap of personally-owned internal combustion engine vehicles.

32 | INDIA LEAPS AHEAD: TRANSFORMATIVE MOBILITY SOLUTIONS FOR ALL
03: VISION AND OPPORTUNITY
Further evidence that India is well-positioned for a mobility transformation
1. Currently nonmotorized transportation (i.e., walking and biking) and
public transportation represent a large share of all trips taken in India
(roughly 66% in 2007).5 This is in stark contrast to a meager 10% in
the United States. Preserving this mode share through improved
urban design can make walking, biking, and public transport safe
and desirable in India.
2. Despite having expanded 472-fold since 1950, auto ownership in
India remains low, with only 18 cars per 1,000 citizens (China has
nearly 69, while the U.S. has 786 cars).6 The scarcity of privately-
owned four-wheel vehicles and a large number of two-wheelers
creates opportunities for India to deploy emerging technology and
business models to make mobility services more convenient and
cost-effective than the anticipated trend towards a growing number
of personally-owned cars.
3. Shared mobility is already familiar and highly utilised in India. Bicycle
and auto-rickshaws flexibly carry commuters along routes not
served by other modes, and ride hailing services are experiencing
enormous growth. Using interoperable transportation data and
mobile-connected platforms to enhance the current mobility services
system, while connecting it to emerging offerings, could establish
India as a global leader in shared mobility.
NEED FOR AN ARTICULATED CHANGE MODEL AND SCALING MECHANISM:
A clearly articulated change model is required to drive nonlinear growth
and achieve extraordinary scale matched to India’s ambitions. Such a model
will be required to move from individual projects, to regional examples,
to market-wide scale and transformation, and to ensure that insights and
supportive actions from the central government are targeted and shared
with regional implementation effort.

33 | INDIA LEAPS AHEAD: TRANSFORMATIVE MOBILITY SOLUTIONS FOR ALL
03: VISION AND OPPORTUNITY
Announcements since the February 2017 charrette show ongoing progress
The Economic Times
1 March 2017
Electric vehicles for commercial use may not
require permits
Live Mint
7 March 2017
Ministers to brainstorm policy for an all-electric
vehicle future
Live Mint
28 March 2017
Ola pilot project: Electric cabs across major cities in
three months
Live Mint
15 April 2017
Suzuki, Toshiba, Denso to build lithium-ion
batteries for electric vehicles in India
Live Mint
15 April 2017
Government eyes leasing of electric vehicles in
clean energy push
The Economic Times
25 April 2017
Modi government plans major policy push to promote e-vehicles

A THREE-PHASED APPROACH TO CHANGE 04

35 | INDIA LEAPS AHEAD: TRANSFORMATIVE MOBILITY SOLUTIONS FOR ALL
Combining India’s collective vision and supportive conditions with a change
model based on economic viability, experimentation, and learning can set
India on a transformative path to a new mobility future. The design charrette
convened by NITI Aayog and RMI identified near-term, actionable solutions
to support this transformation.
By the end of the workshop, a group of 75 participants generated 12
detailed opportunities for action. These actions can function as supportive
building blocks for India’s shared, electric, and connected mobility future.
While a number of themes are present across this set of opportunities, three
stand out as overarching and interconnected: scaled manufacturing, shared
infrastructure development, and system integration. Scaled manufacturing
can create xEV supply; shared infrastructure development can establish a
supportive ecosystem for pedestrians, cyclists and passengers; and system
integration can build demand and enhance efficiency through data sharing
and targeted policy frameworks.
These three opportunity areas lend structure to the list of actionable
solutions, clarify the implementation approach, and provide a framework
for ongoing discussion and debate. Sequencing these solutions provides
a prioritized timeline that takes into account the interdependencies of
systemic change and the order of operations. Economic viability and
geographic scaling inform this sequencing of actions across three strategic
phases.
Phase 1 (“Notching the arrow,” 2017–2019) prioritizes solutions that are
already economic and capable of rapid scaling, while cultivating solutions
that are nearly economic. By Phase 2 (“Drawing the bow,” 2020–2023),
opportunities that were introduced in Phase 1 are being refined and scaled,
while the options that were previously identified as nearly economic have
become cost-effective and ready for deployment. Simultaneously, public-
and private-sector action continues to lay the groundwork for enhancing the
economics and feasibility of future opportunities. In Phase 3 (“Letting the
arrow fly,” 2024–2032), more opportunities become economic and scale to
the national level. Emerging ideas follow this same trajectory, while systemic
solutions from lighthouse examples help integrate technology, design, and
business models at a national scale.
These three phases align with NITI Aayog’s 15-year vision document, which
looks forward to 2032.
04: A THREE-PHASED APPROACH TO CHANGE
A detailed yet flexible action plan to accelerate progress

36 | INDIA LEAPS AHEAD: TRANSFORMATIVE MOBILITY SOLUTIONS FOR ALL
India’s mobility system is complex, involving many stakeholders and interdependent parts. A whole-systems approach can best address and exploit these
diverse perspectives and deep relationships. The charrette’s six working groups developed a set of solutions aimed at transforming the system. The first three
groups—electric vehicle deployment, mobility as a service, and interoperable transport data—suggested solutions to integrate the system, emphasising shared
and connected as key attributes of India’s mobility future. Mobility-oriented development and vehicle-grid integration proposed infrastructural solutions to build
an ecosystem that supports electrification, while product manufacturing identified solutions to supply affordable, high-quality components that seek to make
electric drivetrains the new norm.
04: A THREE-PHASED APPROACH TO CHANGE
Key elements of India’s mobility transformation
Charrette working groups
ELEMENTS OF INDIA’S MOBILITY TRANSFORMATION
SYSTEM INTEGRATIONSHARED INFRASTRUCTURE
DEVELOPMENTSCALED MANUFACTURING
1. Mobility as a Service
2. Interoperable transport data
3. Mobility-oriented development
4. Vehicle-grid integration
5. Product manufacturing
6. Electric vehicle deployment
ASSEMBLING THE PIECES BUILDING ECOSYSTEMS CREATING SUPPLY

37 | INDIA LEAPS AHEAD: TRANSFORMATIVE MOBILITY SOLUTIONS FOR ALL
04: A THREE-PHASED APPROACH TO CHANGE
Targeting specific electric vehicle market segments based on economics can drive national adoption quickly
FIGURE 4:
REPRESENTATIVE
DIAGRAM PLOTTING
EV MARKET SEGMENTS
BASED ON THEIR
CURRENT MARKET
READINESS (Y-AXIS)
AND IMPACT ON
CO2 EMISSIONS AND
PARTICULATE MATTER
REDUCTION (X-AXIS)
† Includes shared public and commercial vehicles not for private use; incentivizing fleets vs. private-vehicle ownership can yield much faster growth in electrified passenger kilometres†† New developments point towards 2W fleet expansion in India; combining service and technology strategies could accelerate EV deployment in this segment.
* Includes economic viability and technology maturity** Includes electric passenger kilometres traveled and CO
2 emissions and particulate matter reduction
potential
ELECTRIC VEHICLE MARKET
SEGMENTPRIVATE VS.
FLEET†
2-wheelers Private
Fleet ††
3-wheelers Fleet
4-wheelers Private
Fleet
Buses Fleet
PRIVATE
FLEET
Several strategies can improve each segment’s market readiness and impact:1. Service strategy: High-mileage electric service vehicles’ lower operating costs can offset capital cost premiums
2. Technology strategy: Smart, standardized and swappable batteries could reduce capital cost for electric 2- and 3-wheelers
3. Manufacturing strategy: Private 4-wheelers and commercial buses can become economic as battery prices decline further
SMALL BITES LOW-HANGING FRUIT
WAITING GAME
Long-term Near-term
Near-term
2W
2W
3W
4W
B4W
1. 2.
3.
3.
2.
2.
Immediate
RISING STARS
Mar
ket r
eadi
ness
*
Impact**
HIGH
LOW
HIGHLOW
2017 2019PHASE 1
Harvest low-hanging fruit + Enhance small bites + Support rising stars
1.

38 | INDIA LEAPS AHEAD: TRANSFORMATIVE MOBILITY SOLUTIONS FOR ALL
04: A THREE-PHASED APPROACH TO CHANGE
Addressing components of the system in three distinct phases enables rapid scaling of economic market segments and regional integration
PHASE 12017–2019
“NOTCHING THE ARROW”
PHASE 22020–2023
“DRAWING THE BOW”
PHASE 32024–2032
“LETTING THE ARROW FLY”
System integration
Assembling the pieces
• Centralize and share transit data
• Create and distribute knowledge from state change labs
• Refine existing policies and incentives and develop new ones
• Refine policies and incentives established during Phase 1; begin phasing-out of subsidies that are no longer needed
• Fill in regulatory gaps and develop additional policies if needed
• Shift from a government- to market-led approach
• Refine and shortlist material incentives and policies after evaluation during Phase 2
• Subsidies continue phasing out as solutions become market ready and reach national scale
Shared infrastructure development
Building ecosystems
• Create infrastructure to support xEV supply and demand
• Begin building out charging and battery-swapping infrastructure to enable grid adequacy and flexibility
• Investments in mobility-oriented development and modal integration
• Continue expanding charging network and swapping stations
• Capitalise on sources of additional value created by infrastructure developed in Phase 1
• Further integrate modes and better connect states and regions
• Regulatory mechanisms in place to capture EVs' full grid value
• Fully integrated modes nationwide
Scaled manufacturing
Creating Supply
• Investments in mobility-oriented development and modal integration
• Expand common component options and begin producing platforms
• Improve supply chain management
• Scale up domestic supply
• Scale up supply to meet demand internationally

39 | INDIA LEAPS AHEAD: TRANSFORMATIVE MOBILITY SOLUTIONS FOR ALL
The charrette working groups’ solutions were designed to be near-term, high-impact actions, and therefore fall in Phase 1. Some of these solutions are already
economic and constitute low-hanging fruit to be harvested immediately. Others require cultivation to increase market readiness for national-level deployment
in Phases 2 and 3. In Phase 1, building institutional capacity and aggregating interoperable transport data are high priorities, as they enable subsequent
solutions. A series of structural reforms and policy interventions follow to support mode integration, smart urban planning, and data aggregation, while
providing manufacturers and consumers with appropriate incentives that continue seeding the xEV market. As manufacturer push and consumer pull help grow
market segments, infrastructure and production capabilities develop in tandem, paving the way for innovative business models and policies to emerge towards
the end of Phase 1, setting the stage for faster scaling in Phases 2 and 3.
04: A THREE-PHASED APPROACH TO CHANGE
Economic viability and regional scaling inform the phasing of solutions
PHASE 12017–2019
PHASE 22020–2023
PHASE 32024–2032
SCALEPROJECTS AND STATES STATES AND REGIONS NATION
TIME TO MARKET SATURATION
LOW-HANGING FRUIT Harvest economic, high-impact opportunities immediately
SMALL BITES Selectively deploy nearly economic solutions as economics and impact improve
RISING STARS Support cost-reduction measures and market conditions that enhance economics over time
ELAPSED TIME START 2020 2024

40 | INDIA LEAPS AHEAD: TRANSFORMATIVE MOBILITY SOLUTIONS FOR ALL
PH
AS
E 2
04: A THREE-PHASED APPROACH TO CHANGE
PHASE 1: 2017–2019, “Notching the Arrow”
System integration
Policies that encourage MaaS
A NEAR-TERM SEQUENCE OF ACTIONS BUILDS POLITICAL WILL AND MARKET CONFIDENCE(CHAPTER 5 PROVIDES FOUR-PAGE DETAILED OVERVIEWS OF EACH OF THE 12 SOLUTIONS LISTED BELOW)
Shared infrastructure development
Scaled manufacturing
Unified metropolitan planning authority
Metropolitan planning councils
Networked city-level innovation
and incubators
Feebates
ZEV credits
Enhanced fiscal incentives
Nonfiscal incentives
Regulations that enable EVSE deployment
and VGI
E-mobility manufacturing
consortium
Integrated transport hubs
Standardized, smart, swappable batteries for
2- and 3-wheelers
Interoperable transport data
Central data sharing
institution
MILESTONE: NATIONAL DEPLOYMENT OF ECONOMIC SOLUTIONS INFORMED BY STATE-LEVEL EXPERIMENTATION
START 2 YEARS

41 | INDIA LEAPS AHEAD: TRANSFORMATIVE MOBILITY SOLUTIONS FOR ALL
04: A THREE-PHASED APPROACH TO CHANGE
PHASE 2: 2020–2023, “Drawing the Bow”
EXPERIMENTATION SHOWS PROOF OF CONCEPT, AND LEARNING BEGINS SCALING SOLUTIONS
System integration
TARGETED ACTION
MILESTONE
• Refine regulatory incentives and policies from Phase 1
• Fill in regulatory gaps and new policies if needed
• Shift from government-led to market-led approaches
Most solutions are now economic and scaling from states and regions to the
national level
Shared infrastructure development
• Continue to expand growing charging network
• Capitalize on sources of additional value created by infrastructure developed in Phase 1 (e.g., smart charging)
• Further integrate modes and better connect regions
Scaled manufacturing
• Develop other electric drivetrain components
• Improve supply chain management and resiliency
• Scale up supply to meet demand domestically
PH
AS
E 3
SCALING MECHANISM: ECONOMIC SEGMENT TRANSFORMATION AND STATE-LEVEL CHANGE LABS

42 | INDIA LEAPS AHEAD: TRANSFORMATIVE MOBILITY SOLUTIONS FOR ALL
04: A THREE-PHASED APPROACH TO CHANGE
PHASE 3: 2024–2032, “Letting the Arrow Fly”
PRIOR LEARNING AND MARKET ADOPTION ENABLE RAPID, NATIONAL-LEVEL SCALING
System integration
TARGETED ACTION
MILESTONE
• Refine and shortlist material incentives and policies after evaluation during Phase 2
• Subsidies phase out as solutions are ready for market forces to drive full scale
Comprehensive, national-level adoption
Shared infrastructure development
• Regulatory mechanisms established to capture full grid value of EVs
• Completely connect modes across the country
Scaled manufacturing
• Begin phasing-out of most EV subsidies
• Scale up supply to meet demand internationally
SCALING MECHANISM: RAPID DEPLOYMENT OF INTEGRATED ECONOMIC SOLUTIONS

43 | INDIA LEAPS AHEAD: TRANSFORMATIVE MOBILITY SOLUTIONS FOR ALL
04: A THREE-PHASED APPROACH TO CHANGE
Enabling a mobility transformation through an integrative approach
Elem
ents
of I
ndia
’s m
obili
ty tr
ansf
orm
atio
n
System integration
Assembling the pieces1. Mobility as a Service
2. Interoperable transport data
Shared infrastructure development
Scaled manufacturing
Building the ecosystem
3. Mobility-oriented development
4. Vehicle-grid integration
Creating the supply
5. Product manufacturing
6. Electric vehicle deployment
Shared
Electric
Connected
OPPORTUNITY AREAS NEW MOBILITY PARADIGM

ACTIONABLE SOLUTIONS05

45 | INDIA LEAPS AHEAD: TRANSFORMATIVE MOBILITY SOLUTIONS FOR ALL
The mobility charrette convened a diverse group of experts reflective of India’s
mobility system to identify actionable solutions to enable a mobility leapfrog. This
set of near-term, high-impact solutions aims to accelerate India’s progress towards
EV adoption and the proliferation of mobility services, interoperable transport data,
smart urban planning, vehicle-grid integration, and domestic manufacturing.
Establishing a central data sharing institution, a unified metropolitan planning
authority, and integrated transport hubs are important first steps to begin
integrating India’s mobility system, enabling seamless mode integration.
Metropolitan planning councils can enhance this integration by designing,
connecting, and maintaining the requisite walkways, roads, and other pathways
by which people move, expediting trips and prioritizing the least energy intensive
modes of travel.
As connection becomes a cornerstone of India’s mobility system, regional
innovation and incubation centres can integrate solutions, establishing demand
for xEV technology and alterative utilisation models. Simultaneously, supply-
side incentives, like feebates and ZEV credits, can encourage automakers
to manufacture low- or no-emission vehicles of all shapes and sizes, while a
manufacturer consortium for batteries, common components, and platforms
can build a robust domestic supply chain capable of producing these vehicles at
competitive prices.
Policies that encourage mobility services can make the most of a connected
ecosystem and its efficient vehicles by placing more travelers in fewer vehicles
and providing critical first- and last-mile connections that enable mode integration,
especially the transition from walking and biking to rickshaws, taxis, and buses.
An expanding charging network and the growth of battery swapping stations, in
addition to enhanced fiscal and nonfiscal incentives, makes possible the rapid
adoption of electric vehicles, from 2- and 3-wheelers to high-mileage service
vehicles. Without smart charging and grid preparation, EVs could break electric
distribution systems. With these steps, EVs could make the grid more flexible,
renewable supply easier to integrate, and DISCOMs more solvent.
The following solutions are not exhaustive. Rather, they are designed to create
a diverse set of opportunities to establish competitive markets and manage risk.
Together, they can inspire additional opportunities and position India for success in
its mobility transformation.
05: ACTIONABLE SOLUTIONS
The charrette participants identified a diverse set of mobility solutions

46 | INDIA LEAPS AHEAD: TRANSFORMATIVE MOBILITY SOLUTIONS FOR ALL
OPPORTUNITIES LISTED HERE ARE DETAILED ON THE NEXT 48 PAGES
05: ACTIONABLE SOLUTIONS
Index of actionable solutions
ACTOR
OPPORTUNITY PAGES GOVERNMENT PRIVATE SECTOR CIVIL SOCIETY
1. Interoperable transport data: central data sharing institution and unified metropolitan planning authority 52–55 ✓ ✓
2. Metropolitan planning councils 56–59 ✓
3. Networked city-level innovation and incubation centres 60–63 ✓ ✓ ✓
4. Feebates 64–67 ✓ ✓
5. Zero Emission Vehicle (ZEV) credits 68–71 ✓ ✓
6. Policies that encourage Mobility as a Service (MaaS) 72–75 ✓
7. Regulations that enable Electric Vehicle Supply Equipment (EVSE) deployment and Vehicle-Grid Integration (VGI) 76–79 ✓ ✓
8. Manufacturer consortium for batteries, common components, and platforms 80–83 ✓ ✓
9. Integrated transport hubs 84–87 ✓
10. Enhanced fiscal incentives 88–91 ✓
11. Nonfiscal incentives 92–95 ✓
12. Standardized, smart, swappable batteries for 2- and 3-wheelers 96–99 ✓ ✓

47 | INDIA LEAPS AHEAD: TRANSFORMATIVE MOBILITY SOLUTIONS FOR ALL
Interoperable transport data
UNIQUE CONDITIONS POSITION INDIA FOR A TRUE LEAPFROG OPPORTUNITY IN INTEGRATED MOBILE BOOKING AND PAYMENT FOR MOBILITY SERVICES
05: ACTIONABLE SOLUTIONS
CONTEXT
• Conditions exist to help establish mandate- and market-driven mechanisms to support better transportation data, including:
» Leadership in the public and private sector around innovation in software and data
» Relatively high share of passenger miles served by mobility services
• Progress on payment banks, biometrics, and cashless payment may pave the way for integrated mobile booking and payment for mobility services, which domestic ridesharing companies and bus aggregators are already exploring
OPPORTUNITY
• Harnessing India’s IT and mobile application skills to deliver transformative solutions including:
» NITI Aayog incubating a new central data transport sharing institution
» Creating new Unified Metro Transit Authority (UMTA) at the state/city level
» "Quick win" market-driven data exchange among mobility operators and cities
POTENTIAL IMPACT
• Leapfrog: Bypass the convoluted structure of multiple payment mechanisms, payment portals, and smart card approaches to achieve a seamless and potentially universal payment, booking, and transit pass membership platform
• Disruptive: Suggestions by private companies to willingly share data may have global implications for data sharing if the initial precedent is set in India
• Interconnectedness: A singular, comprehensive data platform can increase MaaS and MOD’s impacts

48 | INDIA LEAPS AHEAD: TRANSFORMATIVE MOBILITY SOLUTIONS FOR ALL
THE AVAILABILITY AND QUALITY OF INTEROPERABLE TRANSPORT DATA CAN IMPROVE WITH A LEGAL AND INSTITUTIONAL FRAMEWORK DESIGNED FOR SHARING
05: ACTIONABLE SOLUTIONS
BARRIERS
• Lack of data availability due to:
» Limited capacity of mobility providers
» Privacy concerns
» Competition concerns (desire to participate)
• Without common standards, data is of variable quality and data sets are incomplete or incompatible
• Decentralized and cross-ministry jurisdiction reduces clarity on who is responsible for data aggregation
• High fragmentation among a diverse array of disaggregated intermediate public transit (IPT) providers and an associated lack of fixed route, fixed schedule public transit providers
ACTIONS
• Create an improved policy and legal framework for sharing anonymous data and increasing data accessibility for solution providers
» Create a central data bank managed by the central government
» Establish Unified Metro Transit Authorities (UMTA) at state and city levels
• Establish institutional framework to manage capacity, quality, and standards for data and sharing
» Standards
» Capacity building (funding, IT infrastructure)
» Rules for sharing
» Monitoring
» Issue resolution (conflict management)
• Crowd source data and aggregate into a secure, easy-to-use platform, helping operators access more customers providing better service to travelers
ENABLERS
• Current technology platforms, including payment banks, biometrics, and cashless payments with apps are growing quickly in India
• There is already a high share of mobility services and low private-vehicle ownership
• The proliferation of open data policies is an emerging trend domestically and globally
Interoperable transport data
49 | INDIA LEAPS AHEAD: TRANSFORMATIVE MOBILITY SOLUTIONS FOR ALL
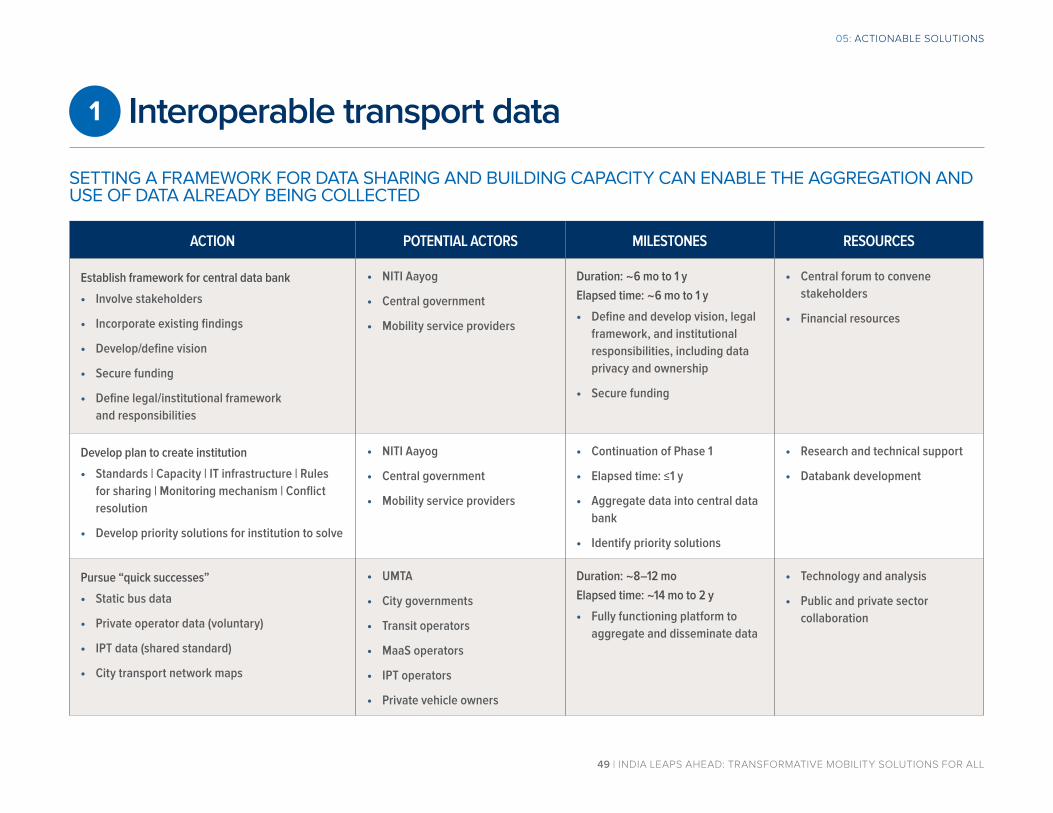
SETTING A FRAMEWORK FOR DATA SHARING AND BUILDING CAPACITY CAN ENABLE THE AGGREGATION AND USE OF DATA ALREADY BEING COLLECTED
05: ACTIONABLE SOLUTIONS
ACTION POTENTIAL ACTORS MILESTONES RESOURCES
Establish framework for central data bank
• Involve stakeholders
• Incorporate existing findings
• Develop/define vision
• Secure funding
• Define legal/institutional framework and responsibilities
• NITI Aayog
• Central government
• Mobility service providers
Duration: ~6 mo to 1 yElapsed time: ~6 mo to 1 y
• Define and develop vision, legal framework, and institutional responsibilities, including data privacy and ownership
• Secure funding
• Central forum to convene stakeholders
• Financial resources
Develop plan to create institution
• Standards | Capacity | IT infrastructure | Rules for sharing | Monitoring mechanism | Conflict resolution
• Develop priority solutions for institution to solve
• NITI Aayog
• Central government
• Mobility service providers
• Continuation of Phase 1
• Elapsed time: ≤1 y
• Aggregate data into central data bank
• Identify priority solutions
• Research and technical support
• Databank development
Pursue “quick successes”
• Static bus data
• Private operator data (voluntary)
• IPT data (shared standard)
• City transport network maps
• UMTA
• City governments
• Transit operators
• MaaS operators
• IPT operators
• Private vehicle owners
Duration: ~8–12 moElapsed time: ~14 mo to 2 y
• Fully functioning platform to aggregate and disseminate data
• Technology and analysis
• Public and private sector collaboration
Interoperable transport data

50 | INDIA LEAPS AHEAD: TRANSFORMATIVE MOBILITY SOLUTIONS FOR ALL
DATA SHARING NOT ONLY PRESENTS A LEAPFROG OPPORTUNITY FOR MOBILITY SERVICES, BUT ALSO AUGMENTS THE POTENTIAL IMPACT OF OTHER SOLUTIONS, ESPECIALLY THOSE RELATED TO MOBILITY-ORIENTED DEVELOPMENT
05: ACTIONABLE SOLUTIONS
CASE STUDY
• Comprehensive data sharing is still a nascent idea globally; there are instances of pilot programmes for specific components of data systems in mobility services
» The Standardized Exchange of Transport Information (SUTI) between Sweden, Norway, and Demark is a data protocol for taxis and other on-demand vehicles
» OneBusAway (OBA), a U.S.-based company, offers open-source data products that distribute real-time passenger information across a number of platforms, including the web, smartphone apps, and SMS
» Whim app in Helsinki, Finland gives its users access to a large range of transport options from public transport to taxis to car rentals—the app provides routing information, booking, and payment in a single interface
INDIA-SPECIFIC IMPACT
• India's progress on payment banks (Aadhaar ID system), biometrics, and cashless payment with apps (e.g., PayTM, the government-backed universal payments interface or UPI, and the BHIM app) appears to offer a true leapfrog opportunity in the realm of integrated and mobile booking and payment for mobility services—achieving a seamless and universal payment, booking, and transit-pass membership platform
• The high fragmentation among a diverse array of intermediate public transit (IPT) providers and an associated lack of fixed-route, fixed-schedule public transit providers may ultimately be an advantage if the shift to autonomous, electrified Mobility as a Service involves nonfixed route, nonfixed schedule, on-demand transit
• Beyond MaaS, data sharing will aid urban planners in building more efficient mobility-oriented cities
Interoperable transport data

51 | INDIA LEAPS AHEAD: TRANSFORMATIVE MOBILITY SOLUTIONS FOR ALL
Metropolitan planning councils
A SINGLE ENTITY RESPONSIBLE FOR STRATEGIC PLANNING AND IMPLEMENTATION, EMPOWERED WITH FINANCIAL AND EVALUATIVE CAPABILITIES, CAN ACCELERATE MOBILITY-ORIENTED DEVELOPMENT
05: ACTIONABLE SOLUTIONS
CONTEXT
• Stakeholders share a common vision for cities that feature pedestrian- and mobility-centric urban ecosystems designed around people, not cars
• Policy and guidance documents (at city, state, and central levels) serve as resources for vision and implementation
• Despite the aligned vision, implementation is slow for many reasons, including fragmentation among stakeholders and lack of capacity
OPPORTUNITY
• To accelerate the adoption of MOD, city governments could combine transit, transport, and land use agencies into integrated Metropolitan Planning Councils (MPCs) designing to address all modes of transit, from walking to biking
• The MPCs need financial and evaluative capabilities to manage several phases—planning, implementation, and follow-up, including measuring impact and incorporating feedback in designs
POTENTIAL IMPACT
• At scale, MPCs can create city- and state-specific solutions on a national level7
Social Economic Environmental
• More mobility choices • Health—walking encouraged • Increased safety
• Increased land value • Increased transit use • Reduced road/infrastructure costs
• Reduced energy use • Be>er air quality • ConservaAon of resources

52 | INDIA LEAPS AHEAD: TRANSFORMATIVE MOBILITY SOLUTIONS FOR ALL
IMPROVING COMMUNICATION AND PLANNING CAN HELP DESIGN RESILIENT CITIES
05: ACTIONABLE SOLUTIONS
BARRIERS
• Fragmentation may impair communication and coordination among stakeholders (“multiplicity of agencies”), leading to poor planning and long implementation periods
• Implementation capacity could often be insufficient
» Personnel turnover reduces institutional memory
» Infrastructure does not match with demand
» Lack of data availability complicates decision making
» Lack of monitoring and enforcement capabilities weakens implementation
• A lack of institutional and government support restricts innovation
• Solutions are not city-specific (i.e., straitjacket approach) and there is limited citizen involvement, creating inefficiencies and reducing local buy-in
ACTIONS
• Create MPCs with aggregated powers to plan, implement, and monitor progress, reducing fragmentation
• Establish MPC directive to integrate land-use and transit in planning, thereby creating a comprehensive strategic mobility plan
• Provide MPCs with financial and evaluative capabilities to ensure effective implementation and a regular review cycle
• Develop policy towards common vision, with a stable understanding—carefully select policies and adapt to local situations8
• Encourage proof-of-concept and India-specific pilot programmes and share knowledge to decrease risk, avoid straitjacket approaches, and educate citizens and policy makers
ENABLERS
• A shared vision for MOD exists among multiple actors, establishing a strong foundation and starting point for development. Several government bodies and think-tanks are already mobilising financial and human resources to accelerate change.
• There are many resources available that can be leveraged to inform development
Metropolitan planning councils

53 | INDIA LEAPS AHEAD: TRANSFORMATIVE MOBILITY SOLUTIONS FOR ALL
LEVERAGING EXISTING INITIATIVES, POLICIES, AND GUIDANCE DOCUMENTS CAN ACCELERATE THE DEVELOPMENT OF METROPOLITAN PLANNING COUNCILS
05: ACTIONABLE SOLUTIONS
ACTION POTENTIAL ACTORS MILESTONES RESOURCES
Identify and amend laws in leading states • NGOs and think tanks
• NITI Aayog
• Central government
• Several state governments
Duration: ~3 moElapsed time: ~3 mo
• Identify 3 lead states
• Assess and update current policy to support MPCs
• Existing research and analysis by civil society champions
• Support from central government bodies
Issue guidance/advisory documents • NITI Aayog
• Ministry of Urban Development
Duration: ~6 moElapsed time: ~9 mo
• Develop and distribute guidance document
• Leverage existing policy/guidance documents
» National Urban Transport Policy, Sustainable Urban Transport Project
Initiate process in all other states • Civil society
• Initial MPCs
• State-level governments
Duration: ~12–15 moElapsed time: ~2 y
• Use initial successes to begin scaling nationally
• Identify and begin policy overhaul in additional states
• Central forum to convene stakeholders
Metropolitan planning councils

54 | INDIA LEAPS AHEAD: TRANSFORMATIVE MOBILITY SOLUTIONS FOR ALL
A SHARED VISION IS A FIRST STEP IN MOBILITY-ORIENTED DEVELOPMENT; METROPOLITAN PLANNING COUNCILS CAN IMPLEMENT DEVELOPMENT IN LINE WITH THIS VISION
05: ACTIONABLE SOLUTIONS
CASE STUDY
Curitiba, Brazil – “focus on putting people first and integrated planning”9
Process and factors to replicate
• Created nonprofit (i.e., IPPUC) and municipal authority to implement plans, monitor performance, and perform research10
• Integrated public transit and land use in legislation and planning, with a focus on citizens and multiple benefits
• Focused: continuity, aligned visions, and “inexpensive, creative urban solutions and reflect local values”
Results
• 75% use public transit to commute (in 2006, up from 7% in 1970s); that is roughly 1.9 million passengers per weekday
• 55 m2 green space per resident (16 m2 recommended by Word Health Organization)
• A role model: Curitiba’s success has been replicated by other cities, including Bogotá, Colombia
INDIA-SPECIFIC IMPACT
• Many Indian cities share similarities with Curitiba (population: 32 lakh) and Bogotá (80 lakh)
• Like Curitiba, MPCs can enhance MOD by establishing a clear vision, encouraging continuity, and planning and implementing a comprehensivde transit and land use plan, creating more efficient mobility for the user and increasing economic activity for cities and states
• To support MPCs, innovation and incubation centres can promote experimentation, knowledge sharing, and contextualized solutions
Metropolitan planning councils

55 | INDIA LEAPS AHEAD: TRANSFORMATIVE MOBILITY SOLUTIONS FOR ALL
Networked city-level innovation and incubation centres
“PUBLIC-PRIVATE-PEOPLE” PARTNERSHIPS THAT CREATE, EXPERIMENT, AND VALIDATE SOLUTIONS CAN ACCELERATE SOLUTION DISSEMINATION AND SCALING
05: ACTIONABLE SOLUTIONS
CONTEXT
• Stakeholders understand that city-specific solutions must be developed, but there is a need to improve the coordination of proof-of-concept and pilot programmes with city-wide and city-specific implementation
OPPORTUNITY
• Launch innovation and incubation centres embedded within city or state governments throughout India focused on MOD
• These centres will be responsible for innovative and contextualized solution identification/creation, experimentation (proof-of-concept and pilot programmes), and evaluation
• As networked knowledge centres, they will aid the dissemination of India-specific case studies nationally
POTENTIAL IMPACT
• By involving many stakeholders (public, private, NGO, academia, etc.) and aligning with MPCs, the centres will build capacity, help establish grassroots interest (local buy-in), and bridge the gap between solution providers and finders—allowing MOD to proliferate at a much higher rate

56 | INDIA LEAPS AHEAD: TRANSFORMATIVE MOBILITY SOLUTIONS FOR ALL
RAPID PROTOTYPING, AUGMENTING CAPACITY AT THE CITY LEVEL, AND SHARING KNOWLEDGE CAN PRODUCE TARGETED SOLUTIONS
05: ACTIONABLE SOLUTIONS
BARRIERS
• Cities may take a one-size-fits-all approach, creating inefficiencies and reducing local buy-in
• City development is continuous and can often outpace pilot programmes (i.e., permanent infrastructure is built before incorporating lessons)
• Cities and states have insufficient capacity to identify and test solutions
• Limited and uncoordinated knowledge sharing—disaggregated resources
• Limited citizen involvement/buy-in slows adoption
ACTIONS
• Establish innovation and incubation centres with goals of:
» Innovation
» Incubation
» Knowledge sharing
• Involve all stakeholders in the same room to streamline decision making and planning, and to ensure ideas are representative of all stakeholders
• Establish mechanisms of information dissemination and network between cities to increase institutional memory
• Develop targeted, city-specific solutions
• A shared vision for MOD exists among multiple actors, establishing a strong foundation and starting point for development; several government bodies and think-tanks are already mobilising financial and human resources to accelerate change
• Many existing resources from academia, government, and civil society can inform urban planning
Networked city-level innovation and incubation centres

57 | INDIA LEAPS AHEAD: TRANSFORMATIVE MOBILITY SOLUTIONS FOR ALL
PIONEER CITIES CAN SERVE AS INITIAL TEST-BEDS AND KNOWLEDGE CENTRES, EXPEDITING THE TRANSITION FROM PROOF-OF-CONCEPT TO WIDE-SCALE IMPLEMENTATION IN OTHER CITIES
05: ACTIONABLE SOLUTIONS
ACTION POTENTIAL ACTORS MILESTONES RESOURCES
Develop champion cities
• Generate interest
• Integrate with Smart Cities Initiative
• Begin city identification
• NITI Aayog
• Ministry of Urban Development
• City- and state-level governments
Duration: ~6–9 moElapsed time: ~6–9 mo
• Website developed
• Develop centre directive
• Start competition for city selection
• Staff capacity
• IT and design
• Marketing
Experimentation (proof-of-concept/pilot programmes)
• Begin experimentation with follow-up validation
• Innovation centre
• Selected cities
• MPCs
Duration: ongoingElapsed time: beyond ~9 mo
• Establish centres for proof-of-concept and pilot programmes in top cities
• Monitor performance and begin identifying new cities
• Innovation centre
• Local resources for experimentation
Continued Innovation centre development and knowledge dissemination
• Generate awareness
• Knowledge database
• Develop more centres
• Continue experimentation
• Innovation centre
• Additional cities: city- and state-level governments
• MPCs
Duration: ongoingElapsed time: beyond ~1 y
• Knowledge database developed
• New centres in progress
• Innovation centre
• Marketing
• Local resources for experimentation
Networked city-level innovation and incubation centres

58 | INDIA LEAPS AHEAD: TRANSFORMATIVE MOBILITY SOLUTIONS FOR ALL
QUICKLY PUTTING TESTED SOLUTIONS IN THE HANDS OF SOLUTION FINDERS CAN ACCELERATE THE SCALING OF MOBILITY-ORIENTED DEVELOPMENT NATIONALLY
05: ACTIONABLE SOLUTIONS
CASE STUDY
• NITI Aayog: Atal Innovation Mission (AIM)
» Establish Atal Innovation Centres to support (physical and mentorship) for innovators and start-ups in many sectors
» Encourage innovation and entrepreneurship in India
• Bhopal Living Labs proposal for an Atal Innovation Centre11
» Create a “user-centred, open-innovation ecosystem” in a regional context that integrates “concurrent research and innovation processes within a public-private-people partnership”
» Performing the “cocreation, exploration, experimentation and evaluation of innovative ideas, scenarios, concepts and related technological artifacts in real-life use cases”
INDIA-SPECIFIC IMPACT
• Use a similar structure as NITI Aayog’s Atal Innovation Mission and Bhopal’s Living Labs proposal, with a MOD-centric framework
» Involving thought leaders to drive solution development and testing
» Scaling via rapid prototyping at a pace necessary for inclusion in city development
• Coupled with MPCs, the result is a streamlined process for MOD innovation and planning/implementation/monitoring
• There are additional opportunities for this method to help accelerate the adoption of other technologies (electric vehicles and charging infrastructure)
Networked city-level innovation and incubation centres

59 | INDIA LEAPS AHEAD: TRANSFORMATIVE MOBILITY SOLUTIONS FOR ALL
Feebates
A WELL-DESIGNED FEEBATE PROGRAMME CAN STEER BUYERS TOWARDS ‘CLEAN-FUEL’ VEHICLES, ENCOURAGE MANUFACTURES TO INCORPORATE LOW-EMISSIONS TECHNOLOGY, AND RETIRE INEFFICIENT VEHICLES
05: ACTIONABLE SOLUTIONS
CONTEXT
• CAFE (Corporate Average Fuel Economy) standards coming into effect in 2017 will improve fuel efficiency
• While India’s already small, low-powered vehicles are a great starting point for fuel economy, the CAFE standards represent a marginal improvement in fuel economy (average annual reduction: India at 1.8%); technologically and economically viable options to vastly improve fuel economy are available
OPPORTUNITY
• The CAFE regulations can be supplemented with a revenue-neutral feebate programme managed by manufacturers; feebates are rebates for efficient new vehicles paid for by fees on inefficient ones
• The system will have built-in performance evaluations to review and reset the benchmark values at specified intervals, ensuring the efficient and financially stable functioning of the programme
POTENTIAL IMPACT
• A feebate programme sends a stable price signal, providing continuous incentives for manufacturers to produce and consumers to purchase efficient vehicles
• The feebate provides equal incentives for all advanced technologies and stimulates long-term development of innovative technologies to produce a low-carbon vehicle fleet thanks to feebates’ ability to drive continuous improvement
• 6 countries now operate feebates; Norway's, together with nonfiscal incentives, has made ⅓ of new light-duty vehicles EVs

60 | INDIA LEAPS AHEAD: TRANSFORMATIVE MOBILITY SOLUTIONS FOR ALL
WHILE STANDARDS ENCOURAGE MEETING REQUIREMENTS, NOT EXCEEDING THEM, FEEBATES CAN DRIVE LONG-TERM DEVELOPMENT OF EFFICIENT VEHICLES
05: ACTIONABLE SOLUTIONS
BARRIERS
• Manufacturers may be compelled to do “just enough” to meet existing CAFE standards
• Future uncertainty with standards creates unclear long-term signals13
• A patchwork of policies at varying institutional levels creates confusion and risk for manufacturers; consumers can bypass fees by purchasing in different regions14
• A single policy may favor short-term technology development, not long-term investment, in a potentially impactful technology
ACTIONS
• Implement a feebate programme designed for India with guidance from best practices:15
» A continuous and linear rate: no step functions, or breaks
» Linear metric: CO2 emissions or fuel consumption per unit distance; CO2 emissions encourages a switch to less-polluting fuels
» A periodically adjustable and well-balanced pivot point to maintain a self-funding, revenue-neutral programme
• The exchange of money may best be managed at the manufacturer level to avoid high administrative fees (millions of transactions vs. yearly settlements) and to protect dealers from increased liability with customers who must pay fees
• To aid adoption, the feebate can be designed based on vehicle attributes, preferably capacity or size; programmes without attributes can be viewed as interfering with customer choice or creating inequity—for example, a large family likely requires a large vehicle16
ENABLERS
• Revenue-neutral: financially self-sustaining when properly designed and managed
• Stackable: feebates can be used in conjunction with other systems, including standards and other feebates
• Flexible: various permutations of an ideal feebate system are still effective and may help adoption
• Bureau of Energy Efficiency is soon to introduce vehicle star labelling programme which can inform a Feebates program
Feebates

61 | INDIA LEAPS AHEAD: TRANSFORMATIVE MOBILITY SOLUTIONS FOR ALL
LAUNCH A NATIONAL-LEVEL FEEBATE PROGRAMME FOR LIGHT-DUTY VEHICLES TO COMPLEMENT, NOT COMPETE WITH CURRENT STANDARDS
05: ACTIONABLE SOLUTIONS
ACTION POTENTIAL ACTORS MILESTONES RESOURCES
Establish framework for programme
1. Engage stakeholders
2. Determine performance goals to inform programme details
3. Policy work
4. Establish programme details
1. Bureau of Energy Efficiency (BEE), Ministry of Power, NITI Aayog, manufacturers, consumers
2–4. BEE, Ministry of Power, NITI Aayog, Ministry of Finance
Durration: ~6 mo to 1 yElapsed time: ~6 mo to 1 y
• Define performance goals and supporting programme details to achieve goals
• Establish managing party to oversee programme
• Analysis capacity
• Marketing for engagement
• Legal capacity
Implement programme
1. Launch
2. Evaluate performance
3. Adjust pivot point, ensuring sufficiently steep slope to get buyers’ attention
Ministry of Road Transport and Highways (MORTH), BEE, Ministry of Power, NITI Aayog, Managing group
Duration: ongoingElapsed time: >1 y
• Successful launch
• Begin evaluation and prepare for pivot point adjustment
• Capacity to evaluate performance and update pivot point
Expand to additional vehicle sectors MORTH, BEE, Ministry of Power, NITI Aayog
Duration: ongoingElapsed time: >2 y
• Expand to other vehicle segments
• Programme management
Feebates

62 | INDIA LEAPS AHEAD: TRANSFORMATIVE MOBILITY SOLUTIONS FOR ALL
FRANCE HAS IMPLEMENTED A SUCCESSFUL PROGRAMME THAT CLOSELY FOLLOWS THE BEST PRACTICES OF AN IDEALIZED FEEBATE PROGRAMME
05: ACTIONABLE SOLUTIONS
CASE STUDY
France
• Implemented a stepwise programme for light-duty vehicles with fuel efficiency between 25 and 96 mpg in January 2008
• Although deviating from an ideal feebate programme, the French programme has been a success with results attributed to the programme even during peak oil prices in 2008
Results
• CO2 emission dropped 9 g/km (6%) in 2008 alone; this drop is 2x more than the average EU reduction (3.1%) and higher-than-average annual reduction in France from 2000–200717
• “Average engine power and vehicle mass had their largest annual decreases since at least 1984”
• Following pre-feebate trends, estimates indicate vehicles would have emitted 25% more CO2 per km in 2015
INDIA-SPECIFIC IMPACT
• India is already in a leading position with low-emissions vehicles; implementing a feebate programme could help India maintain this designation by continuously encouraging vehicle efficiency improvements and switches to cleaner fuel types
• Feebates can be combined with other, either existing or new, programmes to accelerate efficient-vehicle deployment
» For example, adding vehicle or congestion fees in congested cities will reduce travel demand met by vehicles, while the feebate will encourage the shift to more efficient vehicles
Feebates

63 | INDIA LEAPS AHEAD: TRANSFORMATIVE MOBILITY SOLUTIONS FOR ALL
ZEV credits
GOVERNMENT MANDATES AIDED BY A MARKET MECHANISM CAN CATALYSE ELECTRIC VEHICLE PRODUCTION
05: ACTIONABLE SOLUTIONS
CONTEXT
• While Indian EV manufacturers receive fiscal incentives from central and state government in several forms, such as lower excise duties, there is no financial mechanism to attribute explicit economic value to the production of Zero Emission Vehicles (ZEVs), which include PHEVs, BEVs, and fuel cells
• The State of California mandates that EVs must constitute a percentage of automakers’ vehicle sales. OEMs earn credits for ZEV sales, which count towards regulatory compliance; these credits are also tradable and bankable18
OPPORTUNITY
• State- or national-level ZEV credit programmes are supply-focused, market-based mechanisms that can encourage automakers to produce higher shares of electric vehicles by means of regulatory mandates and financial incentives
POTENTIAL IMPACT
• California and nine other U.S. states with ZEV credit programmes aim to produce over 30 lakh ZEVs by 2025, seeking to push these states’ market shares up to 15%19

64 | INDIA LEAPS AHEAD: TRANSFORMATIVE MOBILITY SOLUTIONS FOR ALL
LESSONS FROM THE U.S. CAN INFORM ZEV CREDIT ADOPTION IN INDIA
05: ACTIONABLE SOLUTIONS
BARRIERS
• Low regulatory requirements for automakers’ EV share mandates can lead to an oversupply of ZEV credits, lowering their market value and allowing OEMs to achieve compliance several years ahead of schedule
• The travel provision of California’s current policy allows automakers to receive ZEV credits in the nine other U.S. states with ZEV credit programmes, in proportion with their California sales numbers, leading to double counting; a national ZEV credit design would avoid this issue
ACTIONS
• Assess the appetite for ZEV credit programmes across India’s 29 states and 7 Union Territories (UTs), and begin structuring a national programme or state-level pilots; if it is the latter, focus on those with interest and the highest vehicle sales
• Design high-priority national- and state-level objectives into the ZEV credit point structure, including additional credit for electric service vehicles, in alignment with an action developed by the Mobility as a Service working group, and the northeast U.S.’s pooling provision
• Develop a review cycle and evaluation process for refining mandates and credit structures to ensure meaningful ZEV credit prices and adoption rates
ENABLERS
• California’s pooling provision allows U.S. automakers selling ZEVs in the northeast to transfer credits to states not in compliance with their ZEV requirements from states with extra credits, accommodating geographic diversity while avoiding double counting
• ZEV credit design offers opportunities for tiered and targeted incentives—for example, electric service vehicles earn an additional ZEV credit in California, and number of credits increases with a ZEV’s electric range
ZEV credits

65 | INDIA LEAPS AHEAD: TRANSFORMATIVE MOBILITY SOLUTIONS FOR ALL
ZEV CREDIT PROGRAMMES COULD HELP SCALE ELECTRIC VEHICLE MANUFACTURING ACROSS INDIA
05: ACTIONABLE SOLUTIONS
ACTION POTENTIAL ACTORS MILESTONES RESOURCES
Assess the appetite for ZEV credit programmes across India’s 29 states and 7 UTs, and begin structuring a national programme or state-level pilots
• NITI Aayog
• Department of Heavy Industry
• Ministry of Finance
• State-level governments
• 2017: Identify pioneer states in which to pilot ZEV credits
• 2018: Structure pilots in these states by setting up mandates and ZEV credit structures
• Forum for convening and hosting stakeholders
Design national- and state-level objectives into the ZEV credit point structures
• State-level governments
• Department of Heavy Industry
• Ministry of Road Transport and Highways
• Ministry of New and Renewable Energy
• Include additional credit for electric service vehicles
• Adopt the northeast U.S.’s pooling provision, if it is a state-level programme
• Coordinate ZEV credit and feebate designs
• Policy and regulatory research support from civil society
• Legal support
Develop a review cycle and evaluation process for refining the programme
• State-level governments • Create state- and regional- level advisory boards to understand and assess the programmes’ impact
• Program management and financial support
ZEV credits

66 | INDIA LEAPS AHEAD: TRANSFORMATIVE MOBILITY SOLUTIONS FOR ALL
U.S. STATES WITH ZEV CREDIT PROGRAMMES HAVE BOLD GOALS AND PROMISING RESULTS
05: ACTIONABLE SOLUTIONS
CASE STUDY
California, U.S.20
• Annual ZEV sales have grown nearly 11-fold since 2011 to 73,132 units in 2016, making up 51% of 2016 U.S. ZEV sales
• With cumulative 2011–2016 sales of 254,988 units, ZEV sales have sustained a CAGR of 100%—9 percentage points higher than the 2011–2016 ZEV CAGR for states without ZEV credits
• 2016 ZEV market share was 3.6%—4x higher than the 2016 national market share and nearly 9x higher than the 2016 market share for states without ZEV credits
9 other U.S. states
• ZEV sales have grown 7-fold since 2011 to 12,825 in 2015, a CAGR of 64%21
INDIA-SPECIFIC IMPACT
Compatible with national- or state-level policymaking
• ZEV credits represent an important incentive category—supply-side incentives—that could be strengthened in India, and are customizable to meet specific states’ policy objectives, which could work well with India’s governance style
Private-sector revenue source
• While Tesla, as a manufacturer of BEVs only, is not subject to ZEV mandates, it earns ZEV credits, which it can sell to other automakers seeking to meet compliance levels; in Q2 2016, Tesla sold a portion of its ZEV credits and earned Rs 9.2 crore in revenue, helping the company post profits that quarter22
• Indian automakers could benefit from this new revenue source
ZEV credits

67 | INDIA LEAPS AHEAD: TRANSFORMATIVE MOBILITY SOLUTIONS FOR ALL
Policies that encourage MaaS
INCENTIVISING ELECTRIC SERVICE VEHICLES CAN HELP GROW ELECTRIC VEHICLE DEMAND
05: ACTIONABLE SOLUTIONS
CONTEXT
• Many states’ contract carriage permit policy inhibits ridesharing by allowing only point-to-point trips; in other words, it prevents service providers from picking up and dropping off passengers along a specified route.23 While this statute enables free carpooling like Ola CarPool, some states may not permit ridesharing services like UberPOOL. The new Motor Vehicles Act (Amendment) 2016 liberalises issuance of licenses of aggregators and suggests that states follow central government’s guidelines on these issues.
• While EV fiscal incentives target electric and hybrid vehicles, they do not provide specific incentives for shared or high-mileage EVs
OPPORTUNITY
• A package of smart policies could disincentivize privately owned ICE vehicles and promote shared EVs in India, electrifying more passenger-kilometres sooner while providing higher-quality and greater access to mobility services
• Important outcomes of this policy enhancement are lowering the burden-to-operate, improving tax structures and financing options, and prioritizing shared EVs in nonfiscal incentive structures
• Strengthens and creates new B2B channels for EV sales to fleet owners, thereby providing a steady demand for EVs
POTENTIAL IMPACT
• These concepts need not only apply to 4-wheelers, but can also help support the growth of auto-rickshaws
• Less congestion and better, more accessible mobility services at lower cost
• Hundreds of Rs. crores in transportation fuel cost and CO2 saved annually

68 | INDIA LEAPS AHEAD: TRANSFORMATIVE MOBILITY SOLUTIONS FOR ALL
MINOR POLICY MODIFICATIONS AND ADDITIONS CAN SPEED SHARED ELECTRIC VEHICLE DEPLOYMENT
05: ACTIONABLE SOLUTIONS
BARRIERS
• Some states’ stage carriage permits prohibit ridesharing in commercial vehicles, preventing transportation network companies’ (TNCs’) driver-owned fleets from offering services like UberPOOL24
• FAME demand incentives do not prioritize shared EVs (other than buses)
• India lacks a supportive ecosystem for high-mileage EVs (i.e., charging infrastructure, including battery swapping options, and electrical grid readiness)
• Private car ownership is a status symbol in India and around the world
ACTIONS
• Revise policies to allow TNCs’ driver-owned fleets and other private service providers to operate with stage carriage permits
• Offer shared and fleet EVs (2-, 3-, and 4Ws, and buses) lower interest rates, VATs, registration taxes, and electricity tariffs compared to privately-owned EVs and ICEs
• Review and revise FAME incentives for buses to promote higher uptake in the future
• Provide nonfiscal incentives, including priority access to bus and HOV lanes at metros and airports and in public parking areas, registration benefits, etc.
• Assess feasibility and develop action plan for providing OEMs additional excise duty reductions for producing EVs designed for TNC drivers
ENABLERS
• High-mileage electric service vehicles have lower per-kilometre total costs of ownership than comparable ICEs25
• Ridesharing reduces congestion and passenger trip cost
• Younger generations are embracing the sharing economy and may aspire less to car ownership than older generations
• FAME incentives are already available to buses
Policies that encourage MaaS

69 | INDIA LEAPS AHEAD: TRANSFORMATIVE MOBILITY SOLUTIONS FOR ALL
COORDINATION ACROSS SEVERAL MINISTRIES CAN UNLOCK A SHARED ELECTRIC VEHICLE ECOSYSTEM
05: ACTIONABLE SOLUTIONS
ACTION POTENTIAL ACTORS MILESTONES RESOURCES
Pursuant to the Motor Vehicles Act (Amendment), 2016, work with states to allow TNCs and other private service providers to operate with stage carriage permits
• Ministry of Road Transport and Highways
• NITI Aayog
• State governments
• 2017: Identify pioneer states in which to pilot ZEV credits
• 2018: Structure pilots in these states by setting up mandates and ZEV credit structures
• Central forum to host and convene stakeholders
Offer shared and fleet EVs lower interest rates, VATs, registration taxes, and electricity tariffs compared to privately owned EVs and ICEs
• Department of Heavy Industry
• Ministry of Finance
• Ministry of Power
• 2017: Include favorable incentive structures for shared EVs in FAME 2.0
• 2018: Offer shared EVs lower interest rates and electricity tariffs
• Monetary and fiscal support
Provide nonfiscal incentives, including priority access to bus and HOV lanes at metros and airports and in public parking areas, registration benefits, etc.
• Department of Heavy Industry
• Ministry of Road Transport and Highways
• Ministry of Urban Development
• 2017: Begin phasing in nonfiscal incentives to FAME 2.0 and continue rounding out the portfolio in 2018
• Forum for engagement with local governments
• Policy and regulatory direction
• Research and technical support
Policies that encourage MaaS

70 | INDIA LEAPS AHEAD: TRANSFORMATIVE MOBILITY SOLUTIONS FOR ALL
SHARED VEHICLES COULD ELECTRIFY 1 TRILLION PASSENGER-KILOMETRES BY 2020
05: ACTIONABLE SOLUTIONS
CASE STUDY
• Modeling of high-mileage electric service vehicles in the U.S. shows by 2030 Rs 13,000 crore in annual fleet savings for sedans, relative to conventional ICE models, and annual CO2 savings of 80 crore tonnes for electric, autonomous vehicles26
• Studies suggest each service vehicle could replace five personal vehicles due to higher utilisation (up to and over 10 vehicles if they are autonomous)27
• Beijing, China’s license plate lottery reduced license plate issuances from 700,000 in 2010 to 240,000 in 201128
INDIA-SPECIFIC IMPACT
• UberPOOL has saved over 32 million vehicle-kilometres, 15 lakh litres of fuel, and 35 lakh kg CO2 since launching in Bengaluru in September 2015; this service now operates in Delhi, Hyderabad, Kolkata, Mumbai, and Chennai29
• Electrifying 1 lakh crore passenger-kilometres could save about 20% of India’s 3,300 lakh BTUs of annual transportation energy consumption—saving several hundred Rs crore in fuel cost and several crore metric tonnes of CO2
• Next steps could be to (a) incorporate auto-rickshaws into the contract carriage permit regulation, too, since they currently carry more passengers than TNCs and have lower per-capita energy consumption than private cars and 2-wheelers and (b) over time, permit commercial person-to-person ridesharing for PHEVs and BEVs only
Policies that encourage MaaS

71 | INDIA LEAPS AHEAD: TRANSFORMATIVE MOBILITY SOLUTIONS FOR ALL
Regulations that enable EVSE deployment and VGI
INTEGRATING ELECTRIC VEHICLES WITH INDIA’S GRID CAN PROVIDE MANY VALUABLE BENEFITS, MAKING THE GRID MORE RESILIENT AND REINFORCING THE COUNTRY’S ELECTRICITY SECTOR
05: ACTIONABLE SOLUTIONS
CONTEXT
• As India moves towards high EV adoption, supportive infrastructure must keep pace and can strengthen its electricity sector
• Strategic deployment of EVs could help in integrating a high share of renewable energy (RE) into the supply mix and make solvent many financially-challenged DISCOMs
• Multiple EV value streams could be captured and monetized in the future; system capabilities must be developed with a view towards this vision
OPPORTUNITY
• Akin to India’s RE targets, articulation of an ambitious vision to increase EV adoption coupled with its RE goals could lead to a leapfrog in the mobility-electricity nexus
• New and existing bodies such as the Forum of Regulators (FOR) must be empowered to create regulatory frameworks that enable implementation of this vision
• Suggested tactical steps including creating an interim, experimental VGI regulatory framework in a state that provides suitable economic incentives in line with broader policy objectives
POTENTIAL IMPACT
• Rapid scaling of such a regulatory framework and technical aspects could ensure that renewable energy fuels all new EVs
• EVs can act as distributed energy resources, providing on- and off-grid benefits, including lower RE integration costs
• EVs could also provide ancillary grid services, including demand response, frequency regulation, etc.
• Smart charging, bidirectionality, and vehicle lightweighting (making possible smaller batteries and thus shorter charging times) have great potential to enhance India’s electricity grid

72 | INDIA LEAPS AHEAD: TRANSFORMATIVE MOBILITY SOLUTIONS FOR ALL
SEVERAL CONDITIONS AND INSTITUTIONS ALREADY EXIST TO IMPLEMENT THIS VISION
05: ACTIONABLE SOLUTIONS
BARRIERS
• Multiple ministries and departments, each with its own priorities, can hamper progress or lead to uncoordinated progress
• No regulatory tariff and incentives for EVs
• Lack of EV infrastructure and no clear business case for investment in EV infrastructure
• State and central governments have differing agendas and priorities; enabling sustainable vehicle-grid Integration (VGI) will require significant coordination
ACTIONS
• NITI Aayog/PMO could play a focal role, enabling coordination and cooperation between ministries towards a unified vision
• Regulatory frameworks could classify EVs, charging infrastructure, and battery swapping facilities as distributed energy resources, and aim to monetize various value streams from EVs—for example, provision of demand response, oil use reduction, etc.
• Creative financing and business models where various actors such as utilities, OEMs, TNCs, or public players could fund EV infrastructure, when it is in the interest of the rate-payer; infrastructure should be sited and developed to support a shared electric paradigm
• Empower the Forum of Regulators (FOR) as a nodal body to generate a model VGI regulatory framework and diffuse knowledge among various state regulatory bodies
Regulations that enable EVSE deployment and VGI

73 | INDIA LEAPS AHEAD: TRANSFORMATIVE MOBILITY SOLUTIONS FOR ALL
CLEAR POLITICAL COMMITMENT AND VISION CAN ENABLE REGULATORY ACTION TO FOLLOW IN CLOSE-STEP
05: ACTIONABLE SOLUTIONS
ACTION POTENTIAL ACTORS MILESTONES RESOURCES
Political commitment:
• Articulation of an ambitious EV + RE vision for the country
• Prime Minister’s Office
• Ministry of New and Renewable Energy
• Ministry of Power
• Release of vision statement as soon as possible
• Forum for convening and hosting stakeholders
Explicitly enable interim regulatory framework:
• Conduct global best practices review
• Issue model policy draft with support of states that commit to sustainable VGI
• Forum of Regulators (FOR) to lead this initiative in consort with champion electricity regulators from states
• 6 months to issue model policy draft
• Research and advocacy efforts to support policy drafting
Regulations must include clear and tangible incentives:
• Special customer class for EV and battery-swapping customers
• Enables monetization of ancillary services and other cobenefits
• FOR to champion this initiative
• Supported by a cross-cutting steering committee include Joint Secretaries, State regulators, DISCOMs, etc.
• 1–2 y to incorporate lessons from a few states into national policy draft
• Inclusive stakeholder engagement process including multiple workshops across the country to enlist state support
Regulations that enable EVSE deployment and VGI

74 | INDIA LEAPS AHEAD: TRANSFORMATIVE MOBILITY SOLUTIONS FOR ALL
INDIA CAN BE A LEADER IN SUCCESSFULLY PAIRING RENEWABLE ENERGY AND ELECTRIC VEHICLE MISSIONS
05: ACTIONABLE SOLUTIONS
CASE STUDY
Actions
• Governor Brown of California, U.S. set a strong target to reach 15 lakh zero-emission vehicles (ZEVs) by 2025; the state followed up with the ZEV Action Plan and the Vehicle-Grid Integration Roadmap
• All three large utilities in the state proposed pilots to expand utility investment in EV infrastructure
• State legislature passed SB 350
» Identifies clear policy case for encouraging EV adoption based on benefits for the grid and ratepayers
» Mandates utilities to include EVs in their resource plans and encourages state regulators to approve utility programmes that accelerate EV adoption in the state
Outcomes
• California leads the U.S. in EV pilots and EV deployment, currently at around 250,000
• State regulator is actively considering means to employ EVs as distributed energy resources
• Most utilities include EVs as a separate tariff class, and are experimenting with tariff designs that help meet policy goals
INDIA-SPECIFIC IMPACT
• Rapid scaling of such a regulatory framework could ensure that all new electric vehicles are fuelled entirely by RE
• Lowers cost of integrating high share of RE into the grid as smart charging infrastructure can help match EV load profiles with surplus RE supply
• Displaces diesel and petrol consumption in 2030 by 156 mtoe, thereby reducing the crude oil bill by Rs 3.9 lakh crore (at USD 52/bbl of crude)
Regulations that enable EVSE deployment and VGI

75 | INDIA LEAPS AHEAD: TRANSFORMATIVE MOBILITY SOLUTIONS FOR ALL
E-mobility manufacturer consortium
INCREASING PLATFORM AND COMPONENT COMMONALITY AND DEVELOPING NEW PARTNERSHIPS CAN HELP MANUFACTURERS INCREASE EFFICIENCY AS MOBILITY TRANSITIONS TOWARDS SERVICE
05: ACTIONABLE SOLUTIONS
CONTEXT
• In a shift towards mobility as a service, the main value driver for the consumer is the ability to get from point A to B reliably, comfortably, and affordably
• Manufacturers are at a pivotal point where they can follow the product-oriented path, or instead shift to services, in which the drive to differentiate products decreases, opening avenues for common-component development and partnerships, and potentially higher margins
OPPORTUNITY
• Create a technical platform to drive shared/common components for Indian vehicle developers/manufacturers
• Form a developer and manufacturer consortium to plan, manage, and launch mechanisms required for success
» Prioritize batteries, charging infrastructure, and swapping-infrastructure development with a goal to launch a 250 MWh battery plant by the end of 2018 as a first step towards scaling to ‘gigawatt’ production capabilities by 2020
» Next, develop E-powertrain system and other components for shared-service vehicles
POTENTIAL IMPACT
• When manufactures compete on services, they can increase collaboration—consolidating research and development, production, and supply chains; ultimately, the common platforms and components can be made in India at scale
• Developing a battery cell is the starting point; a cell can be built into a module, then a vehicle battery pack (harnessing India’s software development strengths), and at scale a full suite of EV components can be made in India

76 | INDIA LEAPS AHEAD: TRANSFORMATIVE MOBILITY SOLUTIONS FOR ALL
WITHOUT THE REQUISITE DEMAND AND A COMMON PLATFORM TO SHARE KNOWLEDGE AND RESOURCES, MANUFACTURING ELECTRIC VEHICLES IN INDIA WILL CONTINUE TO SCALE SLOWLY
05: ACTIONABLE SOLUTIONS
BARRIERS
• Lack of assured demand creates uncertainty and risk for manufacturers to push supply to an undeveloped market
• There is a risk on investment as companies shift their strategic models, supply chains, and facilities from product-oriented to service-oriented production
• New knowledge and skills must be developed to make new EV components; the high cost of importing EV parts is also prohibitive to producing EVs
• Limited collaboration among manufacturers and a lack of standards for common components and charging infrastructure does not encourage rapid scaling
ACTIONS
• Decrease risk for manufacturers by incentivizing EVs for most fleet operations in cities; this could be achieved through a supportive policy environment and promulgation of innovative business models
• Continue Make in India and FAME, along with incentivizing reusing/recycling components to reduce the cost of EVs
• Establish a collaborative consortium to develop standardized batteries and common components for electrified mobility service vehicles; these partnerships should share R&D, harmonize strategy, and aggregate supply chains and manufacturing
• Establish a regulatory body to create, update, and simplify regulatory frameworks to drive EV adoption
ENABLERS
• National policy, such as the National Electric Mobility Missions of 2020 (NEMMP) is designed to encourage EV deployment and manufacturing in India
• The high share of services and low private-vehicle ownership supports service-oriented manufacturing
• Strong competency in IT and software development
E-mobility manufacturer consortium

77 | INDIA LEAPS AHEAD: TRANSFORMATIVE MOBILITY SOLUTIONS FOR ALL
STARTING WITH THE BATTERY, A MANUFACTURING CONSORTIUM CAN CATALYSE AND SCALE ELECTRIC VEHICLE DEVELOPMENT AND PRODUCTION IN INDIA
05: ACTIONABLE SOLUTIONS
ACTION POTENTIAL ACTORS MILESTONES RESOURCES
Establish a manufacturing consortium to develop a battery and scale production
1. Develop technical specifications: informed by use-cases
2. Supply-chain and manufacturing development: localize and scale
3. Policy work: promote EV Make in India
4. Programme Management and planning
1. Technology laboratory, Department of Heavy Industry (DHI), Department of Science and Technology (DST), and Ministry of New and Renewable Energy
2. DHI, Society of Indian Automobile Manufacturers (SIAM), Manufacturers
3. DHI, NITI Aayog
4. DHI, NITI Aayog, SIAM, Consortium partners
Duration: 1–2 yElapsed time: 1–2 y
• 2018 Goal: 250 MWh/y battery plant
• 2020 Goal: GW/y production
• Raw materials for lithium-ion battery production
• New infrastructure development for laboratories and factories
Begin development and scaling of other common EV platforms and components
• Original and new consortium partners
• Technology laboratories
• DHI
• DST
• SIAM
• NITI Aayog
Duration: concurrent with battery developmentElapsed time: 1–3 y
• Goal: develop and manufacture battery + E-powertrain components in India for a complete EV
• Lessons from consortium on battery development
• Identification of an existing or a new institution for conducting research on standards and specifications for common components
• Additional infrastructure development
E-mobility manufacturer consortium

78 | INDIA LEAPS AHEAD: TRANSFORMATIVE MOBILITY SOLUTIONS FOR ALL
COLLABORATIVE CONSORTIUMS HAVE HAD PREVIOUS SUCCESS, SHOWING THAT SIMPLIFYING AND STREAMLINING THE PROCESS CAN CUT COSTS AND SCALE MANUFACTURING
05: ACTIONABLE SOLUTIONS
CASE STUDY
Common platforms and components reduce manufacturing costs and increase “functional flexibility” in production30
• Platform development accounts for ~1/2 of product development costs
• GM may shift from 30 to 14 vehicle platforms by 2018, with estimated savings of ~Rs 6,500 crore
Manufacturing Consortiums/Alliances31
• Renault and Nissan established an alliance in 1999 to exchange ideas, build strategy, and leverage synergies
• Achievements
» 2002: sales begin of common platform | 2006: shared engine | 2010: opened a joint manufacturing facility | 2014: core business functions converged to accelerate efficiency
INDIA-SPECIFIC IMPACT
• Accepting the paradigm shift towards usership and services, partnerships among manufacturers can reduce growth issues
• Rapidly scaling manufacturing, starting with the battery as a proving ground, a full EV can be made in India—supporting government initiatives and delivering clean transportation
• Partnerships can also develop to harness India’s strengths in software development and data collection to potentially pave the way for intelligent batteries and appropriate semi- or fully autonomous vehicles
E-mobility manufacturer consortium

79 | INDIA LEAPS AHEAD: TRANSFORMATIVE MOBILITY SOLUTIONS FOR ALL
Integrated transport hubs
INTERMODAL INTEGRATION AT PHYSICAL HUBS SERVING MULTIPLE TRANSPORTATION MODES COULD ENHANCE SERVICE DELIVERY AND BOOST ECONOMIC ACTIVITY
05: ACTIONABLE SOLUTIONS
CONTEXT
• Transport hubs are sparse and current design does not promote efficient, clean, and safe multimodal integration
• In some cases, transport hubs prohibit or provide inequitable access to specific service providers
• Missing links in first- and last-mile connectivity prevent some travelers from utilising high-traffic public transit modes
OPPORTUNITY
• Smarter zoning regulations, transportation policies, urban design, and data solutions could enable the proliferation of integrated transport hubs in India, enhancing mode integration, access to public transit, and first- and last-mile connectivity
• These integrated transport hubs could generate revenue for the government through property leasing models, sales taxes, and more, potentially helping generate additional revenues for public transit services
POTENTIAL IMPACT
• Seamless connectivity, better service delivery and more accessible mobility options at lower cost
• These integrated transport hubs have considerable implications for logistics and shipping

80 | INDIA LEAPS AHEAD: TRANSFORMATIVE MOBILITY SOLUTIONS FOR ALL
SMARTER URBAN DESIGN AND DATA SOLUTIONS COULD STREAMLINE PUBLIC TRANSIT
05: ACTIONABLE SOLUTIONS
BARRIERS
• Existing transport hubs lack the design and infrastructure requisite for efficient, clean, and safe mode integration; many are already experiencing capacity constraints32
• Zoning regulations, transportation policies, and design guidelines that enable integrated transport hubs require cooperation across several ministries
• Low levels of data collection, aggregation, and sharing make demand prediction, supply optimization, and payment integration challenging
ACTIONS
• Modify policies to permit all intermediate public transit modes—from 2-wheelers to public buses—to pick up and drop off travelers at these transport hubs, with priority lane access and parking for shared EVs and private taxi EVs
• Develop and publish design and investment guidelines for retrofitting old and constructing new transport hubs34
• Create an inventory of prospective sites for retrofits and new constructions, then initiate RFPs for feasibility studies, designs, and constructions
• Collaborate with the central data sharing institution, a proposal by the Interoperable Transport Data working group, to enable a data exchange among mobility operators, cities, and the central government
ENABLERS
• India’s public transit system is young and still being built, providing an opportunity to retrofit existing transport hubs and properly site new ones
• The Government of India is a major investor in multimodal logistics and transport hub projects (e.g., Delhi-Mumbai Industrial Corridor) and prospecting more33
• Private-sector service providers, especially TNCs and bus aggregators, are eager to fill India’s intermediary public transit gap
• IT-sector strength, including the rise of mobile payments, positions India to integrate these transport hubs physically and digitally
Integrated transport hubs

81 | INDIA LEAPS AHEAD: TRANSFORMATIVE MOBILITY SOLUTIONS FOR ALL
POLICIES AND DESIGN GUIDELINES COULD PROLIFERATE THESE TRANSPORT HUBS BY 2020
05: ACTIONABLE SOLUTIONS
ACTION POTENTIAL ACTORS MILESTONES RESOURCES
Modify policies to permit all intermediate public transit modes to pick up and drop off travelers at transport hubs, with priority lane access and parking for shared EVs and private EVs
• Ministry of Urban Development
• Ministry of Road Transport and Highways
• Department of Heavy Industry
2017:
• Update permit for cab aggregators to enable ridesharing
• Establish priority lanes and parking for EVs
• Data sharing institution for Interoperable Transport Data
• Central forum for hosting and convening relevant stakeholders
Develop and publish design and investment guidelines for retrofitting old and constructing new integrated transport hubs
• Ministry of Urban Development
• Ministry of Road Transport and Highways
• 2017: Convene a workshop on integrated transport hub best practices and publish summary report
• Research and technical support
• Civil society engagement
Create an inventory of prospective sites for retrofits and new constructions, then initiate RFPs for feasibility studies, design, and construction
• Department of Heavy Industry
• Ministry of Urban Development
• Ministry of Road Transport and Highways
• 2017: Develop a protocol for identifying and a platform for cataloging prospective sites
• 2018: Select a portfolio of sites on which to start and initiate RFP processes
• Online platform for posting and soliciting RFPs
Integrated transport hubs

82 | INDIA LEAPS AHEAD: TRANSFORMATIVE MOBILITY SOLUTIONS FOR ALL
TRANSPORT HUBS COULD BE A KEY TO EFFICIENT, CLEAN, AND SAFE MULTIMODAL TRANSIT
05: ACTIONABLE SOLUTIONS
CASE STUDY
San Francisco, California, U.S.: Transbay Transit Centre
• “The Transbay Program…will bring 11 transportation systems under a single roof, and create a pedestrian- and bike-friendly community where residents and workers have convenient access to rapid and safe public transit, shopping, open space, and other neighborhood amenities”35
• Potential economic benefits include:
» 125,000 jobs
» Rs 2,400 crore in travel-time savings
» Rs 780 crore in avoided vehicle operation and maintenance
» Rs 130 crore in benefits from improved safety
INDIA-SPECIFIC IMPACT
• Commuter and logistics transport hubs can help close India’s infrastructure gap; a recent World Bank report estimates India and the Southeast Asian Region may have to spend close to Rs 130 lakh crore on infrastructure by 2020, requiring both public and private investment, to meet their development goals36
• Estimates suggest India may spend up to Rs 32.5 lakh crore in the next decade on logistics infrastructure, including roads, rail lines, and hubs; investments in commuter transport hubs should be made in tandem with investments in logistics hubs37
• These commuter and logistics hubs should provide better connectivity and more accessible mobility services at lower cost
Integrated transport hubs

83 | INDIA LEAPS AHEAD: TRANSFORMATIVE MOBILITY SOLUTIONS FOR ALL
Enhanced fiscal incentives
STRENGTHENING AND ALIGNING EXISTING FISCAL INCENTIVES CAN SPEED EV ADOPTION*
05: ACTIONABLE SOLUTIONS
CONTEXT
• The Government of India introduced FAME in 2015 to provide demand incentives for EVs and hybrids—up to Rs 29,000 for 2-wheelers and Rs 61,000 for 4-wheelers—inpursuit of deploying 6–7 million “EV+” vehicles by 202038
• Despite these demand incentives at the central level, only ~20% of the budget for FY 2016 and FY 2017 has been utilised, and India sold just 22,000 BEVs in 2016, wellshort of its target pace39
• While other fiscal incentives—excise duty reductions, infrastructure tax exemptions, and state tax incentives—exist, they could be stronger to help further reducepurchase costs
OPPORTUNITY
• The Department of Heavy Industry is in the process of revising FAME40
• Strengthening, aligning, and complementing existing fiscal incentives at the central, state, and city levels can maximize consumer pull, speeding EV adoption *
POTENTIAL IMPACT
• A set of fiscal incentives can create a self-sustaining EV market, especially as battery costs continue to decline and bring EVs closer to cost parity, helping India reach its2020 target of 6–7 million “EV+” and jumpstarting progress towards the central government’s vision of 100% EVs by 2030
* There is divergence in opinion around the appropriate near- to mid- term vehicle-technology portfolio (HEVs, PHEVs, BEVs, FCEVs, etc.) and their role on the pathway to a fully-electric future. This merits a discussionaround how incentives and subsidies could be structured and targeted to create a level playing field, while accelerating deployment of fully-electric vehicles. While this analysis was out of scope for this report, future research may address these topics.

84 | INDIA LEAPS AHEAD: TRANSFORMATIVE MOBILITY SOLUTIONS FOR ALL
STRONGER FISCAL INCENTIVES COULD CLOSE THE GAP ON NEMPP’S 2020 GOAL
05: ACTIONABLE SOLUTIONS
BARRIERS
• There is significant competition over existing funds in the central budget; ensuring long-term, stable subsidies might be inexpedient
• States have varying degrees of EV incentives, especially when compounded with state-level VATs
• Ensuring that incentive schemes target outcome-driven, relevant technologies41
ACTIONS
• Increase the FAME budget in the near-term and introduce incentives to bring all BEVs, including 4-wheelers, to cost parity with conventional base models
• Provide more favorable excise duties for EVs and PHEVs by lowering both rates further; and prioritize Make in India
• Utilise vehicle infrastructure tax revenue from ICEs to fund charging and battery-swapping infrastructure development
ENABLERS
• The Department of Heavy Industry is in the process of revising FAME for a new version
• BEVs can support the central government’s renewable energy target of 100 GW by 2020
• The new GST regime could provide fairly consistent EV incentives across state boundaries
• Declining battery costs may allow BEVs to reach cost parity with conventional base models by 202542
Enhanced fiscal incentives
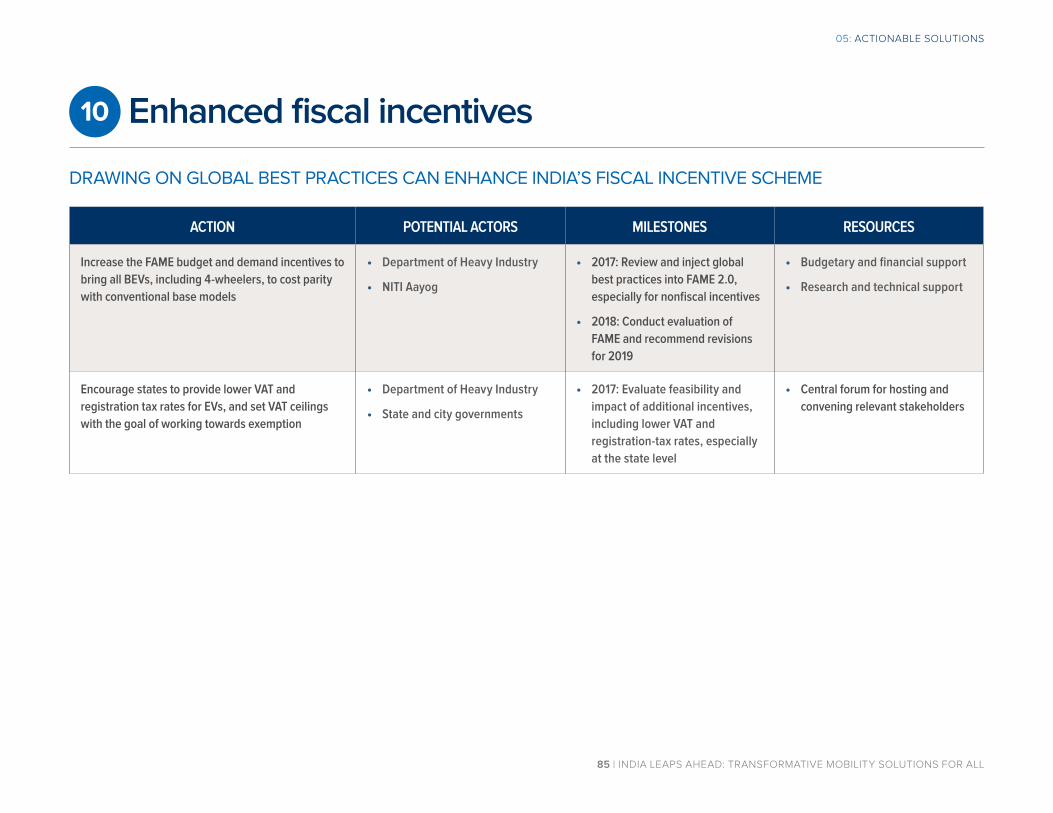
85 | INDIA LEAPS AHEAD: TRANSFORMATIVE MOBILITY SOLUTIONS FOR ALL
DRAWING ON GLOBAL BEST PRACTICES CAN ENHANCE INDIA’S FISCAL INCENTIVE SCHEME
05: ACTIONABLE SOLUTIONS
ACTION POTENTIAL ACTORS MILESTONES RESOURCES
Increase the FAME budget and demand incentives to bring all BEVs, including 4-wheelers, to cost parity with conventional base models
• Department of Heavy Industry
• NITI Aayog
• 2017: Review and inject global best practices into FAME 2.0, especially for nonfiscal incentives
• 2018: Conduct evaluation of FAME and recommend revisions for 2019
• Budgetary and financial support
• Research and technical support
Encourage states to provide lower VAT and registration tax rates for EVs, and set VAT ceilings with the goal of working towards exemption
• Department of Heavy Industry
• State and city governments
• 2017: Evaluate feasibility and impact of additional incentives, including lower VAT and registration-tax rates, especially at the state level
• Central forum for hosting and convening relevant stakeholders
Enhanced fiscal incentives

86 | INDIA LEAPS AHEAD: TRANSFORMATIVE MOBILITY SOLUTIONS FOR ALL
INDIA’S ELECTRIC VEHICLE MARKET COULD GROW FASTER THAN NORWAY’S WITH THE RIGHT INCENTIVES
05: ACTIONABLE SOLUTIONS
CASE STUDY
• Norway:
» 59% of Norwegians list “saving money” as their main motive for purchasing an EV43
» Studies suggest purchase tax exemption and VAT exemption are Norway’s most effective fiscal incentive44
» Fiscal incentives have helped Norway’s light-duty EV share leap from 1% in 2011 to nearly 30% in 2016; now it is over 33%45
• Austria:
» Modeling of EV adoption in Austria suggests VAT exemption alone can increase BEV sales by about 85% above business-as-usual46
INDIA-SPECIFIC IMPACT
• The right stack of fiscal incentives across all levels of government could rapidly accelerate EV adoption in India, possibly at a faster pace than Norway has observed, considering India’s scale and experience with fast transformation
• The central government may not have to extend FAME demand incentives beyond 2025, as many forecasts project that declining battery prices and manufacturing costs will erase EV cost premiums in a matter of years, potentially saving the Government of India several years of subsidies
• As fiscal incentives spur rapid EV adoption, fixing existing problems with and enhancing India’s electricity grid can allow EV sales to surge without putting the grid at risk
Enhanced fiscal incentives

87 | INDIA LEAPS AHEAD: TRANSFORMATIVE MOBILITY SOLUTIONS FOR ALL
Nonfiscal incentives
COMPLEMENTING FISCAL WITH NONFISCAL INCENTIVES CAN FURTHER SPEED ELECTRIC VEHICLE ADOPTION
05: ACTIONABLE SOLUTIONS
CONTEXT
• While FAME demand-incentive money is available for charging infrastructure, most of India’s FAME scheme’s budget goes towards fiscal incentives that encourage EV sales
• State- and city-level initiatives, such as public charging infrastructure investment, are underway to complement these fiscal incentives with a supportive EV ecosystem
OPPORTUNITY
• Desirability of EVs could play as important a role in EV adoption as costs. Complementing central- and state-level fiscal incentives with nonfiscal incentives such as lane access, preferred parking access, lower registration costs and tariffs, and even permit exemption can further speed EV adoption
POTENTIAL IMPACT
• Modeling of nonfiscal incentives’ impact on EV adoption in Norway suggests bus lane access alone could increase BEV sales 25% above business-as-usual by 204547
• In many cases, access to public charging infrastructure and lane access has also been valued at par with availability of fiscal incentives such as subsidies48

88 | INDIA LEAPS AHEAD: TRANSFORMATIVE MOBILITY SOLUTIONS FOR ALL
NEW NONFISCAL INCENTIVES COULD ALSO HELP CLOSE THE GAP ON NEMPP’S GOAL
05: ACTIONABLE SOLUTIONS
BARRIERS
• Minimal penetration of bus and HOV lanes in India poses a challenge to priority lane access, which many studies see as the most effective nonfiscal incentive
• A lack of charging infrastructure and an organic, outdated distribution grid pose a challenge to preferential tariffs
ACTIONS
• Provide priority lane access, including bus and HOV lanes, and free parking for EVs, plus ICE registration caps
• Invest in charging and battery-swapping infrastructure at the central, state, and local levels, potentially utilising vehicle infrastructure tax revenue as the funding source
• Charging infrastructure includes plug standards, signage, etiquette and social norms, parking integration, etc.
• Limiting registration of conventional vehicles through public lotteries and complementing that with preferential registration for EVs, similar to that in China, could support uptake
• Offer smart charging chips and preferential, reduced off-peak tariffs for EVs at the utility level
ENABLERS
• India is in the early stages of infrastructure development relative to other emerging economies, presenting an opportunity to develop road infrastructure in tandem with EV policy goals
• Range anxiety is a concern for many EV drivers, making charging-infrastructure development a high priority for the government and automakers
Nonfiscal incentives

89 | INDIA LEAPS AHEAD: TRANSFORMATIVE MOBILITY SOLUTIONS FOR ALL
MAKING FAME MORE IMPACTFUL AND ADDING TO IT OVER TIME COULD SPUR ELECTRIC VEHICLE GROWTH
05: ACTIONABLE SOLUTIONS
ACTION POTENTIAL ACTORS MILESTONES RESOURCES
Provide priority lane access, including bus and HOV lanes, and free parking for EVs, plus ICE registration caps
• Ministry of Roads Transport and Highways
• Ministry of Urban Development
• 2017: Identify viable bus lanes, HOV lanes, and parking areas in Indian states and cities
• 2018: Conduct state- and city-level pilots on priority lane access and free parking
• Central forum for hosting and convening relevant stakeholders
• Engagement with local governments
Invest in charging and battery-swapping infrastructure at the central, state, and local levels, potentially utilising vehicle infrastructure tax revenue as the funding source
• Ministry of Power
• Ministry of Finance
• 2017: Identify funding for charging infrastructure and develop investment plan
• 2018: Initiate development of charging infrastructure, prioritizing the most cost-effective locations first
• Fiscal and budgetary support
• Research and technical support
Offer smart charging chips and preferential, reduced off-peak tariffs for EVs at the utility level
• Ministry of Power
• State and local utilities
• Ministry of Finance
• 2017: Convene a task force with utilities, DISCOMS, and OEMs to design special rate classes for EVs and charging/battery-swapping stations for 2018 deployment
• Central forum for hosting and convening relevant stakeholders
• Research and technical support
Nonfiscal incentives

90 | INDIA LEAPS AHEAD: TRANSFORMATIVE MOBILITY SOLUTIONS FOR ALL
THE RIGHT COMBINATION OF FISCAL AND NONFISCAL INCENTIVES IS KEY TO ELECTRIC VEHICLE ADOPTION
05: ACTIONABLE SOLUTIONS
CASE STUDY
• A private-public partnership between the Japanese government and the nation’s four largest automakers created a charging network with 40,000 charge points—5,000 greater in number than gas stations—in a matter of 3 years; Portugal put chargers across the whole country in 2 years49
• Providing bus lane access has contributed to BEV sales growth in Austria already, and modeling suggests it can increase the total BEV market by 25% by 204550
INDIA-SPECIFIC IMPACT
• Nonfiscal incentives can complement India’s existing fiscal incentives, helping accelerate EV adoption by providing additional incentives and creating a supportive ecosystem
• They can help build out charging infrastructure and further develop EVSE technology and VGI capabilities
• They can also serve as a cost-effective means to EV adoption, allowing the government to leverage existing assets and private-sector funding to facilitate deployment goals
• Charging infrastructure can be integrated with road and near-road improvements, from modern LED street lighting to telecoms to sewerage
Nonfiscal incentives

91 | INDIA LEAPS AHEAD: TRANSFORMATIVE MOBILITY SOLUTIONS FOR ALL
Standardized, smart, swappable batteries for 2- and 3-wheelersREDUCING CAPITAL COSTS AND ELECTRICITY TARIFFS CAN ELECTRIFY KEY VEHICLE SEGMENTS
05: ACTIONABLE SOLUTIONS
CONTEXT
• 2- and 3-wheelers constitute ~80% of India’s domestic automobile sales and ~20% of India’s national mode share, offering a huge market that is almost ripe for electrification
• 3-wheelers alone contributed 6–24% of total automotive PM in several large Indian cities, greater than their ~5% share of the vehicle population51
• Electrification can mitigate PM and tailpipe emissions from 2- and 3-wheelers, while providing better user experience; however, high cost of ownership, due to expensive annual battery replacements, has inhibited this fuel switch
OPPORTUNITY
• Standardized, smart, swappable batteries for 2- and 3-wheelers with lease and/or pay-per-use business models, an extensive swapping-station network, and an integrated payment and tracking system could rapidly electrify personal and intermediary public transit by cutting sticker prices by as much as 70%52
POTENTIAL IMPACT
• 2- and 3-wheelers offer efficient road utilisation, up to ~30% higher than 4-wheelers, according to a survey in Patna, that showed 4-wheelers had an occupancy value of 2.03 passengers while 2-wheelers had an occupancy value of 1.31
• Affordable 3-wheelers could replace hand-drawn carts and cycle-rickshaws, providing multiple environmental, health, and social benefits; non-air-conditioned public buses and several 4-wheelers may also benefit from this model
• Standardized, smart, swappable batteries may also be important enablers of other high-impact use cases, especially in electric taxis and buses and for stationary use (e.g., rural and off-grid solar)

92 | INDIA LEAPS AHEAD: TRANSFORMATIVE MOBILITY SOLUTIONS FOR ALL
2- AND 3-WHEELERS COULD JUMPSTART INDIA’S DOMESTIC BATTERY MARKET AND ELECTRIC VEHICLE REVOLUTION
05: ACTIONABLE SOLUTIONS
BARRIERS
• Lithium-ion (Li-ion) batteries are sparse and expensive in India due to low domestic availability, absence of a domestic auto-battery market, and exclusion from manufacturing tax breaks
• Most Indian electricity comes from lignite coal, which reduces the environmental benefit of fuel switching
• 2-wheelers have high lead emissions per PKT—several orders of magnitude higher than buses54
• Many electric 2-wheeler buyers switch from NMT (e.g., biking) and public transit, which have no or lower emissions per PKT55
• Some Indian cities place a cap on 3-wheeler numbers56
• Monitoring and maintaining a network of batteries, especially with regard to battery life, can be difficult if they are not Li-ion
ACTIONS
• Policy changes to ease tax burdens (under new GST) related to battery swapping, buying and selling energy for EVSE providers, and buying batteries without vehicles (India’s current tax structure makes buying batteries without the vehicles costlier than batteries for the EVs)
• Identify a domestic manufacturing plant to develop modular batteries with a standard form factor for sale to OEMs with compatible 2- and 3-wheelers
• Build swapping stations managed privately or jointly by utilities, DISCOMS, and OEMs; offer preferential electricity tariffs
• Develop an integrated, blockchain-enabled payment and tracking system for vehicles, batteries, and charging stations for seamless, secure cashless payment and a high level of transparency and accountability
ENABLERS
• Lithium-ion battery pack prices are falling rapidly while renewable energy supply is growing quickly57
• 2- and 3-wheelers fit the current mode share well, especially in urban areas, and serve important segments of society58
• 2- and 3-wheelers benefit structurally from more easily swappable batteries and financially from low interest rates
• Even in Guangdong, China, where 2013 fuel mix is 58% fossil fuel (the source of which is likely coal) and 23% imported, CO2 emissions from e-bikes are 65% lower than conventional 4-stroke engine models59
• Battery charging stations can help integrate India’s growing share of renewable energy onto the grid
Standardized, smart, swappable batteries for 2- and 3-wheelers

93 | INDIA LEAPS AHEAD: TRANSFORMATIVE MOBILITY SOLUTIONS FOR ALL
POLICIES AND INVESTMENT COULD BRING THIS 2- AND 3-WHEELER BATTERY PLAY ONLINE BY 2019
05: ACTIONABLE SOLUTIONS
ACTION POTENTIAL ACTORS MILESTONES RESOURCES
Identify a domestic manufacturing plant to develop modular batteries with a standard form factor for sale to OEMs with compatible 2- and 3-wheelers
• Department of Heavy Industry
• Private-sector partner(s)
• Investors
• 2017: Identify a private-sector partner(s) and investors to finance and develop a battery manufacturing plant
• 2018: Begin production and work with OEMs on compatible designs
• Fiscal and budgetary support
Build swapping stations managed privately or jointly by utilities, DISCOMS, and OEMs; offer preferential electricity tariffs
• Ministry of Power
• Ministry of Finance
• Ministry of Urban Development
• OEMs
• 2017: Develop plan for cost-effectively siting and building swapping stations
• 2018: Design a special rate class for battery swapping facilities
• Central forum for hosting and convening relevant stakeholders
Develop an integrated payment and tracking system that enables seamless, cashless payment and a high level of transparency and accountability
• NITI Aayog
• Ministry of Power
• Ministry of Finance
• Academia and NGOs
• IT-sector partners
• Utilities, DISCOMS, OEMs
• 2017: Identify provider for GPS-enabled payment chips and software
• 2018: Work with utilities, DISCOMS, and OEMs to roll out this platform
• Research and technical support
Standardized, smart, swappable batteries for 2- and 3-wheelers

94 | INDIA LEAPS AHEAD: TRANSFORMATIVE MOBILITY SOLUTIONS FOR ALL
THE RIGHT BUSINESS MODEL COULD RAPIDLY SCALE ELECTRIC VEHICLES WHILE SAVING CONSUMERS MONEY
05: ACTIONABLE SOLUTIONS
CASE STUDY
• Gogoro Smartscooter60:
» Fast swapping, quality features: Gogoro’s 2-wheel EV features swappable 9 kg batteries, which owners can self-swap at ATM-sized Gogoro stations in 6 seconds, and impressive stats (range: 97 km; acceleration from 0–50 km/h: 4.2 sec.)
» Affordable, modular charging infrastructure: Gogoro’s small-size, low-cost (USD 10,000) charging station design enables fast, modular EVSE deployment, an important solution to charging’s infrastructure problem
» Challenges with battery ownership, charging fees, and price point: Owners can’t purchase and own batteries for home charging, and are subject to the manufacturer’s charging rates; at ~USD 4,000, the price point is high for the 2-wheeler market
• Better Place61:
» Risk-reward profile: Expensive vehicles, monthly swapping fees, and swapping stations made it difficult for customers to justify high risk
» Automaker buy-in: Better Place faced a significant challenge in convincing automakers to design compatible vehicles
» Chicken-and-egg dilemma: High cost inhibited rapid swapping-station network growth, a key enabler for Better Place’s business model
• E-bikes in Asia: Bloomberg data show 2016 e-bike sales of 32.8 million units in the Asia-Pacific region; with high growth forecasts, India may want to complement s wappable batteries for larger scooters with smaller, plug-in e-bikes for first- and last-mile connectivity
INDIA-SPECIFIC IMPACT
• Hero Electric already offers a swappable battery that drivers can carry with them for additional range; while it isn’t modular, it shows Indian OEMs are exploring this space62
• TCO for high-speed electric scooters (e.g., Yo Spark) is only ~7% higher than conventional models (e.g., Honda Activa 3G) with FAME incentives; this value includes the battery capital cost and O&M costs, the latter of which includes 1–2 lead-acid battery replacements per year (23 of 24 FAME-eligible 2-wheeler models run on lead-acid batteries)63
• There has also been discussion around whether EVs, especially 2- and 3-wheelers and commercial EVs, should be exempt from vehicle permits, a potentially powerful nonfiscal incentive for these two market segments64
• Rapid electrification of important market segments; more affordable and efficient mobility, especially in low-income urban areas; and distributed storage for India’s growing share of variable renewable energy are possible with this technology play
Standardized, smart, swappable batteries for 2- and 3-wheelers

IMPACT OF THE TRANSFORMATION06

96 | INDIA LEAPS AHEAD: TRANSFORMATIVE MOBILITY SOLUTIONS FOR ALL
Computational models at both the city and national levels were used to
evaluate future impacts of such a transformative mobility future.
A city-level model provides estimates for capital investments required to
realize different mobility paradigms in urban environments. This model
assumes a relatively developed, hypothetical city with 1 crore inhabitants.
At the national level, a motorized-passenger-transport model estimates the
energy and environmental impacts of various potential levers, including
fleet electrification, growth in mobility services, a higher share of public
transit, and better urban design. This model uses a combination of historical
indices, including driving behaviour and vehicle mix, and future GDP
projections to estimate demand for road-based mobility. At the centre of
this model is a well-studied relationship between growth in income levels
and demand for mobility. Many developed countries—including Australia,
Japan, Germany, and the U.S.—have followed this S-curve trajectory in
which demand is low at low income levels and grows exponentially with
income, eventually plateauing at higher levels of income. Country-specific
demographic, social, and cultural parameters, including population density
and incentives for private and transit ridership, drive this saturation point
for mobility demand.
This national model can be configured to represent different mobility and
GDP growth scenarios. In this chapter, we present a moderate GDP growth
rate (6.7%/y), which aligns with NITI Aayog’s IESS 2047 modeling efforts, for
two scenarios: Business-As-Usual and a Transformative Mobility Paradigm.
All numbers presented in this analysis should not be seen as projections for
India’s transportation sector, but rather as estimates of potential impact for
specific scenarios.
06: IMPACT OF THE TRANSFORMATION
Potential impact of a mobility transformation
QUANTITATIVE ESTIMATES OF A SHARED, ELECTRIC, AND CONNECTED MOBILITY FUTURE IN INDIA

97 | INDIA LEAPS AHEAD: TRANSFORMATIVE MOBILITY SOLUTIONS FOR ALL
06: IMPACT OF THE TRANSFORMATION: HYPOTHETICAL CITY MODEL
Options for future development in a hypothetical city with 1 crore population
FIGURE 5: CITY-LEVEL MODEL ASSUMPTIONS (LEFT) AND OUTPUTS
(RIGHT) SHOWING COST BREAKDOWNS, IN PERCENTAGE TERMS, FOR A
BASELINE SCENARIO AND FOUR ALTERNATIVE SCENARIOS WITH DIFFERENT
EMPHASES—PRIVATE-VEHICLE OWNERSHIP, SHARED VEHICLES, PUBLIC
TRANSIT, AND MOBILITY-ORIENTED DEVELOPMENT
PRIVATE VEHICLE
SHARED VEHICLE
PUBLIC TRANSIT
BIKE/WALK
RICKSHAW
BASELINEPRIVATE VEHICLE
EMPHASISSHARED VEHICLE
EMPHASIS
PUBLIC TRANSIT EMPHASIS
MOD EMPHASIS
CITY DEMOGRAPHICS*
POPULATION 1,00,00,000
DENSITY 11,000/sq. km.
SIZE 910 sq. km.
TRAVEL DISTANCE 10 km/citizen/day
VEHICLE ECONOMICS (USD/KM)*
PRIVATE PETROL 4W ICE 0.27
PRIVATE 4W EV 0.20
SHARED 4W PETROL VEHICLE 0.20
SHARED 4W EV VEHICLE 0.09
PUBLIC TRANSIT 0.10
WALK/BIKE 0
* The example city is based on New Delhi statistics. Vehicle economics are operating expenses (these values were provided by the Government of India). A shared vehicle is representative of an UBER ride.

98 | INDIA LEAPS AHEAD: TRANSFORMATIVE MOBILITY SOLUTIONS FOR ALL
06: IMPACT OF THE TRANSFORMATION: HYPOTHETICAL CITY MODEL
Mobility-oriented development (MOD) provides the least-cost option
FIGURE 6: CITY-LEVEL MODEL
OUTPUTS SHOWING RELATIVE
INVESTMENT REQUIREMENTS,
IN PERCENTAGE TERMS, OF THE
BASELINE SCENARIO (INDEXED
TO 100%) AND THE FOUR
ALTERNATIVE SCENARIOS
LANE-KM OF ROAD
PUBLIC TRANSIT VEHICLES
PARKING SPACES
AUTOMOBILES
Baseline
Private Vehicle
Shared Vehicle
Public Transit
MOD
0% 50% 100% 150% 200% 250%
RELATIVE INVESTMENT IMPACTS BY SCENARIO*(BASELINE INDEXED TO 100%)
* Assumption: Indian demand for mobility doubles to 20 km/citizen/day, though population and density remain constant. For comparison, U.S. urban transport demand is 40 km/citizen/day (80% by private vehicle). Infrastructure costs are based on Colorado, U.S.

99 | INDIA LEAPS AHEAD: TRANSFORMATIVE MOBILITY SOLUTIONS FOR ALL
06: IMPACT OF THE TRANSFORMATION
Modeling mobility-oriented development, mobility services, and vehicle electrification at the national level
• Results from a hypothetical city model indicate that mobility-
oriented development provides the least cost pathway for
infrastructure development
• Next, a national-level model estimates the energy and environmental
benefits of adopting this pathway at a national level
• At the national level, synergistic effects of mobility services,
mobilityoriented development, and vehicle electrification result in
significantly lower energy demand and emissions:
» Mobility services increase vehicle utilisation, making
electrification cost-effective
» Mobility-oriented development and better, more accessible
public transportation, coupled with a lower number of private
vehicles, lead to lower pollution and congestion in cities
» These changes make urban environments more walkable
and bike-friendly, while turning land used for parking and
vehicles into commercial spaces and green areas promote
economic activity

100 | INDIA LEAPS AHEAD: TRANSFORMATIVE MOBILITY SOLUTIONS FOR ALL
06: IMPACT OF THE TRANSFORMATION: NATIONAL MODEL
National model: key inputs and assumptions
SCENARIO* DESCRIPTION
Business-as-Usual
• Cities designed for vehicles
• Private-vehicle ownership
Business-as-Usual
Transformative Mobility FutureShared, electric, connected
• High electrification, shared vehicle fleets, and high public transit in well-designed urban environments
Better urban design and increased connectivity encourages high use of public transit and service vehicles, lowering demand for private-vehicle ownership. Vehicles for mobility services and public transit are electric, while 40% of private vehicles are electrified
• Vehicle stock by type, fuel, ownership
• Annual vehicle utilisation (km/vehicle)
• Vehicle occupancy
• Gross domestic product
• Population
• Utilisation saturation level (VKT/cap)
• Vehicle cost (including O&M cost)
• Fuel cost
Inpu
t Dat
a • Energy demand projections
• CO2 emissions
• Vehicle stock by type, fuel mix, ownership mix
• Vehicle sales by type, fuel mix, ownership mix
2030
Pro
ject
ions
* Data presented on this slide are based on RMI’s modeling of a medium-growth scenario. This scenario is based on historical macroeconomic data including GDP/capita from the World Bank and a 2015–2030 GDP compound annual growth rate of 6.7%, which aligns with NITI Aayog’s IESS 2047 modeling efforts.

101 | INDIA LEAPS AHEAD: TRANSFORMATIVE MOBILITY SOLUTIONS FOR ALL
06: IMPACT OF THE TRANSFORMATION: NATIONAL MODEL
Modal split, ownership mix, and electric share
CATEGORY2015
ALL SCENARIOS (%)2030
BAU (%) Transformative (%)
Ownership Mix of 4 Wheel† Private Commercial
7327
7723
5050
Percent Electric†† 2 Wheel 3 Wheel 4 Wheel Personal Commercial Public Transit
00
000
55
151
40100
40 BEV100 BEV
100
FIGURE 7: NATIONAL-LEVEL MODEL ASSUMPTIONS, INCLUDING MODAL SPLIT (TOP),
OWNERSHIP MIX (BOTTOM), AND ELECTRIFICATION RATE BY VEHICLE SEGMENT (BOTTOM)
2 WHEEL
3 WHEEL
4 WHEEL
PUBLIC TRANSIT
100%
80%
60%
40%
20%
0%2015 All Scenarios
MODAL SPLIT WITH RESPECT TO PASSENGER KILOMETRES
2030 BAU 2030 Transformative
* Data presented on this slide are based on RMI’s modeling of a medium-growth scenario. This scenario is based on historical macroeconomic data including GDP/capita from the World Bank and a 2015–2030 GDP compound annual growth rate of 6.7%, which aligns with NITI Aayog’s IESS 2047 modeling efforts.
† With respect to vehicle kilometers per vehicle type †† With respect to number of vehicles per vehicle type and ownership

102 | INDIA LEAPS AHEAD: TRANSFORMATIVE MOBILITY SOLUTIONS FOR ALL
06: IMPACT OF THE TRANSFORMATION: NATIONAL MODEL
A shared, electrified, and high-public transit future can reduce transportation energy requirements by 64%
2030: Motorized passenger transport energy consumption is 64% lower than BAU, resulting in an annual reduction of 156 Mtoe in diesel and petrol
consumption for that year, saving Rs 3.9 lakh crore or USD ~60 billion (at USD 52/bbl of crude). Cumulative savings between 2017–2030 are 876 Mtoe for
petrol and diesel, worth Rs 22 lakh crore or USD ~330 billion. This reduction in energy consumption results from a synergistic impact of improvements in:
• Urban design, where a larger fraction of mobility demand is met by nonmotorized transit and public transit
• Mobility services, where use of public transit and service fleet is preferred over the use of personally owned vehicles
• Segment-wise electrification of most vehicles, starting with those that are economically viable in the near-term" following "Mobility services, where use of
public transit and service fleet is preferred over the use of personally owned vehicles
FIGURE 8: . MODELED ENERGY REQUIREMENT (IN MILLIONS OF TONNES OF OIL EQUIVALENT) FOR PASSENGER MOBILITY IN INDIA FOR “BUSINESS-AS-
USUAL” (BAU) AND “TRANSFORMATIVE” SCENARIOS, 2015–2030
* Data presented on this slide are based on RMI’s modeling of a medium-growth scenario. This scenario is based on historical macroeconomic data including GDP/capita from the World Bank and a 2015–2030 GDP compound annual growth rate of 6.7%, which aligns with NITI Aayog’s IESS 2047 modeling efforts.
BAU TRANSFORMATIVE
250
200
150
100
50
0
2015 2016 2017 2018 2019 2020 2021 2022 2023 2024 2025 2026 2027 2028 2029 2030
ENERGY CONSUMPTION FROM MOTORIZED PASSENGER TRANSPORT
Ener
gy re
quire
men
t (M
toe)
-64%

103 | INDIA LEAPS AHEAD: TRANSFORMATIVE MOBILITY SOLUTIONS FOR ALL
06: IMPACT OF THE TRANSFORMATION: NATIONAL MODEL
Passenger transportation emissions are reduced by 37% from business-as-usual with the increased adoption of renewables
• 2030: Emissions of CO2 from motorized passenger transport are 37% lower than BAU. This assumes that India has met its NDC targets from Paris Climate
Agreement—100 GW solar and 60 GW wind—by 2022*
• The cumulative emissions reduction through 2030 is 1 gigatonne of CO2
• With a goal of 175 GW (100 GW solar and 60 GW wind) of renewable energy by 2022, India is starting on the path to deploying renewable energy and
electric vehicles in parallel to realize the full potential of the system
FIGURE 9: MODELED CO2 EMISSIONS (IN MILLIONS OF TONNES OF CO
2) FOR PASSENGER MOBILITY IN INDIA FOR “BUSINESS-AS-USUAL” (BAU) AND
“TRANSFORMATIVE” SCENARIOS, 2015–2030
* Hourly weighted grid-emissions factors sourced from NDC compliant scenario in Abhyankar, et al., All electric passenger vehicle sales in India by 2030: Value proposition to electric utilities, government, and vehicle owners, LBNL (upcoming)
** Data presented on this slide are based on RMI’s modeling of a medium-growth scenario. This scenario is based on historical macroeconomic data including GDP/capita from the World Bank and a 2015–2030 GDP compound annual growth rate of 6.7%, which aligns with NITI Aayog’s IESS 2047 modeling efforts.
BAU TRANSFORMATIVE
700
600
500
400
300
200
100
02015 2016 2017 2018 2019 2020 2021 2022 2023 2024 2025 2026 2027 2028 2029 2030
CO2 EMISSIONS FROM MOTORIZED PASSENGER TRANSPORT
Mill
ion
tonn
es C
O2 p
er y
ear
-37%

104 | INDIA LEAPS AHEAD: TRANSFORMATIVE MOBILITY SOLUTIONS FOR ALL
06: IMPACT OF THE TRANSFORMATION: NATIONAL MODEL
A transformed mobility system can deliver the same total mobility with fewer vehicle-km, reducing congestion and pollution
2030: Vehicle-kilometres traveled (VKT) are 13% lower than BAU, resulting in lower congestion and faster average speeds
FIGURE 10: MODELED VEHICLE MOBILITY (IN TRILLIONS OF VEHICLE-KILOMETRES TRAVELED, LEFT Y-AXIS) AND PERSONAL MOBILITY (IN THOUSANDS OF
PASSENGER-KILOMETRES PER CAPITA) IN INDIA FOR “BUSINESS-AS-USUAL” (BAU) AND “TRANSFORMATIVE” SCENARIOS, 2015–2030
PKM/CAP BAU TRANSFORMATIVE
7
6
5
4
3
2
1
0
2015 2016 2017 2018 2019 2020 2021 2022 2023 2024 2025 2026 2027 2028 2029 2030
PASSENGER- VS. VEHICLE-KILOMETRES
20,000
18,000
16,000
14,000
12,000
10,000
8,000
6,000
4,000
2,000
0
Veh
icle
-km
(tril
lions
)
Pass
enge
r-km
per
cap
ita
* Data presented on this slide are based on RMI’s modeling of a medium-growth scenario. This scenario is based on historical macroeconomic data including GDP/capita from the World Ban and a 2015–2030 GDP compound annual growth rate of 6.7%, which aligns with NITI Aayog’s IESS 2047 modeling efforts.

105 | INDIA LEAPS AHEAD: TRANSFORMATIVE MOBILITY SOLUTIONS FOR ALL
06: IMPACT OF THE TRANSFORMATION: NATIONAL MODEL
The transformative scenario delivers the same access with 6 crore fewer vehicles
2030: Total number of motorized vehicles is 10% lower than BAU and EVs increase 9-fold in number
FIGURE 11: MODELED FLEET SIZE (IN MILLIONS OF VEHICLES) AND BREAKDOWN BY VEHICLE TYPE AND TECHNOLOGY (I.E., EV OR ICE) IN INDIA FOR
“BUSINESS-AS-USUAL” (BAU) AND “TRANSFORMATIVE” SCENARIOS, 2016–2030
PUBLIC TRANSIT EV
PUBLIC TRANSIT ICE
AUTO-RICKSHAWS EV
AUTO-RICKSHAWS ICE
CARS & JEEPS EV
CARS & JEEPS ICE
MOTORCYCLES & SCOOTERS EV
MOTORCYCLES & SCOOTERS ICE
700
600
500
400
300
200
100
0
2015 2020 2025 2030
VEHICLES BY TYPE AND FUEL (EV OR ICE)
BA
U
Tran
sfor
mat
ive
BA
U
Tran
sfor
mat
ive
BA
U
Tran
sfor
mat
ive
BA
U
Tran
sfor
mat
ive
Num
ber o
f Veh
icle
s (m
illio
ns)
* Data presented on this slide are based on RMI’s modeling of a medium-growth scenario. This scenario is based on historical macroeconomic data including GDP/capita from the World Ban and a 2015–2030 GDP compound annual growth rate of 6.7%, which aligns with NITI Aayog’s IESS 2047 modeling efforts

106 | INDIA LEAPS AHEAD: TRANSFORMATIVE MOBILITY SOLUTIONS FOR ALL
06: IMPACT OF THE TRANSFORMATION: NATIONAL MODEL
Shifting to electric vehicles enhances energy security and reduces India’s oil-import dependence
FIGURE 12: MODELED ENERGY REQUIREMENT (IN MILLIONS OF TONNES OF OIL EQUIVALENT) FOR PASSENGER MOBILITY IN INDIA BY FUEL TYPE (I.E., CNG,
DIESEL, PETROL, OR ELECTRICITY) FOR “BUSINESS-AS-USUAL” (BAU) AND “TRANSFORMATIVE” SCENARIOS, 2015–2030
CNG
DIESEL
PETROL
ELECTRIC
250
200
150
100
50
0
2015 2020 2025 2030
ENERGY REQUIREMENT BY FUEL TYPEA
ll sc
enar
ios
BA
U
Tran
sfor
mat
ive
BA
U
Tran
sfor
mat
ive
BA
U
Tran
sfor
mat
ive
Ener
gy re
quire
men
t (M
toe)
* Data presented on this slide are based on RMI’s modeling of a medium-growth scenario. This scenario is based on historical macroeconomic data including GDP/capita from the World Ban and a 2015–2030 GDP compound annual growth rate of 6.7%, which aligns with NITI Aayog’s IESS 2047 modeling efforts.

CONCLUSION: A CHANGE MODEL TO SCALE SOLUTIONS RAPIDLY07

108 | INDIA LEAPS AHEAD: TRANSFORMATIVE MOBILITY SOLUTIONS FOR ALL
A CALL TO ACTION AT THE TRANSFORMATIVE MOBILITY SOLUTIONS CHARRETTE FROM SHRI NITIN GADKARI, MINISTER OF ROAD TRANSPORT AND HIGHWAYS OF INDIA:
“[Mobility transformation] will be a game changer in every manner for
our country. And you have called us all for this today. There are so many
departments under this. Each has separate work. But whom do we hold
responsible? Only if you say then something can be done. So there are
many such small things which are immediate solutions. Some are long-term
policies as well. I have faith that since you have touched upon this topic
then there will be synchronisation on this quickly and transparent and time-
bound decisions will be taken which will save the country from pollution.
Otherwise our health will also suffer. That is why you have taken up this
issue and I would like to thank you for the same.” (Translated from Hindi)
27 February 2017, Transformative Mobility Solutions for India Charrette,
New Delhi, India
07: CONCLUSION: A CHANGE MODEL TO SCALE SOLUTIONS RAPIDLY
A new mobility future is within India’s reach
MANY GOVERNMENT, INDUSTRY, AND THOUGHT LEADERS SHARE A VISION OF INDIA’S MOBILITY FUTURE—AND THE COUNTRY IS ON THE VERGE OF TRANSFORMATION
India has extraordinary alignment of vision and a set of empowering, supporting conditions that can enable a leapfrog in mobility. A change model designed to capture economic market segments and speed geographic scaling through a learning platform and state-level change labs can accelerate India’s progress towards national adoption of a shared, electric, and connected mobility system.

109 | INDIA LEAPS AHEAD: TRANSFORMATIVE MOBILITY SOLUTIONS FOR ALL
07: CONCLUSION: A CHANGE MODEL TO SCALE SOLUTIONS RAPIDLY
India benefits from a generally aligned vision for a shared, electric, and
connected mobility system. Urgency exists to deliver on this vision with
accelerated change and rapid scaling of solutions. To translate vision into
action, India could establish a change model designed to achieve nonlinear
growth. Two interdependent and reinforcing aspects of a change model,
connected by a learning platform, can support mobility transformation and
help overcome the challenge’s complexity. One, harnessing market forces
through targeted policies can enable a business-led mobility transformation
with minimal subsidy. Two, regional change labs that help pilot and test
solutions at an accelerated pace can chart a course for experimentation and
learning to inform national deployment. Connecting regional change labs to
each other and to central government policy formulation can ensure greater
coordination and efficiency across the system.
Market segment transformation at a national scale By harnessing market forces to move successive sets of market segments
to scale as they become economic, India can achieve market-wide
transformation. This approach avoids heavy reliance on public funds or
subsidy. Targeting several segments that are currently economic for national
adoption can lay the foundation for a thriving market. Proven strategies to
drive down costs can shift the nearly economic opportunities to economic
ones. Smart policies and investments in manufacturing and infrastructure
can turn uneconomic opportunities into economic ones over time.
National learning platform to document insights and spread solutionsEstablishing a learning platform and resource bank of best practices to
capture insights from distributed pilots can ensure coordination
between national-level efforts and regional innovation. The learning
platform can support central government policy formulation and serve
as a knowledge bank of best practices and effective approaches to
financing and executing mobility projects. The learning platform can also
serve as a venue to drive alignment and build commitment by serving an
important convening function.
State-level change laboratories to integrate systems Regional change laboratories that focus on scaling through rapid learning
and prototyping can support system integration across India as it builds
the foundation for market-wide transformation. Testing, validating, and
assembling components of the new mobility system in several “lighthouse”
regions can help India prepare for national deployment. The insights and
strategies developed in these change labs can inform national regulatory
and policy processes as more segments in the national market become
economic. Engaging states as the primary champions and hosts of the
change labs can leverage India’s model of cooperative federalism.
Building capacity to accelerate the pace of change
CAPTURE ECONOMICALLY-VIABLE OPPORTUNITIES AT A NATIONAL SCALE AND DEMONSTRATE EMERGING OPPORTUNITIES AT A STATE LEVEL TO SPEED THE DEPLOYMENT AND INTEGRATION OF SOLUTIONS

110 | INDIA LEAPS AHEAD: TRANSFORMATIVE MOBILITY SOLUTIONS FOR ALL
07: CONCLUSION: A CHANGE MODEL TO SCALE SOLUTIONS RAPIDLY
By harnessing market forces to move successive sets of market segments to scale as they become economic, India can achieve market-wide
transformation. This approach avoids a heavy reliance on public funds or subsidies and focuses on accelerated scaling of electric vehicle-kilometres
and electric passenger-kilometres. Targeting several segments that are currently economic can lay the foundation for a thriving market. Proven
strategies can shift nearly economic opportunities to economic ones and smart policies and investments in manufacturing and infrastructure can shift
the uneconomic opportunities to economic ones over time.
Pursuing economic market segment transformation
TARGETING MARKET SEGMENTS TO ACHIEVE RAPID SCALE AT THE NATIONAL LEVEL
CURRENTLY ECONOMIC
• Invest in supportive infrastructure and target policy to immediately scale segments of the market that are economically viable
• Develop economies of scale in a few initial segments to lay the foundation for a market-wide transformation
• Such segments include private electric 2-wheeler and commercial electric 3-wheelers
• Each E-bike saves 350 kg of CO2 emissions each year (accounting for emissions from electricity generation)65
CAPITAL COST * OPERATING COST*
Electric 2-wheeler** Rs 34,000–50,000 Rs 0.06–0.4/km
ICE 2-wheeler Rs 25,000–70,000 + Rs 1–1.5/km
Electric rickshaw Rs 80,000–150,000 Rs 0.45–1/km
ICE rickshaw Rs 144,000–300,000
Rs 1.84/km CNGRs 3.5/km petrol Rs 2.6/km diesel
EVENTUALLY ECONOMIC
• Make selective investments in infrastructure and manufacturing that move uneconomic sectors close to cost-effectiveness over time
• Eventually economic segments include private electric four-wheel vehicles and public electric shuttles and buses
• Some electric buses remain 10x more expensive than their ICE alternatives; however, smaller swappable batteries may be able to reduce this premium66
NEARLY ECONOMIC
• Employ proven strategies such as aggregated procurement, reverse auctions, and high-utilisation business models to unlock opportunities that are nearly economic
• Nearly economic segments include electric commercial 4-wheel vehicles
• Each electric 4-wheel taxi saves up to 28 tons of CO2 each year
CAPITAL COST * OPERATING COST*
Electric service vehicle (e20)
Rs 700,000 Rs 2/km
ICE service vehicle (Swift)
Rs 480,000–740,000
Rs 3.5/km
CAPITAL COST * OPERATING COST*
Electric bus Rs 2.6 crores Rs 10/km
Diesel bus Rs 20–88 lakhs Rs 15–23/km
* Capital cost is an average of sticker prices across various models; operating cost is for fuel or electricity only, not maintenance or other operating costs** It is important to note that electric 2- and 3-wheelers do not yet have the same product performance as ICEs, especially when it comes to top speed

111 | INDIA LEAPS AHEAD: TRANSFORMATIVE MOBILITY SOLUTIONS FOR ALL
07: CONCLUSION: A CHANGE MODEL TO SCALE SOLUTIONS RAPIDLY
A national learning platform that enables strategic alignment and cross-sharing of learning and resources can support and accelerate the goals of
the central government. Composed of representatives from central government, regional governments, private sector, academia, and NGOs, this
learning platform can serve as a connection hub between state-led and regional efforts, central-government planning and policies, and private-sector
investment strategies. It can also provide states and cities with tools to move from demonstration projects to rapid scaling, serve as a central resource
library for new mobility solutions, and create a platform for ongoing discussion and debate among diverse stakeholders.
THE KEY FUNCTIONS OF THE LEARNING PLATFORM ARE:
Establishing a learning platform
A NATIONAL LEARNING PLATFORM CAN COORDINATE AND PRIORITIZE ACTIONS
COORDINATION ACROSS CENTRAL GOVERNMENT
• Create alignment and consistency across central government programmes and incentives
• Provide coordination among government agencies and other actors (private sector, academia, NGOs, etc.)
• Establish a centralized knowledge bank that can support market-wide transformation based on the documented impact of regional experiments
SUPPORT TO STATES AND REGIONS
• Provide regional efforts with connections to knowledge and financing to bolster their local projects and inform decisions
• Create central resource library to equip states with shared tools
• Build capacity in areas of high need through focused training and accelerator programmes
• Eliminate duplication by centralizing efforts and matching city needs with resources and capacity
STRATEGY TO CAPTURE MARKET SEGMENTS
• Generate opportunities to customize policy frameworks to capture economic market segments
• Ensure that central-government and local policies are coordinated and integrated

112 | INDIA LEAPS AHEAD: TRANSFORMATIVE MOBILITY SOLUTIONS FOR ALL
07: CONCLUSION: A CHANGE MODEL TO SCALE SOLUTIONS RAPIDLY
Functions of a national learning platform
CIVIL SOCIETY
Representation from stakeholders of the mobility system
Information flows in and outof the learning platform
CENTRALGOVERNMENT
NATIONALLEARNINGPLATFORM
Too
ls a
nd
Re
sou
rce
s
Cre
ate
s S
ha
red
Drive
s Stra
tegic
Alig
nment
Coordinates Policy
Formulation
Ca
pacity
Bu
ilds Te
chnical
Establishes Network
of Pilot Projects
STATE/REGIONALGOVERNMENTPRIVATE SECTOR
The learning platformhas several key functions
FIGURE 13: NATIONAL LEARNING PLATFORM
FOR INDIA’S MOBILITY SYSTEM DESIGNED
TO SCALE SOLUTIONS RAPIDLY THROUGH
EXPERIMENTATION, LEARNING, KNOWLEDGE
EXCHANGE, COOPERATION, AND CAPACITY
BUILDING

113 | INDIA LEAPS AHEAD: TRANSFORMATIVE MOBILITY SOLUTIONS FOR ALL
07: CONCLUSION: A CHANGE MODEL TO SCALE SOLUTIONS RAPIDLY
India’s goals to achieve shared, connected, and electric mobility by 2030 can be supported by state and regional leadership to create lighthouse
regions that demonstrate whole-systems approaches to mobility transformation. Establishing local change labs to conduct the requisite learning about
system integration across various aspects of the mobility sector and to chart a course for eventual scaling and deployment at a national level can
support India’s transformation with bottom-up solutions. By developing new solutions and creating a platform for collaboration and demonstration,
the regional change labs can prepare India for integrative solutions at a national scale. The change labs, by design, have connections to the learning
platform to ensure insight and resource sharing, as well as strategic alignment with the central government’s goals.
THE KEY FUNCTIONS OF THE CHANGE LABS ARE TO FOSTER:
Developing regional lighthouse examples
STATE-LEVEL CHANGE LABS CAN INTEGRATE SOLUTIONS AND SHARE BEST PRACTICES
INNOVATION AND EXPERIMENTATION
• Develop solutions to meet the goals of the Indian government, customized to local conditions
• Support and encourage deployment of new business models and market solutions
• Maintain an inclusive and iterative process to address system complexity
DEMONSTRATION
• Pilot integrated solutions and create practical and measureable pilots
• Demonstrate that sustainable mobility is cost-effective
• Prove the technical integration of the new mobility system
• Document and share the impact of the solutions
COLLABORATION
• Pursue private-public partnerships and multistakeholder collaborations
• Establish a system where Indian states collaborate in knowledge sharing to ensure that best practices are replicated and mistakes are not repeated.

114 | INDIA LEAPS AHEAD: TRANSFORMATIVE MOBILITY SOLUTIONS FOR ALL
07: CONCLUSION: A CHANGE MODEL TO SCALE SOLUTIONS RAPIDLY
A two-part change model to guide India’s mobility transformation
INDIA REACHES A TIPPING POINTin the deployment of shared,
electric, and connected mobility
MARKET TRANSFORMATIONby targeting successive sets of economic market segments
STATE/REGIONAL LEVEL EXPERIMENTATION AND INTEGRATION to assemble whole systems solutionsin lighthouse regions
CurrentlyEconomic
NearlyEconomic
EventuallyEconomic
Scaled Manufacturing
State/RegionalGovernments
SystemIntegration
SharedInfrastructureDevelopemt
NATIONAL LEARNING PLATFORM integrates interdependent and reinforcing aspects of the change model to support India's mobility system transformation
Experimentation and Integration
Feedback loops deliver information and learningback to the market and state/regionalgovernments for integration
Change Model v.5bThe learning platform supports mobility transformation as economic market segments are captured, and insights from state/regional experimentation and integration are applied.
Inputs from ongoing market segment transformation inform the process, creating the foundation for national change
Insights from state/regional experimentation continuously support system-wide integration
FIGURE 14: TWO-TRACK
CHANGE MODEL DESIGNED TO
TRANSFORM INDIA’S MOBILITY
SYSTEM THROUGH DEPLOYMENT
OF MARKET-READY SOLUTIONS
NATIONALLY AND INTEGRATION
OF THESE SOLUTIONS IN
LIGHTHOUSE REGIONS
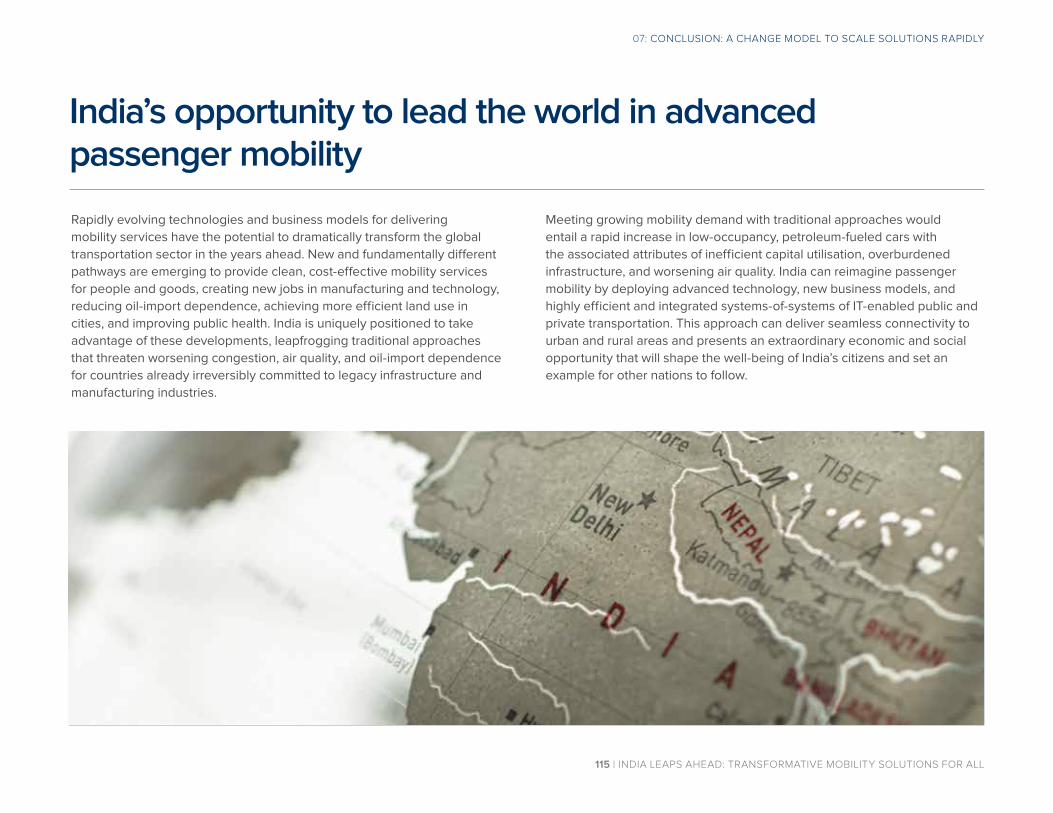
115 | INDIA LEAPS AHEAD: TRANSFORMATIVE MOBILITY SOLUTIONS FOR ALL
07: CONCLUSION: A CHANGE MODEL TO SCALE SOLUTIONS RAPIDLY
Rapidly evolving technologies and business models for delivering
mobility services have the potential to dramatically transform the global
transportation sector in the years ahead. New and fundamentally different
pathways are emerging to provide clean, cost-effective mobility services
for people and goods, creating new jobs in manufacturing and technology,
reducing oil-import dependence, achieving more efficient land use in
cities, and improving public health. India is uniquely positioned to take
advantage of these developments, leapfrogging traditional approaches
that threaten worsening congestion, air quality, and oil-import dependence
for countries already irreversibly committed to legacy infrastructure and
manufacturing industries.
India’s opportunity to lead the world in advanced passenger mobility
Meeting growing mobility demand with traditional approaches would
entail a rapid increase in low-occupancy, petroleum-fueled cars with
the associated attributes of inefficient capital utilisation, overburdened
infrastructure, and worsening air quality. India can reimagine passenger
mobility by deploying advanced technology, new business models, and
highly efficient and integrated systems-of-systems of IT-enabled public and
private transportation. This approach can deliver seamless connectivity to
urban and rural areas and presents an extraordinary economic and social
opportunity that will shape the well-being of India’s citizens and set an
example for other nations to follow.

116 | INDIA LEAPS AHEAD: TRANSFORMATIVE MOBILITY SOLUTIONS FOR ALL
07: CONCLUSION: A CHANGE MODEL TO SCALE SOLUTIONS RAPIDLY
• Reducing traffic fatalities: Deployment of new mobility solutions could
help to smooth traffic flows and reduce accidents that currently claim
more than 150,000 lives per year
• Improving air quality: Increased use of shared vehicles, fleet-based
services, electric vehicles, ride-sharing and better public transit could
help India address the problem of growing pollution in its cities,
enhancing public health, well-being, and productivity
• Better access to public transit: Leveraging new technologies to
complement an integrated approach to city planning and road-
network design will improve access to public transit for all citizens,
stimulating a feedback loop that leads to higher utilisation and more
effective and attractive user experience in buses and other public
transportation assets
• Decongesting roads and highways: Connecting modes through data
platforms can improve the efficiency of vehicle usage through next-
generation public transit, ride-sharing, and multimodal transport,
reducing congestion on city streets and highways, and consequently
cutting pollution, oil use, and lost time
• Reducing the direct and indirect costs of transportation for citizens: Optimized transportation systems reduce needs in road, parking, and
other infrastructure; by taking advantage of emerging Mobility-as-a-
Service approaches, Indians can benefit from the favorable economics
of high-utilisation electric-drive vehicles and high-quality public
transportation, reducing the burden of transportation on citizens
• Stimulating technology development and manufacturing: India’s ability
to rapidly scale markets for new types of vehicles, fleet-driven services,
A transformation with many benefits
THE EMERGENCE OF TRANSFORMATIVE TECHNOLOGIES AND BUSINESS MODELS ENABLE NEXT-GENERATION PASSENGER MOBILITY SOLUTIONS THAT HAVE THE POTENTIAL TO BRING UNIQUE BENEFITS AND OPPORTUNITIES TO INDIA IN MANY DIFFERENT DIMENSIONS, INCLUDING:
electric vehicles/buses, and other enabling technologies opens the door
for rapid economic development and job creation
• Accelerating India’s renewable energy goals: Smart deployment
of electric vehicles can dramatically mitigate the carbon intensity of
individuals as the economy grows, and electric vehicles acting as
“batteries on wheels” could help better manage India’s electric grid,
while also alleviating key electricity distribution system constraints
• Meeting India’s climate targets: India could also leverage these
transportation-sector solutions to slow the growth in carbon emissions
while advancing economic development goals

GLOSSARYG

118 | INDIA LEAPS AHEAD: TRANSFORMATIVE MOBILITY SOLUTIONS FOR ALL
G: GLOSSARY
Glossary (1/2)
TERM ACRONYM
UNITS
105 Lakh
107 Crore
Barrel Of Oil bbl
Carbon Dioxide CO2
Electric Passenger Kilometres Traveled ePKT
Electric Vehicle Kilometres Traveled eVKT
Gigawatt GW
Gram g
Indian Rupees Rs
Kilogram g
Kilometre km
Kilowatt-Hour kWh
Megawatt-Hour MWh
Million Tonnes Of Carbon Dioxide MTCO2
Million Tonnes Of Oil Equivalent Mtoe
Month mo
Passenger Kilometres Traveled PKT
Thousand k
Times, or fold x
TERM ACRONYM
U.S. Dollars USD
Vehicle Kilometres Traveled VKT
Year y
NON-UNIT TERMS
Autonomous Vehicle AV
Battery Electric Vehicle BEV
Business-As-Usual BAU
Compound Annual Growth Rate CAGR
Compressed Natural Gas CNG
Corporate Average Fuel Consumption AFC
Distribution Company DISCOM
Electric Vehicle EV
Electric Vehicle Supply Equipment EVSE
Faster Adoption And Manufacturing Of (Hybrid And) Electric Vehicles In India FAME
Forum Of Regulators FOR
Goods And Service Tax GST
Gross Domestic Product GDP
High-Occupancy Vehicle HOV
Hybrid Electric Vehicle HEV

119 | INDIA LEAPS AHEAD: TRANSFORMATIVE MOBILITY SOLUTIONS FOR ALL
G: GLOSSARY
Glossary (2/2)
TERM ACRONYM
Includes hybrid-electric vehicles, plug-in hybrid vehicles, battery electric vehicles, and fuel-cell electric vehicles
xEV
Information Technology IT
Intelligent Vehicle IV
Intermediate Public Transit IPT
Internal Combustion Engine ICE
Interoperable Transport Data ITD
Light-Emitting Diode LED
Light-Duty Vehicle LDV
Metropolitan Planning Council MPC
Mobility As A Service MaaS
Mobility-Oriented Development MOD
National Electric Mobility Mission Plan 2020 NEMMP-2020
Nationally Determined Contribution NDC
Nongovernmental Organization NGO
Operating And Maintenance O&M
Original Equipment Manufacturer OEM
Photovoltaic PV
Plug-In Hybrid Electric Vehicle PHEV
TERM ACRONYM
Prime Minister’s Office PMO
Quarter Q
Renewable Energy RE
Transportation Network Company TNC
Unified Metropolitan Planning Authority UMPA
Union Territory UT
Universal Payment Interface UPI
Valued Added Tax VAT
Vehicle-Grid Integration VGI
Zero-Emissions Vehicle ZEV

APPENDIX A

A-1: Quantifying the impact of a mobility transformationMODELING RESULTS

122 | INDIA LEAPS AHEAD: TRANSFORMATIVE MOBILITY SOLUTIONS FOR ALL
A-1: APPENDIX
National model results
RESULT
2030
BAU Transformative
GDP Growth @ 5.8% CAGR
GDP Growth @ 6.7% CAGR
GDP Growth @ 7.4% CAGR
GDP Growth @ 5.8% CAGR
GDP Growth @ 6.7% CAGR
GDP Growth @ 7.4% CAGR
GDP/capita (2014-15 USD) 3813 4330 4776 3813 4330 4776
Vehicle-kilometres (trillion km) 5.6 6.6 7.2 4.9 5.7 6.3
Energy consumption (Mtoe) 185 216 239 67 78 86
CO2 Emissions (million tonnes per year) 512 596 659 320 373 412
# vehicles (millions) 562 598 662 662 538 595
Percent of vehicles electrified (%) 4 44
SIDE BY SIDE COMPARISON OF MODEL OUTPUTS FOR DIFFERENT LEVELS OF 2015 - 2030 ECONOMIC GROWTH; GROSS DOMESTIC PRODUCT COMPOUND ANNUAL GROWTH RATES OF 5.8%, 6.7%, AND 7.4%
FIGURE A-1: SELECT NATIONAL-LEVEL MODEL OUTPUTS FOR 2030 USING THREE DIFFERENT ANNUAL 2015 - 2030 GDP GROWTH RATES, “BUSINESS-AS-
USUAL” (BAU) SCENARIO VS. “TRANSFORMATIVE” SCENARIO

123 | INDIA LEAPS AHEAD: TRANSFORMATIVE MOBILITY SOLUTIONS FOR ALL
A-1: APPENDIX
National model results
LOW-GROWTH SCENARIO – GROSS DOMESTIC PRODUCT COMPOUND ANNUAL GROWTH RATE OF 5.8%
FIGURES A-2 TO A-5: NATIONAL-LEVEL MODEL OUTPUTS FOR USING AN ANNUAL GDP GROWTH RATE OF 5.8%, “BUSINESS-AS-USUAL” (BAU) SCENARIO VS.
“TRANSFORMATIVE” SCENARIO, 2015–20130
0
50
100
150
200
2015 2018 2021 2024 2027 2030 Ene
rgy
Req
uire
men
t (M
toe)
Energy Consumption from Motorized Passenger Transport
BAU Transformative
0
100
200
300
400
500
600
2015 2018 2021 2024 2027 2030
Mill
ion
tonn
es C
O2 p
er y
ear
CO2 Emissions from Motorized Passenger Transport
BAU Transformative
0
5000
10000
15000
0 1 2 3 4 5 6
2015 2018 2021 2024 2027 2030
Pas
seng
er-k
m p
er c
apita
Vehi
cle-
km (t
rillio
ns)
Passenger- vs. Vehicle-kilometres
PKM/CAP BAU Transformative
0
50
100
150
200
250
All
scen
ario
s
BA
U
Tran
sfor
mat
ive
BA
U
Tran
sfor
mat
ive
BA
U
Tran
sfor
mat
ive
2015 2020 2025 2030
Ene
rgy
Req
uire
men
t (M
toe)
Energy Requirement by Fuel Type Electric Petrol Diesel CNG
* Data presented on this slide are based on RMI’s modeling of a medium-growth scenario. This scenario is based on historical macroeconomic data including GDP/capita from the World Bank and a 2015–2030 GDP compound annual growth rate of 5.8%, which aligns with NITI Aayog’s IESS 2047 modeling efforts.

124 | INDIA LEAPS AHEAD: TRANSFORMATIVE MOBILITY SOLUTIONS FOR ALL
A-1: APPENDIX
National model results
MEDIUM-GROWTH SCENARIO – GROSS DOMESTIC PRODUCT COMPOUND ANNUAL GROWTH RATE OF 6.7%
FIGURES A-6 TO A-9: NATIONAL-LEVEL MODEL OUTPUTS FOR USING AN ANNUAL GDP GROWTH RATE OF 6.7%, “BUSINESS-AS-USUAL” (BAU) SCENARIO VS.
“TRANSFORMATIVE” SCENARIO, 2015–20130
0
50
100
150
200
250
2015 2018 2021 2024 2027 2030 Ene
rgy
Req
uire
men
t (M
toe)
Energy Consumption from Motorized Passenger Transport
BAU Transformative
0 100 200 300 400 500 600 700
2015 2018 2021 2024 2027 2030 Mill
ion
tonn
es C
O2 p
er y
ear
CO2 Emissions from Motorized Passenger Transport
BAU Transformative
0
5000
10000
15000
20000
0 1 2 3 4 5 6 7
2015 2018 2021 2024 2027 2030
Pas
seng
er-k
m p
er c
apita
Vehi
cle-
km (t
rillio
ns)
Passenger- vs. Vehicle-kilometres
PKM/CAP BAU Transformative
0
50
100
150
200
250
All
scen
ario
s
BA
U
Tran
sfor
mat
ive
BA
U
Tran
sfor
mat
ive
BA
U
Tran
sfor
mat
ive
2015 2020 2025 2030
Ene
rgy
Req
uire
men
t (M
toe)
Energy Requirement by Fuel Type Electric Petrol Diesel CNG
* Data presented on this slide are based on RMI’s modeling of a medium-growth scenario. This scenario is based on historical macroeconomic data including GDP/capita from the World Bank and a 2015–2030 GDP compound annual growth rate of 6.7%, which aligns with NITI Aayog’s IESS 2047 modeling efforts.
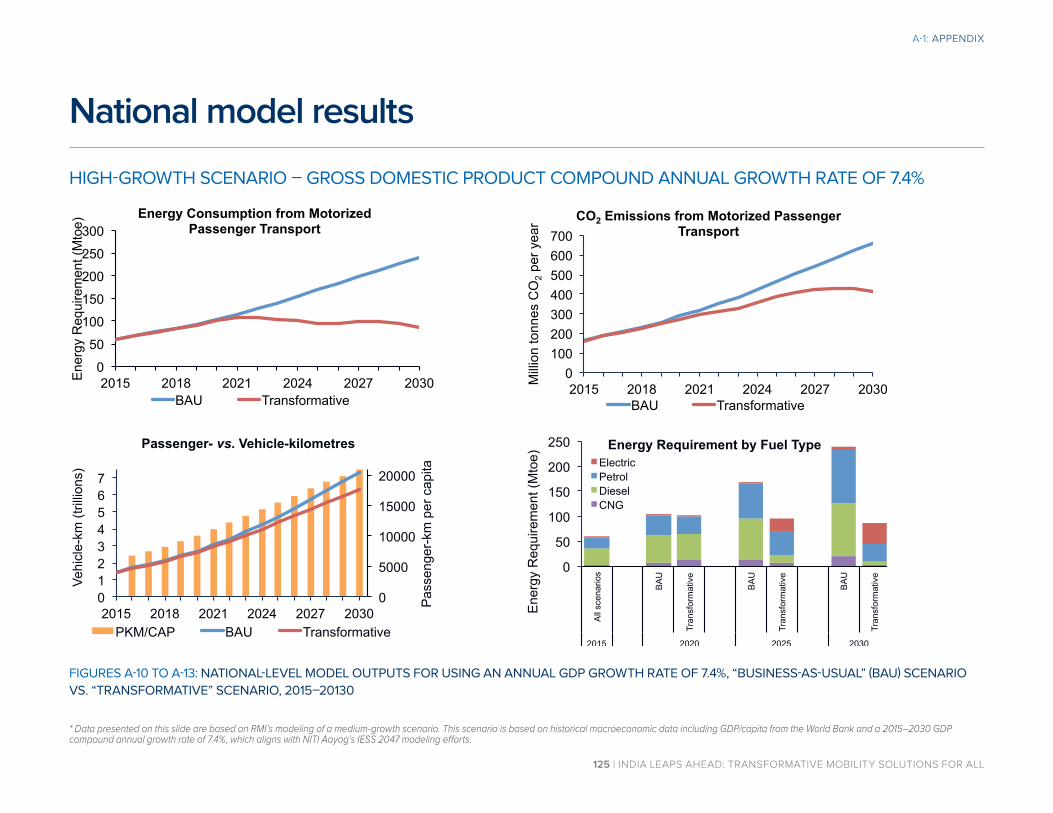
125 | INDIA LEAPS AHEAD: TRANSFORMATIVE MOBILITY SOLUTIONS FOR ALL
A-1: APPENDIX
National model results
HIGH-GROWTH SCENARIO – GROSS DOMESTIC PRODUCT COMPOUND ANNUAL GROWTH RATE OF 7.4%
FIGURES A-10 TO A-13: NATIONAL-LEVEL MODEL OUTPUTS FOR USING AN ANNUAL GDP GROWTH RATE OF 7.4%, “BUSINESS-AS-USUAL” (BAU) SCENARIO
VS. “TRANSFORMATIVE” SCENARIO, 2015–20130
0
50
100
150
200
250
300
2015 2018 2021 2024 2027 2030 Ene
rgy
Req
uire
men
t (M
toe)
Energy Consumption from Motorized Passenger Transport
BAU Transformative
0 100 200 300 400 500 600 700
2015 2018 2021 2024 2027 2030 Mill
ion
tonn
es C
O2 p
er y
ear CO2 Emissions from Motorized Passenger
Transport
BAU Transformative
0
5000
10000
15000
20000
0 1 2 3 4 5 6 7
2015 2018 2021 2024 2027 2030
Pas
seng
er-k
m p
er c
apita
Vehi
cle-
km (t
rillio
ns)
Passenger- vs. Vehicle-kilometres
PKM/CAP BAU Transformative
0
50
100
150
200
250
All
scen
ario
s
BA
U
Tran
sfor
mat
ive
BA
U
Tran
sfor
mat
ive
BA
U
Tran
sfor
mat
ive
2015 2020 2025 2030
Ene
rgy
Req
uire
men
t (M
toe)
Energy Requirement by Fuel Type Electric Petrol Diesel CNG
* Data presented on this slide are based on RMI’s modeling of a medium-growth scenario. This scenario is based on historical macroeconomic data including GDP/capita from the World Bank and a 2015–2030 GDP compound annual growth rate of 7.4%, which aligns with NITI Aayog’s IESS 2047 modeling efforts.

A-2: Select slides from charrette preread document

127 | INDIA LEAPS AHEAD: TRANSFORMATIVE MOBILITY SOLUTIONS FOR ALL
A-2: APPENDIX
India is at a critical juncture for the future of its mobility system
PRESSING FACTORS
• Increased mobility is a positive economic force—citizens on the move enhances
commerce and drives the economy.
• India will need upgrades to provide transportation to its citizens.
• Infrastructure is expensive and difficult to uninstall—India must not pursue mobility
futures leading to high costs, heavy pollution, and/or inefficiency.
• Growing demand cannot be met just through nonmotorized transit.
INDIA HAS A MOMENTOUS OPPORTUNITY TO INVEST IN A WORLD-CLASS TRANSPORTATION SYSTEM IN ORDER TO MEET ITS GOALS OF ECONOMIC GROWTH AND CITIZEN PROSPERITY
FIGURES A-14 AND A-15: PRIVATE VEHICLE GROWTH IN INDIA (TOP) AND PUBLIC TRANSIT
SHORTAGE (BOTTOM)
59
160
2002 2013
Private vehicle growth Private vehicles grew 2.7x from 2002–2013 to 160M
100
340
Supply Demand
Public transit shortage Demand for 340k buses
exceeds India’s 100k stock

128 | INDIA LEAPS AHEAD: TRANSFORMATIVE MOBILITY SOLUTIONS FOR ALL
A-2: APPENDIX
An alternative mobility system—one unimaginable even a few years ago—is conceivable today
• Development incorporates
walking and biking, making
nonmotorized transit safe.
• Urban forms enable cheaper,
more comfortable on-demand
services and public transit.
• Declining demand for parking
reclaims land for greenspace
and commercial/residential
MaaS
deployment
Electric
vehicles
Intelligent &
potentially
autonomous vehicles
Mobility-oriented
development
Mobility Transformation
• Social and economic factors
support the proliferation of shared
mobility services.
• On-demand services are growing
in market share, unlocking higher
utilisation of public transit.
• Integrated data platforms connect
multimodal transit options
seamlessly.
• Vehicle intelligence improves
road safety.
• Autonomy increases utilisation of
vehicles, further improving electric
fleet vehicle economics.
• Lower emissions per mile
addresses growing air
pollution concerns.
• Electric fleets providing
shared services offer attractive
economics.
• EV batteries benefit the electrical
grid by supporting RE integration
and ancillary services.

129 | INDIA LEAPS AHEAD: TRANSFORMATIVE MOBILITY SOLUTIONS FOR ALL
A-2: APPENDIX
India has the potential to avoid these consequences and lead the world in this mobility paradigm shift
ENABLING FACTORS68
SOCIAL ECONOMIC ENVIRONMENT
Demand for manufacturing and technology job growth Growing cost of oil imports and personal vehicle ownership
Stricter fuel economy standards
Growing young and urban populations Declining capital costs and lower-than-ICE operating costs for EVs
International commitment to climate change mitigation
Shift towards service-based economy Major innovations in data, connectivity, and communications
Growing concerns over air pollution and public health
EVEN AT RELATIVELY LOW LEVELS OF FOSSIL FUEL-BASED PERSONAL VEHICLE OWNERSHIP, INDIA IS ALREADY FACING SIGNIFICANT CHALLENGES
0
200
400
600
India - Average Delhi Los Angeles (USA)
Number of cars per 1,000 people
AN OPPORTUNITY NOW EXISTS TO INVEST IN INTEGRATED MOBILITY SOLUTIONS THAT WILL SAVE SIGNIFICANT ENERGY AND CAPITAL OVER TIME
• More than 80% of India’s petroleum is imported
• India spend USD 155.4 billion on crude oil imports in 2014–15
• India is suffering GDP losses of 1–6% due to poor urban planning
• Traffic fatalities cause more than 150,000 deaths annually
• Large share of all trips, (~66% in 2007) are still largely served by non-
motorized, public and commercial modes of transit67
FIGURES A-16: BAR CHART COMPARING U.S. AND INDIAN VEHICLE
OWNERSHIP PER 1,000 PEOPLE

130 | INDIA LEAPS AHEAD: TRANSFORMATIVE MOBILITY SOLUTIONS FOR ALL
A-2: APPENDIX
Experts believe India can leapfrog to an alternative, sustainable mobility future
The Indian Express
Minister Nitin Gadkari“Road safety is the highest priority
for our government because every
year 500,000 accidents happen
causing 150,000 deaths... We have
96,000 km of road length as national
highway and 40 percent of our
national traffic is on just two percent
of this road—one of the reasons for
accidents on the national highway.”
McKinsey Company
Vinod Khosla“In a linear model, you might
presume that if there are 80 cars per
100 people in the United States, then
that’s where India will end up and
begin to plan for that....I would look
for ways to anticipate and skip what
exists today while trying to lean in the
right direction. I would consider the
possibility that for the world in 2025,
self-driving cars will be wide-spread.”
The Economic Times
Minister Piyush Goyal“India can become the first country
of its size which will run 100 per cent
of electric vehicles. We are trying to
make this programme self-financing.
We don’t need one rupee support
from the government. We don't
need one rupee investment from the
people of India.”
The New York Times
Thomas L. Friedman“Cheap conventional four-wheel cars, which would encourage
millions of Indians to give up their two-wheel motor scooters
and three-wheel motorized rickshaws, could overwhelm
India’s already strained road system, increase its dependence
on imported oil and gridlock the country’s megacities.”
Rajya Sabha TV
Minister Nitin Gadkari“...road projects to create 1.5 million jobs in rural India.
Pradhan Mantri Gram Sadak Yojana must get additional
allocation to fast track rural road construction. It requires more
money and the situation is not good.”

ENDNOTESE

132 | INDIA LEAPS AHEAD: TRANSFORMATIVE MOBILITY SOLUTIONS FOR ALL
1. PPAC, Ready Reckoner, Snapshot of India’s oil & gas data, March 2017
2. Ministry of Road, Transport and Highways data
3. Financial Express, “India’s crude oil import bill halves to $64 billion in 2015–16,” 2016; IEA, “India Energy Outlook,” 2015
4. McKinsey, “India's urban awakening: Building inclusive cities, sustaining economic growth,” 2010
5. ITDP, 2- and 3-wheelers in India, 2009
6. Bloomberg, “China has more space than U.S. for new cars,” 18 January 2015
7. IBI Group, Transit-oriented development: Guidance document, 2016
8. GIZ, Reducing carbon emissions through transport demand management strategies, 2012
9. International Council for Local Environmental Initiatives, Curitiba: Orienting urban planning to sustainability
10. Hawkins, Lovins, and Lovins, Natural Capitalism (Chapter 14), 2000
11. Smart City Bhopal, Bhopal Living Labs (as Atal Incubation Centre)
12. ICCT, Feebate review and assessment: Best practices for feebate programme design and implementation, 2010
13. ICCT, Feebate review and assessment: Best practices for feebate programme design and implementation, 2010
14. Energy Innovation, Vehicle fuel fees and feebates, 2016
15. ICCT, Feebate review and assessment: Best practices for feebate programme design and implementation, 2010
16. Ibid
17. ICCT, Feebate review and assessment: Best practices for feebate programme design and implementation, 2010; Energy Innovation, Vehicle fuel fees and feebates, 2016
18. California Air Resources Board, ZEV Tutorial, 2009, 2016
19. Union of Concerned Scientists, “What is ZEV?”, 31 October 2016
20. Reuters, “Zero-emission vehicle sales in the U.S.,” 30 June 2016; DrivingZEV, ZEV Market Report, December 2016
21. Ibid
22. Bloomberg, “Musk tears into CA board over emissions credit standards,” 24 August 2016
23. Mashable, “India’s Silicon Valley doesn't’t like Uber, Ola’s carpooling services,” 26 January 2017; LiveMint, “Ola, Uber may have to withdraw ridesharing services in Karnataka,” 27 January 2017
24. LiveMint, “Uber lobbying with govt to allow ridesharing using private cars in India,” 7 March 2017; MoRTH, Report of the committee constituted to propose taxi policy guideline to promote urban mobility, December 2016
25. RMI, Peak car ownership, 2016
26. RMI, Peak car ownership, 2016
27. Burns et al., Transforming personal mobility, 2013; Fagnant et al., Operations of a shared autonomous vehicle fleet, 2015
28. Resources for the Future, “Will a driving restriction policy reduce car trips?” September 2013
29. Tech2, “Uber is pushing for carpooling and ridesharing in India…,” 15 January 2017
30. Evalueserve, Platform strategy will shape future of OEMs: Flexibility to drive growth, 2012
31. Renault Nissan, Alliance facts and figures, 2017
32. Economic Times, “Why transport infrastructure is most important for country’s progress,” 10 February 2016
33. Times of India, “GoI will be 50% shareholder in multimodal logistics and transport hubs,” 18 August 2016; LiveMint, “Govt readies multi-modal transport play to reduce logistics costs,” 15 March 2017
ENDNOTES
133 | INDIA LEAPS AHEAD: TRANSFORMATIVE MOBILITY SOLUTIONS FOR ALL
34. Shakti Foundation, Bus terminal design guidelines, February 2014
35. Transbay website (http://transbaycenter.org)
36. WorldBank, Reducing poverty by closing South Asia’s infrastructure gap, 2013
37. McKinsey & Co., Building India: Transforming the nation’s logistics infrastructure, September 2010
38. The Economic Times, “FAME-India scheme launched to offer sops…,” 8 April 2015
39. GoI, Press Release, “FAME India Scheme,” 23 November 2016 (Release ID: 154119); LiveMint, “India’s electric vehicles sales grow 37.5% to 22,000 units,” 5 April 2016
40. Centre for Science and Environment, Towards electro-mobility for cleaner air and climate security, March 2017
41. Centre for Science and Environment, “CSE welcomes stopping of incentives for mild diesel hybrids,” 1 April 2017
42. BNEF data
43. Haugeneland et al., 2015
44. Fearnley, et al., E-vehicle policies and incentives…, August 2015
45. Ibid
46. Ibid
47. Fearnley, et al., E-vehicle policies and incentives…, August 2015
48. ICCT, Assessment of leading electric vehicle promotion activities in United States cities, 2014
49. CleanTechnica, “More electric car charging stations…” 12 May 2016
50. Fearnley, et al., E-vehicle policies and incentives…, August 2015
51. ICCT, Sustainable management of 2- and 3-wheelers in Asia, 2013; ITDP, 2- and 3-wheelers in India, 2009
52. Economic Times, “Modi govt plans major policy push to promote e-vehicles,” 25 April 2017
53. ITDP, 2- and 3-wheelers in India, 2009
54. ICCT, Sustainable management of 2- and 3-wheelers in Asia, 2013
55. ITDP, 2- and 3-wheelers in India, 2009
56. Primary research
57. BNEF data
58. ITDP, 2- and 3-wheelers in India, 2009
59. ICCT, Sustainable management of 2- and 3-wheelers in Asia, 2013
60. Wired, “The electric scooter scheme…” 9 January 2015; Wired, “The scooter that could make battery swapping work costs $4k,” 17 June 2015
61. Forbes, “Five lessons from Better Place’s collapse,” 28 May 2013
62. Hero Electric website (http://heroelectric.in/institutional-sales/battery-swapping-facility/#)
63. ICCT, Hybrid and electric vehicles in India… December 2016
64. Eceonomic Times, “EVs for commercial use may not require permits,” 1 March 2017
65. Auto Tech Review, “Facts, myths about electric 2-wheelers,” 9 January 2015
66. LiveMint, “Govt explores smaller batteries as it aims to make electric bus travel cheaper,” 3 April 2017
67. ITDP, 2- and 3-wheelers in India, 2009
68. PPAC, WHO, and MoRTH, Global Commission on Economy and Climate, 2016
ENDNOTES

RO
C
KY MOUNTAIN
INSTIT UTE
NITI Aayog Sansad Marg, New Delhi, 110001, India
Rocky Mountain Institute22830 Two Rivers Road, Basalt, CO 81621 USA
NITI Aayog and Rocky Mountain Institute. India Leaps Ahead: Transformative mobility solutions for all. 2017.
http://niti.gov.in/writereaddata/files/document_publication/RMI_India_Report_web.pdf
https://www.rmi.org/insights/reports/transformative_mobility_solutions_india