NISTIR 85-3273-23 Energy Price indices and Discount ...
75
April 2005 NISTIR 85-3273-23 (Rev. 5/08) Energy Price Indices and Discount Factors for Life-Cycle Cost Analysis – April 2008 Annual Supplement to Amy S. Rushing NIST Handbook 135 and Barbara C. Lippiatt NBS Special Publication 709 U.S. DEPARTMENT OF COMMERCE Technology Administration National Institute of Standards and Technology Prepared for United States Department of Energy Federal Energy Management Program May 2008
Transcript of NISTIR 85-3273-23 Energy Price indices and Discount ...
April 2005
NISTIR 85-3273-23 (Rev 508)
Energy Price Indices and Discount Factors for Life-Cycle Cost Analysis ndash April 2008 Annual Supplement to Amy S Rushing NIST Handbook 135 and Barbara C Lippiatt NBS Special Publication 709
US DEPARTMENT OF COMMERCE Technology AdministrationNational Institute of Standards and Technology
Prepared forUnited States Department of EnergyFederal Energy Management Program
May 2008
NISTIR 85-3273-23
ENERGY PRICE INDICES AND DISCOUNT FACTORS FOR LIFE-CYCLE COST ANALYSIS Annual Supplement to NIST Handbook 135 and NBS Special Publication 709
April 1 2008 to March 31 2009 Data for the Federal Methodology for Life-Cycle Cost Analysis Title 10 CFR Part 436 Subpart A and for the Energy Conservation Mandatory Performance Standards for New Federal Residential Buildings Title 10 CFR Part 435
Amy S Rushing Barbara C Lippiatt
Sponsored by
US Department of Energy Federal Energy Management Program Washington DC 20585
May 2008
US DEPARTMENT OF COMMERCE Carlos M Gutierrez Secretary
NATIONAL INSTITUTE OF STANDARDS AND TECHNOLOGY James M Turner Deputy Director
US Department of Commerce Office of Applied Economics Technology Administration Building and Fire Research Laboratory National Institute of Standards and Technology Gaithersburg MD 20899
ABSTRACT
This is the April 2008 edition of energy price indices and discount factors for performing life-cycle cost analyses of energy and water conservation and renewable energy projects in federal facilities It will be effective from April 1 2008 to March 31 2009 This publication supports the federal life-cycle costing methodology described in 10 CFR 436A and OMB Circular A-94 by updating the energy price projections and discount factors that are described explained and illustrated in NIST Handbook 135 (HB 135 Life-Cycle Costing Manual for the Federal Energy Management Program) It supports private-sector life-cycle cost analysis by updating the energy price indices that are described explained and illustrated in NBS Special Publication 709 (SP 709)
Disclaimer Certain trade names or company products are mentioned in the text to specify adequately the software and operating systems used for performing the life-cycle cost analyses In no case does such identification imply recommendation or endorsement by the National Institute of Standards and Technology nor does it imply that the software and operating systems are the best available for the purpose
iii
PREFACE
This is the April 2008 Annual Supplement to NIST Handbook 135 Life-Cycle Costing Manual for the Federal Energy Management Program (FEMP) The annual supplement provides energy price indices and discount factors for use with the Federal Energy Management Programs procedures for life-cycle cost analysis as established by the US Department of Energy (DOE) in Subpart A of Part 436 of Title 10 of the Code of Federal Regulations (10 CFR 436A) and amplified in NIST Handbook 135 These indices and factors are provided as an aid to implementing life-cycle cost evaluations of potential energy and water conservation and renewable energy investments in existing and new federally owned and leased buildings
The update of the Annual Supplement to Handbook 135 is released on April 1 of each year Its price indices and discount factors are calculated with the most recent energy price projections from DOErsquos Energy Information Administration (EIA) and the most recent discount rates from FEMP and the Office of Management and Budget (OMB) Circular A-94 This issue of the Annual Supplement is intended for use from April 1 2008 to March 31 2009 The updated editions of the NIST Building Life-Cycle Cost (BLCC) programs are released at the same time as this Annual Supplement for use over the same time period The software products are discussed below
At the request of a number of users a text file of the EIA energy price projections underlying this Annual Supplement has been made available by NIST For information on obtaining this file (ENCOST08txt) contact the authors via e-mail at blippiattnistgov or amyrushingnistgov
The life-cycle costing methods and procedures as set forth in 10 CFR 436A are to be followed by all federal agencies unless specifically exempted for evaluating the cost effectiveness of potential energy and water conservation and renewable energy investments in federally owned and leased buildings For most other federal LCC analyses OMB Circular A-94 provides the relevant guidelines
As called for by legislation (Energy Policy and Conservation Act PL94-163 1975 92 Stat 3206 42 USC 8252 et seq) the National Institute of Standards and Technology has provided technical assistance to the US Department of Energy in the development and implementation of life-cycle costing methods and procedures This is the second of a three-volume set which together provide the methods data and computational tools for federal life-cycle cost analysis
Included in the three-volume set for federal life-cycle cost analysis are the following
(1) Life-Cycle Costing Manual for the Federal Energy Management Program National Institute of Standards and Technology Handbook 135 (1995)
The manual is a guide to understanding life-cycle costing and related methods of economic analysis as they are applied to federal decisions especially those subject to 10 CFR 436A rules It describes the required procedures and assumptions defines and explains how to apply and interpret economic performance measures gives examples of federal decision problems and their solutions explains how to use energy price indices and discount factors and provides worksheets and other computational aids and instructions for calculating the required measures The 1995 edition of Handbook 135 is a complete revision of the 1987 edition with updated information on the FEMP LCC requirements of 10 CFR 436A
iv
(2) Energy Price Indices and Discount Factors for Life-Cycle Cost Analysis Annual Supplement to NIST Handbook 135 and NBS Special Publication 709 National Institute of Standards and Technology NISTIR 85-3273
This report which is updated annually provides the current DOE and OMB discount rates projected energy price indices and corresponding discount factors needed to estimate the present values of future energy and non-energy-related project costs Request the latest edition when ordering (This is the report that you are holding in your hands)
(3) NIST Building Life-Cycle Cost (BLCC) Computer Programs BLCC5 and BLCC4 National Institute of Standards and Technology These programs use as default values the same discount factors and energy price projections that underlie the discount factor tables in the Annual Supplement Use versions BLCC 53-08 and BLCC 49-08 for the period from April 1 2008 to March 31 2009
The BLCC5 program is a windowed version of the DOS-based BLCC4 It is available for Windows Mac OS X and Linux
The BLCC5 Userrsquos Guide is part of its Help system BLCC 53 has six modules all of them consistent with the life-cycle cost methodology of 10 CFR 436A but programmed to include default inputs and nomenclature for specific uses
(1) FEMP Analysis Energy Project for energy and water conservation and renewable energy projects under the FEMP rules agency-funded
(2) Federal Analysis Financed Project for federal projects financed through Energy Savings Performance Contracts (ESPC) or Utility Energy Services Contracts (UESC) as authorized by Executive Order 13123 (699)
(3) OMB Analysis Federal Analysis Projects subject to OMB Circular A-94 for projects subject to OMB Circular A-94 (most other non-energy federal government construction projects but not water resource projects)
(4) MILCON Analysis Energy Project for energy and water conservation and renewable energy projects in military construction agency-funded
(5) MILCON Analysis ECIP Project for energy and water conservation projects under the Energy Conservation Investment Program (ECIP)
(6) MILCON Analysis Non-Energy Project for military construction designs that are not primarily for energy or water conservation
v
The BLCC4 program is designed to run on IBM PC and compatible microcomputers in a MS-DOS environment The current version is BLCC 49-08 BLCC4-associated programs are the following
bull QuickBLCC (version 29-08) can be used to set up multiple project alternatives for LCC analysis in a single input file when only a limited number of inputs are needed
bull DISCOUNT (version 39-08) is a stand-alone program that computes present-value future-value and annual-value factors for any discount rate and study period including UPV factors needed for federal LCC analyses of energy projects
bull ERATES (version 111) is a stand-alone program that generates block-rate time-of-use-rate and demand-rate schedules for electricity prices It computes monthly and annual electricity costs that can be imported directly into BLCC4 and entered manually into BLCC5
bull EMISS (version 100) is a stand-alone program that generates files of local air-pollution emission coefficients for use with the BLCC4 program
The set of LCC programs also includes bull EERC 10-08 Energy Escalation Rate Calculator a program that computes an average rate of
escalation for a specified time period based on the DOE energy price escalation rates used for calculating the FEMP discount factors This average rate can be used as an escalation rate for contract payments in Energy Savings Performance Contracts (ESPC) and Utility Energy Services Contracts (UESC)
The NIST BLCC programs provide comprehensive economic analysis capabilities for the evaluation of proposed capital investments that are expected to reduce the long-term operating costs of buildings and building systems They compute the LCC for project alternatives compare project alternatives in order to determine which has the lowest LCC perform annual cash flow analysis and compute net savings (NS) savings-to-investment ratio (SIR) and adjusted internal rate of return (AIRR) for project alternatives over their designated study period The BLCC programs can be used to perform economic analysis of capital investment projects undertaken by federal state and local government agencies as well as by the private sector (BLCC4) In their application to federal energy conservation and renewable energy projects BLCC5 and BLCC4 are consistent with NIST Handbook 135 and the federal life-cycle cost methodology and procedures described in 10 CFR 436A and OMB Circular A-94 In their application to private-sector and non-federal public-sector projects they are consistent with ASTM standards for building economics
The US Department of Energy was directed by legislation and executive order to make available to the private sector the methods procedures and related aids developed for federal use In response to this directive the National Institute of Standards and Technology under sponsorship of the US Department of Energy published a life-cycle costing book for use by the private sector entitled Comprehensive Guide for Least-Cost Energy Decisions NBS SP 709 (January 1987) The private sector guide is supported by the data provided here as well as by the BLCC4 computer program The BLCC4 program supersedes the NBSLCC program that is documented in SP 709
The latest versions of the programs and publications described above can be downloaded from the DOEFEMP web site at httpwww1eereenergygovfempprogramlifecyclehtml
To request hard copies of the above publications please call the Energy Efficiency and Renewable Energy (EERE) Information Center 1-877-EERE-INF (1-877-337-3463)
vi
In some years depending on funding availability NIST under the sponsorship of DOE conducts three workshops
The two-day Basic LCC Workshop explains the underlying theory of present-value analysis and integrates it with the FEMP criteria The two-day Project-Oriented LCC Workshop builds on the Basic Workshop focuses on the use of the BLCC computer programs and applies the LCC methodology to more complex issues Further information is available from the EERE Information Center or the DOEFEMP web site The third workshop is a two-hour televised course that introduces the elements of life-cycle cost analysis of energy and water conservation projects
FEMP-Qualified Instructors are available to conduct LCC workshops on their own account across the US For a list of instructors e-mail blippiattnistgov
Three video training films in a series entitled Least-Cost Energy Decisions for Buildings have been prepared by NIST These films include Introduction to Life-Cycle Costing Uncertainty and Risk and Choosing Economic Evaluation Methods The video films and companion workbooks can be ordered from
Video Transfer Inc 5800 Arundel Avenue Rockville MD 20852 301-881-0270
For further information on the Federal Energy Management Program please visit httpwww1eereenergygovfemp
vii
ACKNOWLEDGMENTS
The authors wish to thank Cyrus Nasseri of the Federal Energy Management Program US Department of Energy (DOE) for his support and direction of this work Appreciation is extended to Paul Kondis and Paul Holtberg of the DOE Energy Information Administration for providing the energy price projections upon which this report is based Thanks are also due to Stephen Petersen and Sieglinde Fuller who originated this publication and to Carmen Pardo for her assistance in producing this document
viii
CONTENTS
Page
ABSTRACT iii
PREFACE iv
ACKNOWLEDGMENTS viii
LIST OF TABLESx
ABBREVIATIONS xiii
INTRODUCTION 1
PART I TABLES FOR FEDERAL LIFE-CYCLE COST ANALYSIS 3
A Single Present Value and Uniform Present Value Factors for Non-Fuel Costs 3
B Modified Uniform Present Value Factors for Fuel Costs 11 B1 FEMP Modified Uniform Present Value Factors14 B2 OMB Modified Uniform Present Value Factors 20
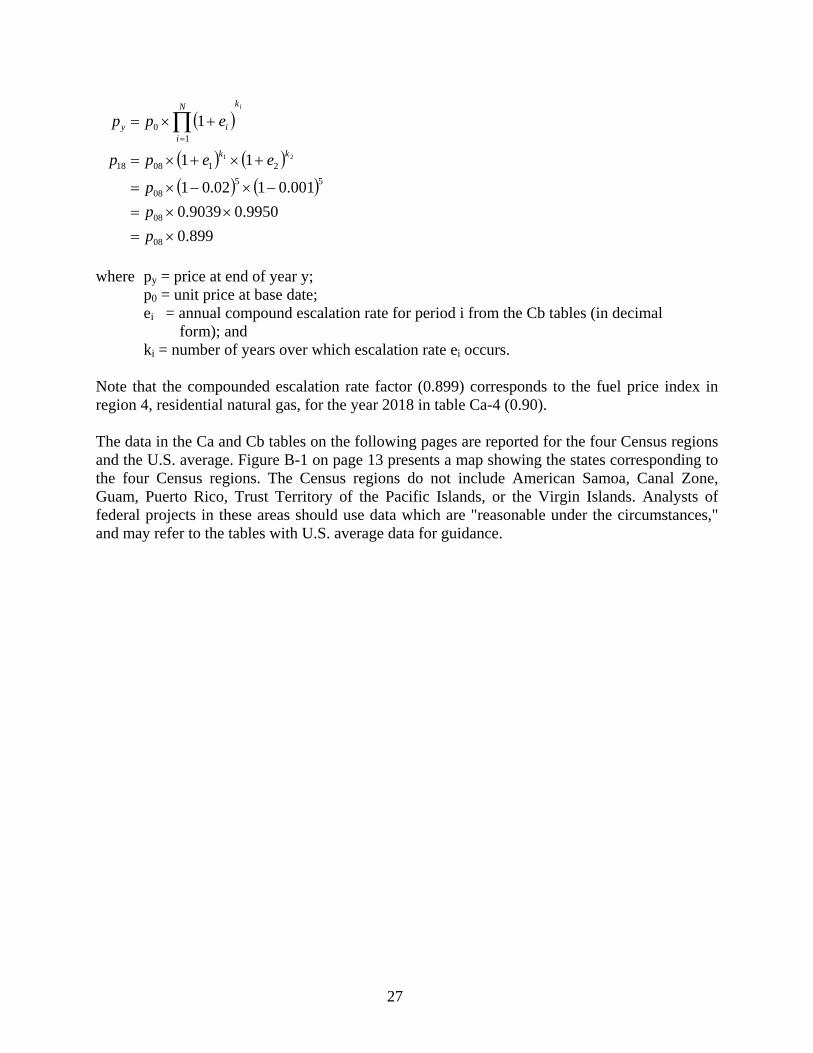
C Projected Average Fuel Price Indices and Escalation Rates (Real)26
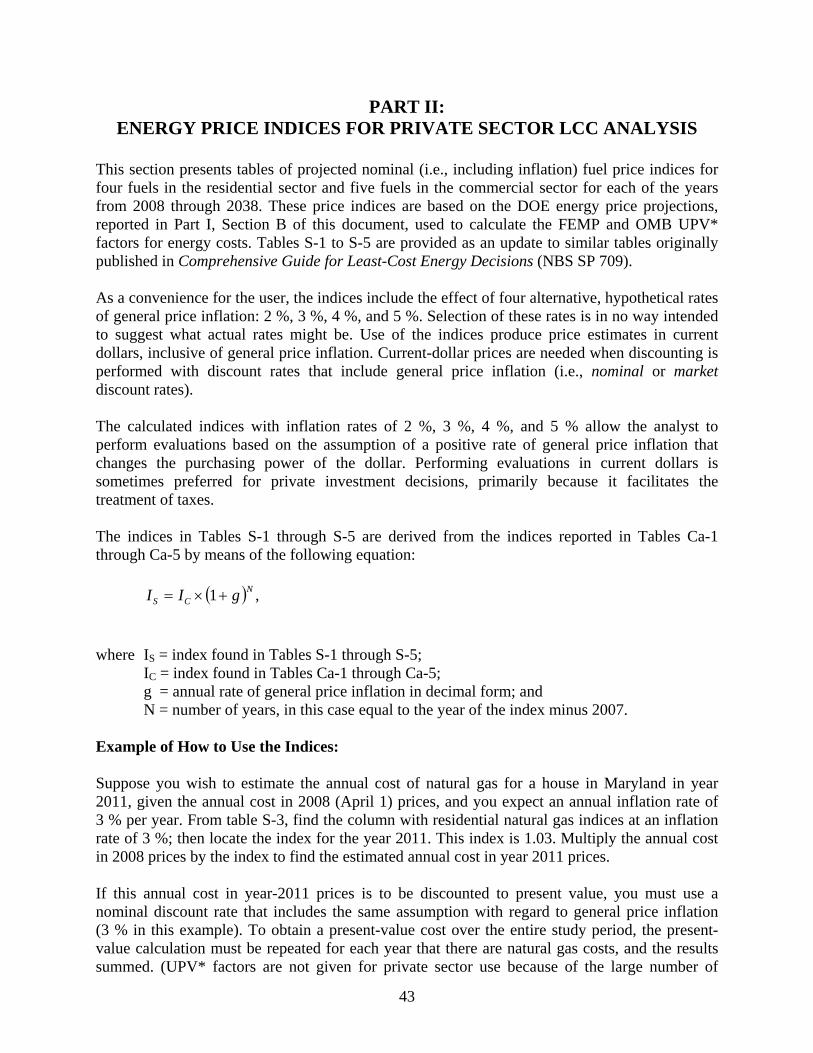
PART II ENERGY PRICE INDICES FOR PRIVATE SECTOR LCC ANALYSIS43
ix
LIST OF TABLES Page
A-1 SPV factors for finding the present value of future single costs (non-fuel) 6
A-2 UPV factors for finding the present value of future annually recurring uniform costs (non-fuel) 7
A-3a UPV factors for finding the present value of annually recurring costs changing at a constant escalation rate DOE discount rate (30 )8
A-3b UPV factors for finding the present value of annually recurring costs changing at a constant escalation rate OMB short-term discount rate (24 ) 9
A-3c UPV factors for finding the present value of annually recurring costs changing at a constant escalation rate OMB long-term discount rate (28 ) 10
Ba-1 FEMP UPV discount factors adjusted for fuel price escalation by end-use sector and fuel type Discount Rate = 30 (DOE) Census Region 1 (Connecticut Maine Massachusetts New Hampshire New Jersey New York Pennsylvania Rhode Island Vermont) 15
Ba-2 FEMP UPV discount factors adjusted for fuel price escalation by end-use sector and fuel type Discount Rate = 30 (DOE) Census Region 2 (Illinois Indiana Iowa Kansas Michigan Minnesota Missouri Nebraska North Dakota Ohio South Dakota Wisconsin) 16
Ba-3 FEMP UPV discount factors adjusted for fuel price escalation by end-use sector and fuel type Discount Rate = 30 (DOE) Census Region 3 (Alabama Arkansas Delaware District of Columbia Florida Georgia Kentucky Louisiana Maryland Mississippi North Carolina Oklahoma South Carolina Tennessee Texas Virginia West Virginia)17
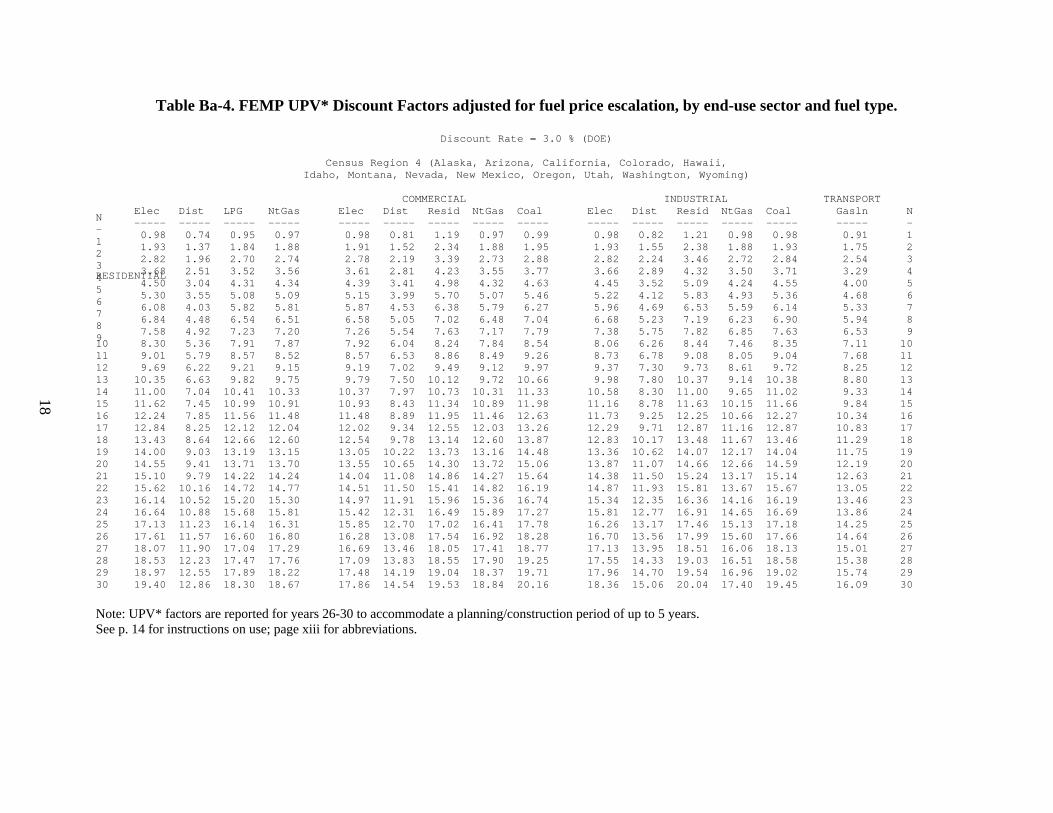
Ba-4 FEMP UPV discount factors adjusted for fuel price escalation by end-use sector and fuel type Discount Rate = 30 (DOE) Census Region 4 (Alaska Arizona California Colorado Hawaii Idaho Montana Nevada New Mexico Oregon Utah Washington Wyoming) 18
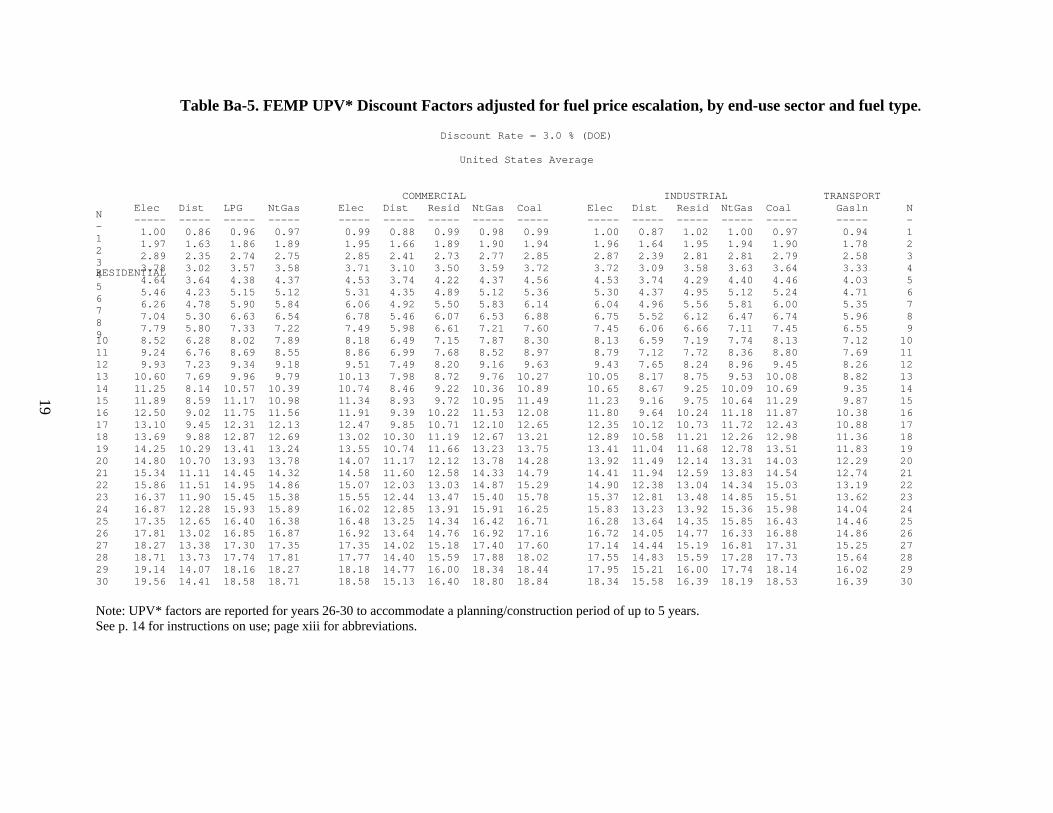
Ba-5 FEMP UPV discount factors adjusted for fuel price escalation by end-use sector and fuel type Discount Rate = 30 (DOE) United States Average 19
Bb-1 OMB UPV discount factors adjusted for fuel price escalation by end-use sector and fuel type Discount Rate = 24 (years 1 to 10) and 28 (years 11 to 30) (OMB Circular A-94) Census Region 1 (Connecticut Maine Massachusetts New Hampshire New Jersey New York Pennsylvania Rhode Island Vermont)21
x
LIST OF TABLES (continued) Page
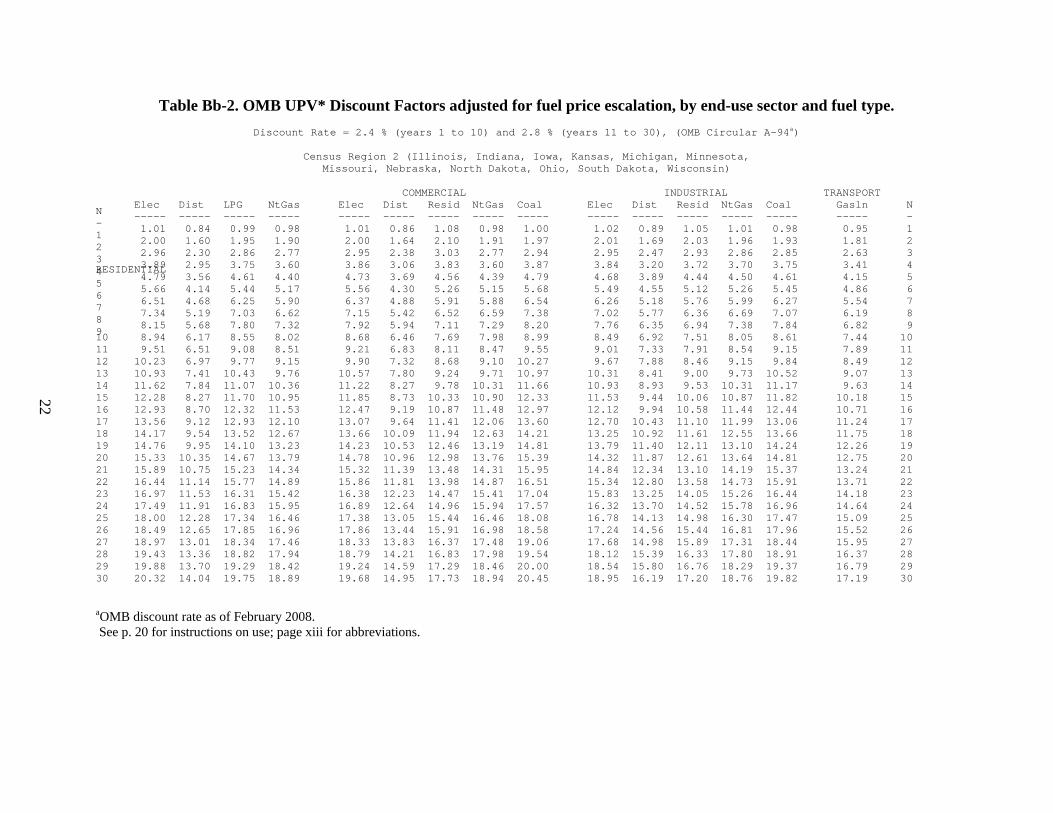
Bb-2 OMB UPV discount factors adjusted for fuel price escalation by end-use sector and fuel type Discount Rate = 24 (years 1 to 10) and 28 (years 11 to 30) (OMB Circular A-94) Census Region 2 (Illinois Indiana Iowa Kansas Michigan Minnesota Missouri Nebraska North Dakota Ohio South Dakota Wisconsin) 22
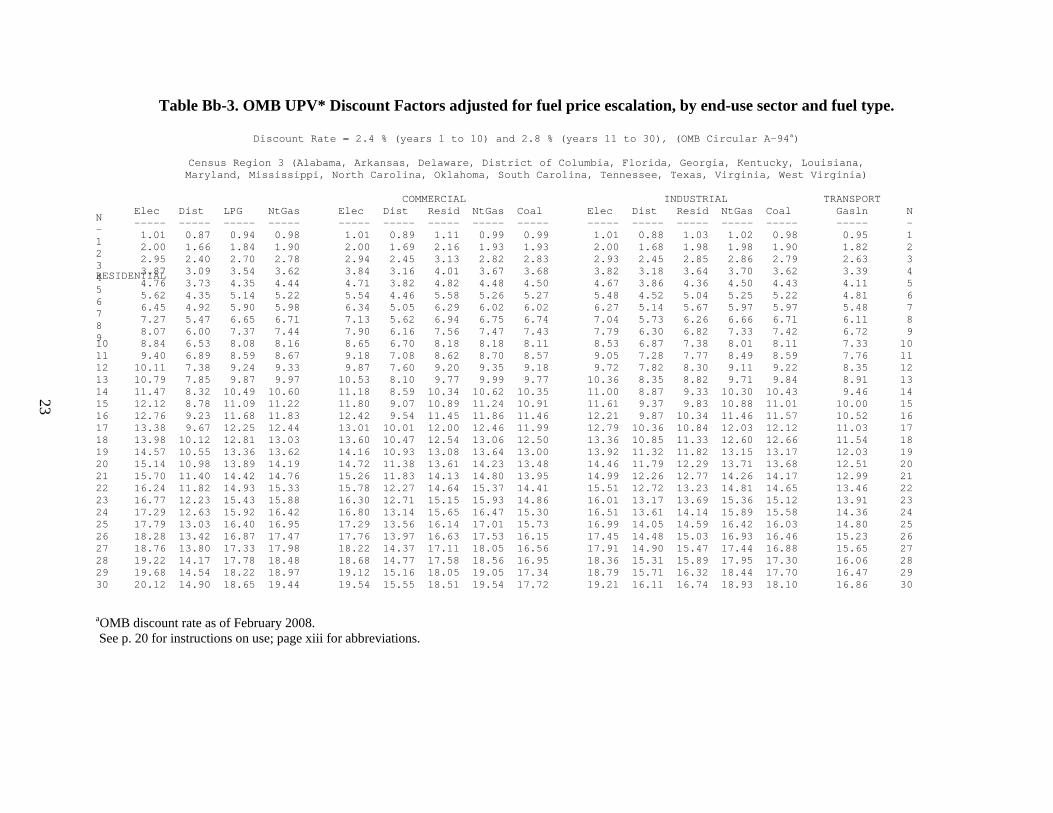
Bb-3 OMB UPV discount factors adjusted for fuel price escalation by end-use sector and fuel type Discount Rate = 24 (years 1 to 10) and 28 (years 11 to 30) (OMB Circular A-94) Census Region 3 (Alabama Arkansas Delaware District of Columbia Florida Georgia Kentucky Louisiana Maryland Mississippi North Carolina Oklahoma South Carolina Tennessee Texas Virginia West Virginia)23
Bb-4 OMB UPV discount factors adjusted for fuel price escalation by end-use sector and fuel type Discount Rate = 24 (years 1 to 10) and 28 (years 11 to 30) (OMB Circular A-94) Census Region 4 (Alaska Arizona California Colorado Hawaii Idaho Montana Nevada New Mexico Oregon Utah Washington Wyoming)24
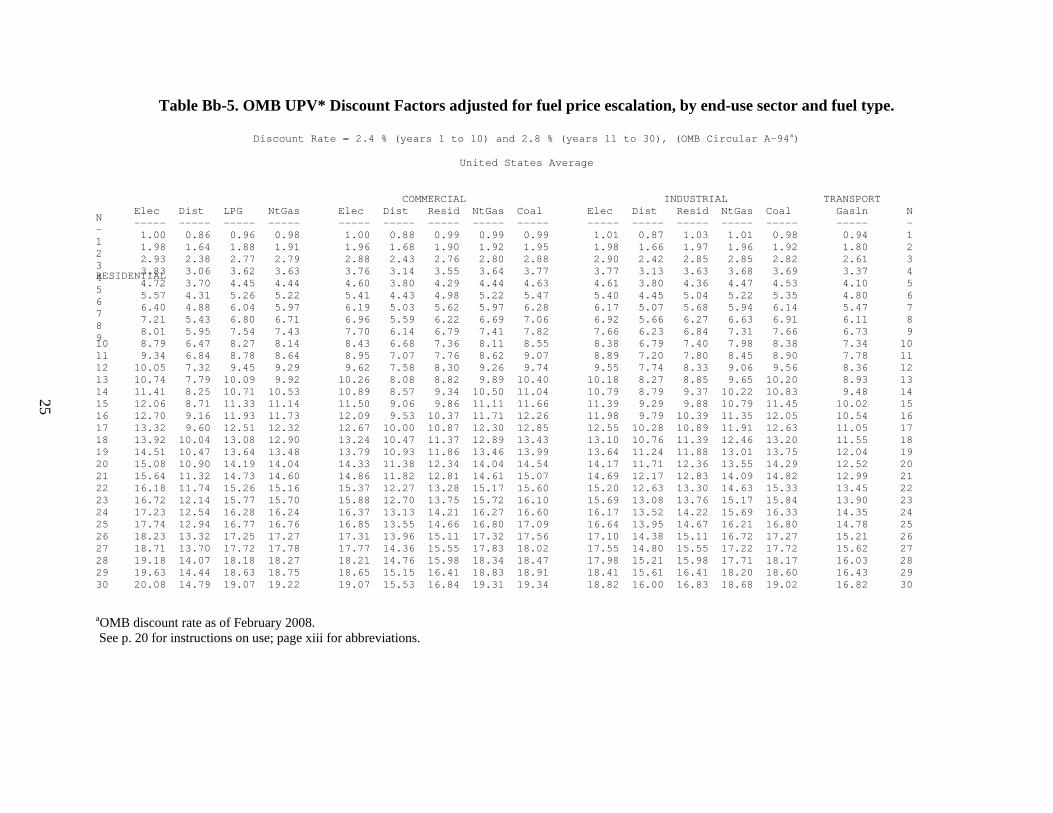
Bb-5 OMB UPV discount factors adjusted for fuel price escalation by end-use sector and fuel type Discount Rate = 24 (years 1 to 10) and 28 (years 11 to 30) (OMB Circular A-94) United States Average25
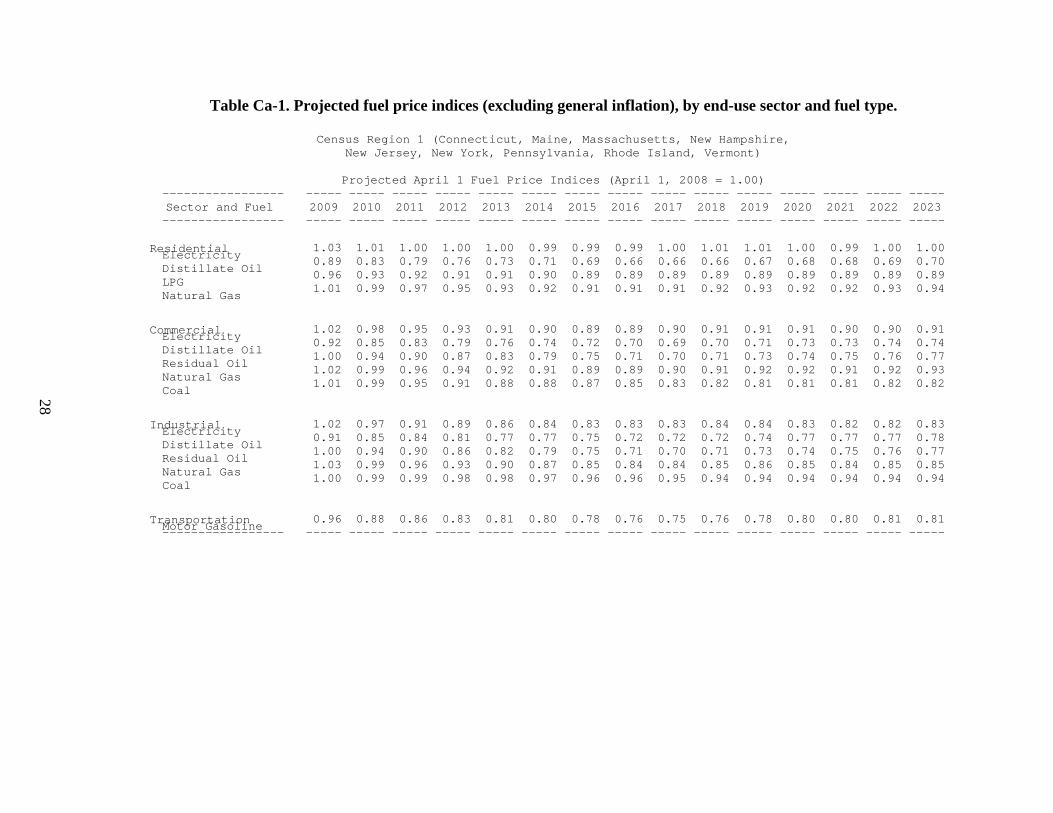
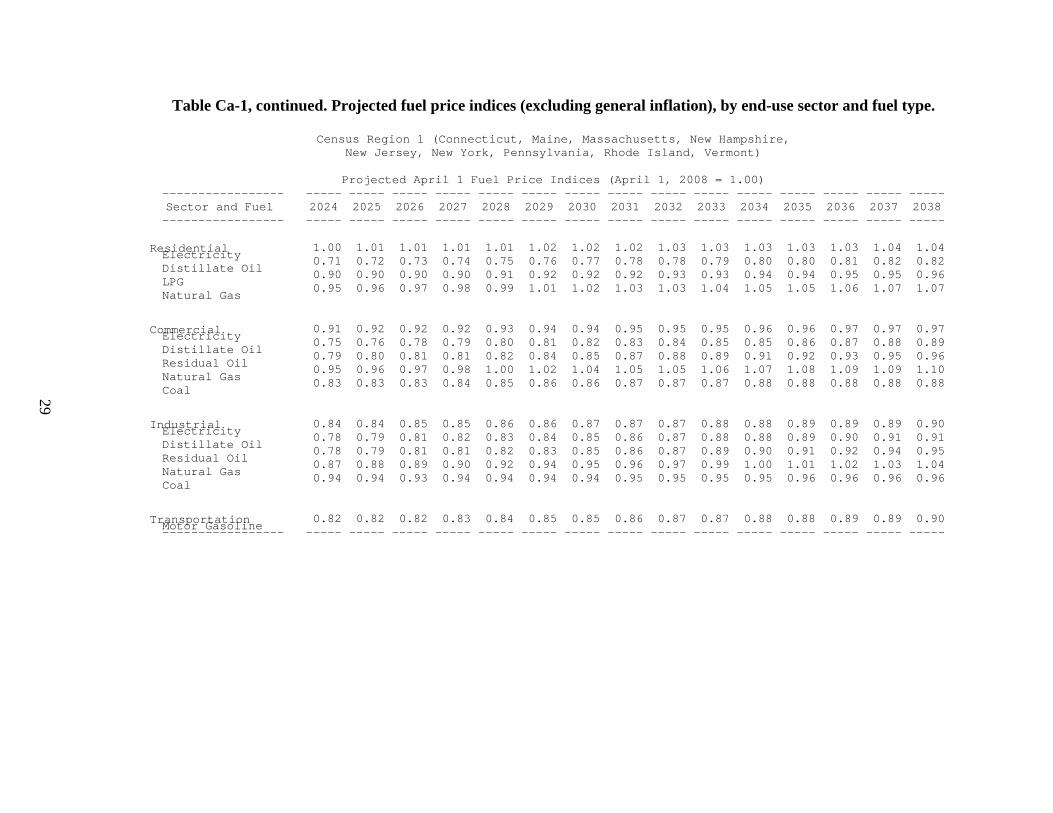
Ca-1 Projected fuel price indices (excluding general inflation) by end-use sector and fuel type Census Region 1 (Connecticut Maine Massachusetts New Hampshire New Jersey New York Pennsylvania Rhode Island Vermont)28
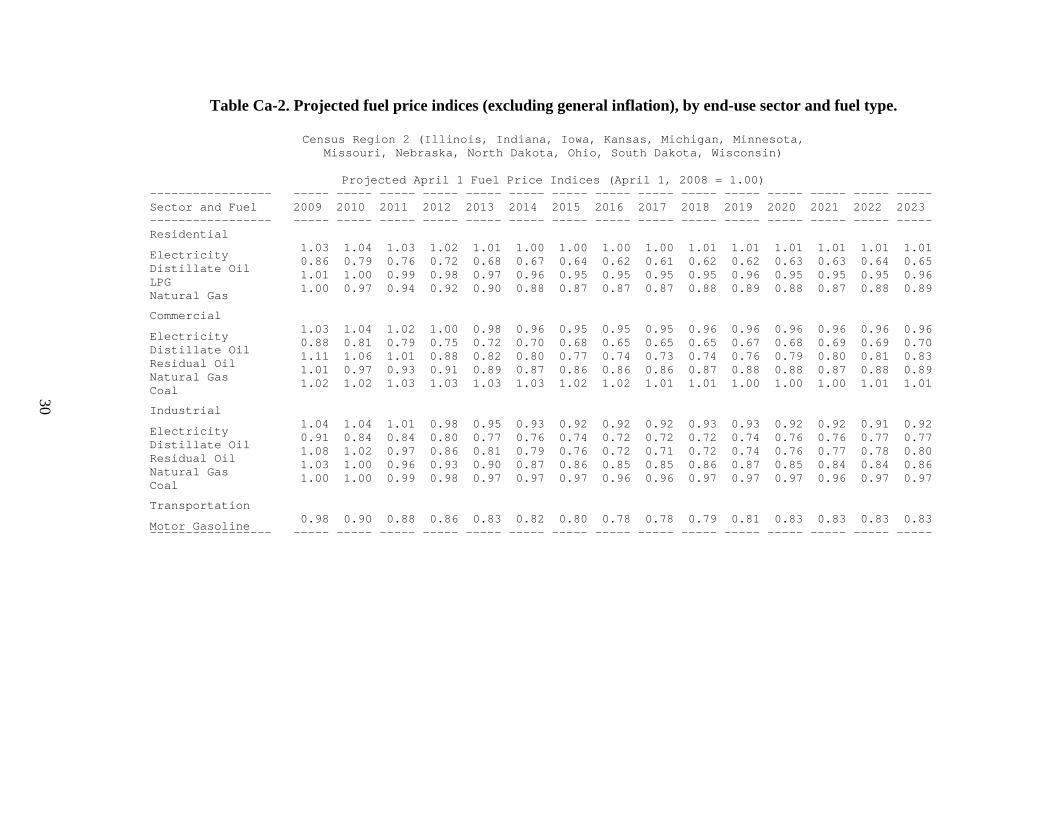
Ca-2 Projected fuel price indices (excluding general inflation) by end-use sector and fuel type Census Region 2 (Illinois Indiana Iowa Kansas Michigan Minnesota Missouri Nebraska North Dakota Ohio South Dakota Wisconsin) 30
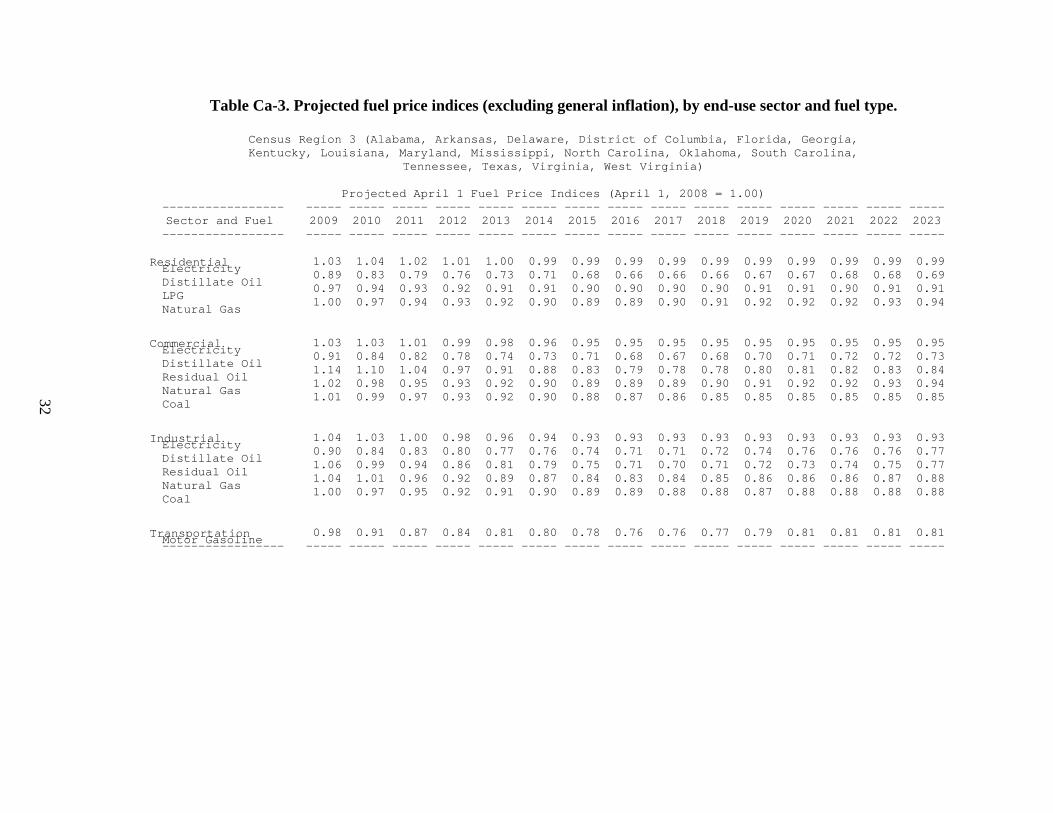
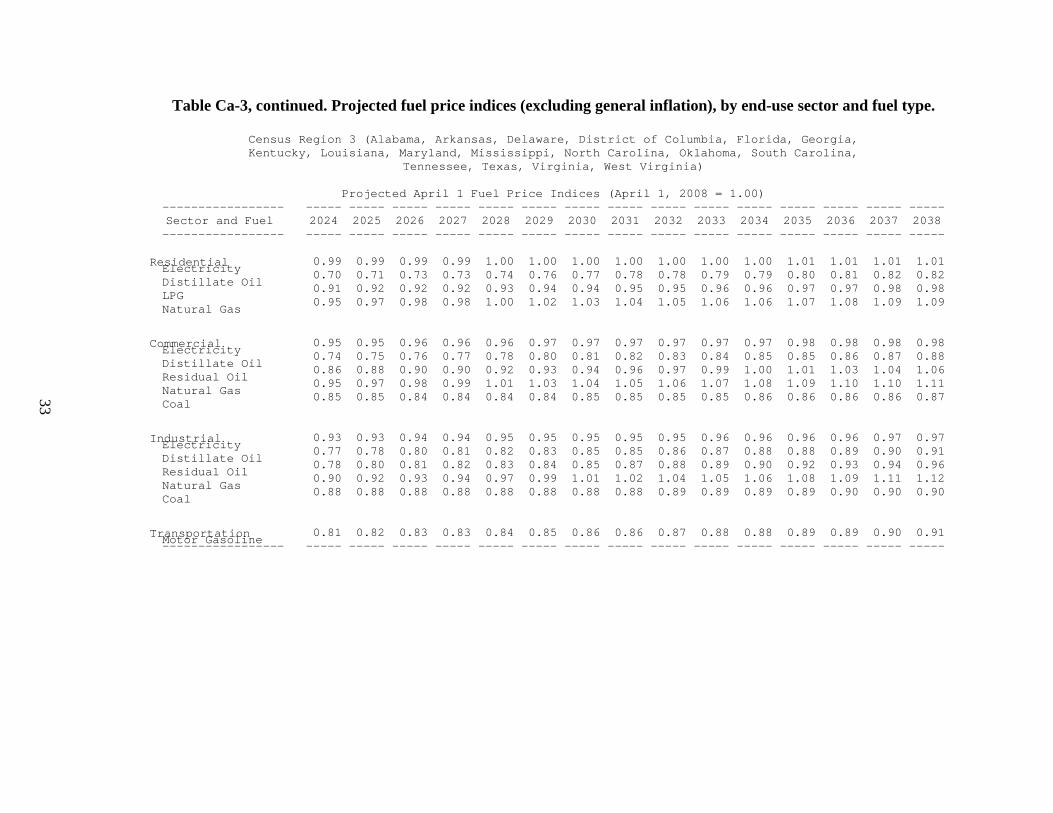
Ca-3 Projected fuel price indices (excluding general inflation) by end-use sector and fuel type Census Region 3 (Alabama Arkansas Delaware District of Columbia Florida Georgia Kentucky Louisiana Maryland Mississippi North Carolina Oklahoma South Carolina Tennessee Texas Virginia West Virginia) 32
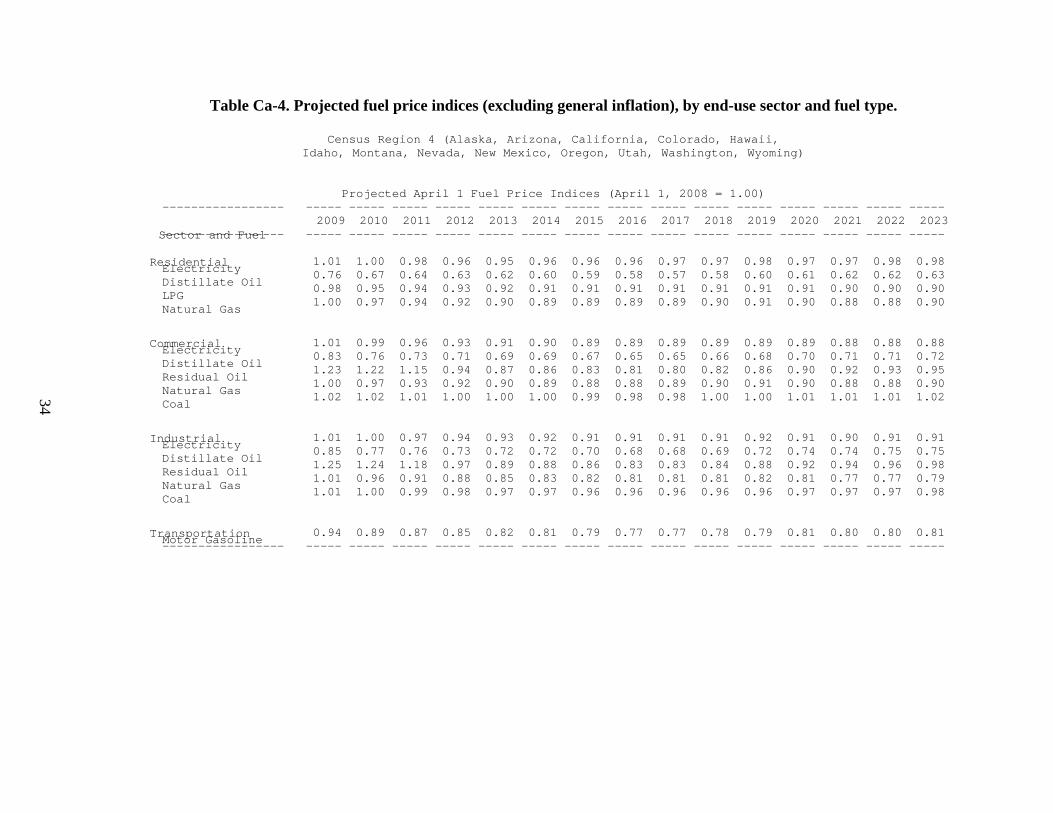
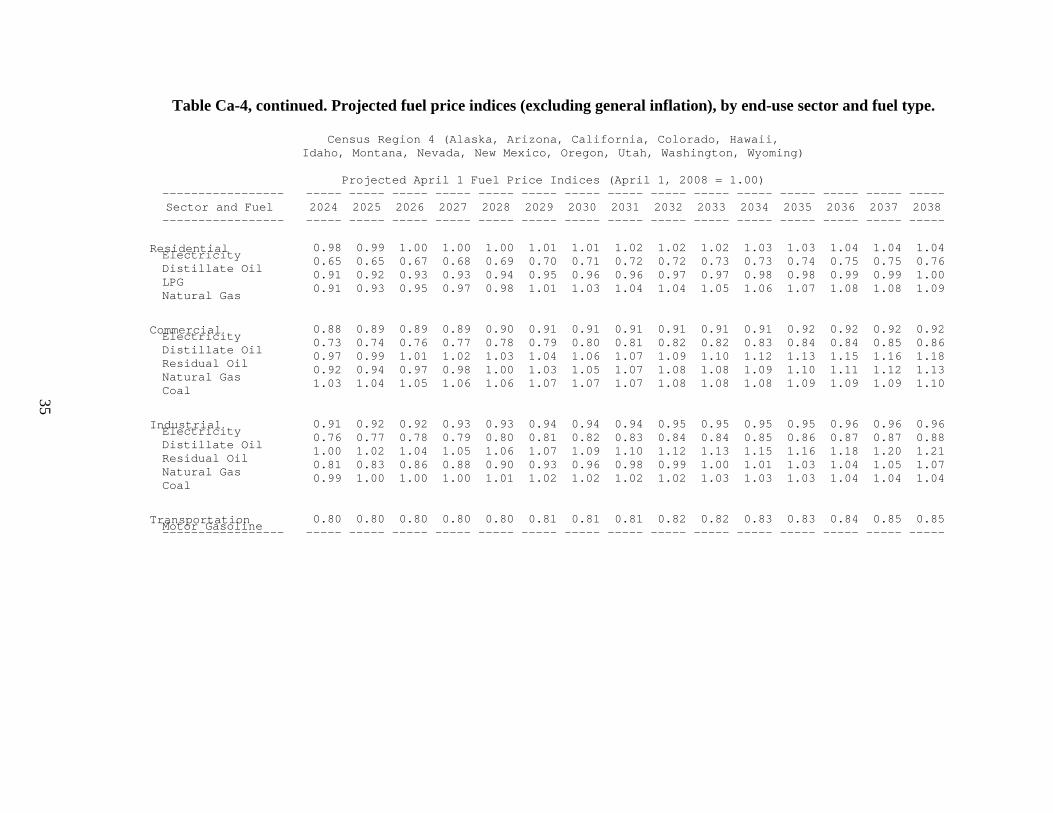
Ca-4 Projected fuel price indices (excluding general inflation) by end-use sector and fuel type Census Region 4 (Alaska Arizona California Colorado Hawaii Idaho Montana Nevada New Mexico Oregon Utah Washington Wyoming) 34
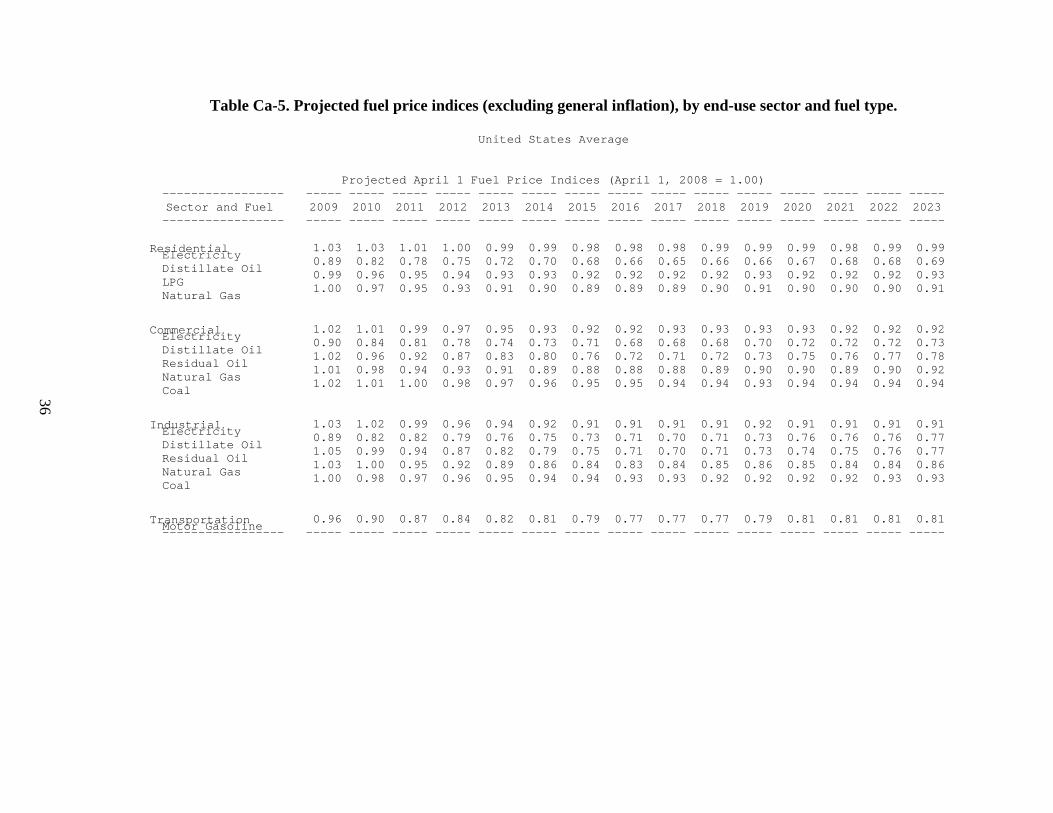
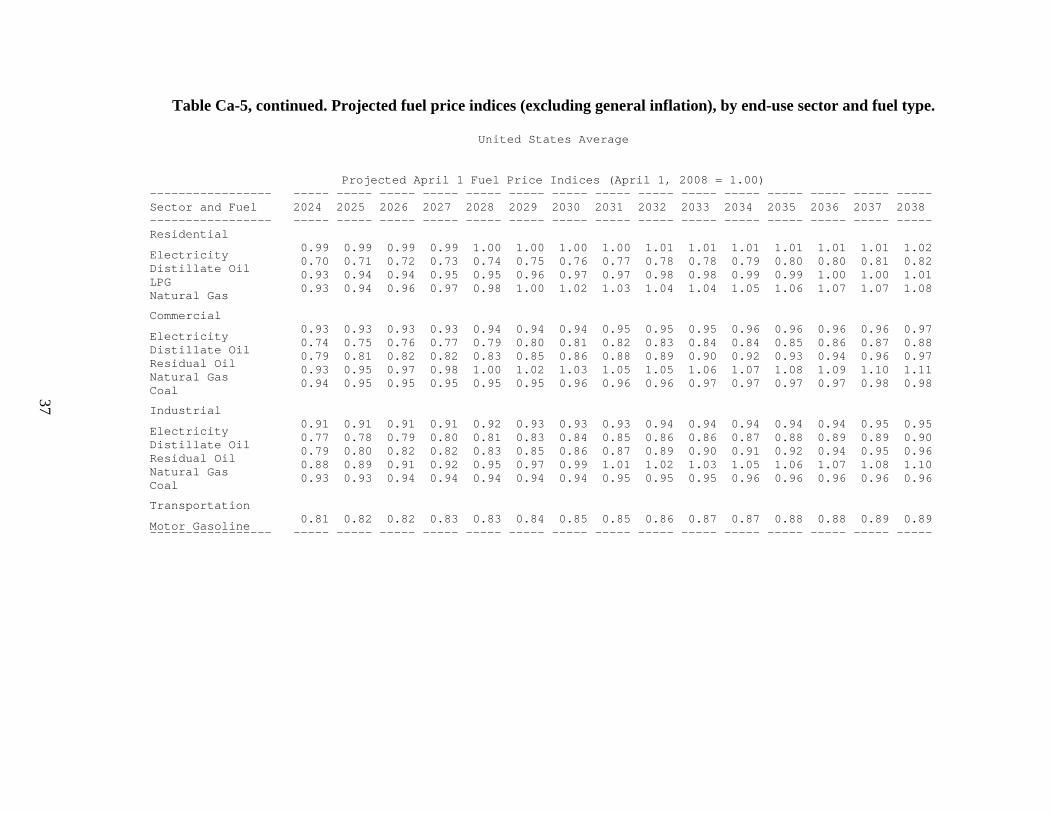
Ca-5 Projected fuel price indices (excluding general inflation) by end-use sector and fuel type United States Average36
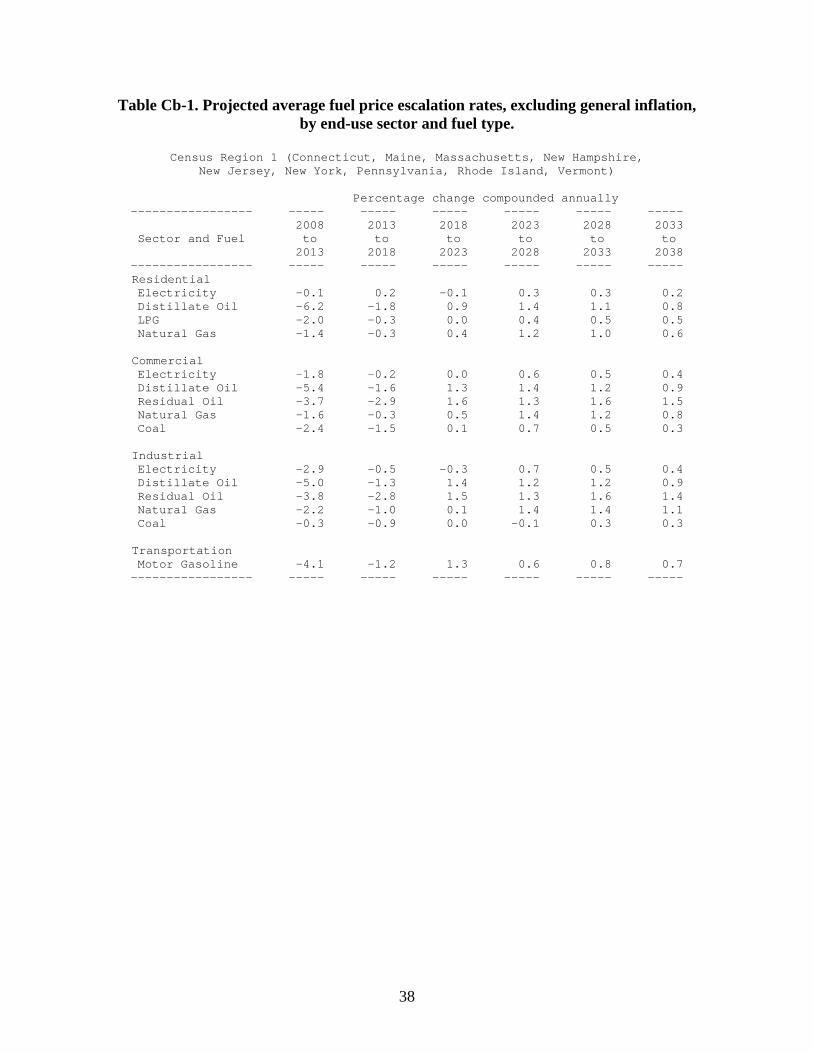
Cb-1 Projected average fuel price escalation rates (excluding general price inflation) by end-use sector and fuel type Census Region 1 (Connecticut Maine Massachusetts New Hampshire New Jersey New York Pennsylvania Rhode Island Vermont) 38
xi
LIST OF TABLES (continued) Page
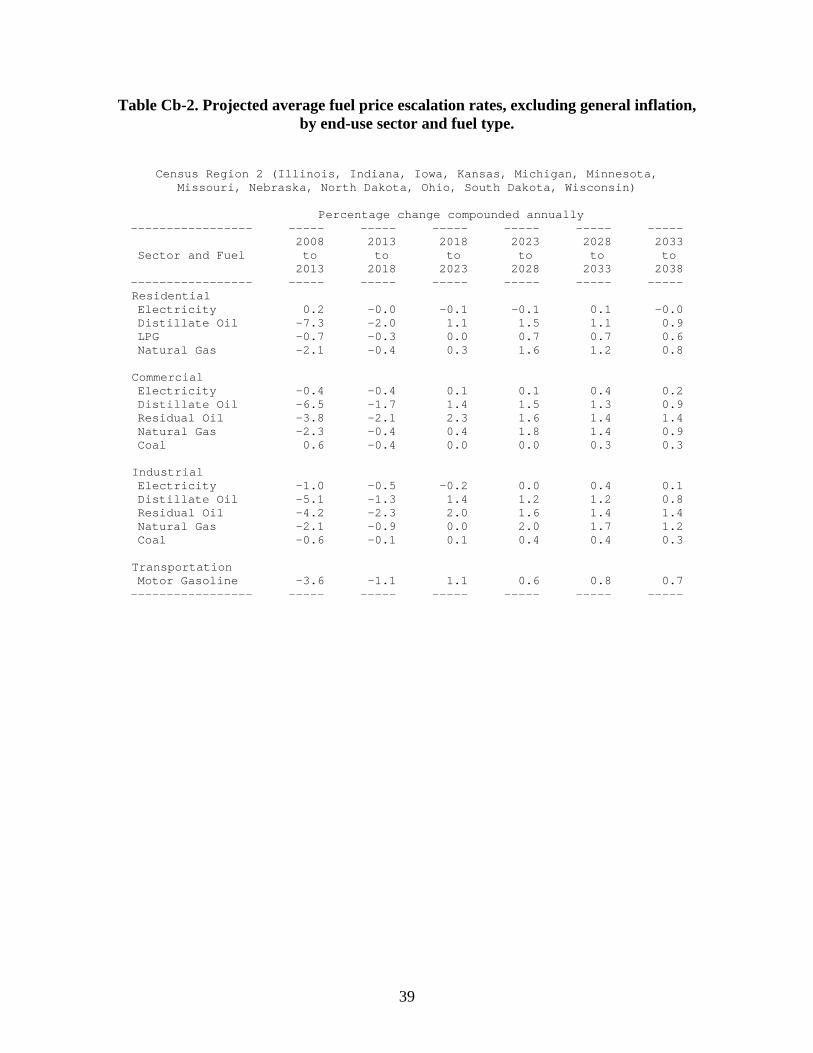
Cb-2 Projected average fuel price escalation rates (excluding general price inflation) by end-use sector and fuel type Census Region 2 (Illinois Indiana Iowa Kansas Michigan Minnesota Missouri Nebraska North Dakota Ohio South Dakota Wisconsin) 39
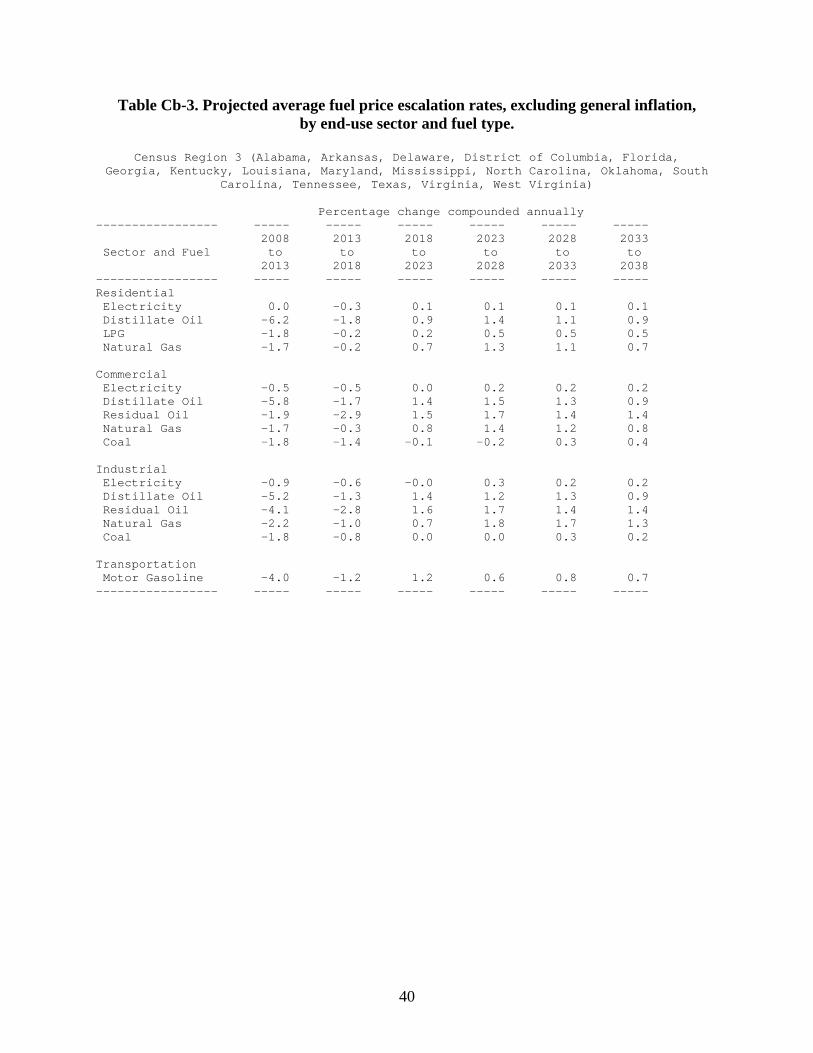
Cb-3 Projected average fuel price escalation rates (excluding general price inflation) by end-use sector and fuel type Census Region 3 (Alabama Arkansas Delaware District of Columbia Florida Georgia Kentucky Louisiana Maryland Mississippi North Carolina Oklahoma South Carolina Tennessee Texas Virginia West Virginia)40
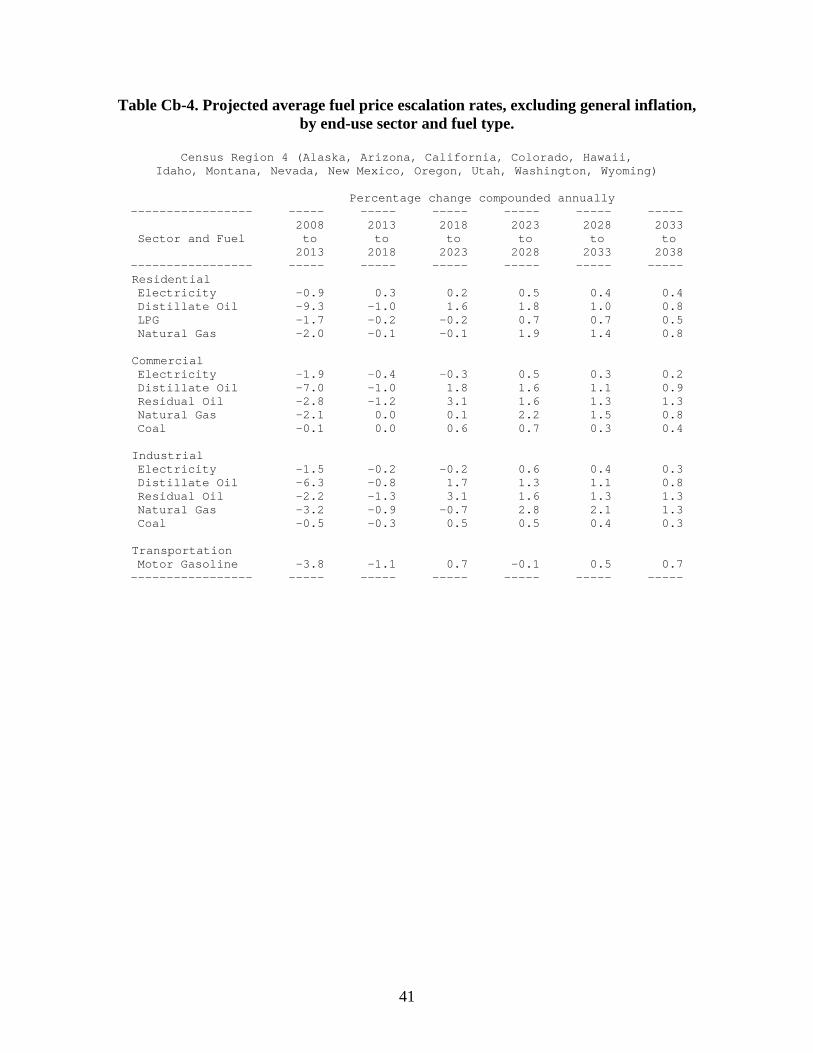
Cb-4 Projected average fuel price escalation rates (excluding general price inflation) by end-use sector and fuel type Census Region 4 (Alaska Arizona California Colorado Hawaii Idaho Montana Nevada New Mexico Oregon Utah Washington Wyoming) 41
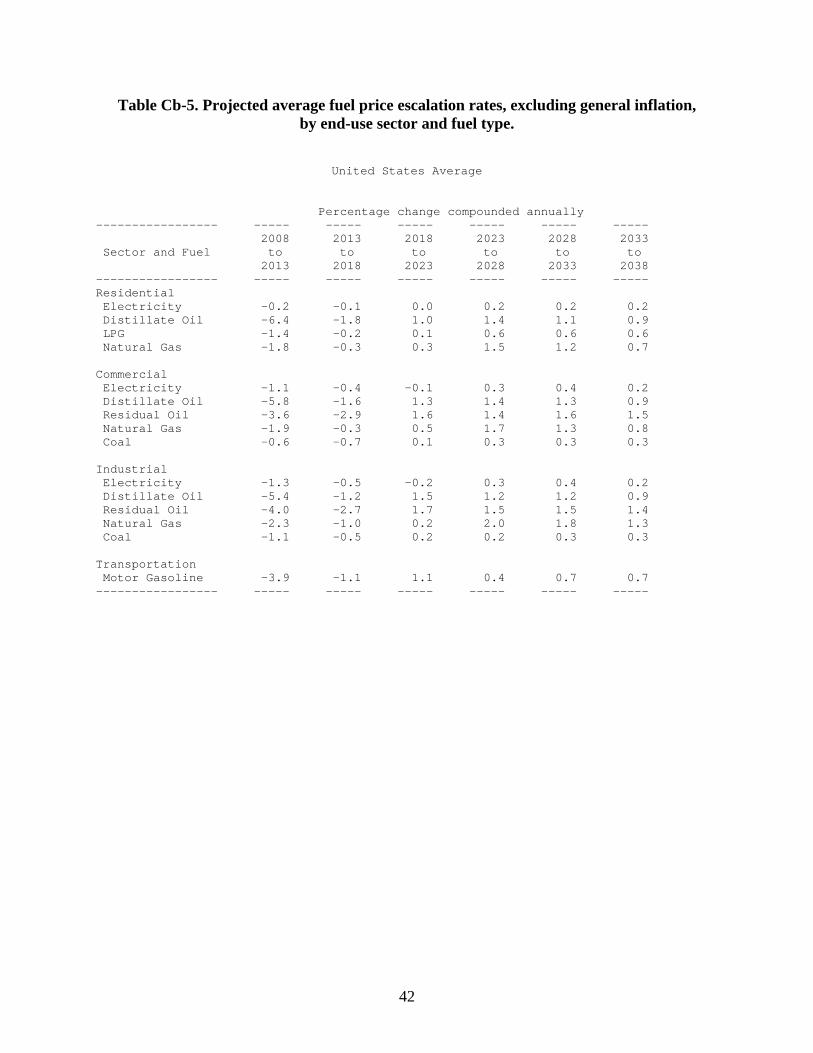
Cb-5 Projected average fuel price escalation rates (excluding general price inflation) by end-use sector and fuel type United States Average 42
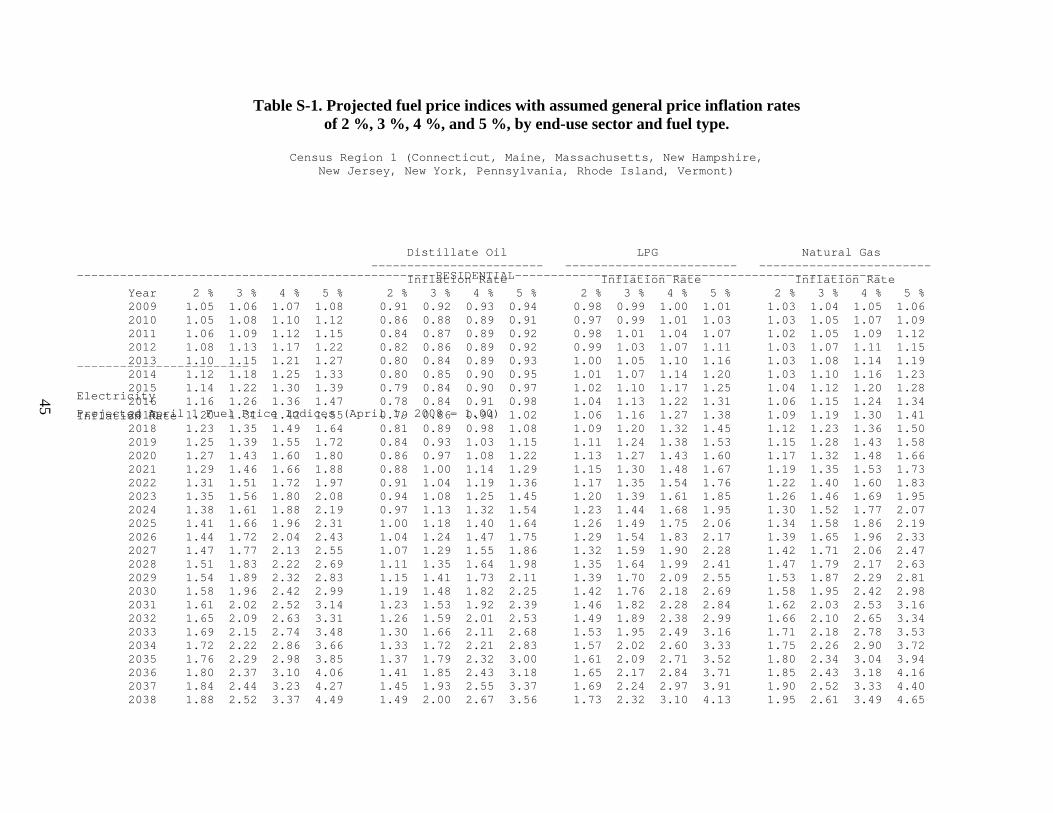
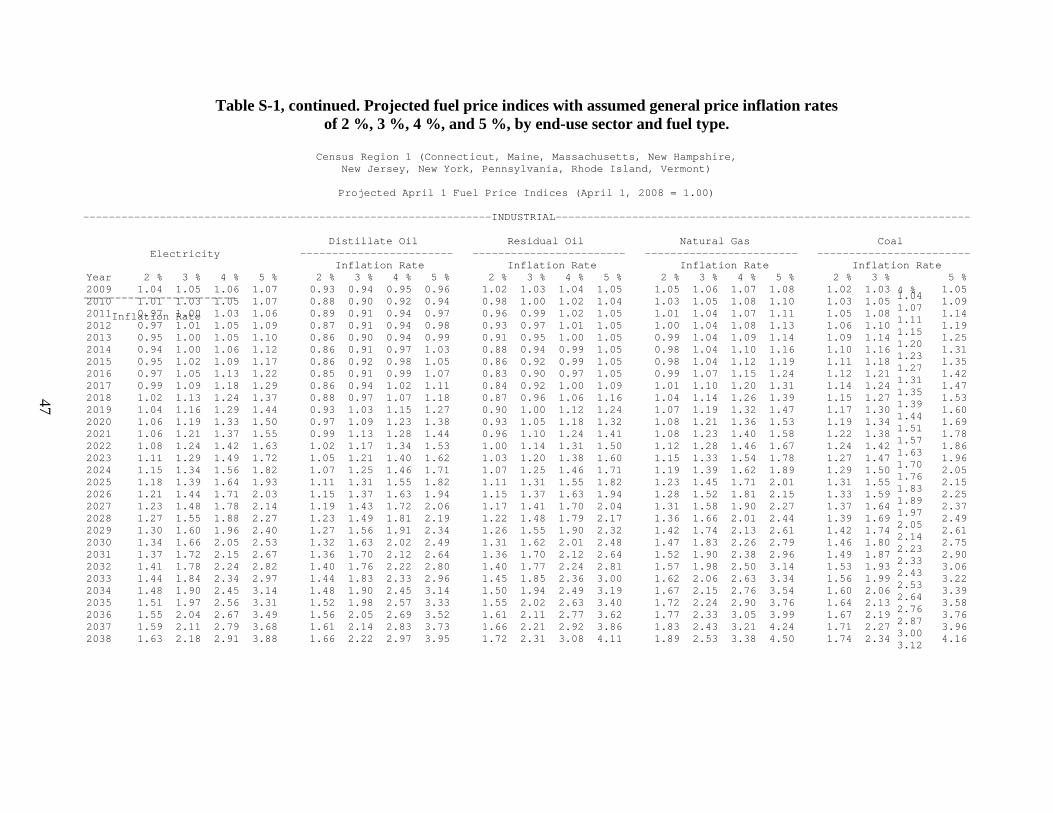
S-1 Projected fuel price indices with assumed general price inflation rates of 2 3 4 and 5 by end-use sector and fuel type Census Region 1 (Connecticut Maine Massachusetts New Hampshire New Jersey New York Pennsylvania Rhode Island Vermont) 45
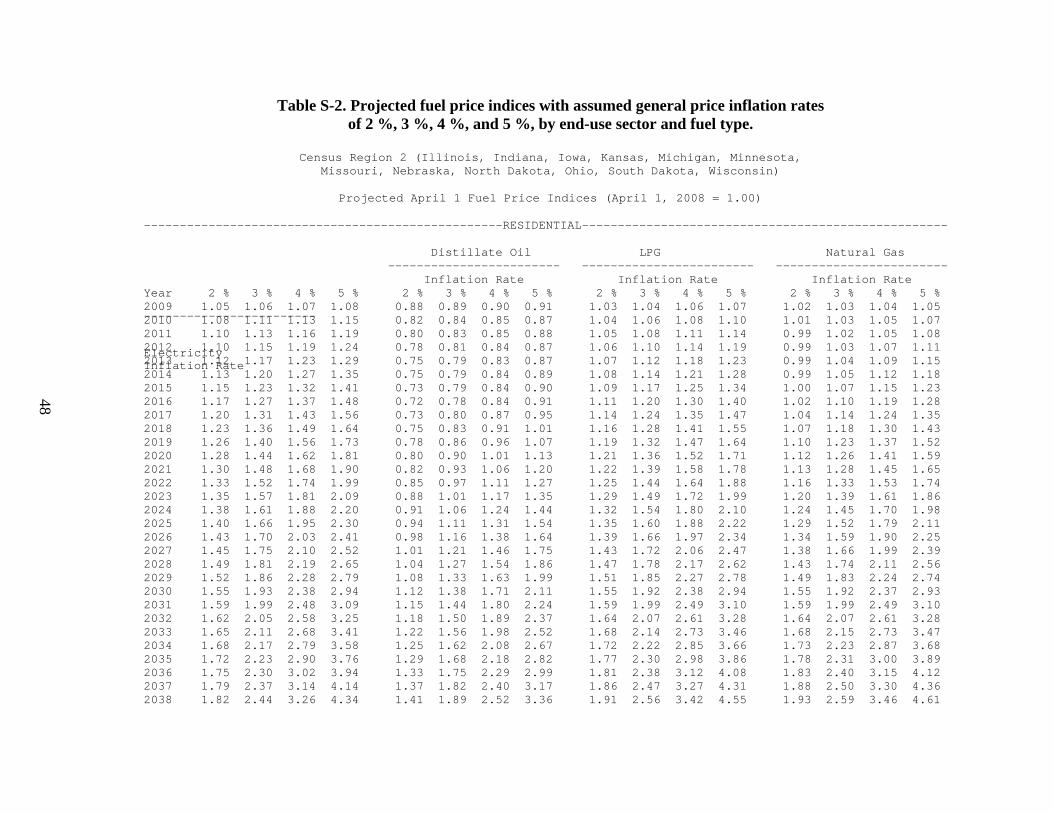
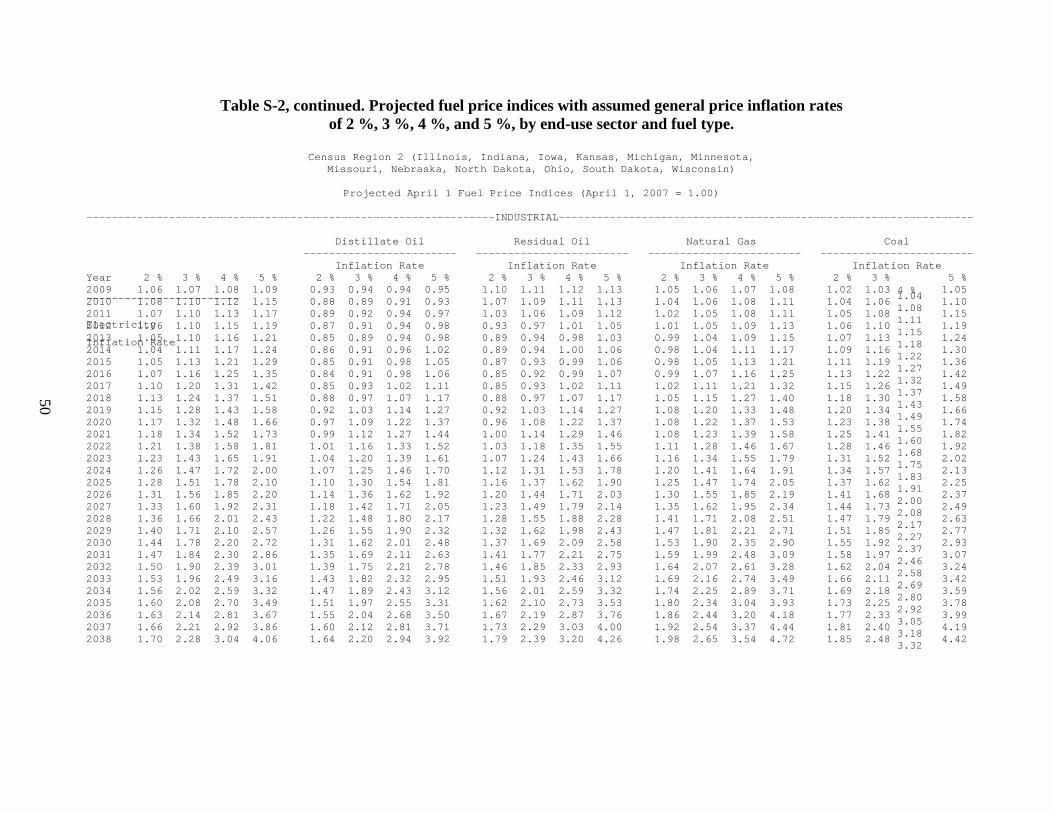
S-2 Projected fuel price indices with assumed general price inflation rates of 2 3 4 and 5 by end-use sector and fuel type Census Region 2 (Illinois Indiana Iowa Kansas Michigan Minnesota Nebraska North Dakota Ohio South Dakota Wisconsin) 48
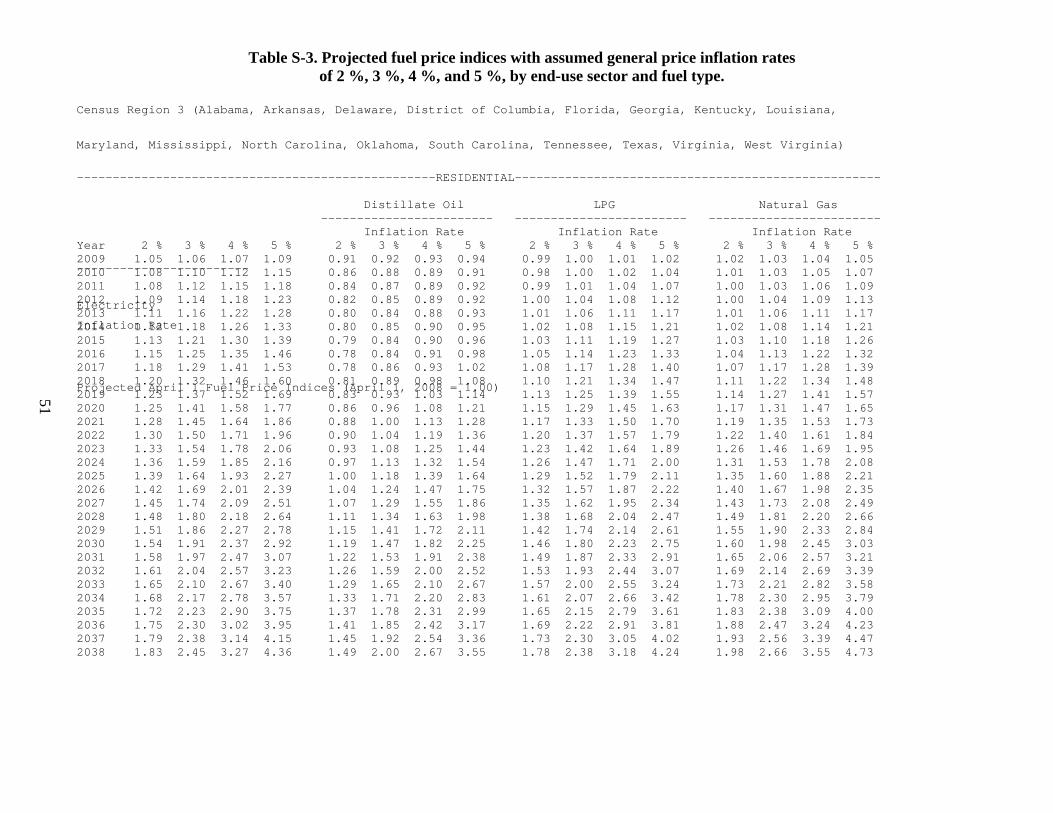
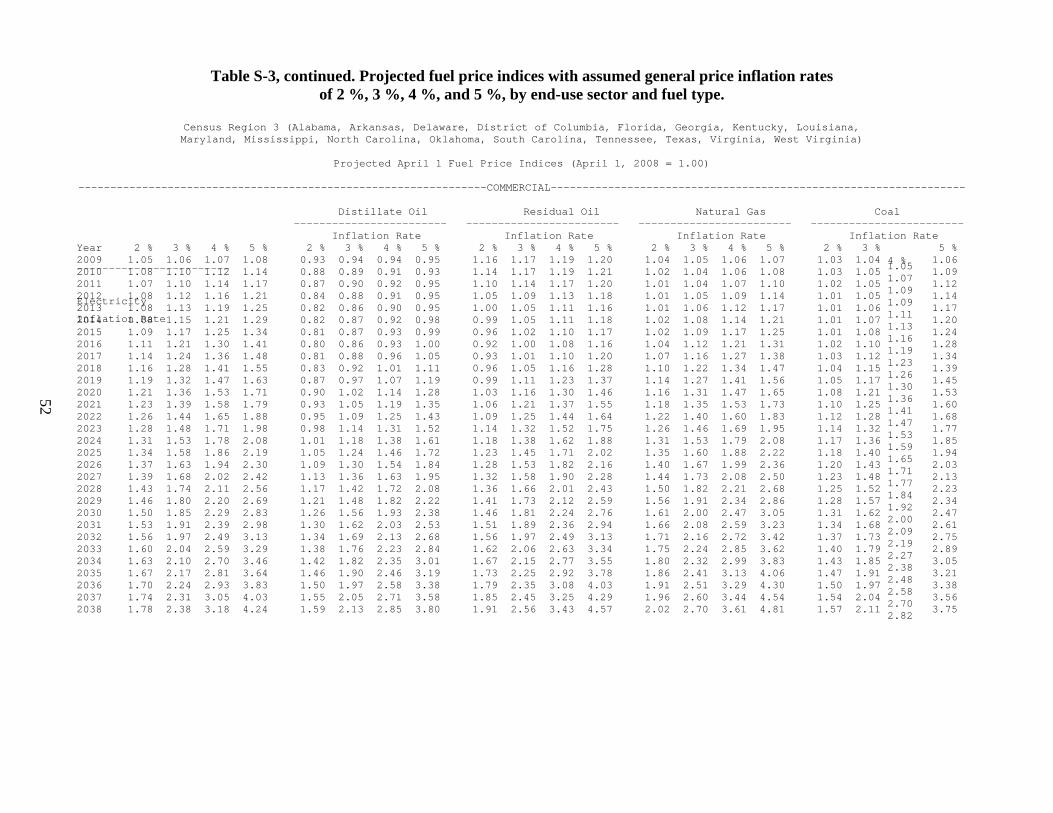
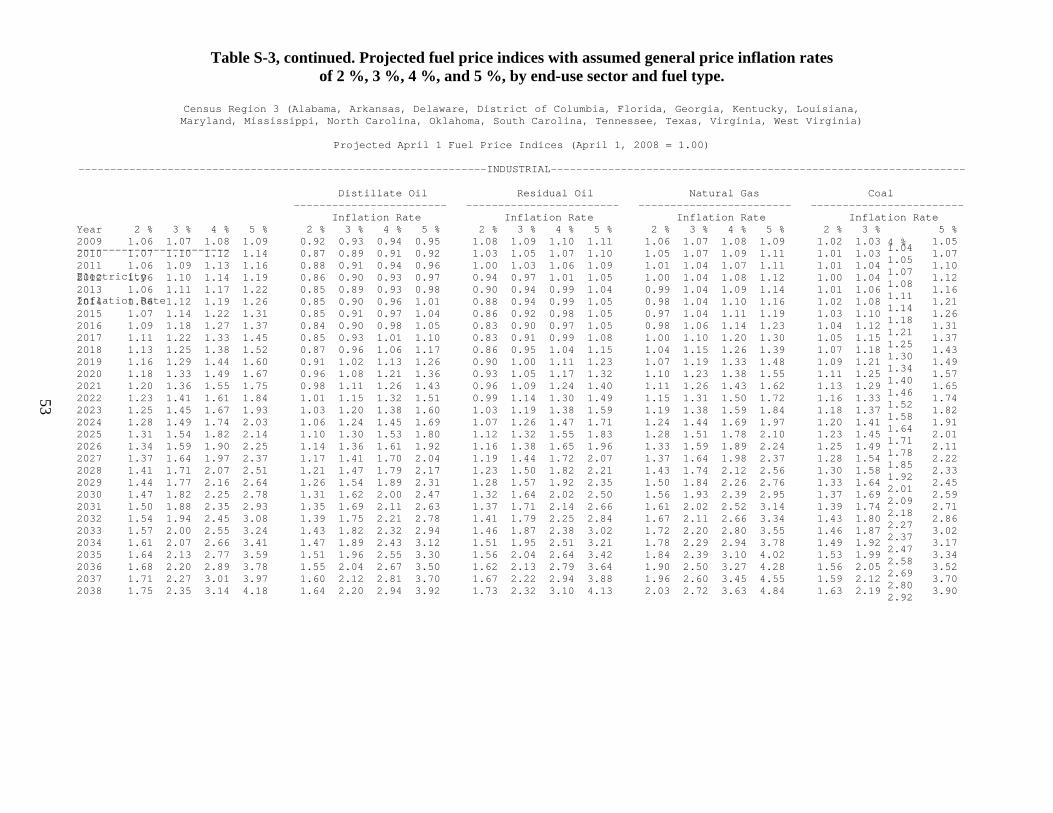
S-3 Projected fuel price indices with assumed general price inflation rates of 2 3 4 and 5 by end-use sector and fuel type Census Region 3 (Alabama Arkansas Delaware District of Columbia Florida Georgia Kentucky Louisiana Maryland Mississippi North Carolina Oklahoma South Carolina Tennessee Texas Virginia West Virginia)51
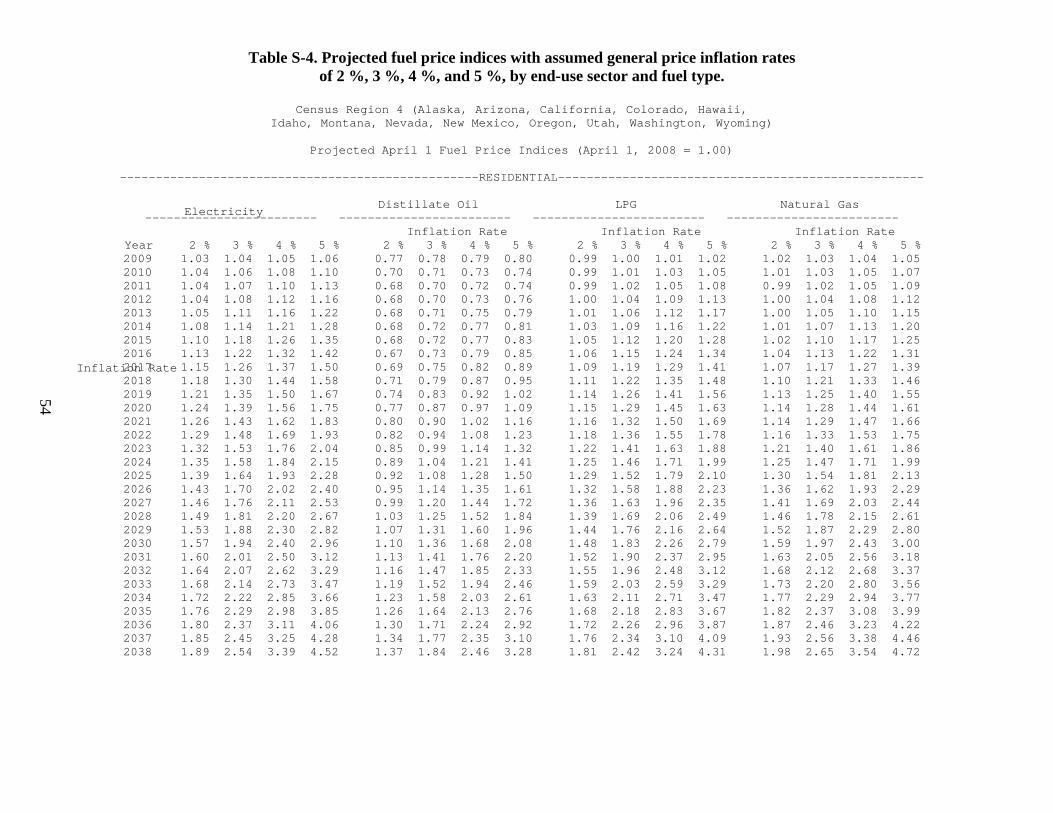
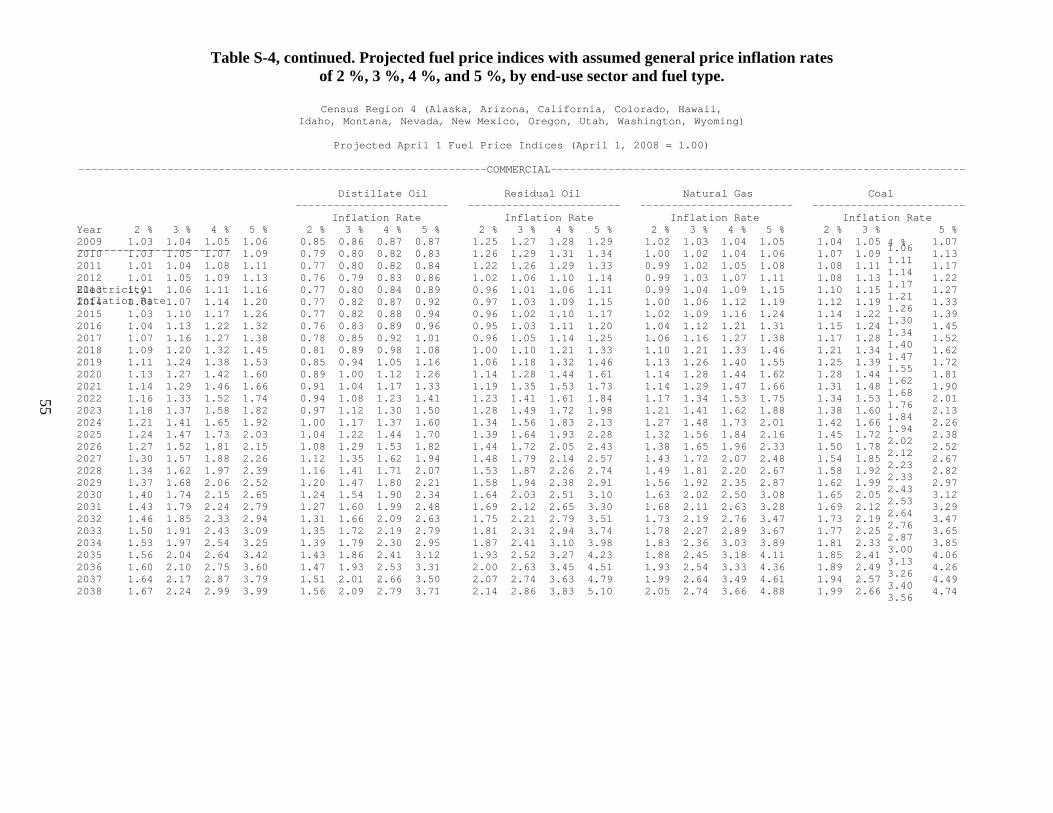
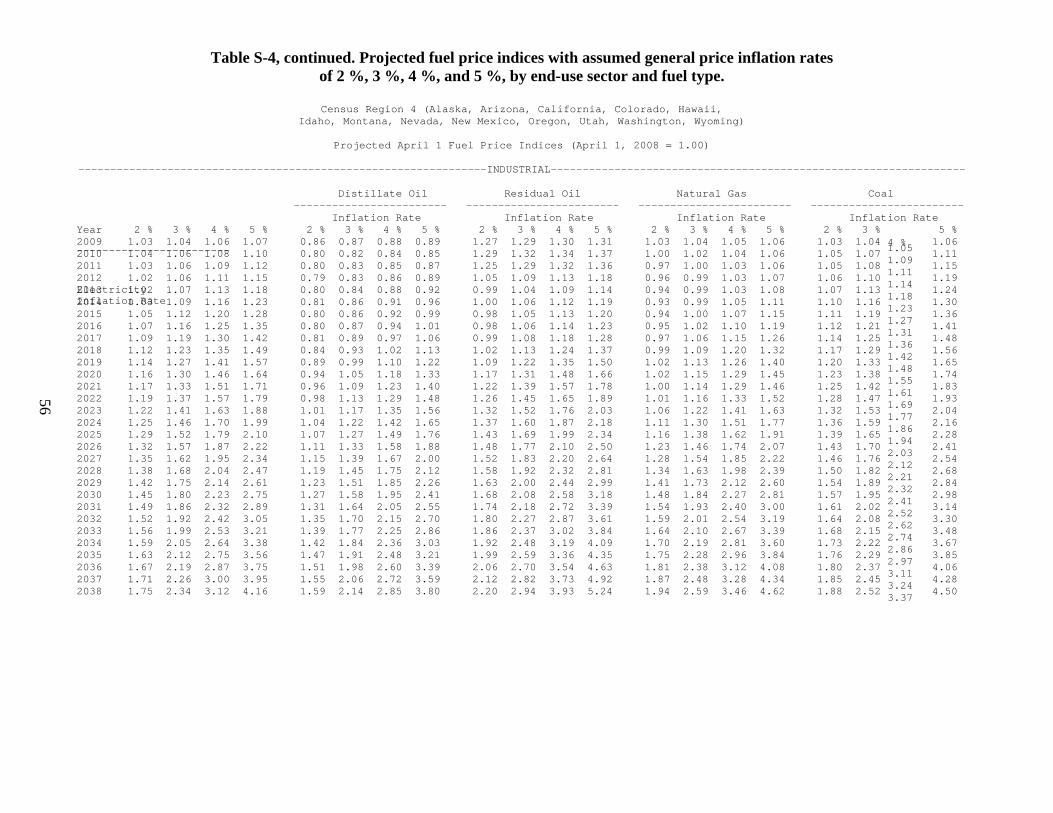
S-4 Projected fuel price indices with assumed general price inflation rates of 2 3 4 and 5 by end-use sector and fuel type Census Region 4 (Alaska Arizona California Colorado Hawaii Idaho Montana Nevada New Mexico Oregon Utah Washington Wyoming) 54
S-5 Projected fuel price indices with assumed general price inflation rates of 2 3 4 and 5 by end-use sector and fuel type United States Averagehelliphelliphelliphelliphellip57
xii
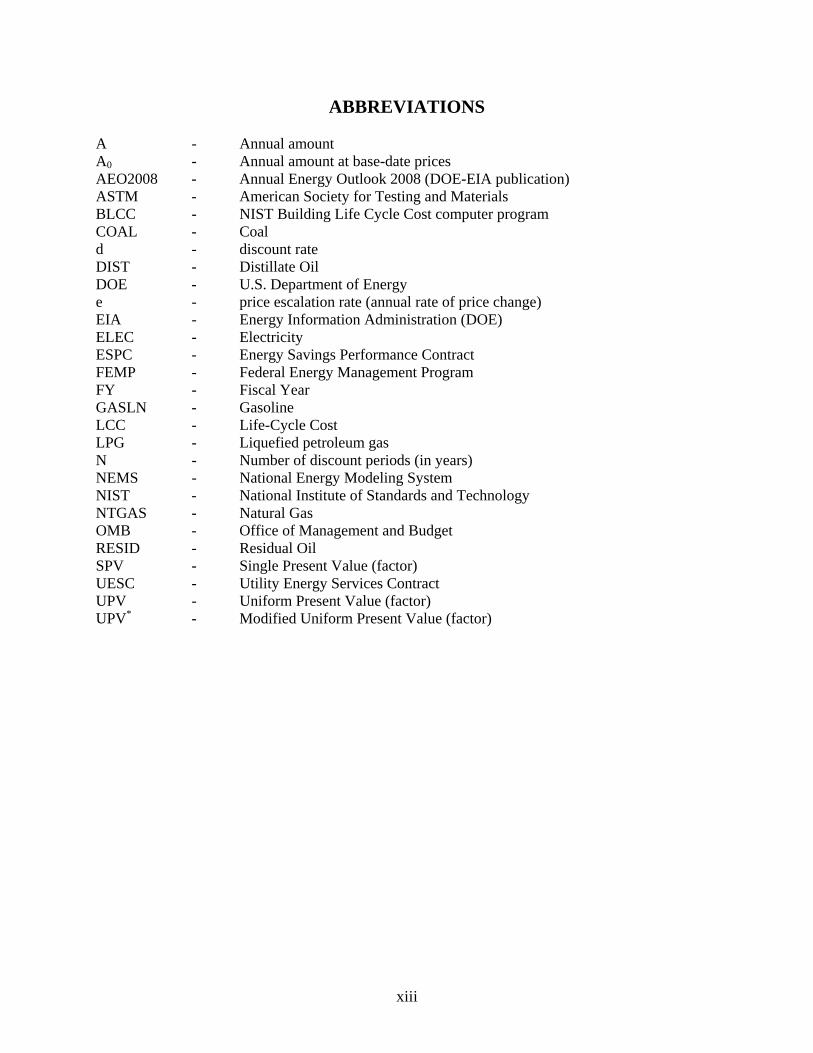
ABBREVIATIONS
A - Annual amount A0 - Annual amount at base-date prices AEO2008 - Annual Energy Outlook 2008 (DOE-EIA publication) ASTM - American Society for Testing and Materials BLCC - NIST Building Life Cycle Cost computer program COAL - Coal d - discount rate DIST - Distillate Oil DOE - US Department of Energy e - price escalation rate (annual rate of price change) EIA - Energy Information Administration (DOE) ELEC - Electricity ESPC - Energy Savings Performance Contract FEMP - Federal Energy Management Program FY - Fiscal Year GASLN - Gasoline LCC - Life-Cycle Cost LPG - Liquefied petroleum gas N - Number of discount periods (in years) NEMS - National Energy Modeling System NIST - National Institute of Standards and Technology NTGAS - Natural Gas OMB - Office of Management and Budget RESID - Residual Oil SPV - Single Present Value (factor) UESC - Utility Energy Services Contract UPV - Uniform Present Value (factor) UPV - Modified Uniform Present Value (factor)
xiii
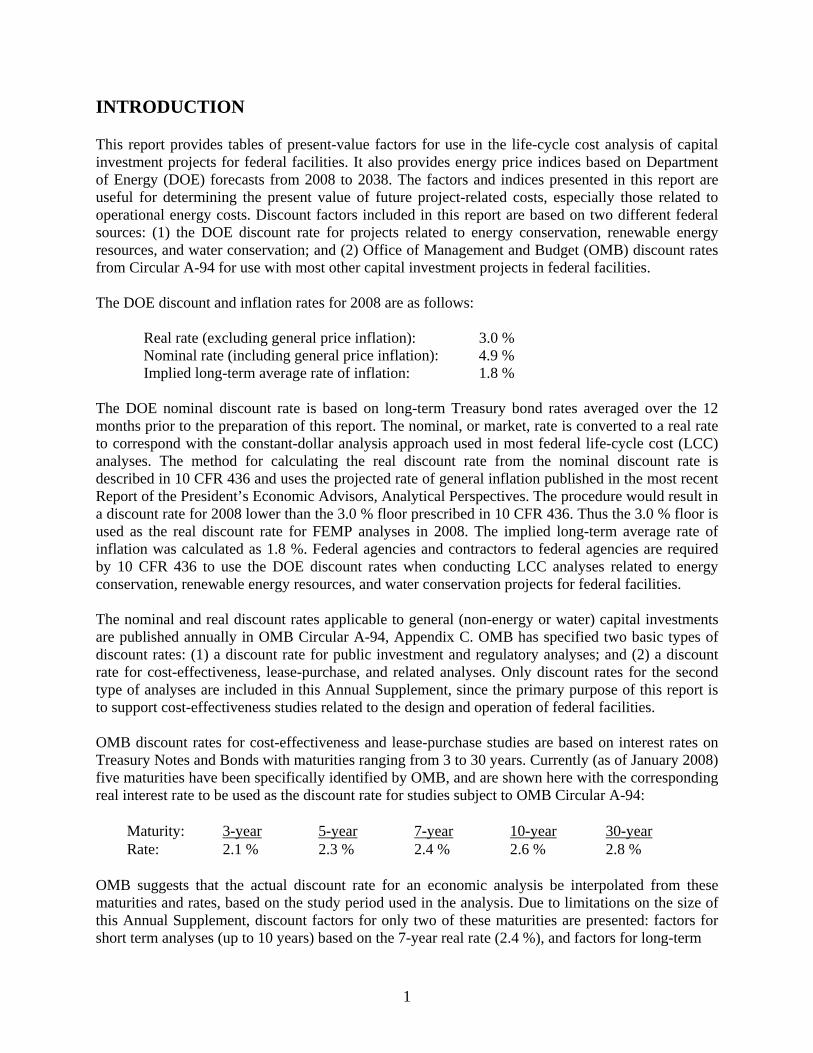
INTRODUCTION
This report provides tables of present-value factors for use in the life-cycle cost analysis of capital investment projects for federal facilities It also provides energy price indices based on Department of Energy (DOE) forecasts from 2008 to 2038 The factors and indices presented in this report are useful for determining the present value of future project-related costs especially those related to operational energy costs Discount factors included in this report are based on two different federal sources (1) the DOE discount rate for projects related to energy conservation renewable energy resources and water conservation and (2) Office of Management and Budget (OMB) discount rates from Circular A-94 for use with most other capital investment projects in federal facilities
The DOE discount and inflation rates for 2008 are as follows
Real rate (excluding general price inflation) 30 Nominal rate (including general price inflation) 49 Implied long-term average rate of inflation 18
The DOE nominal discount rate is based on long-term Treasury bond rates averaged over the 12 months prior to the preparation of this report The nominal or market rate is converted to a real rate to correspond with the constant-dollar analysis approach used in most federal life-cycle cost (LCC) analyses The method for calculating the real discount rate from the nominal discount rate is described in 10 CFR 436 and uses the projected rate of general inflation published in the most recent Report of the Presidentrsquos Economic Advisors Analytical Perspectives The procedure would result in a discount rate for 2008 lower than the 30 floor prescribed in 10 CFR 436 Thus the 30 floor is used as the real discount rate for FEMP analyses in 2008 The implied long-term average rate of inflation was calculated as 18 Federal agencies and contractors to federal agencies are required by 10 CFR 436 to use the DOE discount rates when conducting LCC analyses related to energy conservation renewable energy resources and water conservation projects for federal facilities
The nominal and real discount rates applicable to general (non-energy or water) capital investments are published annually in OMB Circular A-94 Appendix C OMB has specified two basic types of discount rates (1) a discount rate for public investment and regulatory analyses and (2) a discount rate for cost-effectiveness lease-purchase and related analyses Only discount rates for the second type of analyses are included in this Annual Supplement since the primary purpose of this report is to support cost-effectiveness studies related to the design and operation of federal facilities
OMB discount rates for cost-effectiveness and lease-purchase studies are based on interest rates on Treasury Notes and Bonds with maturities ranging from 3 to 30 years Currently (as of January 2008) five maturities have been specifically identified by OMB and are shown here with the corresponding real interest rate to be used as the discount rate for studies subject to OMB Circular A-94
Maturity 3-year 5-year 7-year 10-year 30-yearRate 21 23 24 26 28
OMB suggests that the actual discount rate for an economic analysis be interpolated from these maturities and rates based on the study period used in the analysis Due to limitations on the size of this Annual Supplement discount factors for only two of these maturities are presented factors for short term analyses (up to 10 years) based on the 7-year real rate (24 ) and factors for long-term
1
analyses (longer than 10 years) based on the 30-year real rate (28 ) As a result these discount factors are for approximation purposes only It is suggested that the NIST Building Life Cycle Cost (BLCC) or DISCOUNT programs be used to compute the present value factors for the discount rate corresponding to the length of the study period when approximate values are not satisfactory for the project analysis (See preface for details on obtaining these programs)
The energy price indices and corresponding present value factors published in this report are computed from energy price forecasts provided to NIST by the Department of Energys Energy Information Administration (EIA) The EIA energy price forecast used in this report was the most recent available at the time that this report was prepared A description of the methodology used by EIA to project energy prices through 2038 is included in section B of this report DOE has not projected escalation rates for water prices to be used in the LCC analysis of water conservation projects Water escalation rates should be obtained from the local water utility when possible
Federal agencies and contractors to federal agencies are encouraged to seek energy price projections from their local utility to use in place of the DOEEIA regional projections especially when evaluating alternative fuel types In such cases the NIST BLCC or DISCOUNT programs can be used to calculate appropriate modified uniform present value (UPV) factors for use in the LCC analysis of federal energy conservation or renewable resource projects Otherwise 10 CFR 436 requires the use of the DOE energy price forecasts when conducting LCC analyses of such projects The UPV factors for energy costs presented in this report have been precalculated with the DOE forecast data Thus the use of these UPV factors automatically ensures that the DOE forecast data have been included in the analysis
All of the tables of discount factors contained in this report are based on real discount rates and are therefore intended for use only with economic analyses conducted in constant dollars (in which the purchasing power of the dollar is held constant) The energy price escalation rates and corresponding energy price indices contained in this report are also expressed in real terms If nominal discount rates and current dollar costs (which both include inflation) are used in the LCC analyses of federal projects choose the current-dollar-analysis option in the BLCC5 computer program which uses a nominal discount rate and adds the rate of general inflation to all dollar amounts
This report uses the term present value instead of present worth for the discount factors presented The meaning of these two terms is considered to be identical for purposes of economic analysis This change in terminology was made to be consistent with the terms used in the American Society for Testing and Materials (ASTM) compilation of standards on building economics (ASTM Standards on Building Economics 6th Edition ASTM West Conshohocken PA 2007)
In all of the tables the ldquoend-of-yearrdquo discounting convention is used that is all factors and indices are computed to adjust future dollar amounts to present value from the end of the year in which they are expected to occur The factors and indices in this publication which include energy price escalation rates (eg UPV factors and energy price indices) were calculated using April 1 2008 (the date of this publication) as their base date However these factors and indices can be used without adjustment for the LCC analysis of projects with other base dates until the release of the next revision of this publication (April 2009) Adjustment of these factors and indices for differences in the month-specific base date is not generally warranted due to uncertainties in estimating future energy prices
2
PART I TABLES FOR FEDERAL LIFE-CYCLE COST ANALYSIS
A Single Present Value and Uniform Present Value Factors for Non-Fuel Costs
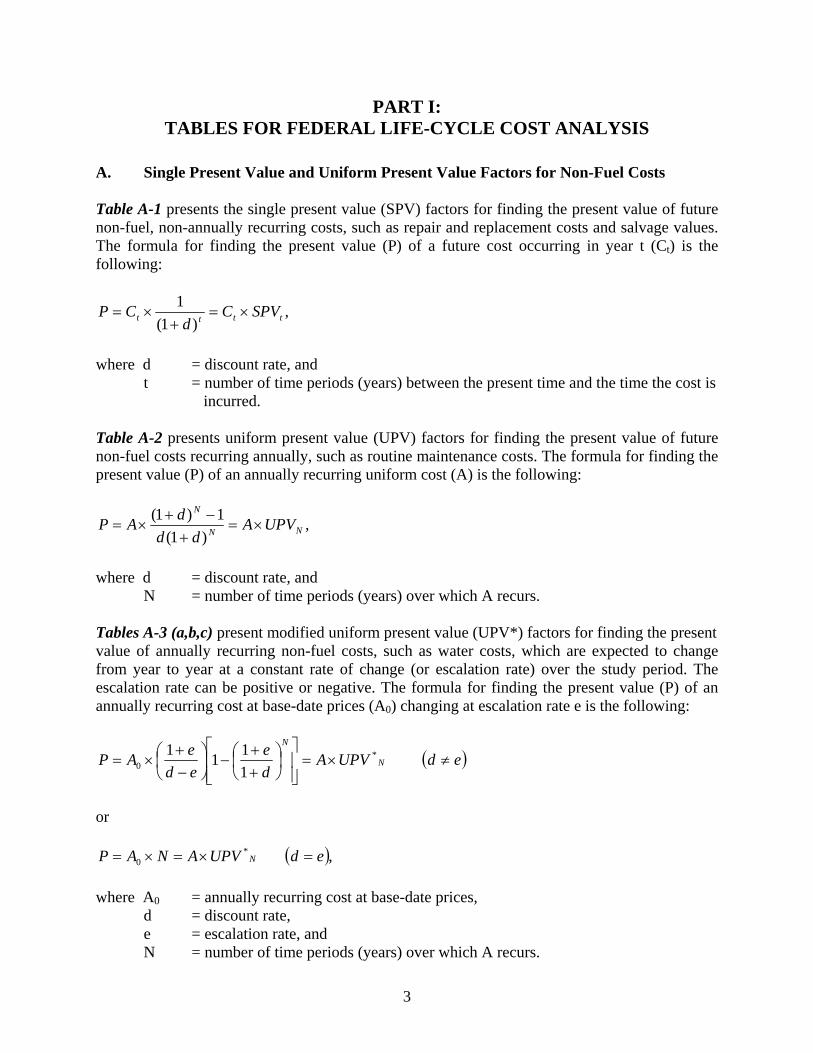
Table A-1 presents the single present value (SPV) factors for finding the present value of future non-fuel non-annually recurring costs such as repair and replacement costs and salvage values The formula for finding the present value (P) of a future cost occurring in year t (Ct) is the following
1P = Ct times t = Ct times SPVt (1+ d )
where d = discount rate and t = number of time periods (years) between the present time and the time the cost is
incurred
Table A-2 presents uniform present value (UPV) factors for finding the present value of future non-fuel costs recurring annually such as routine maintenance costs The formula for finding the present value (P) of an annually recurring uniform cost (A) is the following
P = Atimes (1 d +
(1 d +
) d
N
) minus N
1 = AtimesUPVN
where d = discount rate and N = number of time periods (years) over which A recurs
Tables A-3 (abc) present modified uniform present value (UPV) factors for finding the present value of annually recurring non-fuel costs such as water costs which are expected to change from year to year at a constant rate of change (or escalation rate) over the study period The escalation rate can be positive or negative The formula for finding the present value (P) of an annually recurring cost at base-date prices (A0) changing at escalation rate e is the following
P = A0 times ⎜⎛ 1+ e
⎟⎞⎢⎡ 1minus ⎜⎛
1+ e ⎟⎞
N
⎥⎤ = AtimesUPV
N (d ne e)⎝ d minus e ⎠⎢⎣ ⎝1+ d ⎠ ⎥⎦
or
P = A0 times N = AtimesUPV N (d = e)
where A0 = annually recurring cost at base-date prices d = discount rate e = escalation rate and N = number of time periods (years) over which A recurs
3
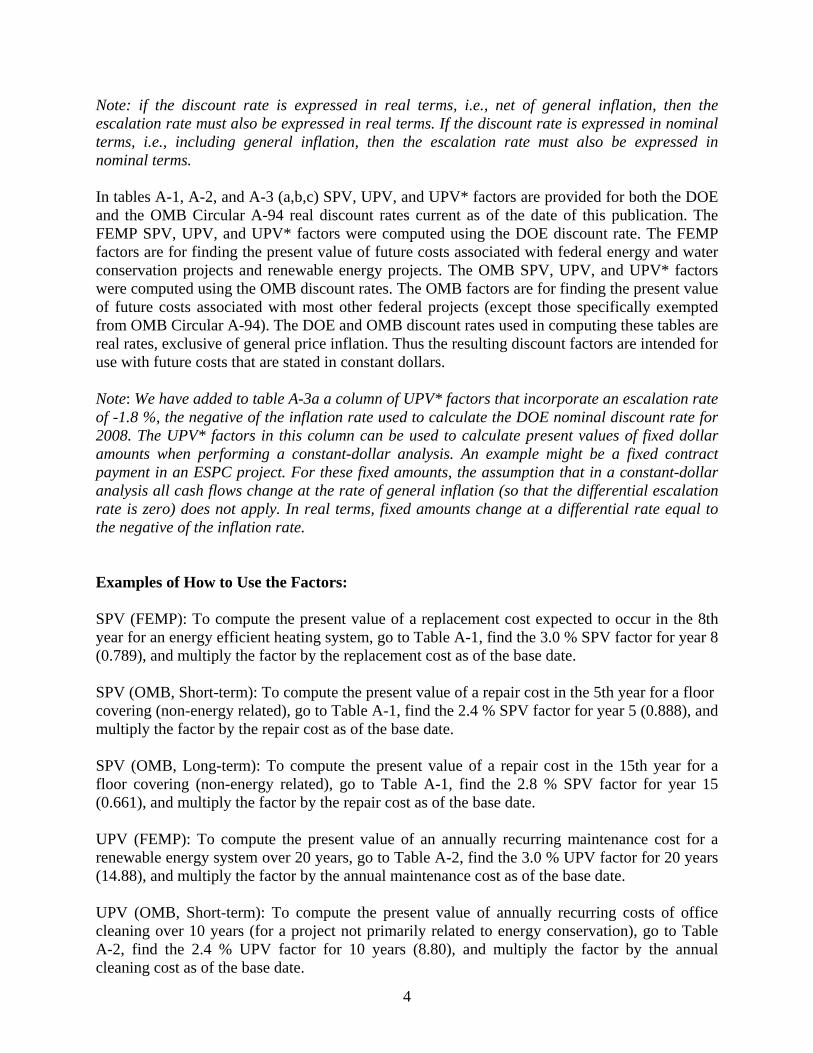
Note if the discount rate is expressed in real terms ie net of general inflation then the escalation rate must also be expressed in real terms If the discount rate is expressed in nominal terms ie including general inflation then the escalation rate must also be expressed in nominal terms
In tables A-1 A-2 and A-3 (abc) SPV UPV and UPV factors are provided for both the DOE and the OMB Circular A-94 real discount rates current as of the date of this publication The FEMP SPV UPV and UPV factors were computed using the DOE discount rate The FEMP factors are for finding the present value of future costs associated with federal energy and water conservation projects and renewable energy projects The OMB SPV UPV and UPV factors were computed using the OMB discount rates The OMB factors are for finding the present value of future costs associated with most other federal projects (except those specifically exempted from OMB Circular A-94) The DOE and OMB discount rates used in computing these tables are real rates exclusive of general price inflation Thus the resulting discount factors are intended for use with future costs that are stated in constant dollars
Note We have added to table A-3a a column of UPV factors that incorporate an escalation rate of -18 the negative of the inflation rate used to calculate the DOE nominal discount rate for 2008 The UPV factors in this column can be used to calculate present values of fixed dollar amounts when performing a constant-dollar analysis An example might be a fixed contract payment in an ESPC project For these fixed amounts the assumption that in a constant-dollar analysis all cash flows change at the rate of general inflation (so that the differential escalation rate is zero) does not apply In real terms fixed amounts change at a differential rate equal to the negative of the inflation rate
Examples of How to Use the Factors
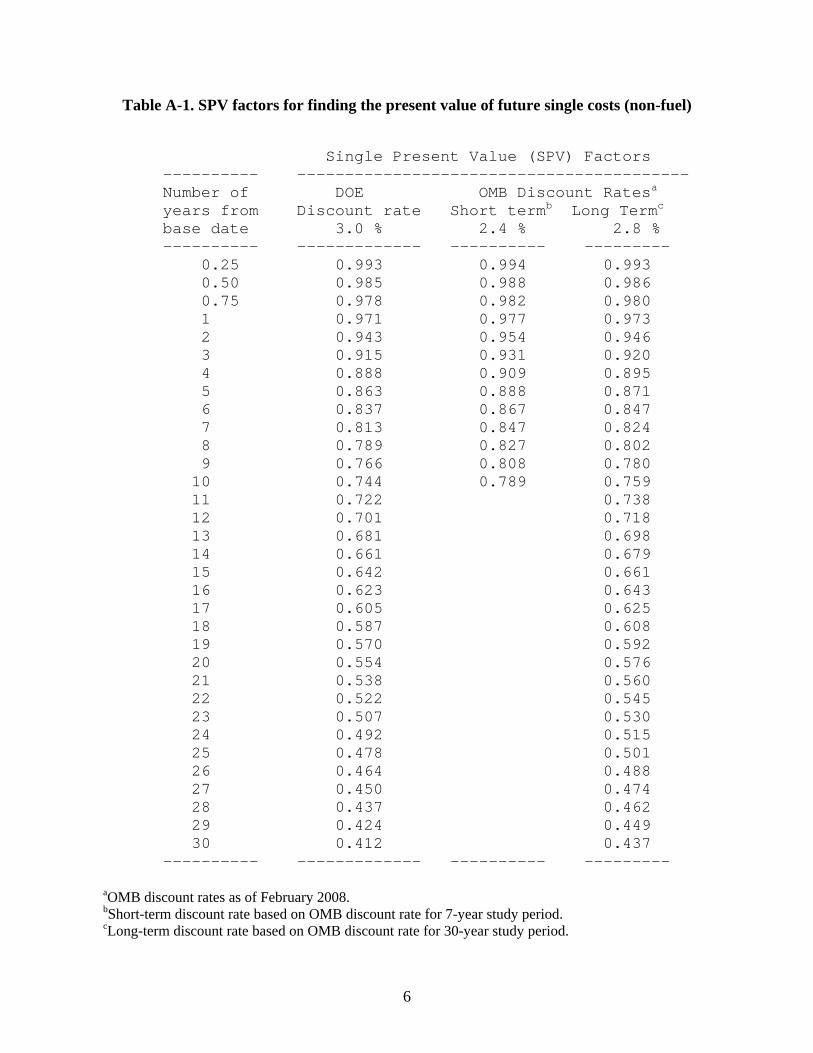
SPV (FEMP) To compute the present value of a replacement cost expected to occur in the 8th year for an energy efficient heating system go to Table A-1 find the 30 SPV factor for year 8 (0789) and multiply the factor by the replacement cost as of the base date
SPV (OMB Short-term) To compute the present value of a repair cost in the 5th year for a floor covering (non-energy related) go to Table A-1 find the 24 SPV factor for year 5 (0888) and multiply the factor by the repair cost as of the base date
SPV (OMB Long-term) To compute the present value of a repair cost in the 15th year for a floor covering (non-energy related) go to Table A-1 find the 28 SPV factor for year 15 (0661) and multiply the factor by the repair cost as of the base date
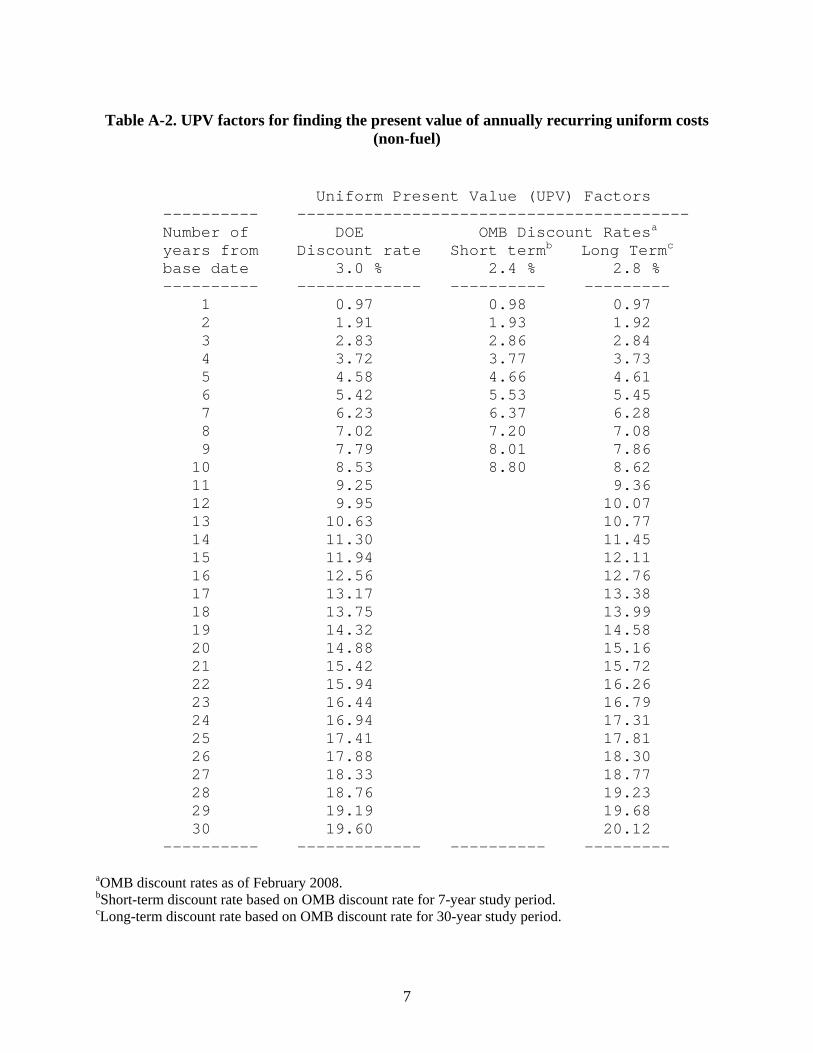
UPV (FEMP) To compute the present value of an annually recurring maintenance cost for a renewable energy system over 20 years go to Table A-2 find the 30 UPV factor for 20 years (1488) and multiply the factor by the annual maintenance cost as of the base date
UPV (OMB Short-term) To compute the present value of annually recurring costs of office cleaning over 10 years (for a project not primarily related to energy conservation) go to Table A-2 find the 24 UPV factor for 10 years (880) and multiply the factor by the annual cleaning cost as of the base date
4
UPV (OMB Long-term) To compute the present value of annually recurring costs of office cleaning over 25 years (for a project not primarily related to energy conservation) got to Table A-2 find the 28 UPV factor for 25 years (1781) and multiply the factor by the annual cleaning cost as of the base date
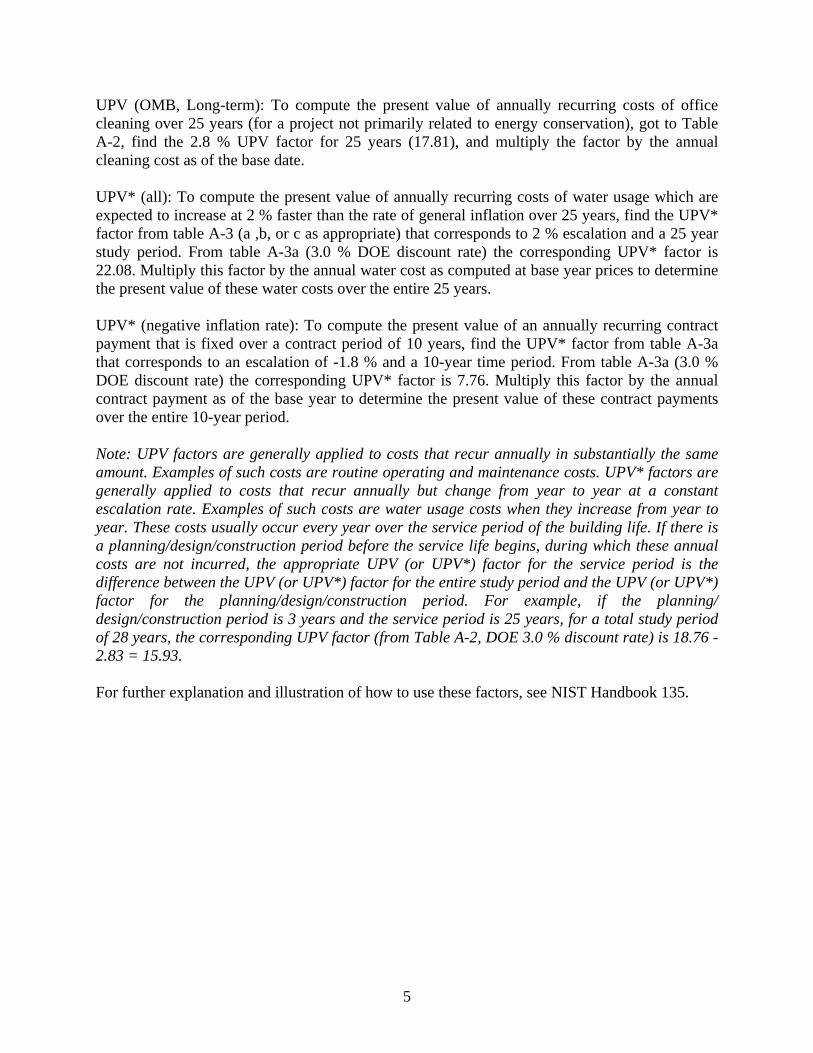
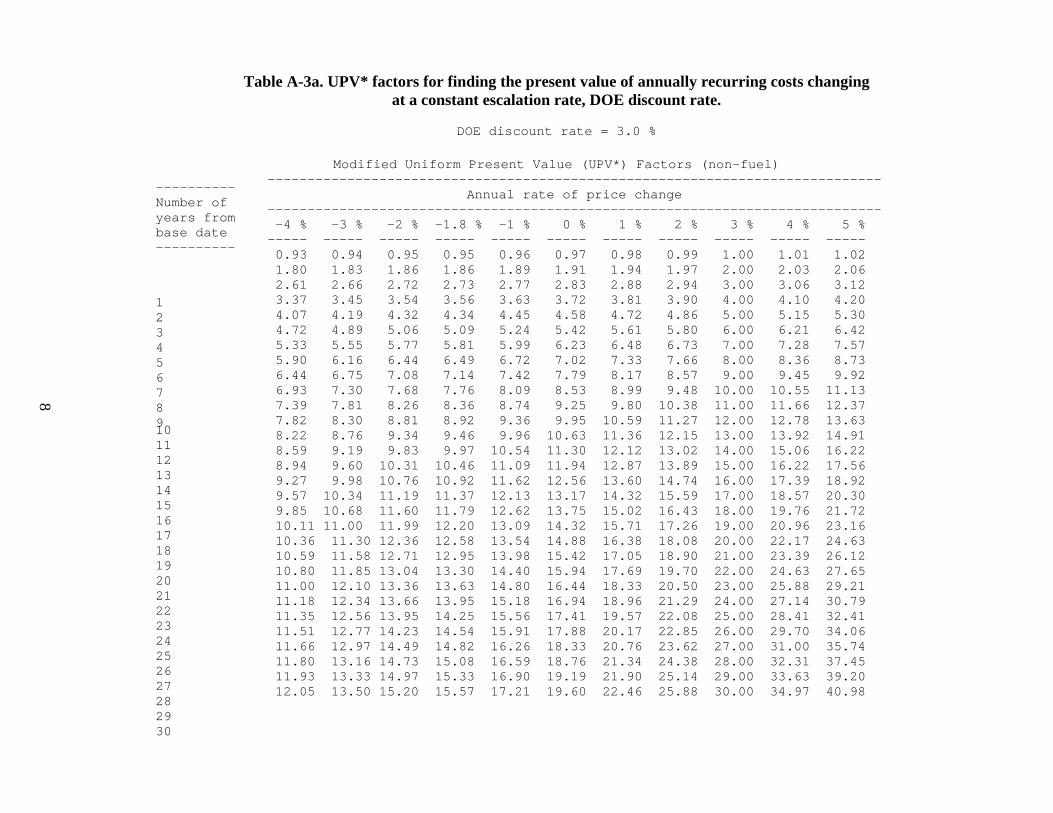
UPV (all) To compute the present value of annually recurring costs of water usage which are expected to increase at 2 faster than the rate of general inflation over 25 years find the UPV factor from table A-3 (a b or c as appropriate) that corresponds to 2 escalation and a 25 year study period From table A-3a (30 DOE discount rate) the corresponding UPV factor is 2208 Multiply this factor by the annual water cost as computed at base year prices to determine the present value of these water costs over the entire 25 years
UPV (negative inflation rate) To compute the present value of an annually recurring contract payment that is fixed over a contract period of 10 years find the UPV factor from table A-3a that corresponds to an escalation of -18 and a 10-year time period From table A-3a (30 DOE discount rate) the corresponding UPV factor is 776 Multiply this factor by the annual contract payment as of the base year to determine the present value of these contract payments over the entire 10-year period
Note UPV factors are generally applied to costs that recur annually in substantially the same amount Examples of such costs are routine operating and maintenance costs UPV factors are generally applied to costs that recur annually but change from year to year at a constant escalation rate Examples of such costs are water usage costs when they increase from year to year These costs usually occur every year over the service period of the building life If there is a planningdesignconstruction period before the service life begins during which these annual costs are not incurred the appropriate UPV (or UPV) factor for the service period is the difference between the UPV (or UPV) factor for the entire study period and the UPV (or UPV) factor for the planningdesignconstruction period For example if the planning designconstruction period is 3 years and the service period is 25 years for a total study period of 28 years the corresponding UPV factor (from Table A-2 DOE 30 discount rate) is 1876 - 283 = 1593
For further explanation and illustration of how to use these factors see NIST Handbook 135
5
Table A-1 SPV factors for finding the present value of future single costs (non-fuel)
Single Present Value (SPV) Factors---------- -----------------------------------------Number of DOE OMB Discount Ratesa
years frombase date
Discount rate 30
Short termb Long Termc
24 28 ---------- ------------- ---------- ---------
025 0993 0994 0993 050 0985 0988 0986 075 0978 0982 0980 1 0971 0977 0973 2 0943 0954 0946 3 0915 0931 0920 4 0888 0909 0895 5 0863 0888 0871 6 0837 0867 0847 7 0813 0847 0824 8 0789 0827 0802 9 0766 0808 0780 10 0744 0789 0759 11 0722 0738 12 0701 0718 13 0681 0698 14 0661 0679 15 0642 0661 16 0623 0643 17 0605 0625 18 0587 0608 19 0570 0592 20 0554 0576 21 0538 0560 22 0522 0545 23 0507 0530 24 0492 0515 25 0478 0501 26 0464 0488 27 0450 0474 28 0437 0462 29 0424 0449 30 0412 0437
---------- ------------- ---------- ---------
aOMB discount rates as of February 2008 bShort-term discount rate based on OMB discount rate for 7-year study period cLong-term discount rate based on OMB discount rate for 30-year study period
6
Table A-2 UPV factors for finding the present value of annually recurring uniform costs (non-fuel)
Uniform Present Value (UPV) Factors---------- -----------------------------------------Number of DOE OMB Discount Ratesa
years frombase date
Discount rate 30
Short termb Long Termc
24 28 ---------- ------------- ---------- ---------
1 097 098 097 2 191 193 192 3 283 286 284 4 372 377 373 5 458 466 461 6 542 553 545 7 623 637 628 8 702 720 708 9 779 801 786 10 853 880 862 11 925 936 12 995 1007 13 1063 1077 14 1130 1145 15 1194 1211 16 1256 1276 17 1317 1338 18 1375 1399 19 1432 1458 20 1488 1516 21 1542 1572 22 1594 1626 23 1644 1679 24 1694 1731 25 1741 1781 26 1788 1830 27 1833 1877 28 1876 1923 29 1919 1968 30 1960 2012
---------- ------------- ---------- ---------
aOMB discount rates as of February 2008 bShort-term discount rate based on OMB discount rate for 7-year study period cLong-term discount rate based on OMB discount rate for 30-year study period
7
8
Table A-3a UPV factors for finding the present value of annually recurring costs changing at a constant escalation rate DOE discount rate
DOE discount rate = 30
Modified Uniform Present Value (UPV) Factors (non-fuel)
---------------------------------------------------------------------------------------
Number of Annual rate of price change
years from -----------------------------------------------------------------------------
base date -4 -3 -2 -18 -1 0 1 2 3 4 5
--------------- ----- ----- ----- ----- ----- ----- ----- ----- ----- -----
1
093 094 095 095 096 097 098 099 100 101 102
2
180 183 186 186 189 191 194 197 200 203 206
3
261 266 272 273 277 283 288 294 300 306 312
4
337 345 354 356 363 372 381 390 400 410 420
5
407 419 432 434 445 458 472 486 500 515 530
6
472 489 506 509 524 542 561 580 600 621 642
7
533 555 577 581 599 623 648 673 700 728 757
8
590 616 644 649 672 702 733 766 800 836 873
9
644 675 708 714 742 779 817 857 900 945 992
10
693 730 768 776 809 853 899 948 1000 1055 1113
11
739 781 826 836 874 925 980 1038 1100 1166 1237
12
782 830 881 892 936 995 1059 1127 1200 1278 1363
13
822 876 934 946 996 1063 1136 1215 1300 1392 1491
14
859 919 983 997 1054 1130 1212 1302 1400 1506 1622
15
894 960 1031 1046 1109 1194 1287 1389 1500 1622 1756
16
927 998 1076 1092 1162 1256 1360 1474 1600 1739 1892
17
957 1034 1119 1137 1213 1317 1432 1559 1700 1857 2030
18
985 1068 1160 1179 1262 1375 1502 1643 1800 1976 2172
19
1011 1100 1199 1220 1309 1432 1571 1726 1900 2096 2316
20
1036 1130 1236 1258 1354 1488 1638 1808 2000 2217 2463
21
1059 1158 1271 1295 1398 1542 1705 1890 2100 2339 2612
22
1080 1185 1304 1330 1440 1594 1769 1970 2200 2463 2765
23
1100 1210 1336 1363 1480 1644 1833 2050 2300 2588 2921
24
1118 1234 1366 1395 1518 1694 1896 2129 2400 2714 3079
25
1135 1256 1395 1425 1556 1741 1957 2208 2500 2841 3241
26
1151 1277 1423 1454 1591 1788 2017 2285 2600 2970 3406
27
1166 1297 1449 1482 1626 1833 2076 2362 2700 3100 3574
28
1180 1316 1473 1508 1659 1876 2134 2438 2800 3231 3745
29
1193 1333 1497 1533 1690 1919 2190 2514 2900 3363 3920
30
1205 1350 1520 1557 1721 1960 2246 2588 3000 3497 4098
9
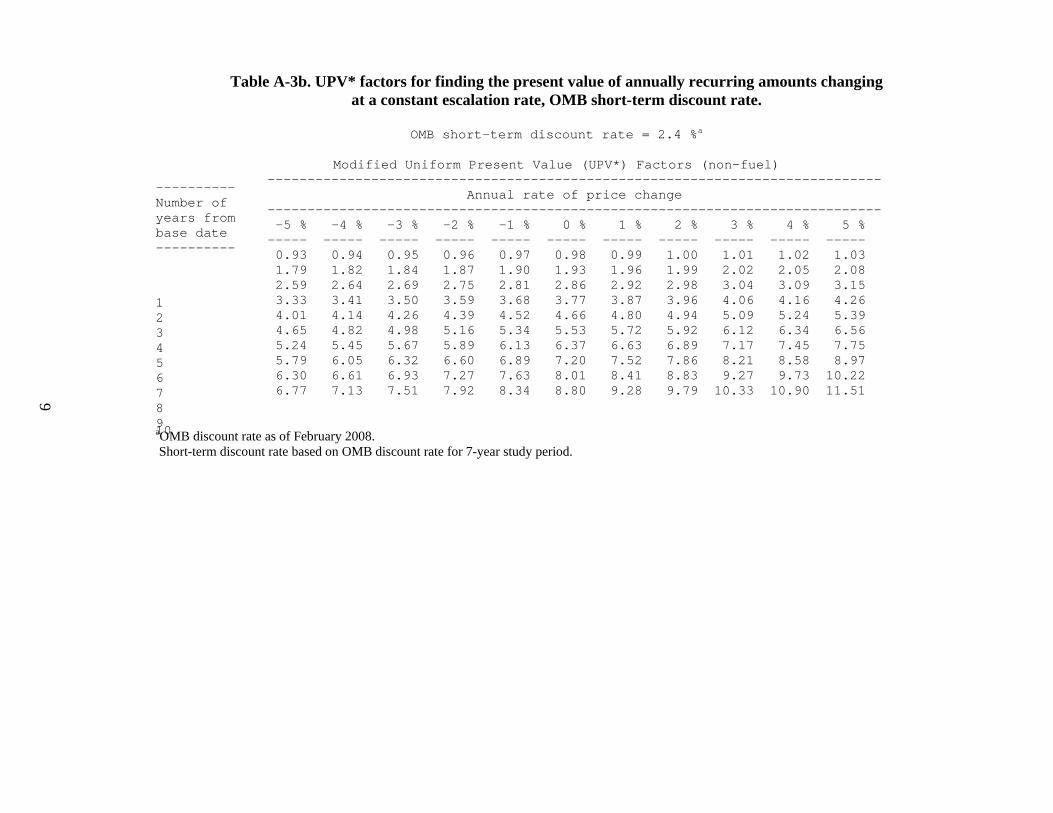
Table A-3b UPV factors for finding the present value of annually recurring amounts changing at a constant escalation rate OMB short-term discount rate
OMB short-term discount rate = 24 a
Modified Uniform Present Value (UPV) Factors (non-fuel)
---------------------------------------------------------------------------------------
Number of Annual rate of price change
years from -----------------------------------------------------------------------------
base date -5 -4 -3 -2 -1 0 1 2 3 4 5
--------------- ----- ----- ----- ----- ----- ----- ----- ----- ----- -----
1
093 094 095 096 097 098 099 100 101 102 103
2
179 182 184 187 190 193 196 199 202 205 208
3
259 264 269 275 281 286 292 298 304 309 315
4
333 341 350 359 368 377 387 396 406 416 426
5
401 414 426 439 452 466 480 494 509 524 539
6
465 482 498 516 534 553 572 592 612 634 656
7
524 545 567 589 613 637 663 689 717 745 775
8
579 605 632 660 689 720 752 786 821 858 897
9
630 661 693 727 763 801 841 883 927 973 1022
10
677 713 751 792 834 880 928 979 1033 1090 1151
aOMB discount rate as of February 2008 Short-term discount rate based on OMB discount rate for 7-year study period
10
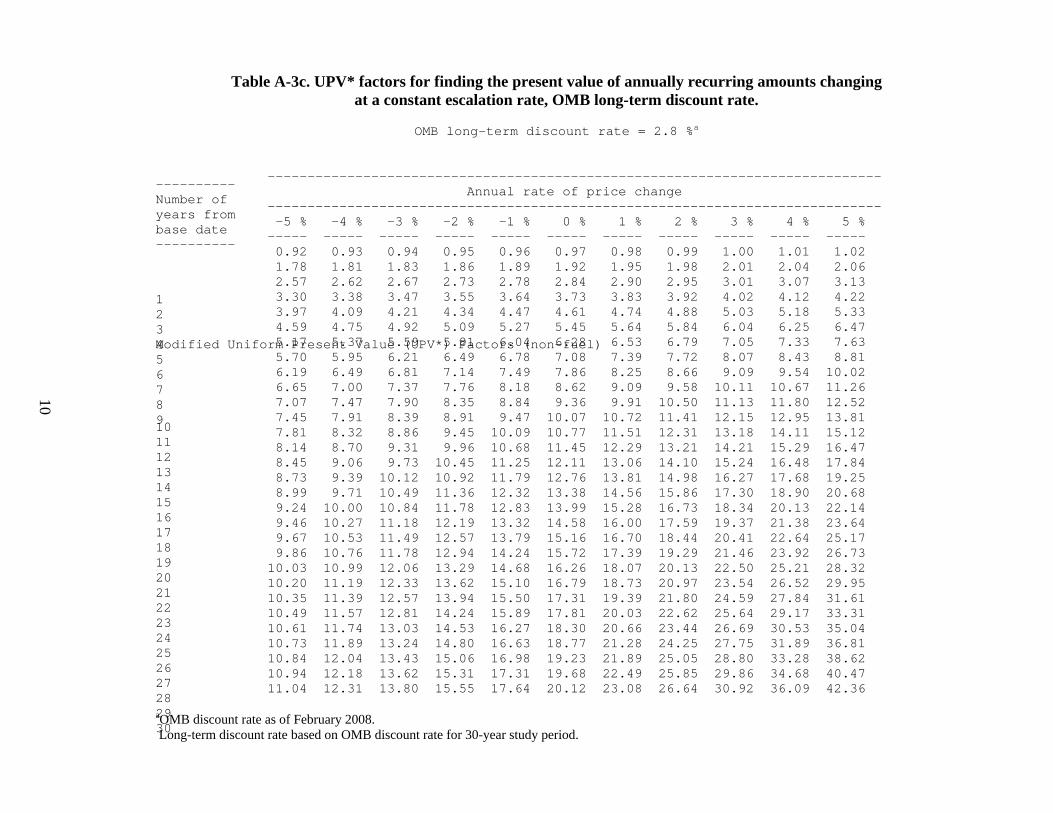
Table A-3c UPV factors for finding the present value of annually recurring amounts changing at a constant escalation rate OMB long-term discount rate
OMB long-term discount rate = 28 a
----------
Modified Uniform Present Value (UPV) Factors (non-fuel)
-----------------------------------------------------------------------------
Number of years frombase date
Annual rate of price change
-5 -4 -3 -2 -1 0 1 2 3 4 5 -----------------------------------------------------------------------------
--------------- ----- ----- ----- ----- ----- ----- ----- ----- ----- -----
1
092 093 094 095 096 097 098 099 100 101 102
2
178 181 183 186 189 192 195 198 201 204 206
3
257 262 267 273 278 284 290 295 301 307 313
4
330 338 347 355 364 373 383 392 402 412 422
5
397 409 421 434 447 461 474 488 503 518 533
6
459 475 492 509 527 545 564 584 604 625 647
7
517 537 559 581 604 628 653 679 705 733 763
8
570 595 621 649 678 708 739 772 807 843 881
9
619 649 681 714 749 786 825 866 909 954 1002
10
665 700 737 776 818 862 909 958 1011 1067 1126
11
707 747 790 835 884 936 991 1050 1113 1180 1252
12
745 791 839 891 947 1007 1072 1141 1215 1295 1381
13
781 832 886 945 1009 1077 1151 1231 1318 1411 1512
14
814 870 931 996 1068 1145 1229 1321 1421 1529 1647
15
845 906 973 1045 1125 1211 1306 1410 1524 1648 1784
16
873 939 1012 1092 1179 1276 1381 1498 1627 1768 1925
17
899 971 1049 1136 1232 1338 1456 1586 1730 1890 2068
18
924 1000 1084 1178 1283 1399 1528 1673 1834 2013 2214
19
946 1027 1118 1219 1332 1458 1600 1759 1937 2138 2364
20
967 1053 1149 1257 1379 1516 1670 1844 2041 2264 2517
21
986 1076 1178 1294 1424 1572 1739 1929 2146 2392 2673
22
1003 1099 1206 1329 1468 1626 1807 2013 2250 2521 2832
23
1020 1119 1233 1362 1510 1679 1873 2097 2354 2652 2995
24
1035 1139 1257 1394 1550 1731 1939 2180 2459 2784 3161
25
1049 1157 1281 1424 1589 1781 2003 2262 2564 2917 3331
26
1061 1174 1303 1453 1627 1830 2066 2344 2669 3053 3504
27
1073 1189 1324 1480 1663 1877 2128 2425 2775 3189 3681
28
1084 1204 1343 1506 1698 1923 2189 2505 2880 3328 3862
29
1094 1218 1362 1531 1731 1968 2249 2585 2986 3468 4047
30
1104 1231 1380 1555 1764 2012 2308 2664 3092 3609 4236
aOMB discount rate as of February 2008 Long-term discount rate based on OMB discount rate for 30-year study period
B Modified Uniform Present Value Factors for Fuel Costs
This section presents FEMP and OMB modified uniform present value (UPV) discount factors for calculating the present value of energy usage for federal projects Factors are provided for the four major Census regions and for the overall United States The factors are modified in the sense that they incorporate energy price escalation rates based on future energy prices projected by DOE for the years 2008 to 2038 There are two sets of UPV tables the Ba tables present FEMP UPV factors based on the DOE discount rate (30 real) and the Bb tables present OMB UPV factors based on two OMB discount rates (24 real for short-term study periods of 1 to 10 years 28 real for long-term study periods of 11 to 30 years) The underlying energy price indices for the years 2008 to 2038 on which these UPV calculations are based are shown in tables Ca-1 through Ca-5 The corresponding average energy price escalation rates for selected time intervals between 2008 and 2038 are shown in tables Cb-1 through Cb-5
Energy Price Projections
The FEMP and OMB UPV factors incorporate energy price escalation rates computed from future energy prices projected by the Energy Information Administration (EIA) of the US Department of Energy Energy prices through 2030 were generated by EIA using the National Energy Modeling System (NEMS) and published in the Annual Energy Outlook 2008 (AEO2008) At the request of FEMP EIA extrapolated energy prices from 2031 to 2038 based on selected growth rates from the AEO2008 projections
NEMS is an energy market model designed to project the impacts of alternative energy policies or assumptions on US energy markets NEMS produces projections of the US energy future given current laws and policies and other key assumptions including macroeconomic indicators from Data Resources Inc the production policy of the Organization of Petroleum Exporting Countries the size of the economically recoverable resource base for fossil fuels and the rate of development and penetration of new technologies NEMS balances energy supply and demands with modules representing primary fuel supply end-use demand for four sectors and conversion of energy by refineries and electricity generators Macroeconomic and international oil modules reflect the impacts of energy prices production and consumption on world oil markets and the economy
The EIA energy price projections presented in this report like those of other forecasters are dependent on the data methodologies and specific assumptions used in their development Many of the assumptions concerning the future cannot be known with any degree of certainty Thus the projections are not statements of what will happen but what might happen given the particular assumptions and methodologies used Although EIA has endeavored to make these forecasts as objective reliable and useful as possible these projections should serve as an adjunct to not a substitute for the analytical process The AEO2008 was prepared by EIA as required under statute by federal legislation The price projections to 2038 were prepared in accordance with a Service Request from the Federal Energy Management Program
11
UPV Calculation Method
The formula for finding the present value (P) of future energy costs or savings is the following
N
P = A0 xsum I(2008+ t )
t = A0 xUPVN
iminus1 (1+ d )
where A0 = annual cost of energy as of the base date (April 1 2008) t = index used to designate the year of energy usage N = number of periods eg years over which energy costs or savings accrue I(2008+t) = projected average fuel price index1 given in Tables Ca-1 through Ca-5
for the year 2008+t (where I2008 = 100) and d = the real discount rate
This formula is based on end-of-year energy prices and end-of-year discounting Note that annual energy costs as of the base date of the LCC analysis (A0 to be supplied by the analyst) should reflect the current energy price schedule as of that date which may not be the same as the energy price itself on that date2 That is the annual energy cost should reflect summer-winter rate differences time-of-use rates block rates considerations and demand charges (as appropriate) anticipated to be in effect that year If energy and demand costs are calculated separately (as is sometimes done for electricity) the UPV factor should be applied to both costs
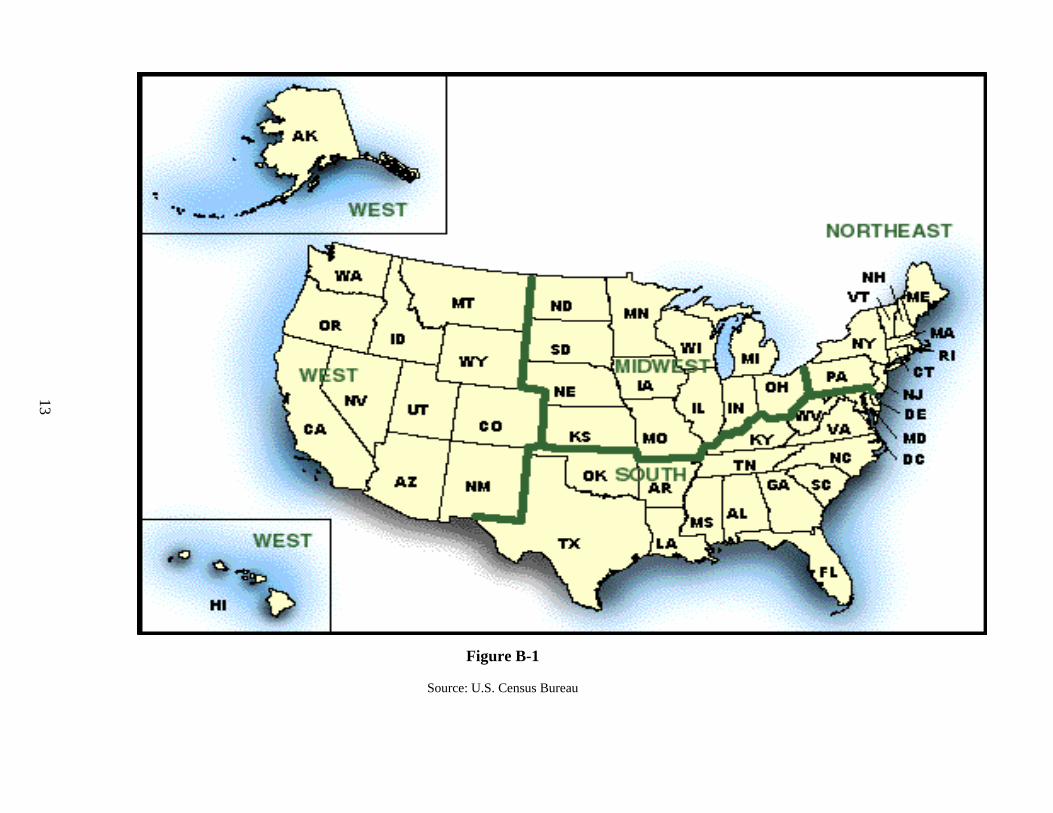
The data in the tables that follow are reported for the four Census regions and the US average Figure B-1 presents a map showing the states corresponding to the four Census regions The Census regions do not include American Samoa Canal Zone Guam Puerto Rico Trust Territory of the Pacific Islands or the Virgin Islands Analysts of federal projects in these areas should use data that are reasonable under the circumstances and may refer to the tables with US average data for guidance
1 For greater precision the UPV factors reported in the Ba and Bb tables were computed using the unrounded form of the indices given in Tables Ca-1 through Ca-5
2 While the UPV factors provided in this publication were computed using energy price indices that correspond to energy prices as of April 1 in the current and future years the analyst is encouraged to use for determining A0 the energy prices prevailing as of the base date of the LCC analysis for the project evaluated
12
13
Figure B-1
Source US Census Bureau
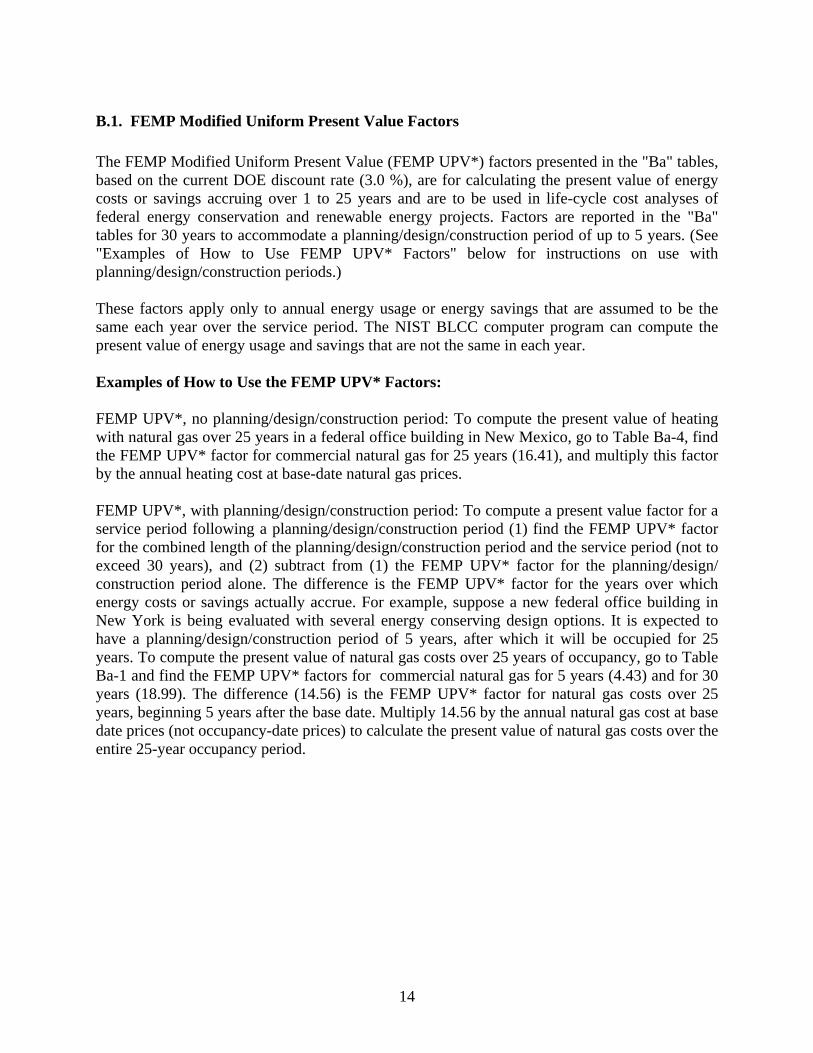
B1 FEMP Modified Uniform Present Value Factors
The FEMP Modified Uniform Present Value (FEMP UPV) factors presented in the Ba tables based on the current DOE discount rate (30 ) are for calculating the present value of energy costs or savings accruing over 1 to 25 years and are to be used in life-cycle cost analyses of federal energy conservation and renewable energy projects Factors are reported in the Ba tables for 30 years to accommodate a planningdesignconstruction period of up to 5 years (See Examples of How to Use FEMP UPV Factors below for instructions on use with planningdesignconstruction periods)
These factors apply only to annual energy usage or energy savings that are assumed to be the same each year over the service period The NIST BLCC computer program can compute the present value of energy usage and savings that are not the same in each year
Examples of How to Use the FEMP UPV Factors
FEMP UPV no planningdesignconstruction period To compute the present value of heating with natural gas over 25 years in a federal office building in New Mexico go to Table Ba-4 find the FEMP UPV factor for commercial natural gas for 25 years (1641) and multiply this factor by the annual heating cost at base-date natural gas prices
FEMP UPV with planningdesignconstruction period To compute a present value factor for a service period following a planningdesignconstruction period (1) find the FEMP UPV factor for the combined length of the planningdesignconstruction period and the service period (not to exceed 30 years) and (2) subtract from (1) the FEMP UPV factor for the planningdesign construction period alone The difference is the FEMP UPV factor for the years over which energy costs or savings actually accrue For example suppose a new federal office building in New York is being evaluated with several energy conserving design options It is expected to have a planningdesignconstruction period of 5 years after which it will be occupied for 25 years To compute the present value of natural gas costs over 25 years of occupancy go to Table Ba-1 and find the FEMP UPV factors for commercial natural gas for 5 years (443) and for 30 years (1899) The difference (1456) is the FEMP UPV factor for natural gas costs over 25 years beginning 5 years after the base date Multiply 1456 by the annual natural gas cost at base date prices (not occupancy-date prices) to calculate the present value of natural gas costs over the entire 25-year occupancy period
14
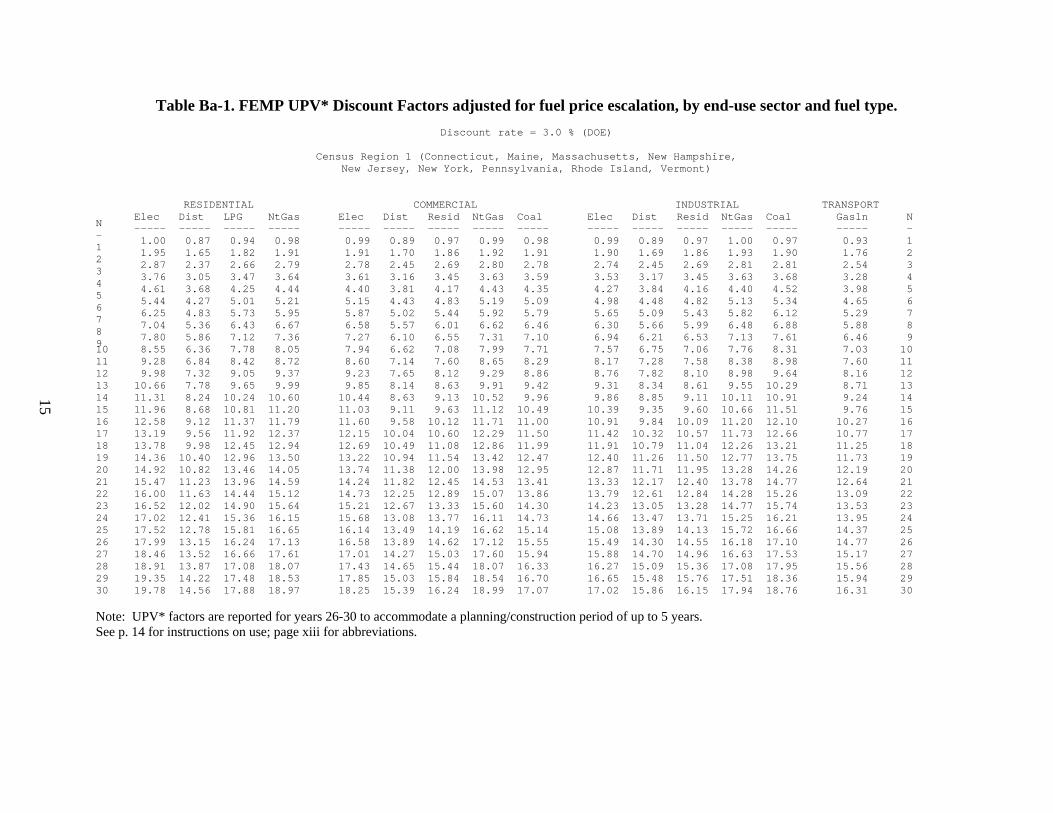
Table Ba-1 FEMP UPV Discount Factors adjusted for fuel price escalation by end-use sector and fuel type
15
Discount rate = 30 (DOE)
Census Region 1 (Connecticut Maine Massachusetts New HampshireNew Jersey New York Pennsylvania Rhode Island Vermont)
RESIDENTIAL COMMERCIAL INDUSTRIAL TRANSPORT
N Elec Dist LPG NtGas Elec Dist Resid NtGas Coal Elec Dist Resid NtGas Coal Gasln N
------ ----- ----- ----- ----- ----- ----- ----- ----- ----- ----- ----- ----- ----- ----- -
1 100 087 094 098 099 089 097 099 098 099 089 097 100 097 093 1
2 195 165 182 191 191 170 186 192 191 190 169 186 193 190 176 2
3 287 237 266 279 278 245 269 280 278 274 245 269 281 281 254 3
4 376 305 347 364 361 316 345 363 359 353 317 345 363 368 328 4
5 461 368 425 444 440 381 417 443 435 427 384 416 440 452 398 5
6 544 427 501 521 515 443 483 519 509 498 448 482 513 534 465 6
7 625 483 573 595 587 502 544 592 579 565 509 543 582 612 529 7
8 704 536 643 667 658 557 601 662 646 630 566 599 648 688 588 8
9 780 586 712 736 727 610 655 731 710 694 621 653 713 761 646 9
10 855 636 778 805 794 662 708 799 771 757 675 706 776 831 703 10 11 928 684 842 872 860 714 760 865 829 817 728 758 838 898 760 11 12 998 732 905 937 923 765 812 929 886 876 782 810 898 964 816 12 13 1066 778 965 999 985 814 863 991 942 931 834 861 955 1029 871 13 14 1131 824 1024 1060 1044 863 913 1052 996 986 885 911 1011 1091 924 14 15 1196 868 1081 1120 1103 911 963 1112 1049 1039 935 960 1066 1151 976 15 16 1258 912 1137 1179 1160 958 1012 1171 1100 1091 984 1009 1120 1210 1027 16 17 1319 956 1192 1237 1215 1004 1060 1229 1150 1142 1032 1057 1173 1266 1077 17 18 1378 998 1245 1294 1269 1049 1108 1286 1199 1191 1079 1104 1226 1321 1125 18 19 1436 1040 1296 1350 1322 1094 1154 1342 1247 1240 1126 1150 1277 1375 1173 19 20 1492 1082 1346 1405 1374 1138 1200 1398 1295 1287 1171 1195 1328 1426 1219 20 21 1547 1123 1396 1459 1424 1182 1245 1453 1341 1333 1217 1240 1378 1477 1264 21 22 1600 1163 1444 1512 1473 1225 1289 1507 1386 1379 1261 1284 1428 1526 1309 22 23 1652 1202 1490 1564 1521 1267 1333 1560 1430 1423 1305 1328 1477 1574 1353 23 24 1702 1241 1536 1615 1568 1308 1377 1611 1473 1466 1347 1371 1525 1621 1395 24 25 1752 1278 1581 1665 1614 1349 1419 1662 1514 1508 1389 1413 1572 1666 1437 25 26 1799 1315 1624 1713 1658 1389 1462 1712 1555 1549 1430 1455 1618 1710 1477 26 27 1846 1352 1666 1761 1701 1427 1503 1760 1594 1588 1470 1496 1663 1753 1517 27 28 1891 1387 1708 1807 1743 1465 1544 1807 1633 1627 1509 1536 1708 1795 1556 28 29 1935 1422 1748 1853 1785 1503 1584 1854 1670 1665 1548 1576 1751 1836 1594 29 30 1978 1456 1788 1897 1825 1539 1624 1899 1707 1702 1586 1615 1794 1876 1631 30
Note UPV factors are reported for years 26-30 to accommodate a planningconstruction period of up to 5 years See p 14 for instructions on use page xiii for abbreviations
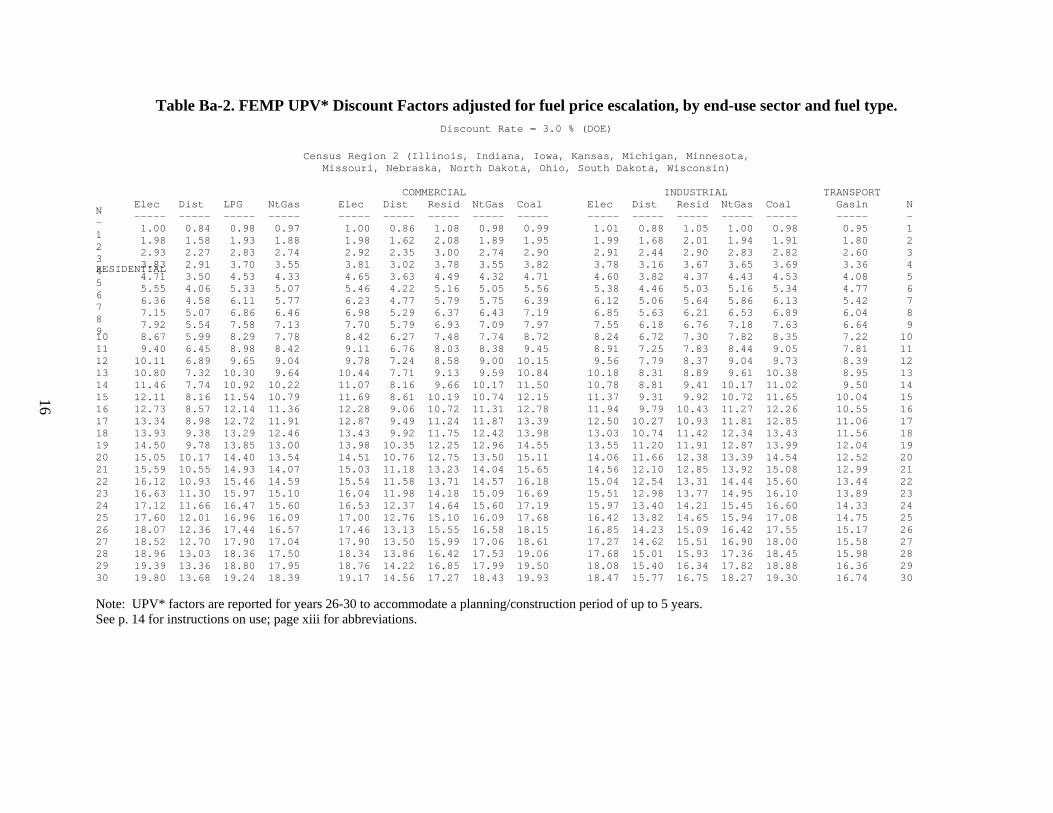
Table Ba-2 FEMP UPV Discount Factors adjusted for fuel price escalation by end-use sector and fuel type
16
Discount Rate = 30 (DOE)
Census Region 2 (Illinois Indiana Iowa Kansas Michigan MinnesotaMissouri Nebraska North Dakota Ohio South Dakota Wisconsin)
RESIDENTIAL
COMMERCIAL INDUSTRIAL TRANSPORT
N Elec Dist LPG NtGas Elec Dist Resid NtGas Coal Elec Dist Resid NtGas Coal Gasln N
------ ----- ----- ----- ----- ----- ----- ----- ----- ----- ----- ----- ----- ----- ----- -
1 100 084 098 097 100 086 108 098 099 101 088 105 100 098 095 1
2 198 158 193 188 198 162 208 189 195 199 168 201 194 191 180 2
3 293 227 283 274 292 235 300 274 290 291 244 290 283 282 260 3
4 383 291 370 355 381 302 378 355 382 378 316 367 365 369 336 4
5 471 350 453 433 465 363 449 432 471 460 382 437 443 453 408 5
6 555 406 533 507 546 422 516 505 556 538 446 503 516 534 477 6
7 636 458 611 577 623 477 579 575 639 612 506 564 586 613 542 7
8 715 507 686 646 698 529 637 643 719 685 563 621 653 689 604 8
9 792 554 758 713 770 579 693 709 797 755 618 676 718 763 664 9
10 867 599 829 778 842 627 748 774 872 824 672 730 782 835 722 10 11 940 645 898 842 911 676 803 838 945 891 725 783 844 905 781 11 12 1011 689 965 904 978 724 858 900 1015 956 779 837 904 973 839 12 13 1080 732 1030 964 1044 771 913 959 1084 1018 831 889 961 1038 895 13 14 1146 774 1092 1022 1107 816 966 1017 1150 1078 881 941 1017 1102 950 14 15 1211 816 1154 1079 1169 861 1019 1074 1215 1137 931 992 1072 1165 1004 15 16 1273 857 1214 1136 1228 906 1072 1131 1278 1194 979 1043 1127 1226 1055 16 17 1334 898 1272 1191 1287 949 1124 1187 1339 1250 1027 1093 1181 1285 1106 17 18 1393 938 1329 1246 1343 992 1175 1242 1398 1303 1074 1142 1234 1343 1156 18 19 1450 978 1385 1300 1398 1035 1225 1296 1455 1355 1120 1191 1287 1399 1204 19 20 1505 1017 1440 1354 1451 1076 1275 1350 1511 1406 1166 1238 1339 1454 1252 20 21 1559 1055 1493 1407 1503 1118 1323 1404 1565 1456 1210 1285 1392 1508 1299 21 22 1612 1093 1546 1459 1554 1158 1371 1457 1618 1504 1254 1331 1444 1560 1344 22 23 1663 1130 1597 1510 1604 1198 1418 1509 1669 1551 1298 1377 1495 1610 1389 23 24 1712 1166 1647 1560 1653 1237 1464 1560 1719 1597 1340 1421 1545 1660 1433 24 25 1760 1201 1696 1609 1700 1276 1510 1609 1768 1642 1382 1465 1594 1708 1475 25 26 1807 1236 1744 1657 1746 1313 1555 1658 1815 1685 1423 1509 1642 1755 1517 26 27 1852 1270 1790 1704 1790 1350 1599 1706 1861 1727 1462 1551 1690 1800 1558 27 28 1896 1303 1836 1750 1834 1386 1642 1753 1906 1768 1501 1593 1736 1845 1598 28 29 1939 1336 1880 1795 1876 1422 1685 1799 1950 1808 1540 1634 1782 1888 1636 29 30 1980 1368 1924 1839 1917 1456 1727 1843 1993 1847 1577 1675 1827 1930 1674 30
Note UPV factors are reported for years 26-30 to accommodate a planningconstruction period of up to 5 years See p 14 for instructions on use page xiii for abbreviations
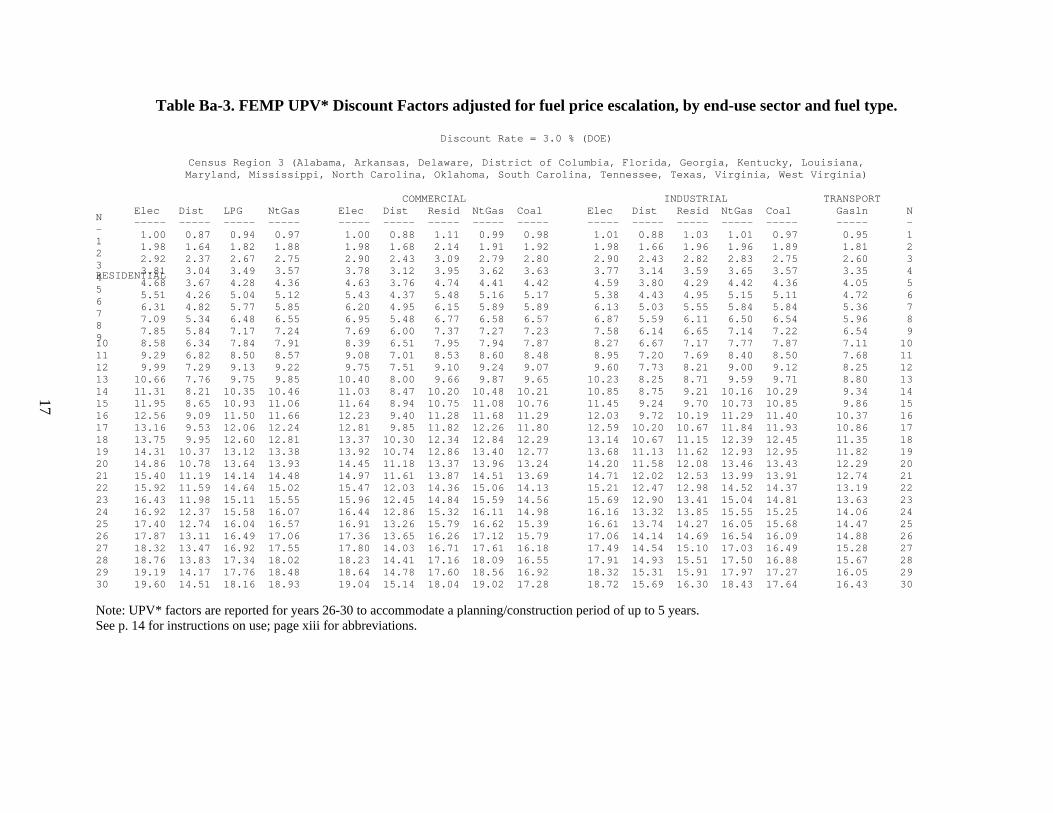
Table Ba-3 FEMP UPV Discount Factors adjusted for fuel price escalation by end-use sector and fuel type
17
Discount Rate = 30 (DOE)
Census Region 3 (Alabama Arkansas Delaware District of Columbia Florida Georgia Kentucky LouisianaMaryland Mississippi North Carolina Oklahoma South Carolina Tennessee Texas Virginia West Virginia)
RESIDENTIAL
COMMERCIAL INDUSTRIAL TRANSPORT
N Elec Dist LPG NtGas Elec Dist Resid NtGas Coal Elec Dist Resid NtGas Coal Gasln N
------ ----- ----- ----- ----- ----- ----- ----- ----- ----- ----- ----- ----- ----- ----- -
1 100 087 094 097 100 088 111 099 098 101 088 103 101 097 095 1
2 198 164 182 188 198 168 214 191 192 198 166 196 196 189 181 2
3 292 237 267 275 290 243 309 279 280 290 243 282 283 275 260 3
4 381 304 349 357 378 312 395 362 363 377 314 359 365 357 335 4
5 468 367 428 436 463 376 474 441 442 459 380 429 442 436 405 5
6 551 426 504 512 543 437 548 516 517 538 443 495 515 511 472 6
7 631 482 577 585 620 495 615 589 589 613 503 555 584 584 536 7
8 709 534 648 655 695 548 677 658 657 687 559 611 650 654 596 8
9 785 584 717 724 769 600 737 727 723 758 614 665 714 722 654 9
10 858 634 784 791 839 651 795 794 787 827 667 717 777 787 711 10 11 929 682 850 857 908 701 853 860 848 895 720 769 840 850 768 11 12 999 729 913 922 975 751 910 924 907 960 773 821 900 912 825 12 13 1066 776 975 985 1040 800 966 987 965 1023 825 871 959 971 880 13 14 1131 821 1035 1046 1103 847 1020 1048 1021 1085 875 921 1016 1029 934 14 15 1195 865 1093 1106 1164 894 1075 1108 1076 1145 924 970 1073 1085 986 15 16 1256 909 1150 1166 1223 940 1128 1168 1129 1203 972 1019 1129 1140 1037 16 17 1316 953 1206 1224 1281 985 1182 1226 1180 1259 1020 1067 1184 1193 1086 17 18 1375 995 1260 1281 1337 1030 1234 1284 1229 1314 1067 1115 1239 1245 1135 18 19 1431 1037 1312 1338 1392 1074 1286 1340 1277 1368 1113 1162 1293 1295 1182 19 20 1486 1078 1364 1393 1445 1118 1337 1396 1324 1420 1158 1208 1346 1343 1229 20 21 1540 1119 1414 1448 1497 1161 1387 1451 1369 1471 1202 1253 1399 1391 1274 21 22 1592 1159 1464 1502 1547 1203 1436 1506 1413 1521 1247 1298 1452 1437 1319 22 23 1643 1198 1511 1555 1596 1245 1484 1559 1456 1569 1290 1341 1504 1481 1363 23 24 1692 1237 1558 1607 1644 1286 1532 1611 1498 1616 1332 1385 1555 1525 1406 24 25 1740 1274 1604 1657 1691 1326 1579 1662 1539 1661 1374 1427 1605 1568 1447 25 26 1787 1311 1649 1706 1736 1365 1626 1712 1579 1706 1414 1469 1654 1609 1488 26 27 1832 1347 1692 1755 1780 1403 1671 1761 1618 1749 1454 1510 1703 1649 1528 27 28 1876 1383 1734 1802 1823 1441 1716 1809 1655 1791 1493 1551 1750 1688 1567 28 29 1919 1417 1776 1848 1864 1478 1760 1856 1692 1832 1531 1591 1797 1727 1605 29 30 1960 1451 1816 1893 1904 1514 1804 1902 1728 1872 1569 1630 1843 1764 1643 30
Note UPV factors are reported for years 26-30 to accommodate a planningconstruction period of up to 5 years See p 14 for instructions on use page xiii for abbreviations
Table Ba-4 FEMP UPV Discount Factors adjusted for fuel price escalation by end-use sector and fuel type
18
Discount Rate = 30 (DOE)
Census Region 4 (Alaska Arizona California Colorado HawaiiIdaho Montana Nevada New Mexico Oregon Utah Washington Wyoming)
RESIDENTIAL
COMMERCIAL INDUSTRIAL TRANSPORT
N Elec Dist LPG NtGas Elec Dist Resid NtGas Coal Elec Dist Resid NtGas Coal Gasln N
------ ----- ----- ----- ----- ----- ----- ----- ----- ----- ----- ----- ----- ----- ----- -
1 098 074 095 097 098 081 119 097 099 098 082 121 098 098 091 1
2 193 137 184 188 191 152 234 188 195 193 155 238 188 193 175 2
3 282 196 270 274 278 219 339 273 288 282 224 346 272 284 254 3
4 368 251 352 356 361 281 423 355 377 366 289 432 350 371 329 4
5 450 304 431 434 439 341 498 432 463 445 352 509 424 455 400 5
6 530 355 508 509 515 399 570 507 546 522 412 583 493 536 468 6
7 608 403 582 581 587 453 638 579 627 596 469 653 559 614 533 7
8 684 448 654 651 658 505 702 648 704 668 523 719 623 690 594 8
9 758 492 723 720 726 554 763 717 779 738 575 782 685 763 653 9
10 830 536 791 787 792 604 824 784 854 806 626 844 746 835 711 10 11 901 579 857 852 857 653 886 849 926 873 678 908 805 904 768 11 12 969 622 921 915 919 702 949 912 997 937 730 973 861 972 825 12 13 1035 663 982 975 979 750 1012 972 1066 998 780 1037 914 1038 880 13 14 1100 704 1041 1033 1037 797 1073 1031 1133 1058 830 1100 965 1102 933 14 15 1162 745 1099 1091 1093 843 1134 1089 1198 1116 878 1163 1015 1166 984 15 16 1224 785 1156 1148 1148 889 1195 1146 1263 1173 925 1225 1066 1227 1034 16 17 1284 825 1212 1204 1202 934 1255 1203 1326 1229 971 1287 1116 1287 1083 17 18 1343 864 1266 1260 1254 978 1314 1260 1387 1283 1017 1348 1167 1346 1129 18 19 1400 903 1319 1315 1305 1022 1373 1316 1448 1336 1062 1407 1217 1404 1175 19 20 1455 941 1371 1370 1355 1065 1430 1372 1506 1387 1107 1466 1266 1459 1219 20 21 1510 979 1422 1424 1404 1108 1486 1427 1564 1438 1150 1524 1317 1514 1263 21 22 1562 1016 1472 1477 1451 1150 1541 1482 1619 1487 1193 1581 1367 1567 1305 22 23 1614 1052 1520 1530 1497 1191 1596 1536 1674 1534 1235 1636 1416 1619 1346 23 24 1664 1088 1568 1581 1542 1231 1649 1589 1727 1581 1277 1691 1465 1669 1386 24 25 1713 1123 1614 1631 1585 1270 1702 1641 1778 1626 1317 1746 1513 1718 1425 25 26 1761 1157 1660 1680 1628 1308 1754 1692 1828 1670 1356 1799 1560 1766 1464 26 27 1807 1190 1704 1729 1669 1346 1805 1741 1877 1713 1395 1851 1606 1813 1501 27 28 1853 1223 1747 1776 1709 1383 1855 1790 1925 1755 1433 1903 1651 1858 1538 28 29 1897 1255 1789 1822 1748 1419 1904 1837 1971 1796 1470 1954 1696 1902 1574 29 30 1940 1286 1830 1867 1786 1454 1953 1884 2016 1836 1506 2004 1740 1945 1609 30
Note UPV factors are reported for years 26-30 to accommodate a planningconstruction period of up to 5 years See p 14 for instructions on use page xiii for abbreviations
Table Ba-5 FEMP UPV Discount Factors adjusted for fuel price escalation by end-use sector and fuel type
19
Discount Rate = 30 (DOE)
United States Average
RESIDENTIAL
COMMERCIAL INDUSTRIAL TRANSPORT
N Elec Dist LPG NtGas Elec Dist Resid NtGas Coal Elec Dist Resid NtGas Coal Gasln N
------ ----- ----- ----- ----- ----- ----- ----- ----- ----- ----- ----- ----- ----- ----- -
1 100 086 096 097 099 088 099 098 099 100 087 102 100 097 094 1
2 197 163 186 189 195 166 189 190 194 196 164 195 194 190 178 2
3 289 235 274 275 285 241 273 277 285 287 239 281 281 279 258 3
4 378 302 357 358 371 310 350 359 372 372 309 358 363 364 333 4
5 464 364 438 437 453 374 422 437 456 453 374 429 440 446 403 5
6 546 423 515 512 531 435 489 512 536 530 437 495 512 524 471 6
7 626 478 590 584 606 492 550 583 614 604 496 556 581 600 535 7
8 704 530 663 654 678 546 607 653 688 675 552 612 647 674 596 8
9 779 580 733 722 749 598 661 721 760 745 606 666 711 745 655 9
10 852 628 802 789 818 649 715 787 830 813 659 719 774 813 712 10 11 924 676 869 855 886 699 768 852 897 879 712 772 836 880 769 11 12 993 723 934 918 951 749 820 916 963 943 765 824 896 945 826 12 13 1060 769 996 979 1013 798 872 976 1027 1005 817 875 953 1008 882 13 14 1125 814 1057 1039 1074 846 922 1036 1089 1065 867 925 1009 1069 935 14 15 1189 859 1117 1098 1134 893 972 1095 1149 1123 916 975 1064 1129 987 15 16 1250 902 1175 1156 1191 939 1022 1153 1208 1180 964 1024 1118 1187 1038 16 17 1310 945 1231 1213 1247 985 1071 1210 1265 1235 1012 1073 1172 1243 1088 17 18 1369 988 1287 1269 1302 1030 1119 1267 1321 1289 1058 1121 1226 1298 1136 18 19 1425 1029 1341 1324 1355 1074 1166 1323 1375 1341 1104 1168 1278 1351 1183 19 20 1480 1070 1393 1378 1407 1117 1212 1378 1428 1392 1149 1214 1331 1403 1229 20 21 1534 1111 1445 1432 1458 1160 1258 1433 1479 1441 1194 1259 1383 1454 1274 21 22 1586 1151 1495 1486 1507 1203 1303 1487 1529 1490 1238 1304 1434 1503 1319 22 23 1637 1190 1545 1538 1555 1244 1347 1540 1578 1537 1281 1348 1485 1551 1362 23 24 1687 1228 1593 1589 1602 1285 1391 1591 1625 1583 1323 1392 1536 1598 1404 24 25 1735 1265 1640 1638 1648 1325 1434 1642 1671 1628 1364 1435 1585 1643 1446 25 26 1781 1302 1685 1687 1692 1364 1476 1692 1716 1672 1405 1477 1633 1688 1486 26 27 1827 1338 1730 1735 1735 1402 1518 1740 1760 1714 1444 1519 1681 1731 1525 27 28 1871 1373 1774 1781 1777 1440 1559 1788 1802 1755 1483 1559 1728 1773 1564 28 29 1914 1407 1816 1827 1818 1477 1600 1834 1844 1795 1521 1600 1774 1814 1602 29 30 1956 1441 1858 1871 1858 1513 1640 1880 1884 1834 1558 1639 1819 1853 1639 30
Note UPV factors are reported for years 26-30 to accommodate a planningconstruction period of up to 5 years See p 14 for instructions on use page xiii for abbreviations
B2 FEMP Modified Uniform Present Value Factors
The OMB Modified Uniform Present Value (OMB UPV) factors presented in the Bb tables based on the current OMB discount rates (24 short term and 28 long term) are for calculating the present value of energy costs accruing over 1 to 30 years when conducting a life-cycle cost analysis of a federal project not explicitly related to energy or water conservation or renewable resources Factors are reported in the Bb tables for 30 years These factors apply only to annual energy usage that is assumed to be the same each year over the service period The NIST BLCC computer program can compute the present value of energy usage and savings that are not the same in each year
Examples of How to Use the OMB UPV Factors
OMB UPV (OMB discount rate) To compute the present value over 30 years of electricity costs associated with the occupancy of a federal office building in Ohio (where energy conservation is not a specific consideration in the LCC analysis) go to Table Bb-2 find the OMB UPV factor for commercial electricity for 30 years (1968) and multiply this factor by the annual electricity cost in base-date dollars
Note Because the discount rate used to calculate the Bb tables (OMB discount rate) is usually different for years 1 to 10 than for years 11 to 30 these factors cannot be used with a planning designconstruction period as shown above for the Ba tables (DOE discount rate) Use the BLCC or DISCOUNT computer program for this purpose For further explanation of the use of UPV factors see NIST Handbook 135
20
Table Bb-1 OMB UPV Discount Factors adjusted for fuel price escalation by end-use sector and fuel type
21
Discount Rate = 24 (years 1 to 10) and 28 (years 11 to 30) (OMB Circular A-94a)
Census Region 1 (Connecticut Maine Massachusetts New HampshireNew Jersey New York Pennsylvania Rhode Island Vermont)
RESIDENTIAL
COMMERCIAL INDUSTRIAL TRANSPORT
N Elec Dist LPG NtGas Elec Dist Resid NtGas Coal Elec Dist Resid NtGas Coal Gasln N
------ ----- ----- ----- ----- ----- ----- ----- ----- ----- ----- ----- ----- ----- ----- -
1 100 087 094 099 099 089 098 100 099 099 089 098 100 098 093 1
2 197 166 183 193 193 171 188 194 193 192 170 187 195 192 177 2
3 290 240 269 283 281 248 272 283 281 277 248 272 284 284 257 3
4 381 309 352 369 366 320 350 369 364 358 322 350 368 373 333 4
5 469 374 433 452 447 387 424 451 443 435 390 423 448 460 405 5
6 555 436 511 532 525 452 493 529 519 507 457 491 523 545 474 6
7 639 494 586 609 601 513 556 605 592 577 520 555 595 626 540 7
8 722 549 660 684 674 571 615 679 663 646 580 614 665 705 603 8
9 802 602 732 757 747 627 672 751 730 713 638 670 733 782 664 9
10 882 654 802 830 818 682 728 823 794 779 695 727 800 856 724 10 11 938 691 852 881 869 721 768 874 838 826 736 766 847 908 768 11 12 1010 740 916 948 934 773 821 940 897 886 791 819 908 976 825 12 13 1079 788 978 1012 997 825 873 1004 954 943 845 871 967 1042 881 13 14 1147 834 1038 1075 1059 875 925 1066 1009 999 897 923 1024 1106 936 14 15 1213 880 1097 1137 1119 924 976 1128 1063 1054 948 973 1081 1168 990 15 16 1278 926 1155 1197 1177 972 1027 1189 1116 1107 999 1024 1137 1228 1043 16 17 1341 971 1211 1257 1235 1020 1077 1249 1168 1160 1048 1073 1192 1287 1094 17 18 1402 1015 1266 1316 1291 1067 1126 1308 1219 1211 1097 1122 1246 1343 1144 18 19 1462 1058 1319 1374 1345 1113 1174 1366 1269 1261 1146 1170 1299 1399 1193 19 20 1520 1101 1372 1431 1399 1159 1221 1424 1318 1311 1193 1217 1352 1453 1242 20 21 1577 1144 1423 1488 1452 1205 1268 1481 1366 1359 1240 1264 1405 1505 1289 21 22 1633 1186 1473 1543 1503 1250 1315 1537 1413 1406 1287 1310 1456 1557 1335 22 23 1687 1227 1522 1598 1553 1294 1361 1593 1459 1452 1332 1355 1508 1607 1381 23 24 1740 1267 1570 1651 1602 1337 1406 1647 1504 1497 1377 1400 1558 1656 1426 24 25 1791 1307 1616 1703 1650 1379 1451 1700 1548 1541 1421 1445 1607 1703 1469 25 26 1842 1346 1662 1754 1697 1421 1495 1752 1591 1584 1464 1489 1656 1750 1512 26 27 1891 1384 1707 1804 1742 1462 1539 1803 1632 1626 1506 1532 1704 1795 1554 27 28 1938 1422 1750 1853 1787 1502 1582 1854 1673 1667 1548 1574 1751 1840 1595 28 29 1985 1458 1793 1901 1830 1542 1625 1903 1712 1708 1588 1616 1797 1883 1635 29 30 2030 1494 1835 1948 1873 1580 1667 1951 1751 1747 1628 1658 1842 1925 1674 30
aOMB discount rate as of February 2008 See p 20 for instructions on use page xiii for abbreviations
Table Bb-2 OMB UPV Discount Factors adjusted for fuel price escalation by end-use sector and fuel type
22
Discount Rate = 24 (years 1 to 10) and 28 (years 11 to 30) (OMB Circular A-94a)
Census Region 2 (Illinois Indiana Iowa Kansas Michigan MinnesotaMissouri Nebraska North Dakota Ohio South Dakota Wisconsin)
RESIDENTIAL
COMMERCIAL INDUSTRIAL TRANSPORT
N Elec Dist LPG NtGas Elec Dist Resid NtGas Coal Elec Dist Resid NtGas Coal Gasln N
------ ----- ----- ----- ----- ----- ----- ----- ----- ----- ----- ----- ----- ----- ----- -
1 101 084 099 098 101 086 108 098 100 102 089 105 101 098 095 1
2 200 160 195 190 200 164 210 191 197 201 169 203 196 193 181 2
3 296 230 286 277 295 238 303 277 294 295 247 293 286 285 263 3
4 389 295 375 360 386 306 383 360 387 384 320 372 370 375 341 4
5 479 356 461 440 473 369 456 439 479 468 389 444 450 461 415 5
6 566 414 544 517 556 430 526 515 568 549 455 512 526 545 486 6
7 651 468 625 590 637 488 591 588 654 626 518 576 599 627 554 7
8 734 519 703 662 715 542 652 659 738 702 577 636 669 707 619 8
9 815 568 780 732 792 594 711 729 820 776 635 694 738 784 682 9
10 894 617 855 802 868 646 769 798 899 849 692 751 805 861 744 10 11 951 651 908 851 921 683 811 847 955 901 733 791 854 915 789 11 12 1023 697 977 915 990 732 868 910 1027 967 788 846 915 984 849 12 13 1093 741 1043 976 1057 780 924 971 1097 1031 841 900 973 1052 907 13 14 1162 784 1107 1036 1122 827 978 1031 1166 1093 893 953 1031 1117 963 14 15 1228 827 1170 1095 1185 873 1033 1090 1233 1153 944 1006 1087 1182 1018 15 16 1293 870 1232 1153 1247 919 1087 1148 1297 1212 994 1058 1144 1244 1071 16 17 1356 912 1293 1210 1307 964 1141 1206 1360 1270 1043 1110 1199 1306 1124 17 18 1417 954 1352 1267 1366 1009 1194 1263 1421 1325 1092 1161 1255 1366 1175 18 19 1476 995 1410 1323 1423 1053 1246 1319 1481 1379 1140 1211 1310 1424 1226 19 20 1533 1035 1467 1379 1478 1096 1298 1376 1539 1432 1187 1261 1364 1481 1275 20 21 1589 1075 1523 1434 1532 1139 1348 1431 1595 1484 1234 1310 1419 1537 1324 21 22 1644 1114 1577 1489 1586 1181 1398 1487 1651 1534 1280 1358 1473 1591 1371 22 23 1697 1153 1631 1542 1638 1223 1447 1541 1704 1583 1325 1405 1526 1644 1418 23 24 1749 1191 1683 1595 1689 1264 1496 1594 1757 1632 1370 1452 1578 1696 1464 24 25 1800 1228 1734 1646 1738 1305 1544 1646 1808 1678 1413 1498 1630 1747 1509 25 26 1849 1265 1785 1696 1786 1344 1591 1698 1858 1724 1456 1544 1681 1796 1552 26 27 1897 1301 1834 1746 1833 1383 1637 1748 1906 1768 1498 1589 1731 1844 1595 27 28 1943 1336 1882 1794 1879 1421 1683 1798 1954 1812 1539 1633 1780 1891 1637 28 29 1988 1370 1929 1842 1924 1459 1729 1846 2000 1854 1580 1676 1829 1937 1679 29 30 2032 1404 1975 1889 1968 1495 1773 1894 2045 1895 1619 1720 1876 1982 1719 30
aOMB discount rate as of February 2008 See p 20 for instructions on use page xiii for abbreviations
Table Bb-3 OMB UPV Discount Factors adjusted for fuel price escalation by end-use sector and fuel type
23
Discount Rate = 24 (years 1 to 10) and 28 (years 11 to 30) (OMB Circular A-94a)
Census Region 3 (Alabama Arkansas Delaware District of Columbia Florida Georgia Kentucky LouisianaMaryland Mississippi North Carolina Oklahoma South Carolina Tennessee Texas Virginia West Virginia)
RESIDENTIAL
COMMERCIAL INDUSTRIAL TRANSPORT
N Elec Dist LPG NtGas Elec Dist Resid NtGas Coal Elec Dist Resid NtGas Coal Gasln N
------ ----- ----- ----- ----- ----- ----- ----- ----- ----- ----- ----- ----- ----- ----- -
1 101 087 094 098 101 089 111 099 099 101 088 103 102 098 095 1
2 200 166 184 190 200 169 216 193 193 200 168 198 198 190 182 2
3 295 240 270 278 294 245 313 282 283 293 245 285 286 279 263 3
4 387 309 354 362 384 316 401 367 368 382 318 364 370 362 339 4
5 476 373 435 444 471 382 482 448 450 467 386 436 450 443 411 5
6 562 435 514 522 554 446 558 526 527 548 452 504 525 522 481 6
7 645 492 590 598 634 505 629 602 602 627 514 567 597 597 548 7
8 727 547 665 671 713 562 694 675 674 704 573 626 666 671 611 8
9 807 600 737 744 790 616 756 747 743 779 630 682 733 742 672 9
10 884 653 808 816 865 670 818 818 811 853 687 738 801 811 733 10 11 940 689 859 867 918 708 862 870 857 905 728 777 849 859 776 11 12 1011 738 924 933 987 760 920 935 918 972 782 830 911 922 835 12 13 1079 785 987 997 1053 810 977 999 977 1036 835 882 971 984 891 13 14 1147 832 1049 1060 1118 859 1034 1062 1035 1100 887 933 1030 1043 946 14 15 1212 878 1109 1122 1180 907 1089 1124 1091 1161 937 983 1088 1101 1000 15 16 1276 923 1168 1183 1242 954 1145 1186 1146 1221 987 1034 1146 1157 1052 16 17 1338 967 1225 1244 1301 1001 1200 1246 1199 1279 1036 1084 1203 1212 1103 17 18 1398 1012 1281 1303 1360 1047 1254 1306 1250 1336 1085 1133 1260 1266 1154 18 19 1457 1055 1336 1362 1416 1093 1308 1364 1300 1392 1132 1182 1315 1317 1203 19 20 1514 1098 1389 1419 1472 1138 1361 1423 1348 1446 1179 1229 1371 1368 1251 20 21 1570 1140 1442 1476 1526 1183 1413 1480 1395 1499 1226 1277 1426 1417 1299 21 22 1624 1182 1493 1533 1578 1227 1464 1537 1441 1551 1272 1323 1481 1465 1346 22 23 1677 1223 1543 1588 1630 1271 1515 1593 1486 1601 1317 1369 1536 1512 1391 23 24 1729 1263 1592 1642 1680 1314 1565 1647 1530 1651 1361 1414 1589 1558 1436 24 25 1779 1303 1640 1695 1729 1356 1614 1701 1573 1699 1405 1459 1642 1603 1480 25 26 1828 1342 1687 1747 1776 1397 1663 1753 1615 1745 1448 1503 1693 1646 1523 26 27 1876 1380 1733 1798 1822 1437 1711 1805 1656 1791 1490 1547 1744 1688 1565 27 28 1922 1417 1778 1848 1868 1477 1758 1856 1695 1836 1531 1589 1795 1730 1606 28 29 1968 1454 1822 1897 1912 1516 1805 1905 1734 1879 1571 1632 1844 1770 1647 29 30 2012 1490 1865 1944 1954 1555 1851 1954 1772 1921 1611 1674 1893 1810 1686 30
aOMB discount rate as of February 2008 See p 20 for instructions on use page xiii for abbreviations
Table Bb-4 OMB UPV Discount Factors adjusted for fuel price escalation by end-use sector and fuel type
24
Discount Rate = 24 (years 1 to 10) and 28 (years 11 to 30) (OMB Circular A-94a)
Census Region 4 (Alaska Arizona California Colorado HawaiiIdaho Montana Nevada New Mexico Oregon Utah Washington Wyoming)
RESIDENTIAL
COMMERCIAL INDUSTRIAL TRANSPORT
N Elec Dist LPG NtGas Elec Dist Resid NtGas Coal Elec Dist Resid NtGas Coal Gasln N
------ ----- ----- ----- ----- ----- ----- ----- ----- ----- ----- ----- ----- ----- ----- -
1 099 074 095 097 098 081 120 098 100 099 083 122 098 099 092 1
2 195 138 186 190 192 153 236 190 197 194 156 240 190 195 176 2
3 286 198 273 277 281 221 343 277 292 285 227 350 275 287 257 3
4 373 255 357 361 366 285 429 360 383 371 293 438 355 376 334 4
5 458 309 439 441 447 347 506 440 471 453 358 517 431 462 407 5
6 541 362 518 519 525 407 581 517 557 533 420 594 503 547 478 6
7 622 412 595 594 600 463 651 592 641 610 479 667 572 629 545 7
8 702 459 670 668 674 517 718 665 722 685 536 736 638 708 609 8
9 780 506 744 740 746 570 783 737 802 759 591 802 704 785 671 9
10 856 552 816 811 817 622 848 808 880 831 645 869 768 860 732 10 11 911 585 867 861 866 660 895 858 936 882 685 917 813 914 776 11 12 981 629 932 926 930 710 960 923 1009 948 738 983 871 984 835 12 13 1048 672 994 988 991 759 1024 985 1079 1011 790 1049 925 1051 891 13 14 1115 714 1055 1047 1051 808 1087 1045 1148 1073 841 1114 978 1118 945 14 15 1179 756 1115 1107 1109 855 1150 1104 1216 1132 890 1179 1030 1182 999 15 16 1243 797 1174 1165 1166 902 1213 1164 1282 1191 939 1243 1082 1246 1050 16 17 1305 838 1231 1224 1221 949 1275 1223 1347 1248 987 1307 1134 1308 1100 17 18 1365 879 1287 1281 1275 995 1336 1281 1411 1304 1035 1370 1186 1369 1148 18 19 1425 919 1343 1339 1328 1040 1396 1340 1474 1359 1081 1432 1238 1429 1196 19 20 1483 959 1397 1395 1380 1085 1456 1397 1535 1413 1127 1493 1290 1487 1242 20 21 1539 998 1450 1451 1431 1129 1514 1455 1595 1465 1173 1553 1342 1544 1287 21 22 1594 1037 1502 1507 1480 1173 1572 1513 1653 1517 1218 1612 1394 1599 1331 22 23 1648 1075 1553 1562 1528 1216 1629 1569 1710 1567 1262 1671 1446 1653 1374 23 24 1701 1112 1602 1616 1575 1258 1685 1625 1765 1615 1305 1728 1497 1706 1416 24 25 1752 1149 1651 1669 1621 1299 1740 1679 1819 1663 1347 1785 1547 1758 1457 25 26 1802 1184 1699 1721 1665 1340 1795 1732 1872 1709 1389 1841 1596 1808 1498 26 27 1851 1220 1745 1771 1709 1379 1849 1784 1923 1754 1430 1896 1645 1857 1537 27 28 1899 1254 1791 1821 1751 1418 1902 1836 1974 1799 1470 1951 1693 1905 1576 28 29 1946 1288 1835 1870 1793 1457 1954 1886 2023 1842 1509 2005 1740 1951 1614 29 30 1991 1321 1879 1917 1833 1494 2006 1935 2070 1884 1547 2058 1787 1997 1651 30
aOMB discount rate as of February 2008 See p 20 for instructions on use page xiii for abbreviations
Table Bb-5 OMB UPV Discount Factors adjusted for fuel price escalation by end-use sector and fuel type
25
Discount Rate = 24 (years 1 to 10) and 28 (years 11 to 30) (OMB Circular A-94a)
United States Average
RESIDENTIAL
COMMERCIAL INDUSTRIAL TRANSPORT
N Elec Dist LPG NtGas Elec Dist Resid NtGas Coal Elec Dist Resid NtGas Coal Gasln N
------ ----- ----- ----- ----- ----- ----- ----- ----- ----- ----- ----- ----- ----- ----- -
1 100 086 096 098 100 088 099 099 099 101 087 103 101 098 094 1
2 198 164 188 191 196 168 190 192 195 198 166 197 196 192 180 2
3 293 238 277 279 288 243 276 280 288 290 242 285 285 282 261 3
4 383 306 362 363 376 314 355 364 377 377 313 363 368 369 337 4
5 472 370 445 444 460 380 429 444 463 461 380 436 447 453 410 5
6 557 431 526 522 541 443 498 522 547 540 445 504 522 535 480 6
7 640 488 604 597 619 503 562 597 628 617 507 568 594 614 547 7
8 721 543 680 671 696 559 622 669 706 692 566 627 663 691 611 8
9 801 595 754 743 770 614 679 741 782 766 623 684 731 766 673 9
10 879 647 827 814 843 668 736 811 855 838 679 740 798 838 734 10 11 934 684 878 864 895 707 776 862 907 889 720 780 845 890 778 11 12 1005 732 945 929 962 758 830 926 974 955 774 833 906 956 836 12 13 1074 779 1009 992 1026 808 882 989 1040 1018 827 885 965 1020 893 13 14 1141 825 1071 1053 1089 857 934 1050 1104 1079 879 937 1022 1083 948 14 15 1206 871 1133 1114 1150 906 986 1111 1166 1139 929 988 1079 1145 1002 15 16 1270 916 1193 1173 1209 953 1037 1171 1226 1198 979 1039 1135 1205 1054 16 17 1332 960 1251 1232 1267 1000 1087 1230 1285 1255 1028 1089 1191 1263 1105 17 18 1392 1004 1308 1290 1324 1047 1137 1289 1343 1310 1076 1139 1246 1320 1155 18 19 1451 1047 1364 1348 1379 1093 1186 1346 1399 1364 1124 1188 1301 1375 1204 19 20 1508 1090 1419 1404 1433 1138 1234 1404 1454 1417 1171 1236 1355 1429 1252 20 21 1564 1132 1473 1460 1486 1182 1281 1461 1507 1469 1217 1283 1409 1482 1299 21 22 1618 1174 1526 1516 1537 1227 1328 1517 1560 1520 1263 1330 1463 1533 1345 22 23 1672 1214 1577 1570 1588 1270 1375 1572 1610 1569 1308 1376 1517 1584 1390 23 24 1723 1254 1628 1624 1637 1313 1421 1627 1660 1617 1352 1422 1569 1633 1435 24 25 1774 1294 1677 1676 1685 1355 1466 1680 1709 1664 1395 1467 1621 1680 1478 25 26 1823 1332 1725 1727 1731 1396 1511 1732 1756 1710 1438 1511 1672 1727 1521 26 27 1871 1370 1772 1778 1777 1436 1555 1783 1802 1755 1480 1555 1722 1772 1562 27 28 1918 1407 1818 1827 1821 1476 1598 1834 1847 1798 1521 1598 1771 1817 1603 28 29 1963 1444 1863 1875 1865 1515 1641 1883 1891 1841 1561 1641 1820 1860 1643 29 30 2008 1479 1907 1922 1907 1553 1684 1931 1934 1882 1600 1683 1868 1902 1682 30
aOMB discount rate as of February 2008 See p 20 for instructions on use page xiii for abbreviations
C Projected Average Fuel Price Indices and Escalation Rates (Real)
Tables Ca-1 through Ca-5 present projected fuel price indices for the four Census regions and for the United States These indices when multiplied by annual energy costs computed at base-date prices (ie as of April 1 2008) provide estimates of future-year costs (also as of April 1) in constant base-date dollars Constant-dollar cost estimates are needed when discounting is performed with a real discount rate (ie a rate that does not include general price inflation)
These indices were used in the calculation of the UPV factors for energy prices in the Ba and Bb tables in this publication While they are based on April 1 energy prices to maintain consistency in the computation of these UPV factors the level of precision implied here is not required for most LCC analyses That is the analyst need not calibrate base-year energy prices precisely to April 1 2008 levels to use these indices (or the corresponding UPV factors) instead the analyst should use current price levels as of the base-date of the LCC analysis regardless of the time of the year that the study is undertaken
Example of How to Use the Indices
To estimate the price of industrial coal in 2012 in Connecticut (in constant 2008 dollars) go to Table Ca-1 find the year 2012 index for industrial coal (098) and multiply by the price for industrial coal in Connecticut in 2008
For further explanation of how to use these tables see NIST Handbook 135
Tables Cb-1 through Cb-5 present the projected average fuel price escalation rates (percentage change compounded annually) for selected periods from 2008 to 2038 for the four Census regions and for the overall United States Note that these are real rates exclusive of general price inflation Their use results in prices expressed in constant dollars
The average fuel escalation rates consolidate the information provided by the indices in the Ca tables so that trends in projected price changes can be seen at a glance They are provided primarily to accommodate computer programs (such as BLCC) which require price escalation rates as inputs
Unless there is a compelling reason to use escalation rates it is recommended that you use the indices in the Ca tables when you need estimates of future-year energy prices since the indices include year-to-year information rather than averages over a number of years
Example of How to Use the Escalation Rates
To estimate the unit price of residential natural gas at the end of 2018 (p18) in Wyoming using the DOE energy price escalation rates go to Table Cb-4 and find the 2008 to 2013 and the 2013 to 2018 escalation rates for residential natural gas (-20 for 5 years and -01 for 5 years respectively) Enter these values and the unit price of residential natural gas in Wyoming in 2008 (p08) into the following formula Then solve for the 2018 energy price (stated in 2008 dollars)
26
N ki
py = p0 timesprod(1+ ei ) i=1
p18 = p08 times (1+ e1 )k1 times (1+ e2 )k2
= p08 times (1minus 002)5 times (1minus 0001)5
= p08 times 09039 times 09950 = p08 times 0899
where py = price at end of year y p0 = unit price at base date ei = annual compound escalation rate for period i from the Cb tables (in decimal form) and ki = number of years over which escalation rate ei occurs
Note that the compounded escalation rate factor (0899) corresponds to the fuel price index in region 4 residential natural gas for the year 2018 in table Ca-4 (090)
The data in the Ca and Cb tables on the following pages are reported for the four Census regions and the US average Figure B-1 on page 13 presents a map showing the states corresponding to the four Census regions The Census regions do not include American Samoa Canal Zone Guam Puerto Rico Trust Territory of the Pacific Islands or the Virgin Islands Analysts of federal projects in these areas should use data which are reasonable under the circumstances and may refer to the tables with US average data for guidance
27
Table Ca-1 Projected fuel price indices (excluding general inflation) by end-use sector and fuel type
28
Census Region 1 (Connecticut Maine Massachusetts New HampshireNew Jersey New York Pennsylvania Rhode Island Vermont)
----------------- Projected April 1 Fuel Price Indices (April 1 2008 = 100)
----- ----- ----- ----- ----- ----- ----- ----- ----- ----- ----- ----- ----- ----- ----- Sector and Fuel 2009 2010 2011 2012 2013 2014 2015 2016 2017 2018 2019 2020 2021 2022 2023 ----------------- ----- ----- ----- ----- ----- ----- ----- ----- ----- ----- ----- ----- ----- ----- -----
Residential ElectricityDistillate Oil
103 089
101 083
100 079
100 076
100 073
099 071
099 069
099 066
100 066
101 066
101 067
100 068
099 068
100 069
100 070
LPG 096 093 092 091 091 090 089 089 089 089 089 089 089 089 089
Natural Gas 101 099 097 095 093 092 091 091 091 092 093 092 092 093 094
Commercial ElectricityDistillate Oil
102 092
098 085
095 083
093 079
091 076
090 074
089 072
089 070
090 069
091 070
091 071
091 073
090 073
090 074
091 074
Residual Oil 100 094 090 087 083 079 075 071 070 071 073 074 075 076 077
Natural Gas 102 099 096 094 092 091 089 089 090 091 092 092 091 092 093
Coal 101 099 095 091 088 088 087 085 083 082 081 081 081 082 082
Industrial ElectricityDistillate Oil
102 091
097 085
091 084
089 081
086 077
084 077
083 075
083 072
083 072
084 072
084 074
083 077
082 077
082 077
083 078
Residual Oil 100 094 090 086 082 079 075 071 070 071 073 074 075 076 077
Natural Gas 103 099 096 093 090 087 085 084 084 085 086 085 084 085 085
Coal 100 099 099 098 098 097 096 096 095 094 094 094 094 094 094
TransportationMotor Gasoline 096 088 086 083 081 080 078 076 075 076 078 080 080 081 081
----------------- ----- ----- ----- ----- ----- ----- ----- ----- ----- ----- ----- ----- ----- ----- -----
Table Ca-1 continued Projected fuel price indices (excluding general inflation) by end-use sector and fuel type
29
Census Region 1 (Connecticut Maine Massachusetts New HampshireNew Jersey New York Pennsylvania Rhode Island Vermont)
----------------- Projected April 1 Fuel Price Indices (April 1 2008 = 100)
----- ----- ----- ----- ----- ----- ----- ----- ----- ----- ----- ----- ----- ----- ----- Sector and Fuel 2024 2025 2026 2027 2028 2029 2030 2031 2032 2033 2034 2035 2036 2037 2038 ----------------- ----- ----- ----- ----- ----- ----- ----- ----- ----- ----- ----- ----- ----- ----- -----
Residential ElectricityDistillate Oil
100 071
101 072
101 073
101 074
101 075
102 076
102 077
102 078
103 078
103 079
103 080
103 080
103 081
104 082
104 082
LPG 090 090 090 090 091 092 092 092 093 093 094 094 095 095 096
Natural Gas 095 096 097 098 099 101 102 103 103 104 105 105 106 107 107
Commercial ElectricityDistillate Oil
091 075
092 076
092 078
092 079
093 080
094 081
094 082
095 083
095 084
095 085
096 085
096 086
097 087
097 088
097 089
Residual Oil 079 080 081 081 082 084 085 087 088 089 091 092 093 095 096
Natural Gas 095 096 097 098 100 102 104 105 105 106 107 108 109 109 110
Coal 083 083 083 084 085 086 086 087 087 087 088 088 088 088 088
Industrial ElectricityDistillate Oil
084 078
084 079
085 081
085 082
086 083
086 084
087 085
087 086
087 087
088 088
088 088
089 089
089 090
089 091
090 091
Residual Oil 078 079 081 081 082 083 085 086 087 089 090 091 092 094 095
Natural Gas 087 088 089 090 092 094 095 096 097 099 100 101 102 103 104
Coal 094 094 093 094 094 094 094 095 095 095 095 096 096 096 096
TransportationMotor Gasoline 082 082 082 083 084 085 085 086 087 087 088 088 089 089 090
----------------- ----- ----- ----- ----- ----- ----- ----- ----- ----- ----- ----- ----- ----- ----- -----
Table Ca-2 Projected fuel price indices (excluding general inflation) by end-use sector and fuel type
30
Census Region 2 (Illinois Indiana Iowa Kansas Michigan MinnesotaMissouri Nebraska North Dakota Ohio South Dakota Wisconsin)
----------------- Projected April 1 Fuel Price Indices (April 1 2008 = 100)
----- ----- ----- ----- ----- ----- ----- ----- ----- ----- ----- ----- ----- ----- ----- Sector and Fuel 2009 2010 2011 2012 2013 2014 2015 2016 2017 2018 2019 2020 2021 2022 2023 ----------------- ----- ----- ----- ----- ----- ----- ----- ----- ----- ----- ----- ----- ----- ----- ----- Residential
ElectricityDistillate Oil
103 086
104 079
103 076
102 072
101 068
100 067
100 064
100 062
100 061
101 062
101 062
101 063
101 063
101 064
101 065
LPG 101 100 099 098 097 096 095 095 095 095 096 095 095 095 096
Natural Gas 100 097 094 092 090 088 087 087 087 088 089 088 087 088 089
Commercial
ElectricityDistillate Oil
103 088
104 081
102 079
100 075
098 072
096 070
095 068
095 065
095 065
096 065
096 067
096 068
096 069
096 069
096 070
Residual Oil 111 106 101 088 082 080 077 074 073 074 076 079 080 081 083
Natural Gas 101 097 093 091 089 087 086 086 086 087 088 088 087 088 089
Coal 102 102 103 103 103 103 102 102 101 101 100 100 100 101 101
Industrial
ElectricityDistillate Oil
104 091
104 084
101 084
098 080
095 077
093 076
092 074
092 072
092 072
093 072
093 074
092 076
092 076
091 077
092 077
Residual Oil 108 102 097 086 081 079 076 072 071 072 074 076 077 078 080
Natural Gas 103 100 096 093 090 087 086 085 085 086 087 085 084 084 086
Coal 100 100 099 098 097 097 097 096 096 097 097 097 096 097 097
Transportation
Motor Gasoline 098 090 088 086 083 082 080 078 078 079 081 083 083 083 083
----------------- ----- ----- ----- ----- ----- ----- ----- ----- ----- ----- ----- ----- ----- ----- -----
Table Ca-2 continued Projected fuel price indices (excluding general inflation) by end-use sector and fuel type
31
Census Region 2 (Illinois Indiana Iowa Kansas Michigan MinnesotaMissouri Nebraska North Dakota Ohio South Dakota Wisconsin)
----------------- Projected April 1 Fuel Price Indices (April 1 2008 = 100)
----- ----- ----- ----- ----- ----- ----- ----- ----- ----- ----- ----- ----- ----- ----- Sector and Fuel 2024 2025 2026 2027 2028 2029 2030 2031 2032 2033 2034 2035 2036 2037 2038 ----------------- ----- ----- ----- ----- ----- ----- ----- ----- ----- ----- ----- ----- ----- ----- -----
Residential ElectricityDistillate Oil
101 066
100 067
100 068
100 069
100 070
100 071
101 072
101 073
101 074
101 074
101 075
101 076
101 076
101 077
101 078
LPG 096 097 097 098 099 100 100 101 102 102 103 104 104 105 105
Natural Gas 091 092 094 095 096 098 100 101 102 103 103 104 105 106 107
Commercial ElectricityDistillate Oil
096 071
096 072
096 073
096 074
097 075
097 077
098 078
098 079
099 080
099 080
099 081
099 082
099 083
100 083
100 084
Residual Oil 084 086 087 088 089 090 092 093 094 096 097 098 100 101 102
Natural Gas 091 092 094 095 097 100 101 103 103 104 105 106 107 108 109
Coal 101 100 100 100 101 101 101 101 102 102 102 103 103 103 103
Industrial ElectricityDistillate Oil
092 078
092 079
091 080
091 081
092 082
092 083
093 085
093 086
093 086
093 087
093 088
094 089
094 089
094 090
094 091
Residual Oil 081 083 084 085 086 087 088 090 091 092 093 095 096 097 099
Natural Gas 088 089 091 092 095 097 099 101 102 103 104 105 107 108 109
Coal 098 098 099 099 099 100 100 100 100 101 101 101 102 102 102
TransportationMotor Gasoline 083 084 084 085 086 087 088 088 089 089 090 091 091 092 092
----------------- ----- ----- ----- ----- ----- ----- ----- ----- ----- ----- ----- ----- ----- ----- -----
----------------- ----- ----- ----- ----- ----- ----- ----- ----- ----- ----- ----- ----- ----- ----- -----
----------------- ----- ----- ----- ----- ----- ----- ----- ----- ----- ----- ----- ----- ----- ----- -----
----------------- ----- ----- ----- ----- ----- ----- ----- ----- ----- ----- ----- ----- ----- ----- -----
32
Table Ca-3 Projected fuel price indices (excluding general inflation) by end-use sector and fuel type
Census Region 3 (Alabama Arkansas Delaware District of Columbia Florida GeorgiaKentucky Louisiana Maryland Mississippi North Carolina Oklahoma South Carolina
Tennessee Texas Virginia West Virginia)
Projected April 1 Fuel Price Indices (April 1 2008 = 100)
Sector and Fuel 2009 2010 2011 2012 2013 2014 2015 2016 2017 2018 2019 2020 2021 2022 2023
Residential ElectricityDistillate Oil
103 089
104 083
102 079
101 076
100 073
099 071
099 068
099 066
099 066
099 066
099 067
099 067
099 068
099 068
099 069
LPG 097 094 093 092 091 091 090 090 090 090 091 091 090 091 091
Natural Gas 100 097 094 093 092 090 089 089 090 091 092 092 092 093 094
Commercial ElectricityDistillate Oil
103 091
103 084
101 082
099 078
098 074
096 073
095 071
095 068
095 067
095 068
095 070
095 071
095 072
095 072
095 073
Residual Oil 114 110 104 097 091 088 083 079 078 078 080 081 082 083 084
Natural Gas 102 098 095 093 092 090 089 089 089 090 091 092 092 093 094
Coal 101 099 097 093 092 090 088 087 086 085 085 085 085 085 085
Industrial ElectricityDistillate Oil
104 090
103 084
100 083
098 080
096 077
094 076
093 074
093 071
093 071
093 072
093 074
093 076
093 076
093 076
093 077
Residual Oil 106 099 094 086 081 079 075 071 070 071 072 073 074 075 077
Natural Gas 104 101 096 092 089 087 084 083 084 085 086 086 086 087 088
Coal 100 097 095 092 091 090 089 089 088 088 087 088 088 088 088
TransportationMotor Gasoline 098 091 087 084 081 080 078 076 076 077 079 081 081 081 081
----------------- ----- ----- ----- ----- ----- ----- ----- ----- ----- ----- ----- ----- ----- ----- -----
----------------- ----- ----- ----- ----- ----- ----- ----- ----- ----- ----- ----- ----- ----- ----- -----
----------------- ----- ----- ----- ----- ----- ----- ----- ----- ----- ----- ----- ----- ----- ----- -----
33
Table Ca-3 continued Projected fuel price indices (excluding general inflation) by end-use sector and fuel type
Census Region 3 (Alabama Arkansas Delaware District of Columbia Florida GeorgiaKentucky Louisiana Maryland Mississippi North Carolina Oklahoma South Carolina
Tennessee Texas Virginia West Virginia)
Projected April 1 Fuel Price Indices (April 1 2008 = 100)
Sector and Fuel 2024 2025 2026 2027 2028 2029 2030 2031 2032 2033 2034 2035 2036 2037 2038
Residential ElectricityDistillate Oil
099 070
099 071
099 073
099 073
100 074
100 076
100 077
100 078
100 078
100 079
100 079
101 080
101 081
101 082
101 082
LPG 091 092 092 092 093 094 094 095 095 096 096 097 097 098 098
Natural Gas 095 097 098 098 100 102 103 104 105 106 106 107 108 109 109
Commercial ElectricityDistillate Oil
095 074
095 075
096 076
096 077
096 078
097 080
097 081
097 082
097 083
097 084
097 085
098 085
098 086
098 087
098 088
Residual Oil 086 088 090 090 092 093 094 096 097 099 100 101 103 104 106
Natural Gas 095 097 098 099 101 103 104 105 106 107 108 109 110 110 111
Coal 085 085 084 084 084 084 085 085 085 085 086 086 086 086 087
Industrial ElectricityDistillate Oil
093 077
093 078
094 080
094 081
095 082
095 083
095 085
095 085
095 086
096 087
096 088
096 088
096 089
097 090
097 091
Residual Oil 078 080 081 082 083 084 085 087 088 089 090 092 093 094 096
Natural Gas 090 092 093 094 097 099 101 102 104 105 106 108 109 111 112
Coal 088 088 088 088 088 088 088 088 089 089 089 089 090 090 090
TransportationMotor Gasoline 081 082 083 083 084 085 086 086 087 088 088 089 089 090 091
Table Ca-4 Projected fuel price indices (excluding general inflation) by end-use sector and fuel type
34
Census Region 4 (Alaska Arizona California Colorado HawaiiIdaho Montana Nevada New Mexico Oregon Utah Washington Wyoming)
----------------- Projected April 1 Fuel Price Indices (April 1 2008 = 100)
----- ----- ----- ----- ----- ----- ----- ----- ----- ----- ----- ----- ----- ----- -----
Sector and Fuel 2009 2010 2011 2012 2013 2014 2015 2016 2017 2018 2019 2020 2021 2022 2023
----------------- ----- ----- ----- ----- ----- ----- ----- ----- ----- ----- ----- ----- ----- ----- -----
Residential ElectricityDistillate Oil
101 076
100 067
098 064
096 063
095 062
096 060
096 059
096 058
097 057
097 058
098 060
097 061
097 062
098 062
098 063
LPG 098 095 094 093 092 091 091 091 091 091 091 091 090 090 090
Natural Gas 100 097 094 092 090 089 089 089 089 090 091 090 088 088 090
Commercial ElectricityDistillate Oil
101 083
099 076
096 073
093 071
091 069
090 069
089 067
089 065
089 065
089 066
089 068
089 070
088 071
088 071
088 072
Residual Oil 123 122 115 094 087 086 083 081 080 082 086 090 092 093 095
Natural Gas 100 097 093 092 090 089 088 088 089 090 091 090 088 088 090
Coal 102 102 101 100 100 100 099 098 098 100 100 101 101 101 102
Industrial ElectricityDistillate Oil
101 085
100 077
097 076
094 073
093 072
092 072
091 070
091 068
091 068
091 069
092 072
091 074
090 074
091 075
091 075
Residual Oil 125 124 118 097 089 088 086 083 083 084 088 092 094 096 098
Natural Gas 101 096 091 088 085 083 082 081 081 081 082 081 077 077 079
Coal 101 100 099 098 097 097 096 096 096 096 096 097 097 097 098
TransportationMotor Gasoline 094 089 087 085 082 081 079 077 077 078 079 081 080 080 081
----------------- ----- ----- ----- ----- ----- ----- ----- ----- ----- ----- ----- ----- ----- ----- -----
Table Ca-4 continued Projected fuel price indices (excluding general inflation) by end-use sector and fuel type
35
Census Region 4 (Alaska Arizona California Colorado HawaiiIdaho Montana Nevada New Mexico Oregon Utah Washington Wyoming)
----------------- Projected April 1 Fuel Price Indices (April 1 2008 = 100)
----- ----- ----- ----- ----- ----- ----- ----- ----- ----- ----- ----- ----- ----- ----- Sector and Fuel 2024 2025 2026 2027 2028 2029 2030 2031 2032 2033 2034 2035 2036 2037 2038 ----------------- ----- ----- ----- ----- ----- ----- ----- ----- ----- ----- ----- ----- ----- ----- -----
Residential ElectricityDistillate Oil
098 065
099 065
100 067
100 068
100 069
101 070
101 071
102 072
102 072
102 073
103 073
103 074
104 075
104 075
104 076
LPG 091 092 093 093 094 095 096 096 097 097 098 098 099 099 100
Natural Gas 091 093 095 097 098 101 103 104 104 105 106 107 108 108 109
Commercial ElectricityDistillate Oil
088 073
089 074
089 076
089 077
090 078
091 079
091 080
091 081
091 082
091 082
091 083
092 084
092 084
092 085
092 086
Residual Oil 097 099 101 102 103 104 106 107 109 110 112 113 115 116 118
Natural Gas 092 094 097 098 100 103 105 107 108 108 109 110 111 112 113
Coal 103 104 105 106 106 107 107 107 108 108 108 109 109 109 110
Industrial ElectricityDistillate Oil
091 076
092 077
092 078
093 079
093 080
094 081
094 082
094 083
095 084
095 084
095 085
095 086
096 087
096 087
096 088
Residual Oil 100 102 104 105 106 107 109 110 112 113 115 116 118 120 121
Natural Gas 081 083 086 088 090 093 096 098 099 100 101 103 104 105 107
Coal 099 100 100 100 101 102 102 102 102 103 103 103 104 104 104
TransportationMotor Gasoline 080 080 080 080 080 081 081 081 082 082 083 083 084 085 085
----------------- ----- ----- ----- ----- ----- ----- ----- ----- ----- ----- ----- ----- ----- ----- -----
Table Ca-5 Projected fuel price indices (excluding general inflation) by end-use sector and fuel type
36
United States Average
----------------- Projected April 1 Fuel Price Indices (April 1 2008 = 100)
----- ----- ----- ----- ----- ----- ----- ----- ----- ----- ----- ----- ----- ----- ----- Sector and Fuel 2009 2010 2011 2012 2013 2014 2015 2016 2017 2018 2019 2020 2021 2022 2023 ----------------- ----- ----- ----- ----- ----- ----- ----- ----- ----- ----- ----- ----- ----- ----- -----
Residential ElectricityDistillate Oil
103 089
103 082
101 078
100 075
099 072
099 070
098 068
098 066
098 065
099 066
099 066
099 067
098 068
099 068
099 069
LPG 099 096 095 094 093 093 092 092 092 092 093 092 092 092 093
Natural Gas 100 097 095 093 091 090 089 089 089 090 091 090 090 090 091
Commercial ElectricityDistillate Oil
102 090
101 084
099 081
097 078
095 074
093 073
092 071
092 068
093 068
093 068
093 070
093 072
092 072
092 072
092 073
Residual Oil 102 096 092 087 083 080 076 072 071 072 073 075 076 077 078
Natural Gas 101 098 094 093 091 089 088 088 088 089 090 090 089 090 092
Coal 102 101 100 098 097 096 095 095 094 094 093 094 094 094 094
Industrial ElectricityDistillate Oil
103 089
102 082
099 082
096 079
094 076
092 075
091 073
091 071
091 070
091 071
092 073
091 076
091 076
091 076
091 077
Residual Oil 105 099 094 087 082 079 075 071 070 071 073 074 075 076 077
Natural Gas 103 100 095 092 089 086 084 083 084 085 086 085 084 084 086
Coal 100 098 097 096 095 094 094 093 093 092 092 092 092 093 093
TransportationMotor Gasoline 096 090 087 084 082 081 079 077 077 077 079 081 081 081 081
----------------- ----- ----- ----- ----- ----- ----- ----- ----- ----- ----- ----- ----- ----- ----- -----
Table Ca-5 continued Projected fuel price indices (excluding general inflation) by end-use sector and fuel type
37
United States Average
----------------- Projected April 1 Fuel Price Indices (April 1 2008 = 100)
----- ----- ----- ----- ----- ----- ----- ----- ----- ----- ----- ----- ----- ----- ----- Sector and Fuel 2024 2025 2026 2027 2028 2029 2030 2031 2032 2033 2034 2035 2036 2037 2038 ----------------- ----- ----- ----- ----- ----- ----- ----- ----- ----- ----- ----- ----- ----- ----- ----- Residential
ElectricityDistillate Oil
099 070
099 071
099 072
099 073
100 074
100 075
100 076
100 077
101 078
101 078
101 079
101 080
101 080
101 081
102 082
LPG 093 094 094 095 095 096 097 097 098 098 099 099 100 100 101
Natural Gas 093 094 096 097 098 100 102 103 104 104 105 106 107 107 108
Commercial
ElectricityDistillate Oil
093 074
093 075
093 076
093 077
094 079
094 080
094 081
095 082
095 083
095 084
096 084
096 085
096 086
096 087
097 088
Residual Oil 079 081 082 082 083 085 086 088 089 090 092 093 094 096 097
Natural Gas 093 095 097 098 100 102 103 105 105 106 107 108 109 110 111
Coal 094 095 095 095 095 095 096 096 096 097 097 097 097 098 098
Industrial
ElectricityDistillate Oil
091 077
091 078
091 079
091 080
092 081
093 083
093 084
093 085
094 086
094 086
094 087
094 088
094 089
095 089
095 090
Residual Oil 079 080 082 082 083 085 086 087 089 090 091 092 094 095 096
Natural Gas 088 089 091 092 095 097 099 101 102 103 105 106 107 108 110
Coal 093 093 094 094 094 094 094 095 095 095 096 096 096 096 096
Transportation
Motor Gasoline 081 082 082 083 083 084 085 085 086 087 087 088 088 089 089
----------------- ----- ----- ----- ----- ----- ----- ----- ----- ----- ----- ----- ----- ----- ----- -----
----------------- ----- ----- ----- ----- ----- -----
----------------- ----- ----- ----- ----- ----- -----
----------------- ----- ----- ----- ----- ----- -----
Table Cb-1 Projected average fuel price escalation rates excluding general inflation by end-use sector and fuel type
Census Region 1 (Connecticut Maine Massachusetts New HampshireNew Jersey New York Pennsylvania Rhode Island Vermont)
Percentage change compounded annually
2008 2013 2018 2023 2028 2033 Sector and Fuel to to to to to to
2013 2018 2023 2028 2033 2038
Residential Electricity -01 02 -01 03 03 02 Distillate Oil -62 -18 09 14 11 08 LPG -20 -03 00 04 05 05 Natural Gas -14 -03 04 12 10 06
Commercial Electricity -18 -02 00 06 05 04 Distillate Oil -54 -16 13 14 12 09 Residual Oil -37 -29 16 13 16 15 Natural Gas -16 -03 05 14 12 08 Coal -24 -15 01 07 05 03
Industrial Electricity -29 -05 -03 07 05 04 Distillate Oil -50 -13 14 12 12 09 Residual Oil -38 -28 15 13 16 14 Natural Gas -22 -10 01 14 14 11 Coal -03 -09 00 -01 03 03
TransportationMotor Gasoline -41 -12 13 06 08 07
38
----------------- ----- ----- ----- ----- ----- -----
----------------- ----- ----- ----- ----- ----- -----
----------------- ----- ----- ----- ----- ----- -----
Table Cb-2 Projected average fuel price escalation rates excluding general inflation by end-use sector and fuel type
Census Region 2 (Illinois Indiana Iowa Kansas Michigan MinnesotaMissouri Nebraska North Dakota Ohio South Dakota Wisconsin)
Percentage change compounded annually
2008 2013 2018 2023 2028 2033 Sector and Fuel to to to to to to
2013 2018 2023 2028 2033 2038
Residential Electricity 02 -00 -01 -01 01 -00 Distillate Oil -73 -20 11 15 11 09 LPG -07 -03 00 07 07 06 Natural Gas -21 -04 03 16 12 08
Commercial Electricity -04 -04 01 01 04 02 Distillate Oil -65 -17 14 15 13 09 Residual Oil -38 -21 23 16 14 14 Natural Gas -23 -04 04 18 14 09 Coal 06 -04 00 00 03 03
Industrial Electricity -10 -05 -02 00 04 01 Distillate Oil -51 -13 14 12 12 08 Residual Oil -42 -23 20 16 14 14 Natural Gas -21 -09 00 20 17 12 Coal -06 -01 01 04 04 03
TransportationMotor Gasoline -36 -11 11 06 08 07
39
----------------- ----- ----- ----- ----- ----- -----
----------------- ----- ----- ----- ----- ----- -----
----------------- ----- ----- ----- ----- ----- -----
Table Cb-3 Projected average fuel price escalation rates excluding general inflation by end-use sector and fuel type
Census Region 3 (Alabama Arkansas Delaware District of Columbia FloridaGeorgia Kentucky Louisiana Maryland Mississippi North Carolina Oklahoma South
Carolina Tennessee Texas Virginia West Virginia)
Percentage change compounded annually
2008 2013 2018 2023 2028 2033 Sector and Fuel to to to to to to
2013 2018 2023 2028 2033 2038
Residential Electricity 00 -03 01 01 01 01 Distillate Oil -62 -18 09 14 11 09 LPG -18 -02 02 05 05 05 Natural Gas -17 -02 07 13 11 07
Commercial Electricity -05 -05 00 02 02 02 Distillate Oil -58 -17 14 15 13 09 Residual Oil -19 -29 15 17 14 14 Natural Gas -17 -03 08 14 12 08 Coal -18 -14 -01 -02 03 04
Industrial Electricity -09 -06 -00 03 02 02 Distillate Oil -52 -13 14 12 13 09 Residual Oil -41 -28 16 17 14 14 Natural Gas -22 -10 07 18 17 13 Coal -18 -08 00 00 03 02
TransportationMotor Gasoline -40 -12 12 06 08 07
40
----------------- ----- ----- ----- ----- ----- -----
----------------- ----- ----- ----- ----- ----- -----
----------------- ----- ----- ----- ----- ----- -----
Table Cb-4 Projected average fuel price escalation rates excluding general inflation by end-use sector and fuel type
Census Region 4 (Alaska Arizona California Colorado HawaiiIdaho Montana Nevada New Mexico Oregon Utah Washington Wyoming)
Percentage change compounded annually
2008 2013 2018 2023 2028 2033 Sector and Fuel to to to to to to
2013 2018 2023 2028 2033 2038
Residential Electricity -09 03 02 05 04 04 Distillate Oil -93 -10 16 18 10 08 LPG -17 -02 -02 07 07 05 Natural Gas -20 -01 -01 19 14 08
Commercial Electricity -19 -04 -03 05 03 02 Distillate Oil -70 -10 18 16 11 09 Residual Oil -28 -12 31 16 13 13 Natural Gas -21 00 01 22 15 08 Coal -01 00 06 07 03 04
Industrial Electricity -15 -02 -02 06 04 03 Distillate Oil -63 -08 17 13 11 08 Residual Oil -22 -13 31 16 13 13 Natural Gas -32 -09 -07 28 21 13 Coal -05 -03 05 05 04 03
TransportationMotor Gasoline -38 -11 07 -01 05 07
41
----------------- ----- ----- ----- ----- ----- -----
----------------- ----- ----- ----- ----- ----- -----
----------------- ----- ----- ----- ----- ----- -----
Table Cb-5 Projected average fuel price escalation rates excluding general inflation by end-use sector and fuel type
United States Average
Percentage change compounded annually
2008 2013 2018 2023 2028 2033 Sector and Fuel to to to to to to
2013 2018 2023 2028 2033 2038
Residential Electricity -02 -01 00 02 02 02 Distillate Oil -64 -18 10 14 11 09 LPG -14 -02 01 06 06 06 Natural Gas -18 -03 03 15 12 07
Commercial Electricity -11 -04 -01 03 04 02 Distillate Oil -58 -16 13 14 13 09 Residual Oil -36 -29 16 14 16 15 Natural Gas -19 -03 05 17 13 08 Coal -06 -07 01 03 03 03
Industrial Electricity -13 -05 -02 03 04 02 Distillate Oil -54 -12 15 12 12 09 Residual Oil -40 -27 17 15 15 14 Natural Gas -23 -10 02 20 18 13 Coal -11 -05 02 02 03 03
TransportationMotor Gasoline -39 -11 11 04 07 07
42
PART IIENERGY PRICE INDICES FOR PRIVATE SECTOR LCC ANALYSIS
This section presents tables of projected nominal (ie including inflation) fuel price indices for four fuels in the residential sector and five fuels in the commercial sector for each of the years from 2008 through 2038 These price indices are based on the DOE energy price projections reported in Part I Section B of this document used to calculate the FEMP and OMB UPV factors for energy costs Tables S-1 to S-5 are provided as an update to similar tables originally published in Comprehensive Guide for Least-Cost Energy Decisions (NBS SP 709)
As a convenience for the user the indices include the effect of four alternative hypothetical rates of general price inflation 2 3 4 and 5 Selection of these rates is in no way intended to suggest what actual rates might be Use of the indices produce price estimates in current dollars inclusive of general price inflation Current-dollar prices are needed when discounting is performed with discount rates that include general price inflation (ie nominal or market discount rates)
The calculated indices with inflation rates of 2 3 4 and 5 allow the analyst to perform evaluations based on the assumption of a positive rate of general price inflation that changes the purchasing power of the dollar Performing evaluations in current dollars is sometimes preferred for private investment decisions primarily because it facilitates the treatment of taxes
The indices in Tables S-1 through S-5 are derived from the indices reported in Tables Ca-1 through Ca-5 by means of the following equation
IS = IC times (1+ g )N
where IS = index found in Tables S-1 through S-5 IC = index found in Tables Ca-1 through Ca-5 g = annual rate of general price inflation in decimal form and N = number of years in this case equal to the year of the index minus 2007
Example of How to Use the Indices
Suppose you wish to estimate the annual cost of natural gas for a house in Maryland in year 2011 given the annual cost in 2008 (April 1) prices and you expect an annual inflation rate of 3 per year From table S-3 find the column with residential natural gas indices at an inflation rate of 3 then locate the index for the year 2011 This index is 103 Multiply the annual cost in 2008 prices by the index to find the estimated annual cost in year 2011 prices
If this annual cost in year-2011 prices is to be discounted to present value you must use a nominal discount rate that includes the same assumption with regard to general price inflation (3 in this example) To obtain a present-value cost over the entire study period the present-value calculation must be repeated for each year that there are natural gas costs and the results summed (UPV factors are not given for private sector use because of the large number of
43
tables required to cover potential discount rates that might be used by the analyst) The BLCC computer program can perform LCC analyses using any inflation rate and discount rate in constant or in current (market) dollars The DISCOUNT program included with BLCC can compute UPV factors based on DOE energy price escalation rates using any inflation rate and discount rate (See page iv for more information on these programs) Of course the private sector analyst may use the UPV factors reported in Part I provided the analysis is performed in constant dollars and the desired discount rate corresponds to the DOE or OMB discount rates used in Part I
For further explanation of the use of these indices see NBS Special Publication 709 appendix B Part I
The data in the tables that follow are reported for the four Census regions and the US average Figure B-1 on page 13 presents a map showing the states corresponding to the four Census regions The Census regions do not include American Samoa Canal Zone Guam Puerto Rico Trust Territory of the Pacific Islands or the Virgin Islands Analysts of federal projects in these areas should use data which are reasonable under the circumstances and may refer to the tables with US average data for guidance
44
45
Table S-1 Projected fuel price indices with assumed general price inflation rates of 2 3 4 and 5 by end-use sector and fuel type
Census Region 1 (Connecticut Maine Massachusetts New HampshireNew Jersey New York Pennsylvania Rhode Island Vermont)
Projected April 1 Fuel Price Indices (April 1 2008 = 100)
--------------------------------------------------RESIDENTIAL---------------------------------------------------
Electricity
------------------------
Distillate Oil ------------------------
LPG ------------------------
Natural Gas ------------------------
Inflation Rate
Inflation Rate Inflation Rate Inflation Rate Year 2 3 4 5 2 3 4 5 2 3 4 5 2 3 4 5 2009 105 106 107 108 091 092 093 094 098 099 100 101 103 104 105 106 2010 105 108 110 112 086 088 089 091 097 099 101 103 103 105 107 109 2011 106 109 112 115 084 087 089 092 098 101 104 107 102 105 109 112 2012 108 113 117 122 082 086 089 092 099 103 107 111 103 107 111 115 2013 110 115 121 127 080 084 089 093 100 105 110 116 103 108 114 119 2014 112 118 125 133 080 085 090 095 101 107 114 120 103 110 116 123 2015 114 122 130 139 079 084 090 097 102 110 117 125 104 112 120 128 2016 116 126 136 147 078 084 091 098 104 113 122 131 106 115 124 134 2017 120 131 142 155 079 086 094 102 106 116 127 138 109 119 130 141 2018 123 135 149 164 081 089 098 108 109 120 132 145 112 123 136 150 2019 125 139 155 172 084 093 103 115 111 124 138 153 115 128 143 158 2020 127 143 160 180 086 097 108 122 113 127 143 160 117 132 148 166 2021 129 146 166 188 088 100 114 129 115 130 148 167 119 135 153 173 2022 131 151 172 197 091 104 119 136 117 135 154 176 122 140 160 183 2023 135 156 180 208 094 108 125 145 120 139 161 185 126 146 169 195 2024 138 161 188 219 097 113 132 154 123 144 168 195 130 152 177 207 2025 141 166 196 231 100 118 140 164 126 149 175 206 134 158 186 219 2026 144 172 204 243 104 124 147 175 129 154 183 217 139 165 196 233 2027 147 177 213 255 107 129 155 186 132 159 190 228 142 171 206 247 2028 151 183 222 269 111 135 164 198 135 164 199 241 147 179 217 263 2029 154 189 232 283 115 141 173 211 139 170 209 255 153 187 229 281 2030 158 196 242 299 119 148 182 225 142 176 218 269 158 195 242 298 2031 161 202 252 314 123 153 192 239 146 182 228 284 162 203 253 316 2032 165 209 263 331 126 159 201 253 149 189 238 299 166 210 265 334 2033 169 215 274 348 130 166 211 268 153 195 249 316 171 218 278 353 2034 172 222 286 366 133 172 221 283 157 202 260 333 175 226 290 372 2035 176 229 298 385 137 179 232 300 161 209 271 352 180 234 304 394 2036 180 237 310 406 141 185 243 318 165 217 284 371 185 243 318 416 2037 184 244 323 427 145 193 255 337 169 224 297 391 190 252 333 440 2038 188 252 337 449 149 200 267 356 173 232 310 413 195 261 349 465
46
Table S-1 continued Projected fuel price indices with assumed general price inflation rates of 2 3 4 and 5 by end-use sector and fuel type
Census Region 1 (Connecticut Maine Massachusetts New HampshireNew Jersey New York Pennsylvania Rhode Island Vermont)
Projected April 1 Fuel Price Indices (April 1 2008 = 100)
----------------------------------------------------------------COMMERCIAL-----------------------------------------------------------------
Electricity
------------------------
Distillate Oil ------------------------
Residual Oil ------------------------
Natural Gas ------------------------
Coal ------------------------
Inflation Rate
Inflation Rate Inflation Rate Inflation Rate Inflation Rate Year 2 3 4 5 2 3 4 5 2 3 4 5 2 3 4 5 2 3
4 5
2009 104 105 106 107 093 094 095 096 102 103 104 105 104 105 106 107 103 104 105
106 2010 102 104 106 108 089 091 092 094 098 100 102 104 103 105 107 109 103 105
107 109
2011 100 103 106 110 088 090 093 096 096 099 102 105 102 105 108 111 101 104 107
110 2012 101 105 109 113 086 089 093 096 094 097 101 105 102 106 110 114 099 103
107 111
2013 101 106 111 117 084 088 092 097 091 096 101 106 102 107 112 118 098 102 108
113 2014 101 107 114 120 084 089 094 100 089 094 100 106 102 108 115 121 099 105
111 117
2015 102 110 117 125 083 089 095 102 086 092 099 106 103 110 118 126 100 107 114
122 2016 104 113 122 132 082 088 095 103 084 090 098 105 105 113 122 132 099 108
116 125
2017 107 117 128 139 083 090 098 107 084 092 100 109 107 117 128 139 099 108 118
129 2018 110 122 134 148 085 094 103 114 087 096 106 116 111 122 135 148 100 110
121 133
2019 113 126 140 156 089 099 110 122 090 101 112 124 114 127 141 157 101 112 125
139 2020 115 130 146 163 092 104 117 131 094 105 118 132 116 131 147 165 103 116
130 146
2021 116 132 150 170 095 107 122 138 097 110 125 141 118 134 152 172 105 120 136
153 2022 119 136 156 179 097 111 127 146 100 115 132 150 122 139 160 182 108 124
142 162
2023 122 141 163 189 100 116 134 155 104 120 139 161 126 145 168 194 111 128 148
171 2024 125 146 171 199 103 121 141 164 108 126 147 171 130 152 177 207 113 132
155 180
2025 128 152 179 210 107 126 149 175 112 132 156 183 134 159 187 220 116 137 162
190 2026 132 157 187 222 111 132 157 187 116 138 164 195 139 166 197 235 119 142
169 201
2027 135 162 195 233 115 138 166 199 118 142 171 205 143 172 207 248 123 148 178
214 2028 139 169 204 248 118 144 175 212 123 149 181 219 149 181 219 266 127 154
187 226
2029 142 174 214 261 123 151 185 226 128 157 192 234 155 190 232 284 130 160 196
240 2030 146 181 223 276 127 158 195 241 132 164 203 250 160 198 245 303 134 166
205 253
2031 149 187 233 291 131 164 205 256 137 171 214 267 165 206 258 321 137 171 214
267 2032 153 193 244 307 135 171 215 271 142 179 226 284 169 214 270 340 140 176
223 280
2033 157 200 254 323 139 177 226 287 147 187 238 303 174 222 283 359 143 183 232
295 2034 160 207 266 341 143 184 237 304 152 196 252 323 179 231 296 380 147 189
243 311
2035 164 214 277 359 147 192 249 322 157 204 265 344 184 239 310 402 150 195 253
327 2036 168 221 289 378 152 199 261 341 163 214 280 366 189 248 325 425 153 201
264 345
2037 172 228 302 399 156 207 274 362 168 223 295 390 194 258 341 450 157 208 276
364 2038 176 236 316 421 160 215 287 383 174 233 312 416 200 267 357 476 160 215
287 382
47
Table S-1 continued Projected fuel price indices with assumed general price inflation rates of 2 3 4 and 5 by end-use sector and fuel type
Census Region 1 (Connecticut Maine Massachusetts New HampshireNew Jersey New York Pennsylvania Rhode Island Vermont)
Projected April 1 Fuel Price Indices (April 1 2008 = 100)
----------------------------------------------------------------INDUSTRIAL-----------------------------------------------------------------
Electricity
------------------------
Distillate Oil ------------------------
Residual Oil ------------------------
Natural Gas ------------------------
Coal ------------------------
Inflation Rate
Inflation Rate Inflation Rate Inflation Rate Inflation Rate Year 2 3 4 5 2 3 4 5 2 3 4 5 2 3 4 5 2 3
4 5
2009 104 105 106 107 093 094 095 096 102 103 104 105 105 106 107 108 102 103 104
105 2010 101 103 105 107 088 090 092 094 098 100 102 104 103 105 108 110 103 105
107 109
2011 097 100 103 106 089 091 094 097 096 099 102 105 101 104 107 111 105 108 111
114 2012 097 101 105 109 087 091 094 098 093 097 101 105 100 104 108 113 106 110
115 119
2013 095 100 105 110 086 090 094 099 091 095 100 105 099 104 109 114 109 114 120
125 2014 094 100 106 112 086 091 097 103 088 094 099 105 098 104 110 116 110 116
123 131
2015 095 102 109 117 086 092 098 105 086 092 099 105 098 104 112 119 111 118 127
135 2016 097 105 113 122 085 091 099 107 083 090 097 105 099 107 115 124 112 121
131 142
2017 099 109 118 129 086 094 102 111 084 092 100 109 101 110 120 131 114 124 135
147 2018 102 113 124 137 088 097 107 118 087 096 106 116 104 114 126 139 115 127
139 153
2019 104 116 129 144 093 103 115 127 090 100 112 124 107 119 132 147 117 130 144
160 2020 106 119 133 150 097 109 123 138 093 105 118 132 108 121 136 153 119 134
151 169
2021 106 121 137 155 099 113 128 144 096 110 124 141 108 123 140 158 122 138 157
178 2022 108 124 142 163 102 117 134 153 100 114 131 150 112 128 146 167 124 142
163 186
2023 111 129 149 172 105 121 140 162 103 120 138 160 115 133 154 178 127 147 170
196 2024 115 134 156 182 107 125 146 171 107 125 146 171 119 139 162 189 129 150
176 205
2025 118 139 164 193 111 131 155 182 111 131 155 182 123 145 171 201 131 155 183
215 2026 121 144 171 203 115 137 163 194 115 137 163 194 128 152 181 215 133 159
189 225
2027 123 148 178 214 119 143 172 206 117 141 170 204 131 158 190 227 137 164 197
237 2028 127 155 188 227 123 149 181 219 122 148 179 217 136 166 201 244 139 169
205 249
2029 130 160 196 240 127 156 191 234 126 155 190 232 142 174 213 261 142 174 214
261 2030 134 166 205 253 132 163 202 249 131 162 201 248 147 183 226 279 146 180
223 275
2031 137 172 215 267 136 170 212 264 136 170 212 264 152 190 238 296 149 187 233
290 2032 141 178 224 282 140 176 222 280 140 177 224 281 157 198 250 314 153 193
243 306
2033 144 184 234 297 144 183 233 296 145 185 236 300 162 206 263 334 156 199 253
322 2034 148 190 245 314 148 190 245 314 150 194 249 319 167 215 276 354 160 206
264 339
2035 151 197 256 331 152 198 257 333 155 202 263 340 172 224 290 376 164 213 276
358 2036 155 204 267 349 156 205 269 352 161 211 277 362 177 233 305 399 167 219
287 376
2037 159 211 279 368 161 214 283 373 166 221 292 386 183 243 321 424 171 227 300
396 2038 163 218 291 388 166 222 297 395 172 231 308 411 189 253 338 450 174 234
312 416
48
Table S-2 Projected fuel price indices with assumed general price inflation rates of 2 3 4 and 5 by end-use sector and fuel type
Census Region 2 (Illinois Indiana Iowa Kansas Michigan MinnesotaMissouri Nebraska North Dakota Ohio South Dakota Wisconsin)
Projected April 1 Fuel Price Indices (April 1 2008 = 100)
--------------------------------------------------RESIDENTIAL---------------------------------------------------
Electricity
------------------------
Distillate Oil ------------------------
LPG ------------------------
Natural Gas ------------------------
Inflation Rate
Inflation Rate Inflation Rate Inflation Rate Year 2 3 4 5 2 3 4 5 2 3 4 5 2 3 4 5 2009 105 106 107 108 088 089 090 091 103 104 106 107 102 103 104 105 2010 108 111 113 115 082 084 085 087 104 106 108 110 101 103 105 107 2011 110 113 116 119 080 083 085 088 105 108 111 114 099 102 105 108 2012 110 115 119 124 078 081 084 087 106 110 114 119 099 103 107 111 2013 112 117 123 129 075 079 083 087 107 112 118 123 099 104 109 115 2014 113 120 127 135 075 079 084 089 108 114 121 128 099 105 112 118 2015 115 123 132 141 073 079 084 090 109 117 125 134 100 107 115 123 2016 117 127 137 148 072 078 084 091 111 120 130 140 102 110 119 128 2017 120 131 143 156 073 080 087 095 114 124 135 147 104 114 124 135 2018 123 136 149 164 075 083 091 101 116 128 141 155 107 118 130 143 2019 126 140 156 173 078 086 096 107 119 132 147 164 110 123 137 152 2020 128 144 162 181 080 090 101 113 121 136 152 171 112 126 141 159 2021 130 148 168 190 082 093 106 120 122 139 158 178 113 128 145 165 2022 133 152 174 199 085 097 111 127 125 144 164 188 116 133 153 174 2023 135 157 181 209 088 101 117 135 129 149 172 199 120 139 161 186 2024 138 161 188 220 091 106 124 144 132 154 180 210 124 145 170 198 2025 140 166 195 230 094 111 131 154 135 160 188 222 129 152 179 211 2026 143 170 203 241 098 116 138 164 139 166 197 234 134 159 190 225 2027 145 175 210 252 101 121 146 175 143 172 206 247 138 166 199 239 2028 149 181 219 265 104 127 154 186 147 178 217 262 143 174 211 256 2029 152 186 228 279 108 133 163 199 151 185 227 278 149 183 224 274 2030 155 193 238 294 112 138 171 211 155 192 238 294 155 192 237 293 2031 159 199 248 309 115 144 180 224 159 199 249 310 159 199 249 310 2032 162 205 258 325 118 150 189 237 164 207 261 328 164 207 261 328 2033 165 211 268 341 122 156 198 252 168 214 273 346 168 215 273 347 2034 168 217 279 358 125 162 208 267 172 222 285 366 173 223 287 368 2035 172 223 290 376 129 168 218 282 177 230 298 386 178 231 300 389 2036 175 230 302 394 133 175 229 299 181 238 312 408 183 240 315 412 2037 179 237 314 414 137 182 240 317 186 247 327 431 188 250 330 436 2038 182 244 326 434 141 189 252 336 191 256 342 455 193 259 346 461
49
Table S-2 continued Projected fuel price indices with assumed general price inflation rates of 2 3 4 and 5 by end-use sector and fuel type
Census Region 2 (Illinois Indiana Iowa Kansas Michigan MinnesotaMissouri Nebraska North Dakota Ohio South Dakota Wisconsin)
Projected April 1 Fuel Price Indices (April 1 2008 = 100)
----------------------------------------------------------------COMMERCIAL-----------------------------------------------------------------
Electricity
------------------------
Distillate Oil ------------------------
Residual Oil ------------------------
Natural Gas ------------------------
Coal------------------------
Inflation Rate
Inflation Rate Inflation Rate Inflation Rate Inflation Rate Year 2 3 4 5 2 3 4 5 2 3 4 5 2 3 4 5 2 3
4 5
2009 105 106 107 108 090 091 092 093 113 114 115 116 103 104 105 106 104 105 106
107 2010 108 110 112 115 085 086 088 090 111 113 115 117 101 103 105 107 106 108
110 113
2011 109 112 115 119 084 087 089 092 107 110 113 116 099 102 105 108 110 113 116
120 2012 109 113 117 122 081 085 088 091 095 099 103 107 099 103 107 111 112 116
121 125
2013 108 113 119 125 079 083 087 091 091 095 100 105 098 103 108 114 114 119 125
131 2014 108 114 121 129 079 084 089 094 091 096 102 108 098 104 111 117 116 122
130 137
2015 109 117 125 134 078 083 089 095 088 094 101 108 099 106 114 121 117 125 134
143 2016 111 120 130 140 077 083 089 097 087 094 101 109 101 109 117 127 119 129
139 150
2017 114 124 135 147 077 085 092 101 087 095 104 113 103 113 123 134 121 132 144
157 2018 117 129 142 156 080 088 097 107 090 099 109 120 107 118 130 143 123 136
149 164
2019 119 133 148 164 083 093 103 115 095 106 117 131 110 122 136 151 125 139 155
172 2020 122 137 154 172 087 098 110 123 100 112 126 141 111 125 141 158 127 143
161 180
2021 124 140 159 180 089 101 115 130 104 118 133 151 112 128 145 164 130 147 167
189 2022 126 145 166 190 092 105 120 137 107 122 140 160 116 133 152 174 133 153
175 200
2023 129 150 173 200 094 109 126 146 111 129 149 172 120 139 161 185 136 157 182
210 2024 132 154 180 210 097 114 133 155 116 135 158 184 125 146 170 198 138 162
189 220
2025 135 159 187 220 101 119 140 165 120 142 167 197 129 153 180 212 141 166 196
230 2026 137 164 195 231 105 125 148 176 125 149 177 210 134 160 191 227 143 171
203 242
2027 140 168 202 243 108 130 157 188 128 154 185 222 139 167 201 241 146 176 212
254 2028 143 174 212 256 112 136 165 200 133 161 196 237 145 176 214 259 150 182
221 268
2029 147 180 221 270 116 143 175 214 137 168 206 251 151 185 227 278 153 188 230
281 2030 151 188 232 286 121 149 185 228 142 175 217 268 157 194 240 297 157 194
240 296
2031 155 194 242 302 124 156 194 242 146 183 229 285 162 202 253 315 160 200 250
311 2032 158 200 253 318 128 162 204 257 152 191 241 304 166 210 265 334 164 207
261 328
2033 162 207 263 334 132 168 214 272 157 200 255 323 171 218 278 353 168 214 272
346 2034 166 213 274 352 136 175 225 288 162 209 268 344 176 227 292 374 171 220
283 363
2035 169 220 286 370 140 182 236 306 167 218 283 366 181 236 306 396 175 228 296
383 2036 173 227 298 390 144 189 248 324 173 228 298 390 186 245 321 420 179 236
309 404
2037 177 235 311 410 148 197 260 343 179 238 314 415 192 254 337 444 183 243 321
424 2038 181 242 324 431 153 204 273 364 185 248 332 442 197 264 353 471 187 251
336 447
50
Table S-2 continued Projected fuel price indices with assumed general price inflation rates of 2 3 4 and 5 by end-use sector and fuel type
Census Region 2 (Illinois Indiana Iowa Kansas Michigan MinnesotaMissouri Nebraska North Dakota Ohio South Dakota Wisconsin)
Projected April 1 Fuel Price Indices (April 1 2007 = 100)
----------------------------------------------------------------INDUSTRIAL-----------------------------------------------------------------
Electricity
------------------------
Distillate Oil ------------------------
Residual Oil ------------------------
Natural Gas ------------------------
Coal ------------------------
Inflation Rate
Inflation Rate Inflation Rate Inflation Rate Inflation Rate Year 2 3 4 5 2 3 4 5 2 3 4 5 2 3 4 5 2 3
4 5
2009 106 107 108 109 093 094 094 095 110 111 112 113 105 106 107 108 102 103 104
105 2010 108 110 112 115 088 089 091 093 107 109 111 113 104 106 108 111 104 106
108 110
2011 107 110 113 117 089 092 094 097 103 106 109 112 102 105 108 111 105 108 111
115 2012 106 110 115 119 087 091 094 098 093 097 101 105 101 105 109 113 106 110
115 119
2013 105 110 116 121 085 089 094 098 089 094 098 103 099 104 109 115 107 113 118
124 2014 104 111 117 124 086 091 096 102 089 094 100 106 098 104 111 117 109 116
122 130
2015 105 113 121 129 085 091 098 105 087 093 099 106 098 105 113 121 111 119 127
136 2016 107 116 125 135 084 091 098 106 085 092 099 107 099 107 116 125 113 122
132 142
2017 110 120 131 142 085 093 102 111 085 093 102 111 102 111 121 132 115 126 137
149 2018 113 124 137 151 088 097 107 117 088 097 107 117 105 115 127 140 118 130
143 158
2019 115 128 143 158 092 103 114 127 092 103 114 127 108 120 133 148 120 134 149
166 2020 117 132 148 166 097 109 122 137 096 108 122 137 108 122 137 153 123 138
155 174
2021 118 134 152 173 099 112 127 144 100 114 129 146 108 123 139 158 125 141 160
182 2022 121 138 158 181 101 116 133 152 103 118 135 155 111 128 146 167 128 146
168 192
2023 123 143 165 191 104 120 139 161 107 124 143 166 116 134 155 179 131 152 175
202 2024 126 147 172 200 107 125 146 170 112 131 153 178 120 141 164 191 134 157
183 213
2025 128 151 178 210 110 130 154 181 116 137 162 190 125 147 174 205 137 162 191
225 2026 131 156 185 220 114 136 162 192 120 144 171 203 130 155 185 219 141 168
200 237
2027 133 160 192 231 118 142 171 205 123 149 179 214 135 162 195 234 144 173 208
249 2028 136 166 201 243 122 148 180 217 128 155 188 228 141 171 208 251 147 179
217 263
2029 140 171 210 257 126 155 190 232 132 162 198 243 147 181 221 271 151 185 227
277 2030 144 178 220 272 131 162 201 248 137 169 209 258 153 190 235 290 155 192
237 293
2031 147 184 230 286 135 169 211 263 141 177 221 275 159 199 248 309 158 197 246
307 2032 150 190 239 301 139 175 221 278 146 185 233 293 164 207 261 328 162 204
258 324
2033 153 196 249 316 143 182 232 295 151 193 246 312 169 216 274 349 166 211 269
342 2034 156 202 259 332 147 189 243 312 156 201 259 332 174 225 289 371 169 218
280 359
2035 160 208 270 349 151 197 255 331 162 210 273 353 180 234 304 393 173 225 292
378 2036 163 214 281 367 155 204 268 350 167 219 287 376 186 244 320 418 177 233
305 399
2037 166 221 292 386 160 212 281 371 173 229 303 400 192 254 337 444 181 240 318
419 2038 170 228 304 406 164 220 294 392 179 239 320 426 198 265 354 472 185 248
332 442
51
Table S-3 Projected fuel price indices with assumed general price inflation rates of 2 3 4 and 5 by end-use sector and fuel type
Census Region 3 (Alabama Arkansas Delaware District of Columbia Florida Georgia Kentucky Louisiana
Maryland Mississippi North Carolina Oklahoma South Carolina Tennessee Texas Virginia West Virginia)
Projected April 1 Fuel Price Indices (April 1 2008 = 100)
--------------------------------------------------RESIDENTIAL---------------------------------------------------
Electricity
------------------------
Distillate Oil ------------------------
LPG ------------------------
Natural Gas ------------------------
Inflation Rate
Inflation Rate Inflation Rate Inflation Rate Year 2 3 4 5 2 3 4 5 2 3 4 5 2 3 4 5 2009 105 106 107 109 091 092 093 094 099 100 101 102 102 103 104 105 2010 108 110 112 115 086 088 089 091 098 100 102 104 101 103 105 107 2011 108 112 115 118 084 087 089 092 099 101 104 107 100 103 106 109 2012 109 114 118 123 082 085 089 092 100 104 108 112 100 104 109 113 2013 111 116 122 128 080 084 088 093 101 106 111 117 101 106 111 117 2014 112 118 126 133 080 085 090 095 102 108 115 121 102 108 114 121 2015 113 121 130 139 079 084 090 096 103 111 119 127 103 110 118 126 2016 115 125 135 146 078 084 091 098 105 114 123 133 104 113 122 132 2017 118 129 141 153 078 086 093 102 108 117 128 140 107 117 128 139 2018 120 132 146 160 081 089 098 108 110 121 134 147 111 122 134 148 2019 123 137 152 169 083 093 103 114 113 125 139 155 114 127 141 157 2020 125 141 158 177 086 096 108 121 115 129 145 163 117 131 147 165 2021 128 145 164 186 088 100 113 128 117 133 150 170 119 135 153 173 2022 130 150 171 196 090 104 119 136 120 137 157 179 122 140 161 184 2023 133 154 178 206 093 108 125 144 123 142 164 189 126 146 169 195 2024 136 159 185 216 097 113 132 154 126 147 171 200 131 153 178 208 2025 139 164 193 227 100 118 139 164 129 152 179 211 135 160 188 221 2026 142 169 201 239 104 124 147 175 132 157 187 222 140 167 198 235 2027 145 174 209 251 107 129 155 186 135 162 195 234 143 173 208 249 2028 148 180 218 264 111 134 163 198 138 168 204 247 149 181 220 266 2029 151 186 227 278 115 141 172 211 142 174 214 261 155 190 233 284 2030 154 191 237 292 119 147 182 225 146 180 223 275 160 198 245 303 2031 158 197 247 307 122 153 191 238 149 187 233 291 165 206 257 321 2032 161 204 257 323 126 159 200 252 153 193 244 307 169 214 269 339 2033 165 210 267 340 129 165 210 267 157 200 255 324 173 221 282 358 2034 168 217 278 357 133 171 220 283 161 207 266 342 178 230 295 379 2035 172 223 290 375 137 178 231 299 165 215 279 361 183 238 309 400 2036 175 230 302 395 141 185 242 317 169 222 291 381 188 247 324 423 2037 179 238 314 415 145 192 254 336 173 230 305 402 193 256 339 447 2038 183 245 327 436 149 200 267 355 178 238 318 424 198 266 355 473
52
Table S-3 continued Projected fuel price indices with assumed general price inflation rates of 2 3 4 and 5 by end-use sector and fuel type
Census Region 3 (Alabama Arkansas Delaware District of Columbia Florida Georgia Kentucky LouisianaMaryland Mississippi North Carolina Oklahoma South Carolina Tennessee Texas Virginia West Virginia)
Projected April 1 Fuel Price Indices (April 1 2008 = 100)
----------------------------------------------------------------COMMERCIAL-----------------------------------------------------------------
Electricity
------------------------
Distillate Oil ------------------------
Residual Oil ------------------------
Natural Gas ------------------------
Coal ------------------------
Inflation Rate
Inflation Rate Inflation Rate Inflation Rate Inflation Rate Year 2 3 4 5 2 3 4 5 2 3 4 5 2 3 4 5 2 3
4 5
2009 105 106 107 108 093 094 094 095 116 117 119 120 104 105 106 107 103 104 105
106 2010 108 110 112 114 088 089 091 093 114 117 119 121 102 104 106 108 103 105
107 109
2011 107 110 114 117 087 090 092 095 110 114 117 120 101 104 107 110 102 105 109
112 2012 108 112 116 121 084 088 091 095 105 109 113 118 101 105 109 114 101 105
109 114
2013 108 113 119 125 082 086 090 095 100 105 111 116 101 106 112 117 101 106 111
117 2014 108 115 121 129 082 087 092 098 099 105 111 118 102 108 114 121 101 107
113 120
2015 109 117 125 134 081 087 093 099 096 102 110 117 102 109 117 125 101 108 116
124 2016 111 121 130 141 080 086 093 100 092 100 108 116 104 112 121 131 102 110
119 128
2017 114 124 136 148 081 088 096 105 093 101 110 120 107 116 127 138 103 112 123
134 2018 116 128 141 155 083 092 101 111 096 105 116 128 110 122 134 147 104 115
126 139
2019 119 132 147 163 087 097 107 119 099 111 123 137 114 127 141 156 105 117 130
145 2020 121 136 153 171 090 102 114 128 103 116 130 146 116 131 147 165 108 121
136 153
2021 123 139 158 179 093 105 119 135 106 121 137 155 118 135 153 173 110 125 141
160 2022 126 144 165 188 095 109 125 143 109 125 144 164 122 140 160 183 112 128
147 168
2023 128 148 171 198 098 114 131 152 114 132 152 175 126 146 169 195 114 132 153
177 2024 131 153 178 208 101 118 138 161 118 138 162 188 131 153 179 208 117 136
159 185
2025 134 158 186 219 105 124 146 172 123 145 171 202 135 160 188 222 118 140 165
194 2026 137 163 194 230 109 130 154 184 128 153 182 216 140 167 199 236 120 143
171 203
2027 139 168 202 242 113 136 163 195 132 158 190 228 144 173 208 250 123 148 177
213 2028 143 174 211 256 117 142 172 208 136 166 201 243 150 182 221 268 125 152
184 223
2029 146 180 220 269 121 148 182 222 141 173 212 259 156 191 234 286 128 157 192
234 2030 150 185 229 283 126 156 193 238 146 181 224 276 161 200 247 305 131 162
200 247
2031 153 191 239 298 130 162 203 253 151 189 236 294 166 208 259 323 134 168 209
261 2032 156 197 249 313 134 169 213 268 156 197 249 313 171 216 272 342 137 173
219 275
2033 160 204 259 329 138 176 223 284 162 206 263 334 175 224 285 362 140 179 227
289 2034 163 210 270 346 142 182 235 301 167 215 277 355 180 232 299 383 143 185
238 305
2035 167 217 281 364 146 190 246 319 173 225 292 378 186 241 313 406 147 191 248
321 2036 170 224 293 383 150 197 258 338 179 235 308 403 191 251 329 430 150 197
258 338
2037 174 231 305 403 155 205 271 358 185 245 325 429 196 260 344 454 154 204 270
356 2038 178 238 318 424 159 213 285 380 191 256 343 457 202 270 361 481 157 211
282 375
53
Table S-3 continued Projected fuel price indices with assumed general price inflation rates of 2 3 4 and 5 by end-use sector and fuel type
Census Region 3 (Alabama Arkansas Delaware District of Columbia Florida Georgia Kentucky LouisianaMaryland Mississippi North Carolina Oklahoma South Carolina Tennessee Texas Virginia West Virginia)
Projected April 1 Fuel Price Indices (April 1 2008 = 100)
----------------------------------------------------------------INDUSTRIAL-----------------------------------------------------------------
Electricity
------------------------
Distillate Oil ------------------------
Residual Oil ------------------------
Natural Gas ------------------------
Coal ------------------------
Inflation Rate
Inflation Rate Inflation Rate Inflation Rate Inflation Rate Year 2 3 4 5 2 3 4 5 2 3 4 5 2 3 4 5 2 3
4 5
2009 106 107 108 109 092 093 094 095 108 109 110 111 106 107 108 109 102 103 104
105 2010 107 110 112 114 087 089 091 092 103 105 107 110 105 107 109 111 101 103
105 107
2011 106 109 113 116 088 091 094 096 100 103 106 109 101 104 107 111 101 104 107
110 2012 106 110 114 119 086 090 093 097 094 097 101 105 100 104 108 112 100 104
108 112
2013 106 111 117 122 085 089 093 098 090 094 099 104 099 104 109 114 101 106 111
116 2014 106 112 119 126 085 090 096 101 088 094 099 105 098 104 110 116 102 108
114 121
2015 107 114 122 131 085 091 097 104 086 092 098 105 097 104 111 119 103 110 118
126 2016 109 118 127 137 084 090 098 105 083 090 097 105 098 106 114 123 104 112
121 131
2017 111 122 133 145 085 093 101 110 083 091 099 108 100 110 120 130 105 115 125
137 2018 113 125 138 152 087 096 106 117 086 095 104 115 104 115 126 139 107 118
130 143
2019 116 129 144 160 091 102 113 126 090 100 111 123 107 119 133 148 109 121 134
149 2020 118 133 149 167 096 108 121 136 093 105 117 132 110 123 138 155 111 125
140 157
2021 120 136 155 175 098 111 126 143 096 109 124 140 111 126 143 162 113 129 146
165 2022 123 141 161 184 101 115 132 151 099 114 130 149 115 131 150 172 116 133
152 174
2023 125 145 167 193 103 120 138 160 103 119 138 159 119 138 159 184 118 137 158
182 2024 128 149 174 203 106 124 145 169 107 126 147 171 124 144 169 197 120 141
164 191
2025 131 154 182 214 110 130 153 180 112 132 155 183 128 151 178 210 123 145 171
201 2026 134 159 190 225 114 136 161 192 116 138 165 196 133 159 189 224 125 149
178 211
2027 137 164 197 237 117 141 170 204 119 144 172 207 137 164 198 237 128 154 185
222 2028 141 171 207 251 121 147 179 217 123 150 182 221 143 174 212 256 130 158
192 233
2029 144 177 216 264 126 154 189 231 128 157 192 235 150 184 226 276 133 164 201
245 2030 147 182 225 278 131 162 200 247 132 164 202 250 156 193 239 295 137 169
209 259
2031 150 188 235 293 135 169 211 263 137 171 214 266 161 202 252 314 139 174 218
271 2032 154 194 245 308 139 175 221 278 141 179 225 284 167 211 266 334 143 180
227 286
2033 157 200 255 324 143 182 232 294 146 187 238 302 172 220 280 355 146 187 237
302 2034 161 207 266 341 147 189 243 312 151 195 251 321 178 229 294 378 149 192
247 317
2035 164 213 277 359 151 196 255 330 156 204 264 342 184 239 310 402 153 199 258
334 2036 168 220 289 378 155 204 267 350 162 213 279 364 190 250 327 428 156 205
269 352
2037 171 227 301 397 160 212 281 370 167 222 294 388 196 260 345 455 159 212 280
370 2038 175 235 314 418 164 220 294 392 173 232 310 413 203 272 363 484 163 219
292 390
------------------------ ------------------------ ------------------------ ------------------------
54
Table S-4 Projected fuel price indices with assumed general price inflation rates of 2 3 4 and 5 by end-use sector and fuel type
Census Region 4 (Alaska Arizona California Colorado HawaiiIdaho Montana Nevada New Mexico Oregon Utah Washington Wyoming)
Projected April 1 Fuel Price Indices (April 1 2008 = 100)
--------------------------------------------------RESIDENTIAL---------------------------------------------------
Electricity Distillate Oil LPG Natural Gas
Inflation Rate
Inflation Rate Inflation Rate Inflation Rate Year 2 3 4 5 2 3 4 5 2 3 4 5 2 3 4 5 2009 103 104 105 106 077 078 079 080 099 100 101 102 102 103 104 105 2010 104 106 108 110 070 071 073 074 099 101 103 105 101 103 105 107 2011 104 107 110 113 068 070 072 074 099 102 105 108 099 102 105 109 2012 104 108 112 116 068 070 073 076 100 104 109 113 100 104 108 112 2013 105 111 116 122 068 071 075 079 101 106 112 117 100 105 110 115 2014 108 114 121 128 068 072 077 081 103 109 116 122 101 107 113 120 2015 110 118 126 135 068 072 077 083 105 112 120 128 102 110 117 125 2016 113 122 132 142 067 073 079 085 106 115 124 134 104 113 122 131 2017 115 126 137 150 069 075 082 089 109 119 129 141 107 117 127 139 2018 118 130 144 158 071 079 087 095 111 122 135 148 110 121 133 146 2019 121 135 150 167 074 083 092 102 114 126 141 156 113 125 140 155 2020 124 139 156 175 077 087 097 109 115 129 145 163 114 128 144 161 2021 126 143 162 183 080 090 102 116 116 132 150 169 114 129 147 166 2022 129 148 169 193 082 094 108 123 118 136 155 178 116 133 153 175 2023 132 153 176 204 085 099 114 132 122 141 163 188 121 140 161 186 2024 135 158 184 215 089 104 121 141 125 146 171 199 125 147 171 199 2025 139 164 193 228 092 108 128 150 129 152 179 210 130 154 181 213 2026 143 170 202 240 095 114 135 161 132 158 188 223 136 162 193 229 2027 146 176 211 253 099 120 144 172 136 163 196 235 141 169 203 244 2028 149 181 220 267 103 125 152 184 139 169 206 249 146 178 215 261 2029 153 188 230 282 107 131 160 196 144 176 216 264 152 187 229 280 2030 157 194 240 296 110 136 168 208 148 183 226 279 159 197 243 300 2031 160 201 250 312 113 141 176 220 152 190 237 295 163 205 256 318 2032 164 207 262 329 116 147 185 233 155 196 248 312 168 212 268 337 2033 168 214 273 347 119 152 194 246 159 203 259 329 173 220 280 356 2034 172 222 285 366 123 158 203 261 163 211 271 347 177 229 294 377 2035 176 229 298 385 126 164 213 276 168 218 283 367 182 237 308 399 2036 180 237 311 406 130 171 224 292 172 226 296 387 187 246 323 422 2037 185 245 325 428 134 177 235 310 176 234 310 409 193 256 338 446 2038 189 254 339 452 137 184 246 328 181 242 324 431 198 265 354 472
55
Table S-4 continued Projected fuel price indices with assumed general price inflation rates of 2 3 4 and 5 by end-use sector and fuel type
Census Region 4 (Alaska Arizona California Colorado HawaiiIdaho Montana Nevada New Mexico Oregon Utah Washington Wyoming)
Projected April 1 Fuel Price Indices (April 1 2008 = 100)
----------------------------------------------------------------COMMERCIAL-----------------------------------------------------------------
Electricity
------------------------
Distillate Oil ------------------------
Residual Oil ------------------------
Natural Gas ------------------------
Coal ------------------------
Inflation Rate
Inflation Rate Inflation Rate Inflation Rate Inflation Rate Year 2 3 4 5 2 3 4 5 2 3 4 5 2 3 4 5 2 3
4 5
2009 103 104 105 106 085 086 087 087 125 127 128 129 102 103 104 105 104 105 106
107 2010 103 105 107 109 079 080 082 083 126 129 131 134 100 102 104 106 107 109
111 113
2011 101 104 108 111 077 080 082 084 122 126 129 133 099 102 105 108 108 111 114
117 2012 101 105 109 113 076 079 083 086 102 106 110 114 099 103 107 111 108 113
117 122
2013 101 106 111 116 077 080 084 089 096 101 106 111 099 104 109 115 110 115 121
127 2014 101 107 114 120 077 082 087 092 097 103 109 115 100 106 112 119 112 119
126 133
2015 103 110 117 126 077 082 088 094 096 102 110 117 102 109 116 124 114 122 130
139 2016 104 113 122 132 076 083 089 096 095 103 111 120 104 112 121 131 115 124
134 145
2017 107 116 127 138 078 085 092 101 096 105 114 125 106 116 127 138 117 128 140
152 2018 109 120 132 145 081 089 098 108 100 110 121 133 110 121 133 146 121 134
147 162
2019 111 124 138 153 085 094 105 116 106 118 132 146 113 126 140 155 125 139 155
172 2020 113 127 142 160 089 100 112 126 114 128 144 161 114 128 144 162 128 144
162 181
2021 114 129 146 166 091 104 117 133 119 135 153 173 114 129 147 166 131 148 168
190 2022 116 133 152 174 094 108 123 141 123 141 161 184 117 134 153 175 134 153
176 201
2023 118 137 158 182 097 112 130 150 128 149 172 198 121 141 162 188 138 160 184
213 2024 121 141 165 192 100 117 137 160 134 156 183 213 127 148 173 201 142 166
194 226
2025 124 147 173 203 104 122 144 170 139 164 193 228 132 156 184 216 145 172 202
238 2026 127 152 181 215 108 129 153 182 144 172 205 243 138 165 196 233 150 178
212 252
2027 130 157 188 226 112 135 162 194 148 179 214 257 143 172 207 248 154 185 223
267 2028 134 162 197 239 116 141 171 207 153 187 226 274 149 181 220 267 158 192
233 282
2029 137 168 206 252 120 147 180 221 158 194 238 291 156 192 235 287 162 199 243
297 2030 140 174 215 265 124 154 190 234 164 203 251 310 163 202 250 308 165 205
253 312
2031 143 179 224 279 127 160 199 248 169 212 265 330 168 211 263 328 169 212 264
329 2032 146 185 233 294 131 166 209 263 175 221 279 351 173 219 276 347 173 219
276 347
2033 150 191 243 309 135 172 219 279 181 231 294 374 178 227 289 367 177 225 287
365 2034 153 197 254 325 139 179 230 295 187 241 310 398 183 236 303 389 181 233
300 385
2035 156 204 264 342 143 186 241 312 193 252 327 423 188 245 318 411 185 241 313
406 2036 160 210 275 360 147 193 253 331 200 263 345 451 193 254 333 436 189 249
326 426
2037 164 217 287 379 151 201 266 350 207 274 363 479 199 264 349 461 194 257 340
449 2038 167 224 299 399 156 209 279 371 214 286 383 510 205 274 366 488 199 266
356 474
56
Table S-4 continued Projected fuel price indices with assumed general price inflation rates of 2 3 4 and 5 by end-use sector and fuel type
Census Region 4 (Alaska Arizona California Colorado HawaiiIdaho Montana Nevada New Mexico Oregon Utah Washington Wyoming)
Projected April 1 Fuel Price Indices (April 1 2008 = 100)
----------------------------------------------------------------INDUSTRIAL-----------------------------------------------------------------
Electricity
------------------------
Distillate Oil ------------------------
Residual Oil ------------------------
Natural Gas ------------------------
Coal ------------------------
Inflation Rate
Inflation Rate Inflation Rate Inflation Rate Inflation Rate Year 2 3 4 5 2 3 4 5 2 3 4 5 2 3 4 5 2 3
4 5
2009 103 104 106 107 086 087 088 089 127 129 130 131 103 104 105 106 103 104 105
106 2010 104 106 108 110 080 082 084 085 129 132 134 137 100 102 104 106 105 107
109 111
2011 103 106 109 112 080 083 085 087 125 129 132 136 097 100 103 106 105 108 111
115 2012 102 106 111 115 079 083 086 089 105 109 113 118 096 099 103 107 106 110
114 119
2013 102 107 113 118 080 084 088 092 099 104 109 114 094 099 103 108 107 113 118
124 2014 103 109 116 123 081 086 091 096 100 106 112 119 093 099 105 111 110 116
123 130
2015 105 112 120 128 080 086 092 099 098 105 113 120 094 100 107 115 111 119 127
136 2016 107 116 125 135 080 087 094 101 098 106 114 123 095 102 110 119 112 121
131 141
2017 109 119 130 142 081 089 097 106 099 108 118 128 097 106 115 126 114 125 136
148 2018 112 123 135 149 084 093 102 113 102 113 124 137 099 109 120 132 117 129
142 156
2019 114 127 141 157 089 099 110 122 109 122 135 150 102 113 126 140 120 133 148
165 2020 116 130 146 164 094 105 118 133 117 131 148 166 102 115 129 145 123 138
155 174
2021 117 133 151 171 096 109 123 140 122 139 157 178 100 114 129 146 125 142 161
183 2022 119 137 157 179 098 113 129 148 126 145 165 189 101 116 133 152 128 147
169 193
2023 122 141 163 188 101 117 135 156 132 152 176 203 106 122 141 163 132 153 177
204 2024 125 146 170 199 104 122 142 165 137 160 187 218 111 130 151 177 136 159
186 216
2025 129 152 179 210 107 127 149 176 143 169 199 234 116 138 162 191 139 165 194
228 2026 132 157 187 222 111 133 158 188 148 177 210 250 123 146 174 207 143 170
203 241
2027 135 162 195 234 115 139 167 200 152 183 220 264 128 154 185 222 146 176 212
254 2028 138 168 204 247 119 145 175 212 158 192 232 281 134 163 198 239 150 182
221 268
2029 142 175 214 261 123 151 185 226 163 200 244 299 141 173 212 260 154 189 232
284 2030 145 180 223 275 127 158 195 241 168 208 258 318 148 184 227 281 157 195
241 298
2031 149 186 232 289 131 164 205 255 174 218 272 339 154 193 240 300 161 202 252
314 2032 152 192 242 305 135 170 215 270 180 227 287 361 159 201 254 319 164 208
262 330
2033 156 199 253 321 139 177 225 286 186 237 302 384 164 210 267 339 168 215 274
348 2034 159 205 264 338 142 184 236 303 192 248 319 409 170 219 281 360 173 222
286 367
2035 163 212 275 356 147 191 248 321 199 259 336 435 175 228 296 384 176 229 297
385 2036 167 219 287 375 151 198 260 339 206 270 354 463 181 238 312 408 180 237
311 406
2037 171 226 300 395 155 206 272 359 212 282 373 492 187 248 328 434 185 245 324
428 2038 175 234 312 416 159 214 285 380 220 294 393 524 194 259 346 462 188 252
337 450
57
Table S-5 Projected fuel price indices with assumed general price inflation rates of 2 3 4 and 5 by end-use sector and fuel type
United States Average
Projected April 1 Fuel Price Indices (April 1 2008 = 100)
--------------------------------------------------RESIDENTIAL---------------------------------------------------
Electricity
------------------------
Distillate Oil ------------------------
LPG ------------------------
Natural Gas ------------------------
Inflation Rate
Inflation Rate Inflation Rate Inflation Rate Year 2 3 4 5 2 3 4 5 2 3 4 5 2 3 4 5 2009 105 106 107 108 090 091 092 093 101 102 102 103 102 103 104 105 2010 107 109 111 113 085 087 088 090 100 102 104 106 101 103 105 107 2011 107 110 114 117 083 086 088 091 101 104 107 110 100 103 106 109 2012 108 112 117 121 081 085 088 091 102 106 110 115 101 105 109 113 2013 110 115 121 127 079 083 088 092 103 108 114 119 101 106 111 116 2014 111 118 125 132 079 084 089 094 104 111 117 124 101 107 114 120 2015 113 121 129 138 078 083 089 095 106 113 121 130 102 109 117 125 2016 115 124 134 145 077 083 090 097 108 116 126 136 104 112 121 131 2017 118 129 140 153 078 085 093 101 110 120 131 143 107 116 127 138 2018 120 133 146 161 080 088 097 107 113 124 137 150 110 121 133 146 2019 123 137 152 169 083 092 102 114 115 128 142 158 113 126 140 155 2020 125 141 158 177 085 096 107 120 117 132 148 166 115 129 145 162 2021 127 145 164 186 087 099 112 127 119 135 153 173 116 132 149 169 2022 130 149 171 195 090 103 118 135 122 139 160 182 119 137 156 179 2023 133 154 178 205 093 107 124 143 125 144 167 193 123 142 165 190 2024 136 159 185 216 096 112 131 153 128 149 174 203 127 149 174 203 2025 139 164 193 227 099 117 138 163 131 155 182 215 132 156 184 216 2026 142 169 201 239 103 123 146 174 135 160 191 227 137 163 194 231 2027 145 174 209 251 106 128 154 185 138 166 199 239 141 170 204 244 2028 148 180 218 264 110 134 162 196 142 172 209 253 146 178 216 261 2029 151 186 228 278 114 140 171 210 146 179 219 268 152 187 229 279 2030 155 192 237 293 118 146 181 223 149 185 229 283 158 195 241 298 2031 158 198 247 308 122 152 190 237 153 192 239 298 162 203 254 316 2032 162 204 258 324 125 158 199 251 157 198 250 315 167 211 265 334 2033 165 211 269 341 129 164 209 265 161 205 262 332 171 218 278 353 2034 169 218 280 359 132 170 219 281 165 213 274 351 176 226 291 373 2035 173 225 292 377 136 177 230 298 169 220 286 370 181 235 305 395 2036 176 232 304 397 140 184 241 315 174 228 299 391 186 244 320 418 2037 180 239 316 418 144 191 253 334 178 236 313 413 191 253 335 442 2038 184 247 330 439 148 199 265 353 183 245 327 436 196 263 351 467
58
Table S-5 continued Projected fuel price indices with assumed general price inflation rates of 2 3 4 and 5 by end-use sector and fuel type
United States Average
Projected April 1 Fuel Price Indices (April 1 2008 = 100)
----------------------------------------------------------------COMMERCIAL-----------------------------------------------------------------
Electricity
------------------------
Distillate Oil ------------------------
Residual Oil ------------------------
Natural Gas ------------------------
Coal ------------------------
Inflation Rate
Inflation Rate Inflation Rate Inflation Rate Inflation Rate Year 2 3 4 5 2 3 4 5 2 3 4 5 2 3 4 5 2 3
4 5
2009 104 105 106 107 092 093 094 095 104 105 106 107 103 104 105 106 104 105 106
107 2010 105 107 110 112 087 089 090 092 100 101 103 105 101 103 106 108 105 107
109 111
2011 105 108 111 114 086 089 091 094 097 100 103 106 100 103 106 109 106 109 112
115 2012 105 109 113 118 084 087 091 094 094 098 102 106 100 104 108 112 106 110
115 119
2013 105 110 115 121 082 086 090 095 092 097 101 106 100 105 110 116 107 113 118
124 2014 105 111 118 125 082 087 092 098 090 095 101 107 100 106 113 120 108 115
122 129
2015 106 114 122 130 081 087 093 099 087 093 100 107 101 108 116 124 110 117 125
134 2016 108 117 126 136 080 086 093 101 084 091 098 106 103 111 120 130 111 120
129 140
2017 111 121 132 144 081 088 096 105 085 093 101 110 106 115 126 137 112 122 133
145 2018 113 125 137 151 083 092 101 111 088 097 107 117 109 120 132 146 114 126
139 153
2019 116 129 143 159 087 097 108 120 091 101 113 125 112 125 139 155 116 129 144
159 2020 118 132 149 167 091 102 115 129 094 106 119 134 114 129 144 162 119 134
150 168
2021 119 135 153 174 093 106 120 135 098 111 126 142 116 131 149 169 121 138 156
177 2022 122 140 160 183 095 109 125 143 101 116 133 152 119 137 156 179 124 142
163 186
2023 124 144 166 192 098 114 132 152 105 122 140 162 123 143 165 190 127 147 169
196 2024 127 149 173 202 102 119 139 161 109 127 149 173 128 150 175 203 129 151
176 205
2025 130 153 181 213 105 124 146 172 113 133 157 185 133 157 185 217 132 156 184
217 2026 133 158 189 224 109 130 155 184 117 139 166 197 138 164 196 232 135 161
191 227
2027 136 163 196 236 113 136 163 196 120 144 173 207 142 171 206 247 138 166 200
240 2028 139 169 205 249 117 142 172 208 124 151 183 221 148 180 218 264 142 172
209 253
2029 143 175 215 262 121 149 182 222 129 158 194 237 154 189 232 283 145 177 217
266 2030 146 181 224 276 126 156 192 238 134 165 205 253 160 198 245 303 148 184
227 280
2031 150 187 234 292 129 162 202 252 138 173 216 269 165 206 258 321 152 190 237
295 2032 153 194 244 307 133 168 212 267 143 181 228 287 169 214 270 340 155 196
247 310
2033 157 200 255 323 137 175 223 283 148 189 241 306 174 222 283 360 159 202 258
327 2034 160 206 265 340 141 182 234 300 153 198 254 326 179 231 297 380 162 209
269 345
2035 164 213 277 358 145 189 245 318 159 206 268 347 184 240 311 403 166 216 280
362 2036 167 220 288 377 150 197 258 337 164 216 283 370 189 249 326 427 170 223
292 382
2037 171 227 301 397 154 204 270 357 170 225 298 394 195 259 342 452 174 231 305
403 2038 175 234 313 418 158 212 284 378 176 236 315 420 200 269 359 478 177 238
317 423
59
Table S-5 continued Projected fuel price indices with assumed general price inflation rates of 2 3 4 and 5 by end-use sector and fuel type
United States Average
Projected April 1 Fuel Price Indices (April 1 2008 = 100)
----------------------------------------------------------------INDUSTRIAL-----------------------------------------------------------------
Electricity
------------------------
Distillate Oil ------------------------
Residual Oil ------------------------
Natural Gas ------------------------
Coal ------------------------
Inflation Rate
Inflation Rate Inflation Rate Inflation Rate Inflation Rate Year 2 3 4 5 2 3 4 5 2 3 4 5 2 3 4 5 2 3
4 5
2009 105 106 107 108 091 092 093 094 107 108 109 110 105 106 107 108 102 103 104
105 2010 106 108 110 112 086 087 089 091 103 105 107 109 104 106 108 110 102 104
106 108
2011 105 108 111 114 087 089 092 095 100 103 106 109 101 104 107 110 103 106 109
112 2012 104 108 112 117 085 088 092 096 094 098 101 105 100 104 108 112 103 108
112 116
2013 104 109 114 120 084 088 092 097 090 095 099 104 098 103 108 114 105 110 115
121 2014 103 110 116 123 084 089 095 100 089 094 100 106 097 103 109 116 106 112
119 126
2015 104 112 120 128 084 090 096 103 086 092 099 106 097 104 111 119 107 115 123
132 2016 106 115 124 134 083 090 097 105 084 090 098 105 098 106 114 123 109 117
127 137
2017 109 119 130 141 084 092 100 109 084 092 100 109 100 109 119 130 111 121 132
144 2018 111 123 135 149 087 096 105 116 087 096 105 116 103 114 126 138 113 124
137 150
2019 114 127 141 157 091 101 113 125 090 101 112 124 107 119 132 147 115 128 142
158 2020 116 130 146 164 096 108 121 136 094 106 119 133 108 121 136 153 117 132
148 166
2021 117 133 151 171 098 111 126 142 097 110 125 142 108 123 139 158 119 136 154
174 2022 119 137 157 179 100 115 132 151 100 115 132 151 111 128 146 167 122 140
161 184
2023 122 141 163 189 103 119 138 159 104 121 139 161 115 134 155 178 125 145 168
194 2024 125 146 170 198 106 124 144 168 108 127 148 172 120 141 164 191 128 149
174 203
2025 128 151 178 209 110 129 152 179 113 133 157 184 125 147 174 204 130 154 181
213 2026 130 156 185 220 113 135 161 191 117 139 166 197 130 155 185 219 134 159
189 225
2027 133 160 193 231 117 141 170 203 120 144 173 208 134 161 194 233 136 164 197
236 2028 137 166 202 244 121 147 179 216 124 151 183 222 140 171 207 251 140 170
206 249
2029 140 172 211 258 125 154 189 230 128 157 193 236 147 180 221 270 142 175 214
262 2030 144 178 220 272 130 161 200 246 133 165 204 252 153 190 235 290 146 181
224 276
2031 147 184 230 286 134 168 210 261 138 172 215 268 159 198 248 309 149 187 233
291 2032 150 190 240 302 138 174 220 276 142 180 227 285 164 207 261 329 153 193
244 307
2033 154 196 250 317 142 181 230 293 147 188 239 304 169 216 275 349 156 199 254
322 2034 157 203 261 334 146 188 242 310 152 196 252 324 175 225 290 372 160 206
265 340
2035 161 209 272 352 150 195 254 328 158 205 266 345 180 235 305 395 164 213 277
358 2036 164 216 283 370 154 203 266 348 163 214 280 367 186 245 321 420 167 220
288 376
2037 168 223 295 389 159 211 279 368 168 224 296 391 193 256 338 446 171 227 301
397 2038 172 230 308 410 163 219 292 390 174 234 312 416 199 267 356 475 175 234
313 416
- NISTIR 85-3273-23
- ABSTRACT
- PREFACE
- ACKNOWLEDGMENTS
- CONTENTS
- LIST OF TABLES
- ABBREVIATIONS
- INTRODUCTION
- PART I TABLES FOR FEDERAL LIFE-CYCLE COST ANALYSIS
- PART II ENERGY PRICE INDICES FOR PRIVATE SECTOR LCC ANALYSIS
-

NISTIR 85-3273-23
ENERGY PRICE INDICES AND DISCOUNT FACTORS FOR LIFE-CYCLE COST ANALYSIS Annual Supplement to NIST Handbook 135 and NBS Special Publication 709
April 1 2008 to March 31 2009 Data for the Federal Methodology for Life-Cycle Cost Analysis Title 10 CFR Part 436 Subpart A and for the Energy Conservation Mandatory Performance Standards for New Federal Residential Buildings Title 10 CFR Part 435
Amy S Rushing Barbara C Lippiatt
Sponsored by
US Department of Energy Federal Energy Management Program Washington DC 20585
May 2008
US DEPARTMENT OF COMMERCE Carlos M Gutierrez Secretary
NATIONAL INSTITUTE OF STANDARDS AND TECHNOLOGY James M Turner Deputy Director
US Department of Commerce Office of Applied Economics Technology Administration Building and Fire Research Laboratory National Institute of Standards and Technology Gaithersburg MD 20899
ABSTRACT
This is the April 2008 edition of energy price indices and discount factors for performing life-cycle cost analyses of energy and water conservation and renewable energy projects in federal facilities It will be effective from April 1 2008 to March 31 2009 This publication supports the federal life-cycle costing methodology described in 10 CFR 436A and OMB Circular A-94 by updating the energy price projections and discount factors that are described explained and illustrated in NIST Handbook 135 (HB 135 Life-Cycle Costing Manual for the Federal Energy Management Program) It supports private-sector life-cycle cost analysis by updating the energy price indices that are described explained and illustrated in NBS Special Publication 709 (SP 709)
Disclaimer Certain trade names or company products are mentioned in the text to specify adequately the software and operating systems used for performing the life-cycle cost analyses In no case does such identification imply recommendation or endorsement by the National Institute of Standards and Technology nor does it imply that the software and operating systems are the best available for the purpose
iii
PREFACE
This is the April 2008 Annual Supplement to NIST Handbook 135 Life-Cycle Costing Manual for the Federal Energy Management Program (FEMP) The annual supplement provides energy price indices and discount factors for use with the Federal Energy Management Programs procedures for life-cycle cost analysis as established by the US Department of Energy (DOE) in Subpart A of Part 436 of Title 10 of the Code of Federal Regulations (10 CFR 436A) and amplified in NIST Handbook 135 These indices and factors are provided as an aid to implementing life-cycle cost evaluations of potential energy and water conservation and renewable energy investments in existing and new federally owned and leased buildings
The update of the Annual Supplement to Handbook 135 is released on April 1 of each year Its price indices and discount factors are calculated with the most recent energy price projections from DOErsquos Energy Information Administration (EIA) and the most recent discount rates from FEMP and the Office of Management and Budget (OMB) Circular A-94 This issue of the Annual Supplement is intended for use from April 1 2008 to March 31 2009 The updated editions of the NIST Building Life-Cycle Cost (BLCC) programs are released at the same time as this Annual Supplement for use over the same time period The software products are discussed below
At the request of a number of users a text file of the EIA energy price projections underlying this Annual Supplement has been made available by NIST For information on obtaining this file (ENCOST08txt) contact the authors via e-mail at blippiattnistgov or amyrushingnistgov
The life-cycle costing methods and procedures as set forth in 10 CFR 436A are to be followed by all federal agencies unless specifically exempted for evaluating the cost effectiveness of potential energy and water conservation and renewable energy investments in federally owned and leased buildings For most other federal LCC analyses OMB Circular A-94 provides the relevant guidelines
As called for by legislation (Energy Policy and Conservation Act PL94-163 1975 92 Stat 3206 42 USC 8252 et seq) the National Institute of Standards and Technology has provided technical assistance to the US Department of Energy in the development and implementation of life-cycle costing methods and procedures This is the second of a three-volume set which together provide the methods data and computational tools for federal life-cycle cost analysis
Included in the three-volume set for federal life-cycle cost analysis are the following
(1) Life-Cycle Costing Manual for the Federal Energy Management Program National Institute of Standards and Technology Handbook 135 (1995)
The manual is a guide to understanding life-cycle costing and related methods of economic analysis as they are applied to federal decisions especially those subject to 10 CFR 436A rules It describes the required procedures and assumptions defines and explains how to apply and interpret economic performance measures gives examples of federal decision problems and their solutions explains how to use energy price indices and discount factors and provides worksheets and other computational aids and instructions for calculating the required measures The 1995 edition of Handbook 135 is a complete revision of the 1987 edition with updated information on the FEMP LCC requirements of 10 CFR 436A
iv
(2) Energy Price Indices and Discount Factors for Life-Cycle Cost Analysis Annual Supplement to NIST Handbook 135 and NBS Special Publication 709 National Institute of Standards and Technology NISTIR 85-3273
This report which is updated annually provides the current DOE and OMB discount rates projected energy price indices and corresponding discount factors needed to estimate the present values of future energy and non-energy-related project costs Request the latest edition when ordering (This is the report that you are holding in your hands)
(3) NIST Building Life-Cycle Cost (BLCC) Computer Programs BLCC5 and BLCC4 National Institute of Standards and Technology These programs use as default values the same discount factors and energy price projections that underlie the discount factor tables in the Annual Supplement Use versions BLCC 53-08 and BLCC 49-08 for the period from April 1 2008 to March 31 2009
The BLCC5 program is a windowed version of the DOS-based BLCC4 It is available for Windows Mac OS X and Linux
The BLCC5 Userrsquos Guide is part of its Help system BLCC 53 has six modules all of them consistent with the life-cycle cost methodology of 10 CFR 436A but programmed to include default inputs and nomenclature for specific uses
(1) FEMP Analysis Energy Project for energy and water conservation and renewable energy projects under the FEMP rules agency-funded
(2) Federal Analysis Financed Project for federal projects financed through Energy Savings Performance Contracts (ESPC) or Utility Energy Services Contracts (UESC) as authorized by Executive Order 13123 (699)
(3) OMB Analysis Federal Analysis Projects subject to OMB Circular A-94 for projects subject to OMB Circular A-94 (most other non-energy federal government construction projects but not water resource projects)
(4) MILCON Analysis Energy Project for energy and water conservation and renewable energy projects in military construction agency-funded
(5) MILCON Analysis ECIP Project for energy and water conservation projects under the Energy Conservation Investment Program (ECIP)
(6) MILCON Analysis Non-Energy Project for military construction designs that are not primarily for energy or water conservation
v
The BLCC4 program is designed to run on IBM PC and compatible microcomputers in a MS-DOS environment The current version is BLCC 49-08 BLCC4-associated programs are the following
bull QuickBLCC (version 29-08) can be used to set up multiple project alternatives for LCC analysis in a single input file when only a limited number of inputs are needed
bull DISCOUNT (version 39-08) is a stand-alone program that computes present-value future-value and annual-value factors for any discount rate and study period including UPV factors needed for federal LCC analyses of energy projects
bull ERATES (version 111) is a stand-alone program that generates block-rate time-of-use-rate and demand-rate schedules for electricity prices It computes monthly and annual electricity costs that can be imported directly into BLCC4 and entered manually into BLCC5
bull EMISS (version 100) is a stand-alone program that generates files of local air-pollution emission coefficients for use with the BLCC4 program
The set of LCC programs also includes bull EERC 10-08 Energy Escalation Rate Calculator a program that computes an average rate of
escalation for a specified time period based on the DOE energy price escalation rates used for calculating the FEMP discount factors This average rate can be used as an escalation rate for contract payments in Energy Savings Performance Contracts (ESPC) and Utility Energy Services Contracts (UESC)
The NIST BLCC programs provide comprehensive economic analysis capabilities for the evaluation of proposed capital investments that are expected to reduce the long-term operating costs of buildings and building systems They compute the LCC for project alternatives compare project alternatives in order to determine which has the lowest LCC perform annual cash flow analysis and compute net savings (NS) savings-to-investment ratio (SIR) and adjusted internal rate of return (AIRR) for project alternatives over their designated study period The BLCC programs can be used to perform economic analysis of capital investment projects undertaken by federal state and local government agencies as well as by the private sector (BLCC4) In their application to federal energy conservation and renewable energy projects BLCC5 and BLCC4 are consistent with NIST Handbook 135 and the federal life-cycle cost methodology and procedures described in 10 CFR 436A and OMB Circular A-94 In their application to private-sector and non-federal public-sector projects they are consistent with ASTM standards for building economics
The US Department of Energy was directed by legislation and executive order to make available to the private sector the methods procedures and related aids developed for federal use In response to this directive the National Institute of Standards and Technology under sponsorship of the US Department of Energy published a life-cycle costing book for use by the private sector entitled Comprehensive Guide for Least-Cost Energy Decisions NBS SP 709 (January 1987) The private sector guide is supported by the data provided here as well as by the BLCC4 computer program The BLCC4 program supersedes the NBSLCC program that is documented in SP 709
The latest versions of the programs and publications described above can be downloaded from the DOEFEMP web site at httpwww1eereenergygovfempprogramlifecyclehtml
To request hard copies of the above publications please call the Energy Efficiency and Renewable Energy (EERE) Information Center 1-877-EERE-INF (1-877-337-3463)
vi
In some years depending on funding availability NIST under the sponsorship of DOE conducts three workshops
The two-day Basic LCC Workshop explains the underlying theory of present-value analysis and integrates it with the FEMP criteria The two-day Project-Oriented LCC Workshop builds on the Basic Workshop focuses on the use of the BLCC computer programs and applies the LCC methodology to more complex issues Further information is available from the EERE Information Center or the DOEFEMP web site The third workshop is a two-hour televised course that introduces the elements of life-cycle cost analysis of energy and water conservation projects
FEMP-Qualified Instructors are available to conduct LCC workshops on their own account across the US For a list of instructors e-mail blippiattnistgov
Three video training films in a series entitled Least-Cost Energy Decisions for Buildings have been prepared by NIST These films include Introduction to Life-Cycle Costing Uncertainty and Risk and Choosing Economic Evaluation Methods The video films and companion workbooks can be ordered from
Video Transfer Inc 5800 Arundel Avenue Rockville MD 20852 301-881-0270
For further information on the Federal Energy Management Program please visit httpwww1eereenergygovfemp
vii
ACKNOWLEDGMENTS
The authors wish to thank Cyrus Nasseri of the Federal Energy Management Program US Department of Energy (DOE) for his support and direction of this work Appreciation is extended to Paul Kondis and Paul Holtberg of the DOE Energy Information Administration for providing the energy price projections upon which this report is based Thanks are also due to Stephen Petersen and Sieglinde Fuller who originated this publication and to Carmen Pardo for her assistance in producing this document
viii
CONTENTS
Page
ABSTRACT iii
PREFACE iv
ACKNOWLEDGMENTS viii
LIST OF TABLESx
ABBREVIATIONS xiii
INTRODUCTION 1
PART I TABLES FOR FEDERAL LIFE-CYCLE COST ANALYSIS 3
A Single Present Value and Uniform Present Value Factors for Non-Fuel Costs 3
B Modified Uniform Present Value Factors for Fuel Costs 11 B1 FEMP Modified Uniform Present Value Factors14 B2 OMB Modified Uniform Present Value Factors 20
C Projected Average Fuel Price Indices and Escalation Rates (Real)26
PART II ENERGY PRICE INDICES FOR PRIVATE SECTOR LCC ANALYSIS43
ix
LIST OF TABLES Page
A-1 SPV factors for finding the present value of future single costs (non-fuel) 6
A-2 UPV factors for finding the present value of future annually recurring uniform costs (non-fuel) 7
A-3a UPV factors for finding the present value of annually recurring costs changing at a constant escalation rate DOE discount rate (30 )8
A-3b UPV factors for finding the present value of annually recurring costs changing at a constant escalation rate OMB short-term discount rate (24 ) 9
A-3c UPV factors for finding the present value of annually recurring costs changing at a constant escalation rate OMB long-term discount rate (28 ) 10
Ba-1 FEMP UPV discount factors adjusted for fuel price escalation by end-use sector and fuel type Discount Rate = 30 (DOE) Census Region 1 (Connecticut Maine Massachusetts New Hampshire New Jersey New York Pennsylvania Rhode Island Vermont) 15
Ba-2 FEMP UPV discount factors adjusted for fuel price escalation by end-use sector and fuel type Discount Rate = 30 (DOE) Census Region 2 (Illinois Indiana Iowa Kansas Michigan Minnesota Missouri Nebraska North Dakota Ohio South Dakota Wisconsin) 16
Ba-3 FEMP UPV discount factors adjusted for fuel price escalation by end-use sector and fuel type Discount Rate = 30 (DOE) Census Region 3 (Alabama Arkansas Delaware District of Columbia Florida Georgia Kentucky Louisiana Maryland Mississippi North Carolina Oklahoma South Carolina Tennessee Texas Virginia West Virginia)17
Ba-4 FEMP UPV discount factors adjusted for fuel price escalation by end-use sector and fuel type Discount Rate = 30 (DOE) Census Region 4 (Alaska Arizona California Colorado Hawaii Idaho Montana Nevada New Mexico Oregon Utah Washington Wyoming) 18
Ba-5 FEMP UPV discount factors adjusted for fuel price escalation by end-use sector and fuel type Discount Rate = 30 (DOE) United States Average 19
Bb-1 OMB UPV discount factors adjusted for fuel price escalation by end-use sector and fuel type Discount Rate = 24 (years 1 to 10) and 28 (years 11 to 30) (OMB Circular A-94) Census Region 1 (Connecticut Maine Massachusetts New Hampshire New Jersey New York Pennsylvania Rhode Island Vermont)21
x
LIST OF TABLES (continued) Page
Bb-2 OMB UPV discount factors adjusted for fuel price escalation by end-use sector and fuel type Discount Rate = 24 (years 1 to 10) and 28 (years 11 to 30) (OMB Circular A-94) Census Region 2 (Illinois Indiana Iowa Kansas Michigan Minnesota Missouri Nebraska North Dakota Ohio South Dakota Wisconsin) 22
Bb-3 OMB UPV discount factors adjusted for fuel price escalation by end-use sector and fuel type Discount Rate = 24 (years 1 to 10) and 28 (years 11 to 30) (OMB Circular A-94) Census Region 3 (Alabama Arkansas Delaware District of Columbia Florida Georgia Kentucky Louisiana Maryland Mississippi North Carolina Oklahoma South Carolina Tennessee Texas Virginia West Virginia)23
Bb-4 OMB UPV discount factors adjusted for fuel price escalation by end-use sector and fuel type Discount Rate = 24 (years 1 to 10) and 28 (years 11 to 30) (OMB Circular A-94) Census Region 4 (Alaska Arizona California Colorado Hawaii Idaho Montana Nevada New Mexico Oregon Utah Washington Wyoming)24
Bb-5 OMB UPV discount factors adjusted for fuel price escalation by end-use sector and fuel type Discount Rate = 24 (years 1 to 10) and 28 (years 11 to 30) (OMB Circular A-94) United States Average25
Ca-1 Projected fuel price indices (excluding general inflation) by end-use sector and fuel type Census Region 1 (Connecticut Maine Massachusetts New Hampshire New Jersey New York Pennsylvania Rhode Island Vermont)28
Ca-2 Projected fuel price indices (excluding general inflation) by end-use sector and fuel type Census Region 2 (Illinois Indiana Iowa Kansas Michigan Minnesota Missouri Nebraska North Dakota Ohio South Dakota Wisconsin) 30
Ca-3 Projected fuel price indices (excluding general inflation) by end-use sector and fuel type Census Region 3 (Alabama Arkansas Delaware District of Columbia Florida Georgia Kentucky Louisiana Maryland Mississippi North Carolina Oklahoma South Carolina Tennessee Texas Virginia West Virginia) 32
Ca-4 Projected fuel price indices (excluding general inflation) by end-use sector and fuel type Census Region 4 (Alaska Arizona California Colorado Hawaii Idaho Montana Nevada New Mexico Oregon Utah Washington Wyoming) 34
Ca-5 Projected fuel price indices (excluding general inflation) by end-use sector and fuel type United States Average36
Cb-1 Projected average fuel price escalation rates (excluding general price inflation) by end-use sector and fuel type Census Region 1 (Connecticut Maine Massachusetts New Hampshire New Jersey New York Pennsylvania Rhode Island Vermont) 38
xi
LIST OF TABLES (continued) Page
Cb-2 Projected average fuel price escalation rates (excluding general price inflation) by end-use sector and fuel type Census Region 2 (Illinois Indiana Iowa Kansas Michigan Minnesota Missouri Nebraska North Dakota Ohio South Dakota Wisconsin) 39
Cb-3 Projected average fuel price escalation rates (excluding general price inflation) by end-use sector and fuel type Census Region 3 (Alabama Arkansas Delaware District of Columbia Florida Georgia Kentucky Louisiana Maryland Mississippi North Carolina Oklahoma South Carolina Tennessee Texas Virginia West Virginia)40
Cb-4 Projected average fuel price escalation rates (excluding general price inflation) by end-use sector and fuel type Census Region 4 (Alaska Arizona California Colorado Hawaii Idaho Montana Nevada New Mexico Oregon Utah Washington Wyoming) 41
Cb-5 Projected average fuel price escalation rates (excluding general price inflation) by end-use sector and fuel type United States Average 42
S-1 Projected fuel price indices with assumed general price inflation rates of 2 3 4 and 5 by end-use sector and fuel type Census Region 1 (Connecticut Maine Massachusetts New Hampshire New Jersey New York Pennsylvania Rhode Island Vermont) 45
S-2 Projected fuel price indices with assumed general price inflation rates of 2 3 4 and 5 by end-use sector and fuel type Census Region 2 (Illinois Indiana Iowa Kansas Michigan Minnesota Nebraska North Dakota Ohio South Dakota Wisconsin) 48
S-3 Projected fuel price indices with assumed general price inflation rates of 2 3 4 and 5 by end-use sector and fuel type Census Region 3 (Alabama Arkansas Delaware District of Columbia Florida Georgia Kentucky Louisiana Maryland Mississippi North Carolina Oklahoma South Carolina Tennessee Texas Virginia West Virginia)51
S-4 Projected fuel price indices with assumed general price inflation rates of 2 3 4 and 5 by end-use sector and fuel type Census Region 4 (Alaska Arizona California Colorado Hawaii Idaho Montana Nevada New Mexico Oregon Utah Washington Wyoming) 54
S-5 Projected fuel price indices with assumed general price inflation rates of 2 3 4 and 5 by end-use sector and fuel type United States Averagehelliphelliphelliphelliphellip57
xii
ABBREVIATIONS
A - Annual amount A0 - Annual amount at base-date prices AEO2008 - Annual Energy Outlook 2008 (DOE-EIA publication) ASTM - American Society for Testing and Materials BLCC - NIST Building Life Cycle Cost computer program COAL - Coal d - discount rate DIST - Distillate Oil DOE - US Department of Energy e - price escalation rate (annual rate of price change) EIA - Energy Information Administration (DOE) ELEC - Electricity ESPC - Energy Savings Performance Contract FEMP - Federal Energy Management Program FY - Fiscal Year GASLN - Gasoline LCC - Life-Cycle Cost LPG - Liquefied petroleum gas N - Number of discount periods (in years) NEMS - National Energy Modeling System NIST - National Institute of Standards and Technology NTGAS - Natural Gas OMB - Office of Management and Budget RESID - Residual Oil SPV - Single Present Value (factor) UESC - Utility Energy Services Contract UPV - Uniform Present Value (factor) UPV - Modified Uniform Present Value (factor)
xiii
INTRODUCTION
This report provides tables of present-value factors for use in the life-cycle cost analysis of capital investment projects for federal facilities It also provides energy price indices based on Department of Energy (DOE) forecasts from 2008 to 2038 The factors and indices presented in this report are useful for determining the present value of future project-related costs especially those related to operational energy costs Discount factors included in this report are based on two different federal sources (1) the DOE discount rate for projects related to energy conservation renewable energy resources and water conservation and (2) Office of Management and Budget (OMB) discount rates from Circular A-94 for use with most other capital investment projects in federal facilities
The DOE discount and inflation rates for 2008 are as follows
Real rate (excluding general price inflation) 30 Nominal rate (including general price inflation) 49 Implied long-term average rate of inflation 18
The DOE nominal discount rate is based on long-term Treasury bond rates averaged over the 12 months prior to the preparation of this report The nominal or market rate is converted to a real rate to correspond with the constant-dollar analysis approach used in most federal life-cycle cost (LCC) analyses The method for calculating the real discount rate from the nominal discount rate is described in 10 CFR 436 and uses the projected rate of general inflation published in the most recent Report of the Presidentrsquos Economic Advisors Analytical Perspectives The procedure would result in a discount rate for 2008 lower than the 30 floor prescribed in 10 CFR 436 Thus the 30 floor is used as the real discount rate for FEMP analyses in 2008 The implied long-term average rate of inflation was calculated as 18 Federal agencies and contractors to federal agencies are required by 10 CFR 436 to use the DOE discount rates when conducting LCC analyses related to energy conservation renewable energy resources and water conservation projects for federal facilities
The nominal and real discount rates applicable to general (non-energy or water) capital investments are published annually in OMB Circular A-94 Appendix C OMB has specified two basic types of discount rates (1) a discount rate for public investment and regulatory analyses and (2) a discount rate for cost-effectiveness lease-purchase and related analyses Only discount rates for the second type of analyses are included in this Annual Supplement since the primary purpose of this report is to support cost-effectiveness studies related to the design and operation of federal facilities
OMB discount rates for cost-effectiveness and lease-purchase studies are based on interest rates on Treasury Notes and Bonds with maturities ranging from 3 to 30 years Currently (as of January 2008) five maturities have been specifically identified by OMB and are shown here with the corresponding real interest rate to be used as the discount rate for studies subject to OMB Circular A-94
Maturity 3-year 5-year 7-year 10-year 30-yearRate 21 23 24 26 28
OMB suggests that the actual discount rate for an economic analysis be interpolated from these maturities and rates based on the study period used in the analysis Due to limitations on the size of this Annual Supplement discount factors for only two of these maturities are presented factors for short term analyses (up to 10 years) based on the 7-year real rate (24 ) and factors for long-term
1
analyses (longer than 10 years) based on the 30-year real rate (28 ) As a result these discount factors are for approximation purposes only It is suggested that the NIST Building Life Cycle Cost (BLCC) or DISCOUNT programs be used to compute the present value factors for the discount rate corresponding to the length of the study period when approximate values are not satisfactory for the project analysis (See preface for details on obtaining these programs)
The energy price indices and corresponding present value factors published in this report are computed from energy price forecasts provided to NIST by the Department of Energys Energy Information Administration (EIA) The EIA energy price forecast used in this report was the most recent available at the time that this report was prepared A description of the methodology used by EIA to project energy prices through 2038 is included in section B of this report DOE has not projected escalation rates for water prices to be used in the LCC analysis of water conservation projects Water escalation rates should be obtained from the local water utility when possible
Federal agencies and contractors to federal agencies are encouraged to seek energy price projections from their local utility to use in place of the DOEEIA regional projections especially when evaluating alternative fuel types In such cases the NIST BLCC or DISCOUNT programs can be used to calculate appropriate modified uniform present value (UPV) factors for use in the LCC analysis of federal energy conservation or renewable resource projects Otherwise 10 CFR 436 requires the use of the DOE energy price forecasts when conducting LCC analyses of such projects The UPV factors for energy costs presented in this report have been precalculated with the DOE forecast data Thus the use of these UPV factors automatically ensures that the DOE forecast data have been included in the analysis
All of the tables of discount factors contained in this report are based on real discount rates and are therefore intended for use only with economic analyses conducted in constant dollars (in which the purchasing power of the dollar is held constant) The energy price escalation rates and corresponding energy price indices contained in this report are also expressed in real terms If nominal discount rates and current dollar costs (which both include inflation) are used in the LCC analyses of federal projects choose the current-dollar-analysis option in the BLCC5 computer program which uses a nominal discount rate and adds the rate of general inflation to all dollar amounts
This report uses the term present value instead of present worth for the discount factors presented The meaning of these two terms is considered to be identical for purposes of economic analysis This change in terminology was made to be consistent with the terms used in the American Society for Testing and Materials (ASTM) compilation of standards on building economics (ASTM Standards on Building Economics 6th Edition ASTM West Conshohocken PA 2007)
In all of the tables the ldquoend-of-yearrdquo discounting convention is used that is all factors and indices are computed to adjust future dollar amounts to present value from the end of the year in which they are expected to occur The factors and indices in this publication which include energy price escalation rates (eg UPV factors and energy price indices) were calculated using April 1 2008 (the date of this publication) as their base date However these factors and indices can be used without adjustment for the LCC analysis of projects with other base dates until the release of the next revision of this publication (April 2009) Adjustment of these factors and indices for differences in the month-specific base date is not generally warranted due to uncertainties in estimating future energy prices
2
PART I TABLES FOR FEDERAL LIFE-CYCLE COST ANALYSIS
A Single Present Value and Uniform Present Value Factors for Non-Fuel Costs
Table A-1 presents the single present value (SPV) factors for finding the present value of future non-fuel non-annually recurring costs such as repair and replacement costs and salvage values The formula for finding the present value (P) of a future cost occurring in year t (Ct) is the following
1P = Ct times t = Ct times SPVt (1+ d )
where d = discount rate and t = number of time periods (years) between the present time and the time the cost is
incurred
Table A-2 presents uniform present value (UPV) factors for finding the present value of future non-fuel costs recurring annually such as routine maintenance costs The formula for finding the present value (P) of an annually recurring uniform cost (A) is the following
P = Atimes (1 d +
(1 d +
) d
N
) minus N
1 = AtimesUPVN
where d = discount rate and N = number of time periods (years) over which A recurs
Tables A-3 (abc) present modified uniform present value (UPV) factors for finding the present value of annually recurring non-fuel costs such as water costs which are expected to change from year to year at a constant rate of change (or escalation rate) over the study period The escalation rate can be positive or negative The formula for finding the present value (P) of an annually recurring cost at base-date prices (A0) changing at escalation rate e is the following
P = A0 times ⎜⎛ 1+ e
⎟⎞⎢⎡ 1minus ⎜⎛
1+ e ⎟⎞
N
⎥⎤ = AtimesUPV
N (d ne e)⎝ d minus e ⎠⎢⎣ ⎝1+ d ⎠ ⎥⎦
or
P = A0 times N = AtimesUPV N (d = e)
where A0 = annually recurring cost at base-date prices d = discount rate e = escalation rate and N = number of time periods (years) over which A recurs
3
Note if the discount rate is expressed in real terms ie net of general inflation then the escalation rate must also be expressed in real terms If the discount rate is expressed in nominal terms ie including general inflation then the escalation rate must also be expressed in nominal terms
In tables A-1 A-2 and A-3 (abc) SPV UPV and UPV factors are provided for both the DOE and the OMB Circular A-94 real discount rates current as of the date of this publication The FEMP SPV UPV and UPV factors were computed using the DOE discount rate The FEMP factors are for finding the present value of future costs associated with federal energy and water conservation projects and renewable energy projects The OMB SPV UPV and UPV factors were computed using the OMB discount rates The OMB factors are for finding the present value of future costs associated with most other federal projects (except those specifically exempted from OMB Circular A-94) The DOE and OMB discount rates used in computing these tables are real rates exclusive of general price inflation Thus the resulting discount factors are intended for use with future costs that are stated in constant dollars
Note We have added to table A-3a a column of UPV factors that incorporate an escalation rate of -18 the negative of the inflation rate used to calculate the DOE nominal discount rate for 2008 The UPV factors in this column can be used to calculate present values of fixed dollar amounts when performing a constant-dollar analysis An example might be a fixed contract payment in an ESPC project For these fixed amounts the assumption that in a constant-dollar analysis all cash flows change at the rate of general inflation (so that the differential escalation rate is zero) does not apply In real terms fixed amounts change at a differential rate equal to the negative of the inflation rate
Examples of How to Use the Factors
SPV (FEMP) To compute the present value of a replacement cost expected to occur in the 8th year for an energy efficient heating system go to Table A-1 find the 30 SPV factor for year 8 (0789) and multiply the factor by the replacement cost as of the base date
SPV (OMB Short-term) To compute the present value of a repair cost in the 5th year for a floor covering (non-energy related) go to Table A-1 find the 24 SPV factor for year 5 (0888) and multiply the factor by the repair cost as of the base date
SPV (OMB Long-term) To compute the present value of a repair cost in the 15th year for a floor covering (non-energy related) go to Table A-1 find the 28 SPV factor for year 15 (0661) and multiply the factor by the repair cost as of the base date
UPV (FEMP) To compute the present value of an annually recurring maintenance cost for a renewable energy system over 20 years go to Table A-2 find the 30 UPV factor for 20 years (1488) and multiply the factor by the annual maintenance cost as of the base date
UPV (OMB Short-term) To compute the present value of annually recurring costs of office cleaning over 10 years (for a project not primarily related to energy conservation) go to Table A-2 find the 24 UPV factor for 10 years (880) and multiply the factor by the annual cleaning cost as of the base date
4
UPV (OMB Long-term) To compute the present value of annually recurring costs of office cleaning over 25 years (for a project not primarily related to energy conservation) got to Table A-2 find the 28 UPV factor for 25 years (1781) and multiply the factor by the annual cleaning cost as of the base date
UPV (all) To compute the present value of annually recurring costs of water usage which are expected to increase at 2 faster than the rate of general inflation over 25 years find the UPV factor from table A-3 (a b or c as appropriate) that corresponds to 2 escalation and a 25 year study period From table A-3a (30 DOE discount rate) the corresponding UPV factor is 2208 Multiply this factor by the annual water cost as computed at base year prices to determine the present value of these water costs over the entire 25 years
UPV (negative inflation rate) To compute the present value of an annually recurring contract payment that is fixed over a contract period of 10 years find the UPV factor from table A-3a that corresponds to an escalation of -18 and a 10-year time period From table A-3a (30 DOE discount rate) the corresponding UPV factor is 776 Multiply this factor by the annual contract payment as of the base year to determine the present value of these contract payments over the entire 10-year period
Note UPV factors are generally applied to costs that recur annually in substantially the same amount Examples of such costs are routine operating and maintenance costs UPV factors are generally applied to costs that recur annually but change from year to year at a constant escalation rate Examples of such costs are water usage costs when they increase from year to year These costs usually occur every year over the service period of the building life If there is a planningdesignconstruction period before the service life begins during which these annual costs are not incurred the appropriate UPV (or UPV) factor for the service period is the difference between the UPV (or UPV) factor for the entire study period and the UPV (or UPV) factor for the planningdesignconstruction period For example if the planning designconstruction period is 3 years and the service period is 25 years for a total study period of 28 years the corresponding UPV factor (from Table A-2 DOE 30 discount rate) is 1876 - 283 = 1593
For further explanation and illustration of how to use these factors see NIST Handbook 135
5
Table A-1 SPV factors for finding the present value of future single costs (non-fuel)
Single Present Value (SPV) Factors---------- -----------------------------------------Number of DOE OMB Discount Ratesa
years frombase date
Discount rate 30
Short termb Long Termc
24 28 ---------- ------------- ---------- ---------
025 0993 0994 0993 050 0985 0988 0986 075 0978 0982 0980 1 0971 0977 0973 2 0943 0954 0946 3 0915 0931 0920 4 0888 0909 0895 5 0863 0888 0871 6 0837 0867 0847 7 0813 0847 0824 8 0789 0827 0802 9 0766 0808 0780 10 0744 0789 0759 11 0722 0738 12 0701 0718 13 0681 0698 14 0661 0679 15 0642 0661 16 0623 0643 17 0605 0625 18 0587 0608 19 0570 0592 20 0554 0576 21 0538 0560 22 0522 0545 23 0507 0530 24 0492 0515 25 0478 0501 26 0464 0488 27 0450 0474 28 0437 0462 29 0424 0449 30 0412 0437
---------- ------------- ---------- ---------
aOMB discount rates as of February 2008 bShort-term discount rate based on OMB discount rate for 7-year study period cLong-term discount rate based on OMB discount rate for 30-year study period
6
Table A-2 UPV factors for finding the present value of annually recurring uniform costs (non-fuel)
Uniform Present Value (UPV) Factors---------- -----------------------------------------Number of DOE OMB Discount Ratesa
years frombase date
Discount rate 30
Short termb Long Termc
24 28 ---------- ------------- ---------- ---------
1 097 098 097 2 191 193 192 3 283 286 284 4 372 377 373 5 458 466 461 6 542 553 545 7 623 637 628 8 702 720 708 9 779 801 786 10 853 880 862 11 925 936 12 995 1007 13 1063 1077 14 1130 1145 15 1194 1211 16 1256 1276 17 1317 1338 18 1375 1399 19 1432 1458 20 1488 1516 21 1542 1572 22 1594 1626 23 1644 1679 24 1694 1731 25 1741 1781 26 1788 1830 27 1833 1877 28 1876 1923 29 1919 1968 30 1960 2012
---------- ------------- ---------- ---------
aOMB discount rates as of February 2008 bShort-term discount rate based on OMB discount rate for 7-year study period cLong-term discount rate based on OMB discount rate for 30-year study period
7
8
Table A-3a UPV factors for finding the present value of annually recurring costs changing at a constant escalation rate DOE discount rate
DOE discount rate = 30
Modified Uniform Present Value (UPV) Factors (non-fuel)
---------------------------------------------------------------------------------------
Number of Annual rate of price change
years from -----------------------------------------------------------------------------
base date -4 -3 -2 -18 -1 0 1 2 3 4 5
--------------- ----- ----- ----- ----- ----- ----- ----- ----- ----- -----
1
093 094 095 095 096 097 098 099 100 101 102
2
180 183 186 186 189 191 194 197 200 203 206
3
261 266 272 273 277 283 288 294 300 306 312
4
337 345 354 356 363 372 381 390 400 410 420
5
407 419 432 434 445 458 472 486 500 515 530
6
472 489 506 509 524 542 561 580 600 621 642
7
533 555 577 581 599 623 648 673 700 728 757
8
590 616 644 649 672 702 733 766 800 836 873
9
644 675 708 714 742 779 817 857 900 945 992
10
693 730 768 776 809 853 899 948 1000 1055 1113
11
739 781 826 836 874 925 980 1038 1100 1166 1237
12
782 830 881 892 936 995 1059 1127 1200 1278 1363
13
822 876 934 946 996 1063 1136 1215 1300 1392 1491
14
859 919 983 997 1054 1130 1212 1302 1400 1506 1622
15
894 960 1031 1046 1109 1194 1287 1389 1500 1622 1756
16
927 998 1076 1092 1162 1256 1360 1474 1600 1739 1892
17
957 1034 1119 1137 1213 1317 1432 1559 1700 1857 2030
18
985 1068 1160 1179 1262 1375 1502 1643 1800 1976 2172
19
1011 1100 1199 1220 1309 1432 1571 1726 1900 2096 2316
20
1036 1130 1236 1258 1354 1488 1638 1808 2000 2217 2463
21
1059 1158 1271 1295 1398 1542 1705 1890 2100 2339 2612
22
1080 1185 1304 1330 1440 1594 1769 1970 2200 2463 2765
23
1100 1210 1336 1363 1480 1644 1833 2050 2300 2588 2921
24
1118 1234 1366 1395 1518 1694 1896 2129 2400 2714 3079
25
1135 1256 1395 1425 1556 1741 1957 2208 2500 2841 3241
26
1151 1277 1423 1454 1591 1788 2017 2285 2600 2970 3406
27
1166 1297 1449 1482 1626 1833 2076 2362 2700 3100 3574
28
1180 1316 1473 1508 1659 1876 2134 2438 2800 3231 3745
29
1193 1333 1497 1533 1690 1919 2190 2514 2900 3363 3920
30
1205 1350 1520 1557 1721 1960 2246 2588 3000 3497 4098
9
Table A-3b UPV factors for finding the present value of annually recurring amounts changing at a constant escalation rate OMB short-term discount rate
OMB short-term discount rate = 24 a
Modified Uniform Present Value (UPV) Factors (non-fuel)
---------------------------------------------------------------------------------------
Number of Annual rate of price change
years from -----------------------------------------------------------------------------
base date -5 -4 -3 -2 -1 0 1 2 3 4 5
--------------- ----- ----- ----- ----- ----- ----- ----- ----- ----- -----
1
093 094 095 096 097 098 099 100 101 102 103
2
179 182 184 187 190 193 196 199 202 205 208
3
259 264 269 275 281 286 292 298 304 309 315
4
333 341 350 359 368 377 387 396 406 416 426
5
401 414 426 439 452 466 480 494 509 524 539
6
465 482 498 516 534 553 572 592 612 634 656
7
524 545 567 589 613 637 663 689 717 745 775
8
579 605 632 660 689 720 752 786 821 858 897
9
630 661 693 727 763 801 841 883 927 973 1022
10
677 713 751 792 834 880 928 979 1033 1090 1151
aOMB discount rate as of February 2008 Short-term discount rate based on OMB discount rate for 7-year study period
10
Table A-3c UPV factors for finding the present value of annually recurring amounts changing at a constant escalation rate OMB long-term discount rate
OMB long-term discount rate = 28 a
----------
Modified Uniform Present Value (UPV) Factors (non-fuel)
-----------------------------------------------------------------------------
Number of years frombase date
Annual rate of price change
-5 -4 -3 -2 -1 0 1 2 3 4 5 -----------------------------------------------------------------------------
--------------- ----- ----- ----- ----- ----- ----- ----- ----- ----- -----
1
092 093 094 095 096 097 098 099 100 101 102
2
178 181 183 186 189 192 195 198 201 204 206
3
257 262 267 273 278 284 290 295 301 307 313
4
330 338 347 355 364 373 383 392 402 412 422
5
397 409 421 434 447 461 474 488 503 518 533
6
459 475 492 509 527 545 564 584 604 625 647
7
517 537 559 581 604 628 653 679 705 733 763
8
570 595 621 649 678 708 739 772 807 843 881
9
619 649 681 714 749 786 825 866 909 954 1002
10
665 700 737 776 818 862 909 958 1011 1067 1126
11
707 747 790 835 884 936 991 1050 1113 1180 1252
12
745 791 839 891 947 1007 1072 1141 1215 1295 1381
13
781 832 886 945 1009 1077 1151 1231 1318 1411 1512
14
814 870 931 996 1068 1145 1229 1321 1421 1529 1647
15
845 906 973 1045 1125 1211 1306 1410 1524 1648 1784
16
873 939 1012 1092 1179 1276 1381 1498 1627 1768 1925
17
899 971 1049 1136 1232 1338 1456 1586 1730 1890 2068
18
924 1000 1084 1178 1283 1399 1528 1673 1834 2013 2214
19
946 1027 1118 1219 1332 1458 1600 1759 1937 2138 2364
20
967 1053 1149 1257 1379 1516 1670 1844 2041 2264 2517
21
986 1076 1178 1294 1424 1572 1739 1929 2146 2392 2673
22
1003 1099 1206 1329 1468 1626 1807 2013 2250 2521 2832
23
1020 1119 1233 1362 1510 1679 1873 2097 2354 2652 2995
24
1035 1139 1257 1394 1550 1731 1939 2180 2459 2784 3161
25
1049 1157 1281 1424 1589 1781 2003 2262 2564 2917 3331
26
1061 1174 1303 1453 1627 1830 2066 2344 2669 3053 3504
27
1073 1189 1324 1480 1663 1877 2128 2425 2775 3189 3681
28
1084 1204 1343 1506 1698 1923 2189 2505 2880 3328 3862
29
1094 1218 1362 1531 1731 1968 2249 2585 2986 3468 4047
30
1104 1231 1380 1555 1764 2012 2308 2664 3092 3609 4236
aOMB discount rate as of February 2008 Long-term discount rate based on OMB discount rate for 30-year study period
B Modified Uniform Present Value Factors for Fuel Costs
This section presents FEMP and OMB modified uniform present value (UPV) discount factors for calculating the present value of energy usage for federal projects Factors are provided for the four major Census regions and for the overall United States The factors are modified in the sense that they incorporate energy price escalation rates based on future energy prices projected by DOE for the years 2008 to 2038 There are two sets of UPV tables the Ba tables present FEMP UPV factors based on the DOE discount rate (30 real) and the Bb tables present OMB UPV factors based on two OMB discount rates (24 real for short-term study periods of 1 to 10 years 28 real for long-term study periods of 11 to 30 years) The underlying energy price indices for the years 2008 to 2038 on which these UPV calculations are based are shown in tables Ca-1 through Ca-5 The corresponding average energy price escalation rates for selected time intervals between 2008 and 2038 are shown in tables Cb-1 through Cb-5
Energy Price Projections
The FEMP and OMB UPV factors incorporate energy price escalation rates computed from future energy prices projected by the Energy Information Administration (EIA) of the US Department of Energy Energy prices through 2030 were generated by EIA using the National Energy Modeling System (NEMS) and published in the Annual Energy Outlook 2008 (AEO2008) At the request of FEMP EIA extrapolated energy prices from 2031 to 2038 based on selected growth rates from the AEO2008 projections
NEMS is an energy market model designed to project the impacts of alternative energy policies or assumptions on US energy markets NEMS produces projections of the US energy future given current laws and policies and other key assumptions including macroeconomic indicators from Data Resources Inc the production policy of the Organization of Petroleum Exporting Countries the size of the economically recoverable resource base for fossil fuels and the rate of development and penetration of new technologies NEMS balances energy supply and demands with modules representing primary fuel supply end-use demand for four sectors and conversion of energy by refineries and electricity generators Macroeconomic and international oil modules reflect the impacts of energy prices production and consumption on world oil markets and the economy
The EIA energy price projections presented in this report like those of other forecasters are dependent on the data methodologies and specific assumptions used in their development Many of the assumptions concerning the future cannot be known with any degree of certainty Thus the projections are not statements of what will happen but what might happen given the particular assumptions and methodologies used Although EIA has endeavored to make these forecasts as objective reliable and useful as possible these projections should serve as an adjunct to not a substitute for the analytical process The AEO2008 was prepared by EIA as required under statute by federal legislation The price projections to 2038 were prepared in accordance with a Service Request from the Federal Energy Management Program
11
UPV Calculation Method
The formula for finding the present value (P) of future energy costs or savings is the following
N
P = A0 xsum I(2008+ t )
t = A0 xUPVN
iminus1 (1+ d )
where A0 = annual cost of energy as of the base date (April 1 2008) t = index used to designate the year of energy usage N = number of periods eg years over which energy costs or savings accrue I(2008+t) = projected average fuel price index1 given in Tables Ca-1 through Ca-5
for the year 2008+t (where I2008 = 100) and d = the real discount rate
This formula is based on end-of-year energy prices and end-of-year discounting Note that annual energy costs as of the base date of the LCC analysis (A0 to be supplied by the analyst) should reflect the current energy price schedule as of that date which may not be the same as the energy price itself on that date2 That is the annual energy cost should reflect summer-winter rate differences time-of-use rates block rates considerations and demand charges (as appropriate) anticipated to be in effect that year If energy and demand costs are calculated separately (as is sometimes done for electricity) the UPV factor should be applied to both costs
The data in the tables that follow are reported for the four Census regions and the US average Figure B-1 presents a map showing the states corresponding to the four Census regions The Census regions do not include American Samoa Canal Zone Guam Puerto Rico Trust Territory of the Pacific Islands or the Virgin Islands Analysts of federal projects in these areas should use data that are reasonable under the circumstances and may refer to the tables with US average data for guidance
1 For greater precision the UPV factors reported in the Ba and Bb tables were computed using the unrounded form of the indices given in Tables Ca-1 through Ca-5
2 While the UPV factors provided in this publication were computed using energy price indices that correspond to energy prices as of April 1 in the current and future years the analyst is encouraged to use for determining A0 the energy prices prevailing as of the base date of the LCC analysis for the project evaluated
12
13
Figure B-1
Source US Census Bureau
B1 FEMP Modified Uniform Present Value Factors
The FEMP Modified Uniform Present Value (FEMP UPV) factors presented in the Ba tables based on the current DOE discount rate (30 ) are for calculating the present value of energy costs or savings accruing over 1 to 25 years and are to be used in life-cycle cost analyses of federal energy conservation and renewable energy projects Factors are reported in the Ba tables for 30 years to accommodate a planningdesignconstruction period of up to 5 years (See Examples of How to Use FEMP UPV Factors below for instructions on use with planningdesignconstruction periods)
These factors apply only to annual energy usage or energy savings that are assumed to be the same each year over the service period The NIST BLCC computer program can compute the present value of energy usage and savings that are not the same in each year
Examples of How to Use the FEMP UPV Factors
FEMP UPV no planningdesignconstruction period To compute the present value of heating with natural gas over 25 years in a federal office building in New Mexico go to Table Ba-4 find the FEMP UPV factor for commercial natural gas for 25 years (1641) and multiply this factor by the annual heating cost at base-date natural gas prices
FEMP UPV with planningdesignconstruction period To compute a present value factor for a service period following a planningdesignconstruction period (1) find the FEMP UPV factor for the combined length of the planningdesignconstruction period and the service period (not to exceed 30 years) and (2) subtract from (1) the FEMP UPV factor for the planningdesign construction period alone The difference is the FEMP UPV factor for the years over which energy costs or savings actually accrue For example suppose a new federal office building in New York is being evaluated with several energy conserving design options It is expected to have a planningdesignconstruction period of 5 years after which it will be occupied for 25 years To compute the present value of natural gas costs over 25 years of occupancy go to Table Ba-1 and find the FEMP UPV factors for commercial natural gas for 5 years (443) and for 30 years (1899) The difference (1456) is the FEMP UPV factor for natural gas costs over 25 years beginning 5 years after the base date Multiply 1456 by the annual natural gas cost at base date prices (not occupancy-date prices) to calculate the present value of natural gas costs over the entire 25-year occupancy period
14
Table Ba-1 FEMP UPV Discount Factors adjusted for fuel price escalation by end-use sector and fuel type
15
Discount rate = 30 (DOE)
Census Region 1 (Connecticut Maine Massachusetts New HampshireNew Jersey New York Pennsylvania Rhode Island Vermont)
RESIDENTIAL COMMERCIAL INDUSTRIAL TRANSPORT
N Elec Dist LPG NtGas Elec Dist Resid NtGas Coal Elec Dist Resid NtGas Coal Gasln N
------ ----- ----- ----- ----- ----- ----- ----- ----- ----- ----- ----- ----- ----- ----- -
1 100 087 094 098 099 089 097 099 098 099 089 097 100 097 093 1
2 195 165 182 191 191 170 186 192 191 190 169 186 193 190 176 2
3 287 237 266 279 278 245 269 280 278 274 245 269 281 281 254 3
4 376 305 347 364 361 316 345 363 359 353 317 345 363 368 328 4
5 461 368 425 444 440 381 417 443 435 427 384 416 440 452 398 5
6 544 427 501 521 515 443 483 519 509 498 448 482 513 534 465 6
7 625 483 573 595 587 502 544 592 579 565 509 543 582 612 529 7
8 704 536 643 667 658 557 601 662 646 630 566 599 648 688 588 8
9 780 586 712 736 727 610 655 731 710 694 621 653 713 761 646 9
10 855 636 778 805 794 662 708 799 771 757 675 706 776 831 703 10 11 928 684 842 872 860 714 760 865 829 817 728 758 838 898 760 11 12 998 732 905 937 923 765 812 929 886 876 782 810 898 964 816 12 13 1066 778 965 999 985 814 863 991 942 931 834 861 955 1029 871 13 14 1131 824 1024 1060 1044 863 913 1052 996 986 885 911 1011 1091 924 14 15 1196 868 1081 1120 1103 911 963 1112 1049 1039 935 960 1066 1151 976 15 16 1258 912 1137 1179 1160 958 1012 1171 1100 1091 984 1009 1120 1210 1027 16 17 1319 956 1192 1237 1215 1004 1060 1229 1150 1142 1032 1057 1173 1266 1077 17 18 1378 998 1245 1294 1269 1049 1108 1286 1199 1191 1079 1104 1226 1321 1125 18 19 1436 1040 1296 1350 1322 1094 1154 1342 1247 1240 1126 1150 1277 1375 1173 19 20 1492 1082 1346 1405 1374 1138 1200 1398 1295 1287 1171 1195 1328 1426 1219 20 21 1547 1123 1396 1459 1424 1182 1245 1453 1341 1333 1217 1240 1378 1477 1264 21 22 1600 1163 1444 1512 1473 1225 1289 1507 1386 1379 1261 1284 1428 1526 1309 22 23 1652 1202 1490 1564 1521 1267 1333 1560 1430 1423 1305 1328 1477 1574 1353 23 24 1702 1241 1536 1615 1568 1308 1377 1611 1473 1466 1347 1371 1525 1621 1395 24 25 1752 1278 1581 1665 1614 1349 1419 1662 1514 1508 1389 1413 1572 1666 1437 25 26 1799 1315 1624 1713 1658 1389 1462 1712 1555 1549 1430 1455 1618 1710 1477 26 27 1846 1352 1666 1761 1701 1427 1503 1760 1594 1588 1470 1496 1663 1753 1517 27 28 1891 1387 1708 1807 1743 1465 1544 1807 1633 1627 1509 1536 1708 1795 1556 28 29 1935 1422 1748 1853 1785 1503 1584 1854 1670 1665 1548 1576 1751 1836 1594 29 30 1978 1456 1788 1897 1825 1539 1624 1899 1707 1702 1586 1615 1794 1876 1631 30
Note UPV factors are reported for years 26-30 to accommodate a planningconstruction period of up to 5 years See p 14 for instructions on use page xiii for abbreviations
Table Ba-2 FEMP UPV Discount Factors adjusted for fuel price escalation by end-use sector and fuel type
16
Discount Rate = 30 (DOE)
Census Region 2 (Illinois Indiana Iowa Kansas Michigan MinnesotaMissouri Nebraska North Dakota Ohio South Dakota Wisconsin)
RESIDENTIAL
COMMERCIAL INDUSTRIAL TRANSPORT
N Elec Dist LPG NtGas Elec Dist Resid NtGas Coal Elec Dist Resid NtGas Coal Gasln N
------ ----- ----- ----- ----- ----- ----- ----- ----- ----- ----- ----- ----- ----- ----- -
1 100 084 098 097 100 086 108 098 099 101 088 105 100 098 095 1
2 198 158 193 188 198 162 208 189 195 199 168 201 194 191 180 2
3 293 227 283 274 292 235 300 274 290 291 244 290 283 282 260 3
4 383 291 370 355 381 302 378 355 382 378 316 367 365 369 336 4
5 471 350 453 433 465 363 449 432 471 460 382 437 443 453 408 5
6 555 406 533 507 546 422 516 505 556 538 446 503 516 534 477 6
7 636 458 611 577 623 477 579 575 639 612 506 564 586 613 542 7
8 715 507 686 646 698 529 637 643 719 685 563 621 653 689 604 8
9 792 554 758 713 770 579 693 709 797 755 618 676 718 763 664 9
10 867 599 829 778 842 627 748 774 872 824 672 730 782 835 722 10 11 940 645 898 842 911 676 803 838 945 891 725 783 844 905 781 11 12 1011 689 965 904 978 724 858 900 1015 956 779 837 904 973 839 12 13 1080 732 1030 964 1044 771 913 959 1084 1018 831 889 961 1038 895 13 14 1146 774 1092 1022 1107 816 966 1017 1150 1078 881 941 1017 1102 950 14 15 1211 816 1154 1079 1169 861 1019 1074 1215 1137 931 992 1072 1165 1004 15 16 1273 857 1214 1136 1228 906 1072 1131 1278 1194 979 1043 1127 1226 1055 16 17 1334 898 1272 1191 1287 949 1124 1187 1339 1250 1027 1093 1181 1285 1106 17 18 1393 938 1329 1246 1343 992 1175 1242 1398 1303 1074 1142 1234 1343 1156 18 19 1450 978 1385 1300 1398 1035 1225 1296 1455 1355 1120 1191 1287 1399 1204 19 20 1505 1017 1440 1354 1451 1076 1275 1350 1511 1406 1166 1238 1339 1454 1252 20 21 1559 1055 1493 1407 1503 1118 1323 1404 1565 1456 1210 1285 1392 1508 1299 21 22 1612 1093 1546 1459 1554 1158 1371 1457 1618 1504 1254 1331 1444 1560 1344 22 23 1663 1130 1597 1510 1604 1198 1418 1509 1669 1551 1298 1377 1495 1610 1389 23 24 1712 1166 1647 1560 1653 1237 1464 1560 1719 1597 1340 1421 1545 1660 1433 24 25 1760 1201 1696 1609 1700 1276 1510 1609 1768 1642 1382 1465 1594 1708 1475 25 26 1807 1236 1744 1657 1746 1313 1555 1658 1815 1685 1423 1509 1642 1755 1517 26 27 1852 1270 1790 1704 1790 1350 1599 1706 1861 1727 1462 1551 1690 1800 1558 27 28 1896 1303 1836 1750 1834 1386 1642 1753 1906 1768 1501 1593 1736 1845 1598 28 29 1939 1336 1880 1795 1876 1422 1685 1799 1950 1808 1540 1634 1782 1888 1636 29 30 1980 1368 1924 1839 1917 1456 1727 1843 1993 1847 1577 1675 1827 1930 1674 30
Note UPV factors are reported for years 26-30 to accommodate a planningconstruction period of up to 5 years See p 14 for instructions on use page xiii for abbreviations
Table Ba-3 FEMP UPV Discount Factors adjusted for fuel price escalation by end-use sector and fuel type
17
Discount Rate = 30 (DOE)
Census Region 3 (Alabama Arkansas Delaware District of Columbia Florida Georgia Kentucky LouisianaMaryland Mississippi North Carolina Oklahoma South Carolina Tennessee Texas Virginia West Virginia)
RESIDENTIAL
COMMERCIAL INDUSTRIAL TRANSPORT
N Elec Dist LPG NtGas Elec Dist Resid NtGas Coal Elec Dist Resid NtGas Coal Gasln N
------ ----- ----- ----- ----- ----- ----- ----- ----- ----- ----- ----- ----- ----- ----- -
1 100 087 094 097 100 088 111 099 098 101 088 103 101 097 095 1
2 198 164 182 188 198 168 214 191 192 198 166 196 196 189 181 2
3 292 237 267 275 290 243 309 279 280 290 243 282 283 275 260 3
4 381 304 349 357 378 312 395 362 363 377 314 359 365 357 335 4
5 468 367 428 436 463 376 474 441 442 459 380 429 442 436 405 5
6 551 426 504 512 543 437 548 516 517 538 443 495 515 511 472 6
7 631 482 577 585 620 495 615 589 589 613 503 555 584 584 536 7
8 709 534 648 655 695 548 677 658 657 687 559 611 650 654 596 8
9 785 584 717 724 769 600 737 727 723 758 614 665 714 722 654 9
10 858 634 784 791 839 651 795 794 787 827 667 717 777 787 711 10 11 929 682 850 857 908 701 853 860 848 895 720 769 840 850 768 11 12 999 729 913 922 975 751 910 924 907 960 773 821 900 912 825 12 13 1066 776 975 985 1040 800 966 987 965 1023 825 871 959 971 880 13 14 1131 821 1035 1046 1103 847 1020 1048 1021 1085 875 921 1016 1029 934 14 15 1195 865 1093 1106 1164 894 1075 1108 1076 1145 924 970 1073 1085 986 15 16 1256 909 1150 1166 1223 940 1128 1168 1129 1203 972 1019 1129 1140 1037 16 17 1316 953 1206 1224 1281 985 1182 1226 1180 1259 1020 1067 1184 1193 1086 17 18 1375 995 1260 1281 1337 1030 1234 1284 1229 1314 1067 1115 1239 1245 1135 18 19 1431 1037 1312 1338 1392 1074 1286 1340 1277 1368 1113 1162 1293 1295 1182 19 20 1486 1078 1364 1393 1445 1118 1337 1396 1324 1420 1158 1208 1346 1343 1229 20 21 1540 1119 1414 1448 1497 1161 1387 1451 1369 1471 1202 1253 1399 1391 1274 21 22 1592 1159 1464 1502 1547 1203 1436 1506 1413 1521 1247 1298 1452 1437 1319 22 23 1643 1198 1511 1555 1596 1245 1484 1559 1456 1569 1290 1341 1504 1481 1363 23 24 1692 1237 1558 1607 1644 1286 1532 1611 1498 1616 1332 1385 1555 1525 1406 24 25 1740 1274 1604 1657 1691 1326 1579 1662 1539 1661 1374 1427 1605 1568 1447 25 26 1787 1311 1649 1706 1736 1365 1626 1712 1579 1706 1414 1469 1654 1609 1488 26 27 1832 1347 1692 1755 1780 1403 1671 1761 1618 1749 1454 1510 1703 1649 1528 27 28 1876 1383 1734 1802 1823 1441 1716 1809 1655 1791 1493 1551 1750 1688 1567 28 29 1919 1417 1776 1848 1864 1478 1760 1856 1692 1832 1531 1591 1797 1727 1605 29 30 1960 1451 1816 1893 1904 1514 1804 1902 1728 1872 1569 1630 1843 1764 1643 30
Note UPV factors are reported for years 26-30 to accommodate a planningconstruction period of up to 5 years See p 14 for instructions on use page xiii for abbreviations
Table Ba-4 FEMP UPV Discount Factors adjusted for fuel price escalation by end-use sector and fuel type
18
Discount Rate = 30 (DOE)
Census Region 4 (Alaska Arizona California Colorado HawaiiIdaho Montana Nevada New Mexico Oregon Utah Washington Wyoming)
RESIDENTIAL
COMMERCIAL INDUSTRIAL TRANSPORT
N Elec Dist LPG NtGas Elec Dist Resid NtGas Coal Elec Dist Resid NtGas Coal Gasln N
------ ----- ----- ----- ----- ----- ----- ----- ----- ----- ----- ----- ----- ----- ----- -
1 098 074 095 097 098 081 119 097 099 098 082 121 098 098 091 1
2 193 137 184 188 191 152 234 188 195 193 155 238 188 193 175 2
3 282 196 270 274 278 219 339 273 288 282 224 346 272 284 254 3
4 368 251 352 356 361 281 423 355 377 366 289 432 350 371 329 4
5 450 304 431 434 439 341 498 432 463 445 352 509 424 455 400 5
6 530 355 508 509 515 399 570 507 546 522 412 583 493 536 468 6
7 608 403 582 581 587 453 638 579 627 596 469 653 559 614 533 7
8 684 448 654 651 658 505 702 648 704 668 523 719 623 690 594 8
9 758 492 723 720 726 554 763 717 779 738 575 782 685 763 653 9
10 830 536 791 787 792 604 824 784 854 806 626 844 746 835 711 10 11 901 579 857 852 857 653 886 849 926 873 678 908 805 904 768 11 12 969 622 921 915 919 702 949 912 997 937 730 973 861 972 825 12 13 1035 663 982 975 979 750 1012 972 1066 998 780 1037 914 1038 880 13 14 1100 704 1041 1033 1037 797 1073 1031 1133 1058 830 1100 965 1102 933 14 15 1162 745 1099 1091 1093 843 1134 1089 1198 1116 878 1163 1015 1166 984 15 16 1224 785 1156 1148 1148 889 1195 1146 1263 1173 925 1225 1066 1227 1034 16 17 1284 825 1212 1204 1202 934 1255 1203 1326 1229 971 1287 1116 1287 1083 17 18 1343 864 1266 1260 1254 978 1314 1260 1387 1283 1017 1348 1167 1346 1129 18 19 1400 903 1319 1315 1305 1022 1373 1316 1448 1336 1062 1407 1217 1404 1175 19 20 1455 941 1371 1370 1355 1065 1430 1372 1506 1387 1107 1466 1266 1459 1219 20 21 1510 979 1422 1424 1404 1108 1486 1427 1564 1438 1150 1524 1317 1514 1263 21 22 1562 1016 1472 1477 1451 1150 1541 1482 1619 1487 1193 1581 1367 1567 1305 22 23 1614 1052 1520 1530 1497 1191 1596 1536 1674 1534 1235 1636 1416 1619 1346 23 24 1664 1088 1568 1581 1542 1231 1649 1589 1727 1581 1277 1691 1465 1669 1386 24 25 1713 1123 1614 1631 1585 1270 1702 1641 1778 1626 1317 1746 1513 1718 1425 25 26 1761 1157 1660 1680 1628 1308 1754 1692 1828 1670 1356 1799 1560 1766 1464 26 27 1807 1190 1704 1729 1669 1346 1805 1741 1877 1713 1395 1851 1606 1813 1501 27 28 1853 1223 1747 1776 1709 1383 1855 1790 1925 1755 1433 1903 1651 1858 1538 28 29 1897 1255 1789 1822 1748 1419 1904 1837 1971 1796 1470 1954 1696 1902 1574 29 30 1940 1286 1830 1867 1786 1454 1953 1884 2016 1836 1506 2004 1740 1945 1609 30
Note UPV factors are reported for years 26-30 to accommodate a planningconstruction period of up to 5 years See p 14 for instructions on use page xiii for abbreviations
Table Ba-5 FEMP UPV Discount Factors adjusted for fuel price escalation by end-use sector and fuel type
19
Discount Rate = 30 (DOE)
United States Average
RESIDENTIAL
COMMERCIAL INDUSTRIAL TRANSPORT
N Elec Dist LPG NtGas Elec Dist Resid NtGas Coal Elec Dist Resid NtGas Coal Gasln N
------ ----- ----- ----- ----- ----- ----- ----- ----- ----- ----- ----- ----- ----- ----- -
1 100 086 096 097 099 088 099 098 099 100 087 102 100 097 094 1
2 197 163 186 189 195 166 189 190 194 196 164 195 194 190 178 2
3 289 235 274 275 285 241 273 277 285 287 239 281 281 279 258 3
4 378 302 357 358 371 310 350 359 372 372 309 358 363 364 333 4
5 464 364 438 437 453 374 422 437 456 453 374 429 440 446 403 5
6 546 423 515 512 531 435 489 512 536 530 437 495 512 524 471 6
7 626 478 590 584 606 492 550 583 614 604 496 556 581 600 535 7
8 704 530 663 654 678 546 607 653 688 675 552 612 647 674 596 8
9 779 580 733 722 749 598 661 721 760 745 606 666 711 745 655 9
10 852 628 802 789 818 649 715 787 830 813 659 719 774 813 712 10 11 924 676 869 855 886 699 768 852 897 879 712 772 836 880 769 11 12 993 723 934 918 951 749 820 916 963 943 765 824 896 945 826 12 13 1060 769 996 979 1013 798 872 976 1027 1005 817 875 953 1008 882 13 14 1125 814 1057 1039 1074 846 922 1036 1089 1065 867 925 1009 1069 935 14 15 1189 859 1117 1098 1134 893 972 1095 1149 1123 916 975 1064 1129 987 15 16 1250 902 1175 1156 1191 939 1022 1153 1208 1180 964 1024 1118 1187 1038 16 17 1310 945 1231 1213 1247 985 1071 1210 1265 1235 1012 1073 1172 1243 1088 17 18 1369 988 1287 1269 1302 1030 1119 1267 1321 1289 1058 1121 1226 1298 1136 18 19 1425 1029 1341 1324 1355 1074 1166 1323 1375 1341 1104 1168 1278 1351 1183 19 20 1480 1070 1393 1378 1407 1117 1212 1378 1428 1392 1149 1214 1331 1403 1229 20 21 1534 1111 1445 1432 1458 1160 1258 1433 1479 1441 1194 1259 1383 1454 1274 21 22 1586 1151 1495 1486 1507 1203 1303 1487 1529 1490 1238 1304 1434 1503 1319 22 23 1637 1190 1545 1538 1555 1244 1347 1540 1578 1537 1281 1348 1485 1551 1362 23 24 1687 1228 1593 1589 1602 1285 1391 1591 1625 1583 1323 1392 1536 1598 1404 24 25 1735 1265 1640 1638 1648 1325 1434 1642 1671 1628 1364 1435 1585 1643 1446 25 26 1781 1302 1685 1687 1692 1364 1476 1692 1716 1672 1405 1477 1633 1688 1486 26 27 1827 1338 1730 1735 1735 1402 1518 1740 1760 1714 1444 1519 1681 1731 1525 27 28 1871 1373 1774 1781 1777 1440 1559 1788 1802 1755 1483 1559 1728 1773 1564 28 29 1914 1407 1816 1827 1818 1477 1600 1834 1844 1795 1521 1600 1774 1814 1602 29 30 1956 1441 1858 1871 1858 1513 1640 1880 1884 1834 1558 1639 1819 1853 1639 30
Note UPV factors are reported for years 26-30 to accommodate a planningconstruction period of up to 5 years See p 14 for instructions on use page xiii for abbreviations
B2 FEMP Modified Uniform Present Value Factors
The OMB Modified Uniform Present Value (OMB UPV) factors presented in the Bb tables based on the current OMB discount rates (24 short term and 28 long term) are for calculating the present value of energy costs accruing over 1 to 30 years when conducting a life-cycle cost analysis of a federal project not explicitly related to energy or water conservation or renewable resources Factors are reported in the Bb tables for 30 years These factors apply only to annual energy usage that is assumed to be the same each year over the service period The NIST BLCC computer program can compute the present value of energy usage and savings that are not the same in each year
Examples of How to Use the OMB UPV Factors
OMB UPV (OMB discount rate) To compute the present value over 30 years of electricity costs associated with the occupancy of a federal office building in Ohio (where energy conservation is not a specific consideration in the LCC analysis) go to Table Bb-2 find the OMB UPV factor for commercial electricity for 30 years (1968) and multiply this factor by the annual electricity cost in base-date dollars
Note Because the discount rate used to calculate the Bb tables (OMB discount rate) is usually different for years 1 to 10 than for years 11 to 30 these factors cannot be used with a planning designconstruction period as shown above for the Ba tables (DOE discount rate) Use the BLCC or DISCOUNT computer program for this purpose For further explanation of the use of UPV factors see NIST Handbook 135
20
Table Bb-1 OMB UPV Discount Factors adjusted for fuel price escalation by end-use sector and fuel type
21
Discount Rate = 24 (years 1 to 10) and 28 (years 11 to 30) (OMB Circular A-94a)
Census Region 1 (Connecticut Maine Massachusetts New HampshireNew Jersey New York Pennsylvania Rhode Island Vermont)
RESIDENTIAL
COMMERCIAL INDUSTRIAL TRANSPORT
N Elec Dist LPG NtGas Elec Dist Resid NtGas Coal Elec Dist Resid NtGas Coal Gasln N
------ ----- ----- ----- ----- ----- ----- ----- ----- ----- ----- ----- ----- ----- ----- -
1 100 087 094 099 099 089 098 100 099 099 089 098 100 098 093 1
2 197 166 183 193 193 171 188 194 193 192 170 187 195 192 177 2
3 290 240 269 283 281 248 272 283 281 277 248 272 284 284 257 3
4 381 309 352 369 366 320 350 369 364 358 322 350 368 373 333 4
5 469 374 433 452 447 387 424 451 443 435 390 423 448 460 405 5
6 555 436 511 532 525 452 493 529 519 507 457 491 523 545 474 6
7 639 494 586 609 601 513 556 605 592 577 520 555 595 626 540 7
8 722 549 660 684 674 571 615 679 663 646 580 614 665 705 603 8
9 802 602 732 757 747 627 672 751 730 713 638 670 733 782 664 9
10 882 654 802 830 818 682 728 823 794 779 695 727 800 856 724 10 11 938 691 852 881 869 721 768 874 838 826 736 766 847 908 768 11 12 1010 740 916 948 934 773 821 940 897 886 791 819 908 976 825 12 13 1079 788 978 1012 997 825 873 1004 954 943 845 871 967 1042 881 13 14 1147 834 1038 1075 1059 875 925 1066 1009 999 897 923 1024 1106 936 14 15 1213 880 1097 1137 1119 924 976 1128 1063 1054 948 973 1081 1168 990 15 16 1278 926 1155 1197 1177 972 1027 1189 1116 1107 999 1024 1137 1228 1043 16 17 1341 971 1211 1257 1235 1020 1077 1249 1168 1160 1048 1073 1192 1287 1094 17 18 1402 1015 1266 1316 1291 1067 1126 1308 1219 1211 1097 1122 1246 1343 1144 18 19 1462 1058 1319 1374 1345 1113 1174 1366 1269 1261 1146 1170 1299 1399 1193 19 20 1520 1101 1372 1431 1399 1159 1221 1424 1318 1311 1193 1217 1352 1453 1242 20 21 1577 1144 1423 1488 1452 1205 1268 1481 1366 1359 1240 1264 1405 1505 1289 21 22 1633 1186 1473 1543 1503 1250 1315 1537 1413 1406 1287 1310 1456 1557 1335 22 23 1687 1227 1522 1598 1553 1294 1361 1593 1459 1452 1332 1355 1508 1607 1381 23 24 1740 1267 1570 1651 1602 1337 1406 1647 1504 1497 1377 1400 1558 1656 1426 24 25 1791 1307 1616 1703 1650 1379 1451 1700 1548 1541 1421 1445 1607 1703 1469 25 26 1842 1346 1662 1754 1697 1421 1495 1752 1591 1584 1464 1489 1656 1750 1512 26 27 1891 1384 1707 1804 1742 1462 1539 1803 1632 1626 1506 1532 1704 1795 1554 27 28 1938 1422 1750 1853 1787 1502 1582 1854 1673 1667 1548 1574 1751 1840 1595 28 29 1985 1458 1793 1901 1830 1542 1625 1903 1712 1708 1588 1616 1797 1883 1635 29 30 2030 1494 1835 1948 1873 1580 1667 1951 1751 1747 1628 1658 1842 1925 1674 30
aOMB discount rate as of February 2008 See p 20 for instructions on use page xiii for abbreviations
Table Bb-2 OMB UPV Discount Factors adjusted for fuel price escalation by end-use sector and fuel type
22
Discount Rate = 24 (years 1 to 10) and 28 (years 11 to 30) (OMB Circular A-94a)
Census Region 2 (Illinois Indiana Iowa Kansas Michigan MinnesotaMissouri Nebraska North Dakota Ohio South Dakota Wisconsin)
RESIDENTIAL
COMMERCIAL INDUSTRIAL TRANSPORT
N Elec Dist LPG NtGas Elec Dist Resid NtGas Coal Elec Dist Resid NtGas Coal Gasln N
------ ----- ----- ----- ----- ----- ----- ----- ----- ----- ----- ----- ----- ----- ----- -
1 101 084 099 098 101 086 108 098 100 102 089 105 101 098 095 1
2 200 160 195 190 200 164 210 191 197 201 169 203 196 193 181 2
3 296 230 286 277 295 238 303 277 294 295 247 293 286 285 263 3
4 389 295 375 360 386 306 383 360 387 384 320 372 370 375 341 4
5 479 356 461 440 473 369 456 439 479 468 389 444 450 461 415 5
6 566 414 544 517 556 430 526 515 568 549 455 512 526 545 486 6
7 651 468 625 590 637 488 591 588 654 626 518 576 599 627 554 7
8 734 519 703 662 715 542 652 659 738 702 577 636 669 707 619 8
9 815 568 780 732 792 594 711 729 820 776 635 694 738 784 682 9
10 894 617 855 802 868 646 769 798 899 849 692 751 805 861 744 10 11 951 651 908 851 921 683 811 847 955 901 733 791 854 915 789 11 12 1023 697 977 915 990 732 868 910 1027 967 788 846 915 984 849 12 13 1093 741 1043 976 1057 780 924 971 1097 1031 841 900 973 1052 907 13 14 1162 784 1107 1036 1122 827 978 1031 1166 1093 893 953 1031 1117 963 14 15 1228 827 1170 1095 1185 873 1033 1090 1233 1153 944 1006 1087 1182 1018 15 16 1293 870 1232 1153 1247 919 1087 1148 1297 1212 994 1058 1144 1244 1071 16 17 1356 912 1293 1210 1307 964 1141 1206 1360 1270 1043 1110 1199 1306 1124 17 18 1417 954 1352 1267 1366 1009 1194 1263 1421 1325 1092 1161 1255 1366 1175 18 19 1476 995 1410 1323 1423 1053 1246 1319 1481 1379 1140 1211 1310 1424 1226 19 20 1533 1035 1467 1379 1478 1096 1298 1376 1539 1432 1187 1261 1364 1481 1275 20 21 1589 1075 1523 1434 1532 1139 1348 1431 1595 1484 1234 1310 1419 1537 1324 21 22 1644 1114 1577 1489 1586 1181 1398 1487 1651 1534 1280 1358 1473 1591 1371 22 23 1697 1153 1631 1542 1638 1223 1447 1541 1704 1583 1325 1405 1526 1644 1418 23 24 1749 1191 1683 1595 1689 1264 1496 1594 1757 1632 1370 1452 1578 1696 1464 24 25 1800 1228 1734 1646 1738 1305 1544 1646 1808 1678 1413 1498 1630 1747 1509 25 26 1849 1265 1785 1696 1786 1344 1591 1698 1858 1724 1456 1544 1681 1796 1552 26 27 1897 1301 1834 1746 1833 1383 1637 1748 1906 1768 1498 1589 1731 1844 1595 27 28 1943 1336 1882 1794 1879 1421 1683 1798 1954 1812 1539 1633 1780 1891 1637 28 29 1988 1370 1929 1842 1924 1459 1729 1846 2000 1854 1580 1676 1829 1937 1679 29 30 2032 1404 1975 1889 1968 1495 1773 1894 2045 1895 1619 1720 1876 1982 1719 30
aOMB discount rate as of February 2008 See p 20 for instructions on use page xiii for abbreviations
Table Bb-3 OMB UPV Discount Factors adjusted for fuel price escalation by end-use sector and fuel type
23
Discount Rate = 24 (years 1 to 10) and 28 (years 11 to 30) (OMB Circular A-94a)
Census Region 3 (Alabama Arkansas Delaware District of Columbia Florida Georgia Kentucky LouisianaMaryland Mississippi North Carolina Oklahoma South Carolina Tennessee Texas Virginia West Virginia)
RESIDENTIAL
COMMERCIAL INDUSTRIAL TRANSPORT
N Elec Dist LPG NtGas Elec Dist Resid NtGas Coal Elec Dist Resid NtGas Coal Gasln N
------ ----- ----- ----- ----- ----- ----- ----- ----- ----- ----- ----- ----- ----- ----- -
1 101 087 094 098 101 089 111 099 099 101 088 103 102 098 095 1
2 200 166 184 190 200 169 216 193 193 200 168 198 198 190 182 2
3 295 240 270 278 294 245 313 282 283 293 245 285 286 279 263 3
4 387 309 354 362 384 316 401 367 368 382 318 364 370 362 339 4
5 476 373 435 444 471 382 482 448 450 467 386 436 450 443 411 5
6 562 435 514 522 554 446 558 526 527 548 452 504 525 522 481 6
7 645 492 590 598 634 505 629 602 602 627 514 567 597 597 548 7
8 727 547 665 671 713 562 694 675 674 704 573 626 666 671 611 8
9 807 600 737 744 790 616 756 747 743 779 630 682 733 742 672 9
10 884 653 808 816 865 670 818 818 811 853 687 738 801 811 733 10 11 940 689 859 867 918 708 862 870 857 905 728 777 849 859 776 11 12 1011 738 924 933 987 760 920 935 918 972 782 830 911 922 835 12 13 1079 785 987 997 1053 810 977 999 977 1036 835 882 971 984 891 13 14 1147 832 1049 1060 1118 859 1034 1062 1035 1100 887 933 1030 1043 946 14 15 1212 878 1109 1122 1180 907 1089 1124 1091 1161 937 983 1088 1101 1000 15 16 1276 923 1168 1183 1242 954 1145 1186 1146 1221 987 1034 1146 1157 1052 16 17 1338 967 1225 1244 1301 1001 1200 1246 1199 1279 1036 1084 1203 1212 1103 17 18 1398 1012 1281 1303 1360 1047 1254 1306 1250 1336 1085 1133 1260 1266 1154 18 19 1457 1055 1336 1362 1416 1093 1308 1364 1300 1392 1132 1182 1315 1317 1203 19 20 1514 1098 1389 1419 1472 1138 1361 1423 1348 1446 1179 1229 1371 1368 1251 20 21 1570 1140 1442 1476 1526 1183 1413 1480 1395 1499 1226 1277 1426 1417 1299 21 22 1624 1182 1493 1533 1578 1227 1464 1537 1441 1551 1272 1323 1481 1465 1346 22 23 1677 1223 1543 1588 1630 1271 1515 1593 1486 1601 1317 1369 1536 1512 1391 23 24 1729 1263 1592 1642 1680 1314 1565 1647 1530 1651 1361 1414 1589 1558 1436 24 25 1779 1303 1640 1695 1729 1356 1614 1701 1573 1699 1405 1459 1642 1603 1480 25 26 1828 1342 1687 1747 1776 1397 1663 1753 1615 1745 1448 1503 1693 1646 1523 26 27 1876 1380 1733 1798 1822 1437 1711 1805 1656 1791 1490 1547 1744 1688 1565 27 28 1922 1417 1778 1848 1868 1477 1758 1856 1695 1836 1531 1589 1795 1730 1606 28 29 1968 1454 1822 1897 1912 1516 1805 1905 1734 1879 1571 1632 1844 1770 1647 29 30 2012 1490 1865 1944 1954 1555 1851 1954 1772 1921 1611 1674 1893 1810 1686 30
aOMB discount rate as of February 2008 See p 20 for instructions on use page xiii for abbreviations
Table Bb-4 OMB UPV Discount Factors adjusted for fuel price escalation by end-use sector and fuel type
24
Discount Rate = 24 (years 1 to 10) and 28 (years 11 to 30) (OMB Circular A-94a)
Census Region 4 (Alaska Arizona California Colorado HawaiiIdaho Montana Nevada New Mexico Oregon Utah Washington Wyoming)
RESIDENTIAL
COMMERCIAL INDUSTRIAL TRANSPORT
N Elec Dist LPG NtGas Elec Dist Resid NtGas Coal Elec Dist Resid NtGas Coal Gasln N
------ ----- ----- ----- ----- ----- ----- ----- ----- ----- ----- ----- ----- ----- ----- -
1 099 074 095 097 098 081 120 098 100 099 083 122 098 099 092 1
2 195 138 186 190 192 153 236 190 197 194 156 240 190 195 176 2
3 286 198 273 277 281 221 343 277 292 285 227 350 275 287 257 3
4 373 255 357 361 366 285 429 360 383 371 293 438 355 376 334 4
5 458 309 439 441 447 347 506 440 471 453 358 517 431 462 407 5
6 541 362 518 519 525 407 581 517 557 533 420 594 503 547 478 6
7 622 412 595 594 600 463 651 592 641 610 479 667 572 629 545 7
8 702 459 670 668 674 517 718 665 722 685 536 736 638 708 609 8
9 780 506 744 740 746 570 783 737 802 759 591 802 704 785 671 9
10 856 552 816 811 817 622 848 808 880 831 645 869 768 860 732 10 11 911 585 867 861 866 660 895 858 936 882 685 917 813 914 776 11 12 981 629 932 926 930 710 960 923 1009 948 738 983 871 984 835 12 13 1048 672 994 988 991 759 1024 985 1079 1011 790 1049 925 1051 891 13 14 1115 714 1055 1047 1051 808 1087 1045 1148 1073 841 1114 978 1118 945 14 15 1179 756 1115 1107 1109 855 1150 1104 1216 1132 890 1179 1030 1182 999 15 16 1243 797 1174 1165 1166 902 1213 1164 1282 1191 939 1243 1082 1246 1050 16 17 1305 838 1231 1224 1221 949 1275 1223 1347 1248 987 1307 1134 1308 1100 17 18 1365 879 1287 1281 1275 995 1336 1281 1411 1304 1035 1370 1186 1369 1148 18 19 1425 919 1343 1339 1328 1040 1396 1340 1474 1359 1081 1432 1238 1429 1196 19 20 1483 959 1397 1395 1380 1085 1456 1397 1535 1413 1127 1493 1290 1487 1242 20 21 1539 998 1450 1451 1431 1129 1514 1455 1595 1465 1173 1553 1342 1544 1287 21 22 1594 1037 1502 1507 1480 1173 1572 1513 1653 1517 1218 1612 1394 1599 1331 22 23 1648 1075 1553 1562 1528 1216 1629 1569 1710 1567 1262 1671 1446 1653 1374 23 24 1701 1112 1602 1616 1575 1258 1685 1625 1765 1615 1305 1728 1497 1706 1416 24 25 1752 1149 1651 1669 1621 1299 1740 1679 1819 1663 1347 1785 1547 1758 1457 25 26 1802 1184 1699 1721 1665 1340 1795 1732 1872 1709 1389 1841 1596 1808 1498 26 27 1851 1220 1745 1771 1709 1379 1849 1784 1923 1754 1430 1896 1645 1857 1537 27 28 1899 1254 1791 1821 1751 1418 1902 1836 1974 1799 1470 1951 1693 1905 1576 28 29 1946 1288 1835 1870 1793 1457 1954 1886 2023 1842 1509 2005 1740 1951 1614 29 30 1991 1321 1879 1917 1833 1494 2006 1935 2070 1884 1547 2058 1787 1997 1651 30
aOMB discount rate as of February 2008 See p 20 for instructions on use page xiii for abbreviations
Table Bb-5 OMB UPV Discount Factors adjusted for fuel price escalation by end-use sector and fuel type
25
Discount Rate = 24 (years 1 to 10) and 28 (years 11 to 30) (OMB Circular A-94a)
United States Average
RESIDENTIAL
COMMERCIAL INDUSTRIAL TRANSPORT
N Elec Dist LPG NtGas Elec Dist Resid NtGas Coal Elec Dist Resid NtGas Coal Gasln N
------ ----- ----- ----- ----- ----- ----- ----- ----- ----- ----- ----- ----- ----- ----- -
1 100 086 096 098 100 088 099 099 099 101 087 103 101 098 094 1
2 198 164 188 191 196 168 190 192 195 198 166 197 196 192 180 2
3 293 238 277 279 288 243 276 280 288 290 242 285 285 282 261 3
4 383 306 362 363 376 314 355 364 377 377 313 363 368 369 337 4
5 472 370 445 444 460 380 429 444 463 461 380 436 447 453 410 5
6 557 431 526 522 541 443 498 522 547 540 445 504 522 535 480 6
7 640 488 604 597 619 503 562 597 628 617 507 568 594 614 547 7
8 721 543 680 671 696 559 622 669 706 692 566 627 663 691 611 8
9 801 595 754 743 770 614 679 741 782 766 623 684 731 766 673 9
10 879 647 827 814 843 668 736 811 855 838 679 740 798 838 734 10 11 934 684 878 864 895 707 776 862 907 889 720 780 845 890 778 11 12 1005 732 945 929 962 758 830 926 974 955 774 833 906 956 836 12 13 1074 779 1009 992 1026 808 882 989 1040 1018 827 885 965 1020 893 13 14 1141 825 1071 1053 1089 857 934 1050 1104 1079 879 937 1022 1083 948 14 15 1206 871 1133 1114 1150 906 986 1111 1166 1139 929 988 1079 1145 1002 15 16 1270 916 1193 1173 1209 953 1037 1171 1226 1198 979 1039 1135 1205 1054 16 17 1332 960 1251 1232 1267 1000 1087 1230 1285 1255 1028 1089 1191 1263 1105 17 18 1392 1004 1308 1290 1324 1047 1137 1289 1343 1310 1076 1139 1246 1320 1155 18 19 1451 1047 1364 1348 1379 1093 1186 1346 1399 1364 1124 1188 1301 1375 1204 19 20 1508 1090 1419 1404 1433 1138 1234 1404 1454 1417 1171 1236 1355 1429 1252 20 21 1564 1132 1473 1460 1486 1182 1281 1461 1507 1469 1217 1283 1409 1482 1299 21 22 1618 1174 1526 1516 1537 1227 1328 1517 1560 1520 1263 1330 1463 1533 1345 22 23 1672 1214 1577 1570 1588 1270 1375 1572 1610 1569 1308 1376 1517 1584 1390 23 24 1723 1254 1628 1624 1637 1313 1421 1627 1660 1617 1352 1422 1569 1633 1435 24 25 1774 1294 1677 1676 1685 1355 1466 1680 1709 1664 1395 1467 1621 1680 1478 25 26 1823 1332 1725 1727 1731 1396 1511 1732 1756 1710 1438 1511 1672 1727 1521 26 27 1871 1370 1772 1778 1777 1436 1555 1783 1802 1755 1480 1555 1722 1772 1562 27 28 1918 1407 1818 1827 1821 1476 1598 1834 1847 1798 1521 1598 1771 1817 1603 28 29 1963 1444 1863 1875 1865 1515 1641 1883 1891 1841 1561 1641 1820 1860 1643 29 30 2008 1479 1907 1922 1907 1553 1684 1931 1934 1882 1600 1683 1868 1902 1682 30
aOMB discount rate as of February 2008 See p 20 for instructions on use page xiii for abbreviations
C Projected Average Fuel Price Indices and Escalation Rates (Real)
Tables Ca-1 through Ca-5 present projected fuel price indices for the four Census regions and for the United States These indices when multiplied by annual energy costs computed at base-date prices (ie as of April 1 2008) provide estimates of future-year costs (also as of April 1) in constant base-date dollars Constant-dollar cost estimates are needed when discounting is performed with a real discount rate (ie a rate that does not include general price inflation)
These indices were used in the calculation of the UPV factors for energy prices in the Ba and Bb tables in this publication While they are based on April 1 energy prices to maintain consistency in the computation of these UPV factors the level of precision implied here is not required for most LCC analyses That is the analyst need not calibrate base-year energy prices precisely to April 1 2008 levels to use these indices (or the corresponding UPV factors) instead the analyst should use current price levels as of the base-date of the LCC analysis regardless of the time of the year that the study is undertaken
Example of How to Use the Indices
To estimate the price of industrial coal in 2012 in Connecticut (in constant 2008 dollars) go to Table Ca-1 find the year 2012 index for industrial coal (098) and multiply by the price for industrial coal in Connecticut in 2008
For further explanation of how to use these tables see NIST Handbook 135
Tables Cb-1 through Cb-5 present the projected average fuel price escalation rates (percentage change compounded annually) for selected periods from 2008 to 2038 for the four Census regions and for the overall United States Note that these are real rates exclusive of general price inflation Their use results in prices expressed in constant dollars
The average fuel escalation rates consolidate the information provided by the indices in the Ca tables so that trends in projected price changes can be seen at a glance They are provided primarily to accommodate computer programs (such as BLCC) which require price escalation rates as inputs
Unless there is a compelling reason to use escalation rates it is recommended that you use the indices in the Ca tables when you need estimates of future-year energy prices since the indices include year-to-year information rather than averages over a number of years
Example of How to Use the Escalation Rates
To estimate the unit price of residential natural gas at the end of 2018 (p18) in Wyoming using the DOE energy price escalation rates go to Table Cb-4 and find the 2008 to 2013 and the 2013 to 2018 escalation rates for residential natural gas (-20 for 5 years and -01 for 5 years respectively) Enter these values and the unit price of residential natural gas in Wyoming in 2008 (p08) into the following formula Then solve for the 2018 energy price (stated in 2008 dollars)
26
N ki
py = p0 timesprod(1+ ei ) i=1
p18 = p08 times (1+ e1 )k1 times (1+ e2 )k2
= p08 times (1minus 002)5 times (1minus 0001)5
= p08 times 09039 times 09950 = p08 times 0899
where py = price at end of year y p0 = unit price at base date ei = annual compound escalation rate for period i from the Cb tables (in decimal form) and ki = number of years over which escalation rate ei occurs
Note that the compounded escalation rate factor (0899) corresponds to the fuel price index in region 4 residential natural gas for the year 2018 in table Ca-4 (090)
The data in the Ca and Cb tables on the following pages are reported for the four Census regions and the US average Figure B-1 on page 13 presents a map showing the states corresponding to the four Census regions The Census regions do not include American Samoa Canal Zone Guam Puerto Rico Trust Territory of the Pacific Islands or the Virgin Islands Analysts of federal projects in these areas should use data which are reasonable under the circumstances and may refer to the tables with US average data for guidance
27
Table Ca-1 Projected fuel price indices (excluding general inflation) by end-use sector and fuel type
28
Census Region 1 (Connecticut Maine Massachusetts New HampshireNew Jersey New York Pennsylvania Rhode Island Vermont)
----------------- Projected April 1 Fuel Price Indices (April 1 2008 = 100)
----- ----- ----- ----- ----- ----- ----- ----- ----- ----- ----- ----- ----- ----- ----- Sector and Fuel 2009 2010 2011 2012 2013 2014 2015 2016 2017 2018 2019 2020 2021 2022 2023 ----------------- ----- ----- ----- ----- ----- ----- ----- ----- ----- ----- ----- ----- ----- ----- -----
Residential ElectricityDistillate Oil
103 089
101 083
100 079
100 076
100 073
099 071
099 069
099 066
100 066
101 066
101 067
100 068
099 068
100 069
100 070
LPG 096 093 092 091 091 090 089 089 089 089 089 089 089 089 089
Natural Gas 101 099 097 095 093 092 091 091 091 092 093 092 092 093 094
Commercial ElectricityDistillate Oil
102 092
098 085
095 083
093 079
091 076
090 074
089 072
089 070
090 069
091 070
091 071
091 073
090 073
090 074
091 074
Residual Oil 100 094 090 087 083 079 075 071 070 071 073 074 075 076 077
Natural Gas 102 099 096 094 092 091 089 089 090 091 092 092 091 092 093
Coal 101 099 095 091 088 088 087 085 083 082 081 081 081 082 082
Industrial ElectricityDistillate Oil
102 091
097 085
091 084
089 081
086 077
084 077
083 075
083 072
083 072
084 072
084 074
083 077
082 077
082 077
083 078
Residual Oil 100 094 090 086 082 079 075 071 070 071 073 074 075 076 077
Natural Gas 103 099 096 093 090 087 085 084 084 085 086 085 084 085 085
Coal 100 099 099 098 098 097 096 096 095 094 094 094 094 094 094
TransportationMotor Gasoline 096 088 086 083 081 080 078 076 075 076 078 080 080 081 081
----------------- ----- ----- ----- ----- ----- ----- ----- ----- ----- ----- ----- ----- ----- ----- -----
Table Ca-1 continued Projected fuel price indices (excluding general inflation) by end-use sector and fuel type
29
Census Region 1 (Connecticut Maine Massachusetts New HampshireNew Jersey New York Pennsylvania Rhode Island Vermont)
----------------- Projected April 1 Fuel Price Indices (April 1 2008 = 100)
----- ----- ----- ----- ----- ----- ----- ----- ----- ----- ----- ----- ----- ----- ----- Sector and Fuel 2024 2025 2026 2027 2028 2029 2030 2031 2032 2033 2034 2035 2036 2037 2038 ----------------- ----- ----- ----- ----- ----- ----- ----- ----- ----- ----- ----- ----- ----- ----- -----
Residential ElectricityDistillate Oil
100 071
101 072
101 073
101 074
101 075
102 076
102 077
102 078
103 078
103 079
103 080
103 080
103 081
104 082
104 082
LPG 090 090 090 090 091 092 092 092 093 093 094 094 095 095 096
Natural Gas 095 096 097 098 099 101 102 103 103 104 105 105 106 107 107
Commercial ElectricityDistillate Oil
091 075
092 076
092 078
092 079
093 080
094 081
094 082
095 083
095 084
095 085
096 085
096 086
097 087
097 088
097 089
Residual Oil 079 080 081 081 082 084 085 087 088 089 091 092 093 095 096
Natural Gas 095 096 097 098 100 102 104 105 105 106 107 108 109 109 110
Coal 083 083 083 084 085 086 086 087 087 087 088 088 088 088 088
Industrial ElectricityDistillate Oil
084 078
084 079
085 081
085 082
086 083
086 084
087 085
087 086
087 087
088 088
088 088
089 089
089 090
089 091
090 091
Residual Oil 078 079 081 081 082 083 085 086 087 089 090 091 092 094 095
Natural Gas 087 088 089 090 092 094 095 096 097 099 100 101 102 103 104
Coal 094 094 093 094 094 094 094 095 095 095 095 096 096 096 096
TransportationMotor Gasoline 082 082 082 083 084 085 085 086 087 087 088 088 089 089 090
----------------- ----- ----- ----- ----- ----- ----- ----- ----- ----- ----- ----- ----- ----- ----- -----
Table Ca-2 Projected fuel price indices (excluding general inflation) by end-use sector and fuel type
30
Census Region 2 (Illinois Indiana Iowa Kansas Michigan MinnesotaMissouri Nebraska North Dakota Ohio South Dakota Wisconsin)
----------------- Projected April 1 Fuel Price Indices (April 1 2008 = 100)
----- ----- ----- ----- ----- ----- ----- ----- ----- ----- ----- ----- ----- ----- ----- Sector and Fuel 2009 2010 2011 2012 2013 2014 2015 2016 2017 2018 2019 2020 2021 2022 2023 ----------------- ----- ----- ----- ----- ----- ----- ----- ----- ----- ----- ----- ----- ----- ----- ----- Residential
ElectricityDistillate Oil
103 086
104 079
103 076
102 072
101 068
100 067
100 064
100 062
100 061
101 062
101 062
101 063
101 063
101 064
101 065
LPG 101 100 099 098 097 096 095 095 095 095 096 095 095 095 096
Natural Gas 100 097 094 092 090 088 087 087 087 088 089 088 087 088 089
Commercial
ElectricityDistillate Oil
103 088
104 081
102 079
100 075
098 072
096 070
095 068
095 065
095 065
096 065
096 067
096 068
096 069
096 069
096 070
Residual Oil 111 106 101 088 082 080 077 074 073 074 076 079 080 081 083
Natural Gas 101 097 093 091 089 087 086 086 086 087 088 088 087 088 089
Coal 102 102 103 103 103 103 102 102 101 101 100 100 100 101 101
Industrial
ElectricityDistillate Oil
104 091
104 084
101 084
098 080
095 077
093 076
092 074
092 072
092 072
093 072
093 074
092 076
092 076
091 077
092 077
Residual Oil 108 102 097 086 081 079 076 072 071 072 074 076 077 078 080
Natural Gas 103 100 096 093 090 087 086 085 085 086 087 085 084 084 086
Coal 100 100 099 098 097 097 097 096 096 097 097 097 096 097 097
Transportation
Motor Gasoline 098 090 088 086 083 082 080 078 078 079 081 083 083 083 083
----------------- ----- ----- ----- ----- ----- ----- ----- ----- ----- ----- ----- ----- ----- ----- -----
Table Ca-2 continued Projected fuel price indices (excluding general inflation) by end-use sector and fuel type
31
Census Region 2 (Illinois Indiana Iowa Kansas Michigan MinnesotaMissouri Nebraska North Dakota Ohio South Dakota Wisconsin)
----------------- Projected April 1 Fuel Price Indices (April 1 2008 = 100)
----- ----- ----- ----- ----- ----- ----- ----- ----- ----- ----- ----- ----- ----- ----- Sector and Fuel 2024 2025 2026 2027 2028 2029 2030 2031 2032 2033 2034 2035 2036 2037 2038 ----------------- ----- ----- ----- ----- ----- ----- ----- ----- ----- ----- ----- ----- ----- ----- -----
Residential ElectricityDistillate Oil
101 066
100 067
100 068
100 069
100 070
100 071
101 072
101 073
101 074
101 074
101 075
101 076
101 076
101 077
101 078
LPG 096 097 097 098 099 100 100 101 102 102 103 104 104 105 105
Natural Gas 091 092 094 095 096 098 100 101 102 103 103 104 105 106 107
Commercial ElectricityDistillate Oil
096 071
096 072
096 073
096 074
097 075
097 077
098 078
098 079
099 080
099 080
099 081
099 082
099 083
100 083
100 084
Residual Oil 084 086 087 088 089 090 092 093 094 096 097 098 100 101 102
Natural Gas 091 092 094 095 097 100 101 103 103 104 105 106 107 108 109
Coal 101 100 100 100 101 101 101 101 102 102 102 103 103 103 103
Industrial ElectricityDistillate Oil
092 078
092 079
091 080
091 081
092 082
092 083
093 085
093 086
093 086
093 087
093 088
094 089
094 089
094 090
094 091
Residual Oil 081 083 084 085 086 087 088 090 091 092 093 095 096 097 099
Natural Gas 088 089 091 092 095 097 099 101 102 103 104 105 107 108 109
Coal 098 098 099 099 099 100 100 100 100 101 101 101 102 102 102
TransportationMotor Gasoline 083 084 084 085 086 087 088 088 089 089 090 091 091 092 092
----------------- ----- ----- ----- ----- ----- ----- ----- ----- ----- ----- ----- ----- ----- ----- -----
----------------- ----- ----- ----- ----- ----- ----- ----- ----- ----- ----- ----- ----- ----- ----- -----
----------------- ----- ----- ----- ----- ----- ----- ----- ----- ----- ----- ----- ----- ----- ----- -----
----------------- ----- ----- ----- ----- ----- ----- ----- ----- ----- ----- ----- ----- ----- ----- -----
32
Table Ca-3 Projected fuel price indices (excluding general inflation) by end-use sector and fuel type
Census Region 3 (Alabama Arkansas Delaware District of Columbia Florida GeorgiaKentucky Louisiana Maryland Mississippi North Carolina Oklahoma South Carolina
Tennessee Texas Virginia West Virginia)
Projected April 1 Fuel Price Indices (April 1 2008 = 100)
Sector and Fuel 2009 2010 2011 2012 2013 2014 2015 2016 2017 2018 2019 2020 2021 2022 2023
Residential ElectricityDistillate Oil
103 089
104 083
102 079
101 076
100 073
099 071
099 068
099 066
099 066
099 066
099 067
099 067
099 068
099 068
099 069
LPG 097 094 093 092 091 091 090 090 090 090 091 091 090 091 091
Natural Gas 100 097 094 093 092 090 089 089 090 091 092 092 092 093 094
Commercial ElectricityDistillate Oil
103 091
103 084
101 082
099 078
098 074
096 073
095 071
095 068
095 067
095 068
095 070
095 071
095 072
095 072
095 073
Residual Oil 114 110 104 097 091 088 083 079 078 078 080 081 082 083 084
Natural Gas 102 098 095 093 092 090 089 089 089 090 091 092 092 093 094
Coal 101 099 097 093 092 090 088 087 086 085 085 085 085 085 085
Industrial ElectricityDistillate Oil
104 090
103 084
100 083
098 080
096 077
094 076
093 074
093 071
093 071
093 072
093 074
093 076
093 076
093 076
093 077
Residual Oil 106 099 094 086 081 079 075 071 070 071 072 073 074 075 077
Natural Gas 104 101 096 092 089 087 084 083 084 085 086 086 086 087 088
Coal 100 097 095 092 091 090 089 089 088 088 087 088 088 088 088
TransportationMotor Gasoline 098 091 087 084 081 080 078 076 076 077 079 081 081 081 081
----------------- ----- ----- ----- ----- ----- ----- ----- ----- ----- ----- ----- ----- ----- ----- -----
----------------- ----- ----- ----- ----- ----- ----- ----- ----- ----- ----- ----- ----- ----- ----- -----
----------------- ----- ----- ----- ----- ----- ----- ----- ----- ----- ----- ----- ----- ----- ----- -----
33
Table Ca-3 continued Projected fuel price indices (excluding general inflation) by end-use sector and fuel type
Census Region 3 (Alabama Arkansas Delaware District of Columbia Florida GeorgiaKentucky Louisiana Maryland Mississippi North Carolina Oklahoma South Carolina
Tennessee Texas Virginia West Virginia)
Projected April 1 Fuel Price Indices (April 1 2008 = 100)
Sector and Fuel 2024 2025 2026 2027 2028 2029 2030 2031 2032 2033 2034 2035 2036 2037 2038
Residential ElectricityDistillate Oil
099 070
099 071
099 073
099 073
100 074
100 076
100 077
100 078
100 078
100 079
100 079
101 080
101 081
101 082
101 082
LPG 091 092 092 092 093 094 094 095 095 096 096 097 097 098 098
Natural Gas 095 097 098 098 100 102 103 104 105 106 106 107 108 109 109
Commercial ElectricityDistillate Oil
095 074
095 075
096 076
096 077
096 078
097 080
097 081
097 082
097 083
097 084
097 085
098 085
098 086
098 087
098 088
Residual Oil 086 088 090 090 092 093 094 096 097 099 100 101 103 104 106
Natural Gas 095 097 098 099 101 103 104 105 106 107 108 109 110 110 111
Coal 085 085 084 084 084 084 085 085 085 085 086 086 086 086 087
Industrial ElectricityDistillate Oil
093 077
093 078
094 080
094 081
095 082
095 083
095 085
095 085
095 086
096 087
096 088
096 088
096 089
097 090
097 091
Residual Oil 078 080 081 082 083 084 085 087 088 089 090 092 093 094 096
Natural Gas 090 092 093 094 097 099 101 102 104 105 106 108 109 111 112
Coal 088 088 088 088 088 088 088 088 089 089 089 089 090 090 090
TransportationMotor Gasoline 081 082 083 083 084 085 086 086 087 088 088 089 089 090 091
Table Ca-4 Projected fuel price indices (excluding general inflation) by end-use sector and fuel type
34
Census Region 4 (Alaska Arizona California Colorado HawaiiIdaho Montana Nevada New Mexico Oregon Utah Washington Wyoming)
----------------- Projected April 1 Fuel Price Indices (April 1 2008 = 100)
----- ----- ----- ----- ----- ----- ----- ----- ----- ----- ----- ----- ----- ----- -----
Sector and Fuel 2009 2010 2011 2012 2013 2014 2015 2016 2017 2018 2019 2020 2021 2022 2023
----------------- ----- ----- ----- ----- ----- ----- ----- ----- ----- ----- ----- ----- ----- ----- -----
Residential ElectricityDistillate Oil
101 076
100 067
098 064
096 063
095 062
096 060
096 059
096 058
097 057
097 058
098 060
097 061
097 062
098 062
098 063
LPG 098 095 094 093 092 091 091 091 091 091 091 091 090 090 090
Natural Gas 100 097 094 092 090 089 089 089 089 090 091 090 088 088 090
Commercial ElectricityDistillate Oil
101 083
099 076
096 073
093 071
091 069
090 069
089 067
089 065
089 065
089 066
089 068
089 070
088 071
088 071
088 072
Residual Oil 123 122 115 094 087 086 083 081 080 082 086 090 092 093 095
Natural Gas 100 097 093 092 090 089 088 088 089 090 091 090 088 088 090
Coal 102 102 101 100 100 100 099 098 098 100 100 101 101 101 102
Industrial ElectricityDistillate Oil
101 085
100 077
097 076
094 073
093 072
092 072
091 070
091 068
091 068
091 069
092 072
091 074
090 074
091 075
091 075
Residual Oil 125 124 118 097 089 088 086 083 083 084 088 092 094 096 098
Natural Gas 101 096 091 088 085 083 082 081 081 081 082 081 077 077 079
Coal 101 100 099 098 097 097 096 096 096 096 096 097 097 097 098
TransportationMotor Gasoline 094 089 087 085 082 081 079 077 077 078 079 081 080 080 081
----------------- ----- ----- ----- ----- ----- ----- ----- ----- ----- ----- ----- ----- ----- ----- -----
Table Ca-4 continued Projected fuel price indices (excluding general inflation) by end-use sector and fuel type
35
Census Region 4 (Alaska Arizona California Colorado HawaiiIdaho Montana Nevada New Mexico Oregon Utah Washington Wyoming)
----------------- Projected April 1 Fuel Price Indices (April 1 2008 = 100)
----- ----- ----- ----- ----- ----- ----- ----- ----- ----- ----- ----- ----- ----- ----- Sector and Fuel 2024 2025 2026 2027 2028 2029 2030 2031 2032 2033 2034 2035 2036 2037 2038 ----------------- ----- ----- ----- ----- ----- ----- ----- ----- ----- ----- ----- ----- ----- ----- -----
Residential ElectricityDistillate Oil
098 065
099 065
100 067
100 068
100 069
101 070
101 071
102 072
102 072
102 073
103 073
103 074
104 075
104 075
104 076
LPG 091 092 093 093 094 095 096 096 097 097 098 098 099 099 100
Natural Gas 091 093 095 097 098 101 103 104 104 105 106 107 108 108 109
Commercial ElectricityDistillate Oil
088 073
089 074
089 076
089 077
090 078
091 079
091 080
091 081
091 082
091 082
091 083
092 084
092 084
092 085
092 086
Residual Oil 097 099 101 102 103 104 106 107 109 110 112 113 115 116 118
Natural Gas 092 094 097 098 100 103 105 107 108 108 109 110 111 112 113
Coal 103 104 105 106 106 107 107 107 108 108 108 109 109 109 110
Industrial ElectricityDistillate Oil
091 076
092 077
092 078
093 079
093 080
094 081
094 082
094 083
095 084
095 084
095 085
095 086
096 087
096 087
096 088
Residual Oil 100 102 104 105 106 107 109 110 112 113 115 116 118 120 121
Natural Gas 081 083 086 088 090 093 096 098 099 100 101 103 104 105 107
Coal 099 100 100 100 101 102 102 102 102 103 103 103 104 104 104
TransportationMotor Gasoline 080 080 080 080 080 081 081 081 082 082 083 083 084 085 085
----------------- ----- ----- ----- ----- ----- ----- ----- ----- ----- ----- ----- ----- ----- ----- -----
Table Ca-5 Projected fuel price indices (excluding general inflation) by end-use sector and fuel type
36
United States Average
----------------- Projected April 1 Fuel Price Indices (April 1 2008 = 100)
----- ----- ----- ----- ----- ----- ----- ----- ----- ----- ----- ----- ----- ----- ----- Sector and Fuel 2009 2010 2011 2012 2013 2014 2015 2016 2017 2018 2019 2020 2021 2022 2023 ----------------- ----- ----- ----- ----- ----- ----- ----- ----- ----- ----- ----- ----- ----- ----- -----
Residential ElectricityDistillate Oil
103 089
103 082
101 078
100 075
099 072
099 070
098 068
098 066
098 065
099 066
099 066
099 067
098 068
099 068
099 069
LPG 099 096 095 094 093 093 092 092 092 092 093 092 092 092 093
Natural Gas 100 097 095 093 091 090 089 089 089 090 091 090 090 090 091
Commercial ElectricityDistillate Oil
102 090
101 084
099 081
097 078
095 074
093 073
092 071
092 068
093 068
093 068
093 070
093 072
092 072
092 072
092 073
Residual Oil 102 096 092 087 083 080 076 072 071 072 073 075 076 077 078
Natural Gas 101 098 094 093 091 089 088 088 088 089 090 090 089 090 092
Coal 102 101 100 098 097 096 095 095 094 094 093 094 094 094 094
Industrial ElectricityDistillate Oil
103 089
102 082
099 082
096 079
094 076
092 075
091 073
091 071
091 070
091 071
092 073
091 076
091 076
091 076
091 077
Residual Oil 105 099 094 087 082 079 075 071 070 071 073 074 075 076 077
Natural Gas 103 100 095 092 089 086 084 083 084 085 086 085 084 084 086
Coal 100 098 097 096 095 094 094 093 093 092 092 092 092 093 093
TransportationMotor Gasoline 096 090 087 084 082 081 079 077 077 077 079 081 081 081 081
----------------- ----- ----- ----- ----- ----- ----- ----- ----- ----- ----- ----- ----- ----- ----- -----
Table Ca-5 continued Projected fuel price indices (excluding general inflation) by end-use sector and fuel type
37
United States Average
----------------- Projected April 1 Fuel Price Indices (April 1 2008 = 100)
----- ----- ----- ----- ----- ----- ----- ----- ----- ----- ----- ----- ----- ----- ----- Sector and Fuel 2024 2025 2026 2027 2028 2029 2030 2031 2032 2033 2034 2035 2036 2037 2038 ----------------- ----- ----- ----- ----- ----- ----- ----- ----- ----- ----- ----- ----- ----- ----- ----- Residential
ElectricityDistillate Oil
099 070
099 071
099 072
099 073
100 074
100 075
100 076
100 077
101 078
101 078
101 079
101 080
101 080
101 081
102 082
LPG 093 094 094 095 095 096 097 097 098 098 099 099 100 100 101
Natural Gas 093 094 096 097 098 100 102 103 104 104 105 106 107 107 108
Commercial
ElectricityDistillate Oil
093 074
093 075
093 076
093 077
094 079
094 080
094 081
095 082
095 083
095 084
096 084
096 085
096 086
096 087
097 088
Residual Oil 079 081 082 082 083 085 086 088 089 090 092 093 094 096 097
Natural Gas 093 095 097 098 100 102 103 105 105 106 107 108 109 110 111
Coal 094 095 095 095 095 095 096 096 096 097 097 097 097 098 098
Industrial
ElectricityDistillate Oil
091 077
091 078
091 079
091 080
092 081
093 083
093 084
093 085
094 086
094 086
094 087
094 088
094 089
095 089
095 090
Residual Oil 079 080 082 082 083 085 086 087 089 090 091 092 094 095 096
Natural Gas 088 089 091 092 095 097 099 101 102 103 105 106 107 108 110
Coal 093 093 094 094 094 094 094 095 095 095 096 096 096 096 096
Transportation
Motor Gasoline 081 082 082 083 083 084 085 085 086 087 087 088 088 089 089
----------------- ----- ----- ----- ----- ----- ----- ----- ----- ----- ----- ----- ----- ----- ----- -----
----------------- ----- ----- ----- ----- ----- -----
----------------- ----- ----- ----- ----- ----- -----
----------------- ----- ----- ----- ----- ----- -----
Table Cb-1 Projected average fuel price escalation rates excluding general inflation by end-use sector and fuel type
Census Region 1 (Connecticut Maine Massachusetts New HampshireNew Jersey New York Pennsylvania Rhode Island Vermont)
Percentage change compounded annually
2008 2013 2018 2023 2028 2033 Sector and Fuel to to to to to to
2013 2018 2023 2028 2033 2038
Residential Electricity -01 02 -01 03 03 02 Distillate Oil -62 -18 09 14 11 08 LPG -20 -03 00 04 05 05 Natural Gas -14 -03 04 12 10 06
Commercial Electricity -18 -02 00 06 05 04 Distillate Oil -54 -16 13 14 12 09 Residual Oil -37 -29 16 13 16 15 Natural Gas -16 -03 05 14 12 08 Coal -24 -15 01 07 05 03
Industrial Electricity -29 -05 -03 07 05 04 Distillate Oil -50 -13 14 12 12 09 Residual Oil -38 -28 15 13 16 14 Natural Gas -22 -10 01 14 14 11 Coal -03 -09 00 -01 03 03
TransportationMotor Gasoline -41 -12 13 06 08 07
38
----------------- ----- ----- ----- ----- ----- -----
----------------- ----- ----- ----- ----- ----- -----
----------------- ----- ----- ----- ----- ----- -----
Table Cb-2 Projected average fuel price escalation rates excluding general inflation by end-use sector and fuel type
Census Region 2 (Illinois Indiana Iowa Kansas Michigan MinnesotaMissouri Nebraska North Dakota Ohio South Dakota Wisconsin)
Percentage change compounded annually
2008 2013 2018 2023 2028 2033 Sector and Fuel to to to to to to
2013 2018 2023 2028 2033 2038
Residential Electricity 02 -00 -01 -01 01 -00 Distillate Oil -73 -20 11 15 11 09 LPG -07 -03 00 07 07 06 Natural Gas -21 -04 03 16 12 08
Commercial Electricity -04 -04 01 01 04 02 Distillate Oil -65 -17 14 15 13 09 Residual Oil -38 -21 23 16 14 14 Natural Gas -23 -04 04 18 14 09 Coal 06 -04 00 00 03 03
Industrial Electricity -10 -05 -02 00 04 01 Distillate Oil -51 -13 14 12 12 08 Residual Oil -42 -23 20 16 14 14 Natural Gas -21 -09 00 20 17 12 Coal -06 -01 01 04 04 03
TransportationMotor Gasoline -36 -11 11 06 08 07
39
----------------- ----- ----- ----- ----- ----- -----
----------------- ----- ----- ----- ----- ----- -----
----------------- ----- ----- ----- ----- ----- -----
Table Cb-3 Projected average fuel price escalation rates excluding general inflation by end-use sector and fuel type
Census Region 3 (Alabama Arkansas Delaware District of Columbia FloridaGeorgia Kentucky Louisiana Maryland Mississippi North Carolina Oklahoma South
Carolina Tennessee Texas Virginia West Virginia)
Percentage change compounded annually
2008 2013 2018 2023 2028 2033 Sector and Fuel to to to to to to
2013 2018 2023 2028 2033 2038
Residential Electricity 00 -03 01 01 01 01 Distillate Oil -62 -18 09 14 11 09 LPG -18 -02 02 05 05 05 Natural Gas -17 -02 07 13 11 07
Commercial Electricity -05 -05 00 02 02 02 Distillate Oil -58 -17 14 15 13 09 Residual Oil -19 -29 15 17 14 14 Natural Gas -17 -03 08 14 12 08 Coal -18 -14 -01 -02 03 04
Industrial Electricity -09 -06 -00 03 02 02 Distillate Oil -52 -13 14 12 13 09 Residual Oil -41 -28 16 17 14 14 Natural Gas -22 -10 07 18 17 13 Coal -18 -08 00 00 03 02
TransportationMotor Gasoline -40 -12 12 06 08 07
40
----------------- ----- ----- ----- ----- ----- -----
----------------- ----- ----- ----- ----- ----- -----
----------------- ----- ----- ----- ----- ----- -----
Table Cb-4 Projected average fuel price escalation rates excluding general inflation by end-use sector and fuel type
Census Region 4 (Alaska Arizona California Colorado HawaiiIdaho Montana Nevada New Mexico Oregon Utah Washington Wyoming)
Percentage change compounded annually
2008 2013 2018 2023 2028 2033 Sector and Fuel to to to to to to
2013 2018 2023 2028 2033 2038
Residential Electricity -09 03 02 05 04 04 Distillate Oil -93 -10 16 18 10 08 LPG -17 -02 -02 07 07 05 Natural Gas -20 -01 -01 19 14 08
Commercial Electricity -19 -04 -03 05 03 02 Distillate Oil -70 -10 18 16 11 09 Residual Oil -28 -12 31 16 13 13 Natural Gas -21 00 01 22 15 08 Coal -01 00 06 07 03 04
Industrial Electricity -15 -02 -02 06 04 03 Distillate Oil -63 -08 17 13 11 08 Residual Oil -22 -13 31 16 13 13 Natural Gas -32 -09 -07 28 21 13 Coal -05 -03 05 05 04 03
TransportationMotor Gasoline -38 -11 07 -01 05 07
41
----------------- ----- ----- ----- ----- ----- -----
----------------- ----- ----- ----- ----- ----- -----
----------------- ----- ----- ----- ----- ----- -----
Table Cb-5 Projected average fuel price escalation rates excluding general inflation by end-use sector and fuel type
United States Average
Percentage change compounded annually
2008 2013 2018 2023 2028 2033 Sector and Fuel to to to to to to
2013 2018 2023 2028 2033 2038
Residential Electricity -02 -01 00 02 02 02 Distillate Oil -64 -18 10 14 11 09 LPG -14 -02 01 06 06 06 Natural Gas -18 -03 03 15 12 07
Commercial Electricity -11 -04 -01 03 04 02 Distillate Oil -58 -16 13 14 13 09 Residual Oil -36 -29 16 14 16 15 Natural Gas -19 -03 05 17 13 08 Coal -06 -07 01 03 03 03
Industrial Electricity -13 -05 -02 03 04 02 Distillate Oil -54 -12 15 12 12 09 Residual Oil -40 -27 17 15 15 14 Natural Gas -23 -10 02 20 18 13 Coal -11 -05 02 02 03 03
TransportationMotor Gasoline -39 -11 11 04 07 07
42
PART IIENERGY PRICE INDICES FOR PRIVATE SECTOR LCC ANALYSIS
This section presents tables of projected nominal (ie including inflation) fuel price indices for four fuels in the residential sector and five fuels in the commercial sector for each of the years from 2008 through 2038 These price indices are based on the DOE energy price projections reported in Part I Section B of this document used to calculate the FEMP and OMB UPV factors for energy costs Tables S-1 to S-5 are provided as an update to similar tables originally published in Comprehensive Guide for Least-Cost Energy Decisions (NBS SP 709)
As a convenience for the user the indices include the effect of four alternative hypothetical rates of general price inflation 2 3 4 and 5 Selection of these rates is in no way intended to suggest what actual rates might be Use of the indices produce price estimates in current dollars inclusive of general price inflation Current-dollar prices are needed when discounting is performed with discount rates that include general price inflation (ie nominal or market discount rates)
The calculated indices with inflation rates of 2 3 4 and 5 allow the analyst to perform evaluations based on the assumption of a positive rate of general price inflation that changes the purchasing power of the dollar Performing evaluations in current dollars is sometimes preferred for private investment decisions primarily because it facilitates the treatment of taxes
The indices in Tables S-1 through S-5 are derived from the indices reported in Tables Ca-1 through Ca-5 by means of the following equation
IS = IC times (1+ g )N
where IS = index found in Tables S-1 through S-5 IC = index found in Tables Ca-1 through Ca-5 g = annual rate of general price inflation in decimal form and N = number of years in this case equal to the year of the index minus 2007
Example of How to Use the Indices
Suppose you wish to estimate the annual cost of natural gas for a house in Maryland in year 2011 given the annual cost in 2008 (April 1) prices and you expect an annual inflation rate of 3 per year From table S-3 find the column with residential natural gas indices at an inflation rate of 3 then locate the index for the year 2011 This index is 103 Multiply the annual cost in 2008 prices by the index to find the estimated annual cost in year 2011 prices
If this annual cost in year-2011 prices is to be discounted to present value you must use a nominal discount rate that includes the same assumption with regard to general price inflation (3 in this example) To obtain a present-value cost over the entire study period the present-value calculation must be repeated for each year that there are natural gas costs and the results summed (UPV factors are not given for private sector use because of the large number of
43
tables required to cover potential discount rates that might be used by the analyst) The BLCC computer program can perform LCC analyses using any inflation rate and discount rate in constant or in current (market) dollars The DISCOUNT program included with BLCC can compute UPV factors based on DOE energy price escalation rates using any inflation rate and discount rate (See page iv for more information on these programs) Of course the private sector analyst may use the UPV factors reported in Part I provided the analysis is performed in constant dollars and the desired discount rate corresponds to the DOE or OMB discount rates used in Part I
For further explanation of the use of these indices see NBS Special Publication 709 appendix B Part I
The data in the tables that follow are reported for the four Census regions and the US average Figure B-1 on page 13 presents a map showing the states corresponding to the four Census regions The Census regions do not include American Samoa Canal Zone Guam Puerto Rico Trust Territory of the Pacific Islands or the Virgin Islands Analysts of federal projects in these areas should use data which are reasonable under the circumstances and may refer to the tables with US average data for guidance
44
45
Table S-1 Projected fuel price indices with assumed general price inflation rates of 2 3 4 and 5 by end-use sector and fuel type
Census Region 1 (Connecticut Maine Massachusetts New HampshireNew Jersey New York Pennsylvania Rhode Island Vermont)
Projected April 1 Fuel Price Indices (April 1 2008 = 100)
--------------------------------------------------RESIDENTIAL---------------------------------------------------
Electricity
------------------------
Distillate Oil ------------------------
LPG ------------------------
Natural Gas ------------------------
Inflation Rate
Inflation Rate Inflation Rate Inflation Rate Year 2 3 4 5 2 3 4 5 2 3 4 5 2 3 4 5 2009 105 106 107 108 091 092 093 094 098 099 100 101 103 104 105 106 2010 105 108 110 112 086 088 089 091 097 099 101 103 103 105 107 109 2011 106 109 112 115 084 087 089 092 098 101 104 107 102 105 109 112 2012 108 113 117 122 082 086 089 092 099 103 107 111 103 107 111 115 2013 110 115 121 127 080 084 089 093 100 105 110 116 103 108 114 119 2014 112 118 125 133 080 085 090 095 101 107 114 120 103 110 116 123 2015 114 122 130 139 079 084 090 097 102 110 117 125 104 112 120 128 2016 116 126 136 147 078 084 091 098 104 113 122 131 106 115 124 134 2017 120 131 142 155 079 086 094 102 106 116 127 138 109 119 130 141 2018 123 135 149 164 081 089 098 108 109 120 132 145 112 123 136 150 2019 125 139 155 172 084 093 103 115 111 124 138 153 115 128 143 158 2020 127 143 160 180 086 097 108 122 113 127 143 160 117 132 148 166 2021 129 146 166 188 088 100 114 129 115 130 148 167 119 135 153 173 2022 131 151 172 197 091 104 119 136 117 135 154 176 122 140 160 183 2023 135 156 180 208 094 108 125 145 120 139 161 185 126 146 169 195 2024 138 161 188 219 097 113 132 154 123 144 168 195 130 152 177 207 2025 141 166 196 231 100 118 140 164 126 149 175 206 134 158 186 219 2026 144 172 204 243 104 124 147 175 129 154 183 217 139 165 196 233 2027 147 177 213 255 107 129 155 186 132 159 190 228 142 171 206 247 2028 151 183 222 269 111 135 164 198 135 164 199 241 147 179 217 263 2029 154 189 232 283 115 141 173 211 139 170 209 255 153 187 229 281 2030 158 196 242 299 119 148 182 225 142 176 218 269 158 195 242 298 2031 161 202 252 314 123 153 192 239 146 182 228 284 162 203 253 316 2032 165 209 263 331 126 159 201 253 149 189 238 299 166 210 265 334 2033 169 215 274 348 130 166 211 268 153 195 249 316 171 218 278 353 2034 172 222 286 366 133 172 221 283 157 202 260 333 175 226 290 372 2035 176 229 298 385 137 179 232 300 161 209 271 352 180 234 304 394 2036 180 237 310 406 141 185 243 318 165 217 284 371 185 243 318 416 2037 184 244 323 427 145 193 255 337 169 224 297 391 190 252 333 440 2038 188 252 337 449 149 200 267 356 173 232 310 413 195 261 349 465
46
Table S-1 continued Projected fuel price indices with assumed general price inflation rates of 2 3 4 and 5 by end-use sector and fuel type
Census Region 1 (Connecticut Maine Massachusetts New HampshireNew Jersey New York Pennsylvania Rhode Island Vermont)
Projected April 1 Fuel Price Indices (April 1 2008 = 100)
----------------------------------------------------------------COMMERCIAL-----------------------------------------------------------------
Electricity
------------------------
Distillate Oil ------------------------
Residual Oil ------------------------
Natural Gas ------------------------
Coal ------------------------
Inflation Rate
Inflation Rate Inflation Rate Inflation Rate Inflation Rate Year 2 3 4 5 2 3 4 5 2 3 4 5 2 3 4 5 2 3
4 5
2009 104 105 106 107 093 094 095 096 102 103 104 105 104 105 106 107 103 104 105
106 2010 102 104 106 108 089 091 092 094 098 100 102 104 103 105 107 109 103 105
107 109
2011 100 103 106 110 088 090 093 096 096 099 102 105 102 105 108 111 101 104 107
110 2012 101 105 109 113 086 089 093 096 094 097 101 105 102 106 110 114 099 103
107 111
2013 101 106 111 117 084 088 092 097 091 096 101 106 102 107 112 118 098 102 108
113 2014 101 107 114 120 084 089 094 100 089 094 100 106 102 108 115 121 099 105
111 117
2015 102 110 117 125 083 089 095 102 086 092 099 106 103 110 118 126 100 107 114
122 2016 104 113 122 132 082 088 095 103 084 090 098 105 105 113 122 132 099 108
116 125
2017 107 117 128 139 083 090 098 107 084 092 100 109 107 117 128 139 099 108 118
129 2018 110 122 134 148 085 094 103 114 087 096 106 116 111 122 135 148 100 110
121 133
2019 113 126 140 156 089 099 110 122 090 101 112 124 114 127 141 157 101 112 125
139 2020 115 130 146 163 092 104 117 131 094 105 118 132 116 131 147 165 103 116
130 146
2021 116 132 150 170 095 107 122 138 097 110 125 141 118 134 152 172 105 120 136
153 2022 119 136 156 179 097 111 127 146 100 115 132 150 122 139 160 182 108 124
142 162
2023 122 141 163 189 100 116 134 155 104 120 139 161 126 145 168 194 111 128 148
171 2024 125 146 171 199 103 121 141 164 108 126 147 171 130 152 177 207 113 132
155 180
2025 128 152 179 210 107 126 149 175 112 132 156 183 134 159 187 220 116 137 162
190 2026 132 157 187 222 111 132 157 187 116 138 164 195 139 166 197 235 119 142
169 201
2027 135 162 195 233 115 138 166 199 118 142 171 205 143 172 207 248 123 148 178
214 2028 139 169 204 248 118 144 175 212 123 149 181 219 149 181 219 266 127 154
187 226
2029 142 174 214 261 123 151 185 226 128 157 192 234 155 190 232 284 130 160 196
240 2030 146 181 223 276 127 158 195 241 132 164 203 250 160 198 245 303 134 166
205 253
2031 149 187 233 291 131 164 205 256 137 171 214 267 165 206 258 321 137 171 214
267 2032 153 193 244 307 135 171 215 271 142 179 226 284 169 214 270 340 140 176
223 280
2033 157 200 254 323 139 177 226 287 147 187 238 303 174 222 283 359 143 183 232
295 2034 160 207 266 341 143 184 237 304 152 196 252 323 179 231 296 380 147 189
243 311
2035 164 214 277 359 147 192 249 322 157 204 265 344 184 239 310 402 150 195 253
327 2036 168 221 289 378 152 199 261 341 163 214 280 366 189 248 325 425 153 201
264 345
2037 172 228 302 399 156 207 274 362 168 223 295 390 194 258 341 450 157 208 276
364 2038 176 236 316 421 160 215 287 383 174 233 312 416 200 267 357 476 160 215
287 382
47
Table S-1 continued Projected fuel price indices with assumed general price inflation rates of 2 3 4 and 5 by end-use sector and fuel type
Census Region 1 (Connecticut Maine Massachusetts New HampshireNew Jersey New York Pennsylvania Rhode Island Vermont)
Projected April 1 Fuel Price Indices (April 1 2008 = 100)
----------------------------------------------------------------INDUSTRIAL-----------------------------------------------------------------
Electricity
------------------------
Distillate Oil ------------------------
Residual Oil ------------------------
Natural Gas ------------------------
Coal ------------------------
Inflation Rate
Inflation Rate Inflation Rate Inflation Rate Inflation Rate Year 2 3 4 5 2 3 4 5 2 3 4 5 2 3 4 5 2 3
4 5
2009 104 105 106 107 093 094 095 096 102 103 104 105 105 106 107 108 102 103 104
105 2010 101 103 105 107 088 090 092 094 098 100 102 104 103 105 108 110 103 105
107 109
2011 097 100 103 106 089 091 094 097 096 099 102 105 101 104 107 111 105 108 111
114 2012 097 101 105 109 087 091 094 098 093 097 101 105 100 104 108 113 106 110
115 119
2013 095 100 105 110 086 090 094 099 091 095 100 105 099 104 109 114 109 114 120
125 2014 094 100 106 112 086 091 097 103 088 094 099 105 098 104 110 116 110 116
123 131
2015 095 102 109 117 086 092 098 105 086 092 099 105 098 104 112 119 111 118 127
135 2016 097 105 113 122 085 091 099 107 083 090 097 105 099 107 115 124 112 121
131 142
2017 099 109 118 129 086 094 102 111 084 092 100 109 101 110 120 131 114 124 135
147 2018 102 113 124 137 088 097 107 118 087 096 106 116 104 114 126 139 115 127
139 153
2019 104 116 129 144 093 103 115 127 090 100 112 124 107 119 132 147 117 130 144
160 2020 106 119 133 150 097 109 123 138 093 105 118 132 108 121 136 153 119 134
151 169
2021 106 121 137 155 099 113 128 144 096 110 124 141 108 123 140 158 122 138 157
178 2022 108 124 142 163 102 117 134 153 100 114 131 150 112 128 146 167 124 142
163 186
2023 111 129 149 172 105 121 140 162 103 120 138 160 115 133 154 178 127 147 170
196 2024 115 134 156 182 107 125 146 171 107 125 146 171 119 139 162 189 129 150
176 205
2025 118 139 164 193 111 131 155 182 111 131 155 182 123 145 171 201 131 155 183
215 2026 121 144 171 203 115 137 163 194 115 137 163 194 128 152 181 215 133 159
189 225
2027 123 148 178 214 119 143 172 206 117 141 170 204 131 158 190 227 137 164 197
237 2028 127 155 188 227 123 149 181 219 122 148 179 217 136 166 201 244 139 169
205 249
2029 130 160 196 240 127 156 191 234 126 155 190 232 142 174 213 261 142 174 214
261 2030 134 166 205 253 132 163 202 249 131 162 201 248 147 183 226 279 146 180
223 275
2031 137 172 215 267 136 170 212 264 136 170 212 264 152 190 238 296 149 187 233
290 2032 141 178 224 282 140 176 222 280 140 177 224 281 157 198 250 314 153 193
243 306
2033 144 184 234 297 144 183 233 296 145 185 236 300 162 206 263 334 156 199 253
322 2034 148 190 245 314 148 190 245 314 150 194 249 319 167 215 276 354 160 206
264 339
2035 151 197 256 331 152 198 257 333 155 202 263 340 172 224 290 376 164 213 276
358 2036 155 204 267 349 156 205 269 352 161 211 277 362 177 233 305 399 167 219
287 376
2037 159 211 279 368 161 214 283 373 166 221 292 386 183 243 321 424 171 227 300
396 2038 163 218 291 388 166 222 297 395 172 231 308 411 189 253 338 450 174 234
312 416
48
Table S-2 Projected fuel price indices with assumed general price inflation rates of 2 3 4 and 5 by end-use sector and fuel type
Census Region 2 (Illinois Indiana Iowa Kansas Michigan MinnesotaMissouri Nebraska North Dakota Ohio South Dakota Wisconsin)
Projected April 1 Fuel Price Indices (April 1 2008 = 100)
--------------------------------------------------RESIDENTIAL---------------------------------------------------
Electricity
------------------------
Distillate Oil ------------------------
LPG ------------------------
Natural Gas ------------------------
Inflation Rate
Inflation Rate Inflation Rate Inflation Rate Year 2 3 4 5 2 3 4 5 2 3 4 5 2 3 4 5 2009 105 106 107 108 088 089 090 091 103 104 106 107 102 103 104 105 2010 108 111 113 115 082 084 085 087 104 106 108 110 101 103 105 107 2011 110 113 116 119 080 083 085 088 105 108 111 114 099 102 105 108 2012 110 115 119 124 078 081 084 087 106 110 114 119 099 103 107 111 2013 112 117 123 129 075 079 083 087 107 112 118 123 099 104 109 115 2014 113 120 127 135 075 079 084 089 108 114 121 128 099 105 112 118 2015 115 123 132 141 073 079 084 090 109 117 125 134 100 107 115 123 2016 117 127 137 148 072 078 084 091 111 120 130 140 102 110 119 128 2017 120 131 143 156 073 080 087 095 114 124 135 147 104 114 124 135 2018 123 136 149 164 075 083 091 101 116 128 141 155 107 118 130 143 2019 126 140 156 173 078 086 096 107 119 132 147 164 110 123 137 152 2020 128 144 162 181 080 090 101 113 121 136 152 171 112 126 141 159 2021 130 148 168 190 082 093 106 120 122 139 158 178 113 128 145 165 2022 133 152 174 199 085 097 111 127 125 144 164 188 116 133 153 174 2023 135 157 181 209 088 101 117 135 129 149 172 199 120 139 161 186 2024 138 161 188 220 091 106 124 144 132 154 180 210 124 145 170 198 2025 140 166 195 230 094 111 131 154 135 160 188 222 129 152 179 211 2026 143 170 203 241 098 116 138 164 139 166 197 234 134 159 190 225 2027 145 175 210 252 101 121 146 175 143 172 206 247 138 166 199 239 2028 149 181 219 265 104 127 154 186 147 178 217 262 143 174 211 256 2029 152 186 228 279 108 133 163 199 151 185 227 278 149 183 224 274 2030 155 193 238 294 112 138 171 211 155 192 238 294 155 192 237 293 2031 159 199 248 309 115 144 180 224 159 199 249 310 159 199 249 310 2032 162 205 258 325 118 150 189 237 164 207 261 328 164 207 261 328 2033 165 211 268 341 122 156 198 252 168 214 273 346 168 215 273 347 2034 168 217 279 358 125 162 208 267 172 222 285 366 173 223 287 368 2035 172 223 290 376 129 168 218 282 177 230 298 386 178 231 300 389 2036 175 230 302 394 133 175 229 299 181 238 312 408 183 240 315 412 2037 179 237 314 414 137 182 240 317 186 247 327 431 188 250 330 436 2038 182 244 326 434 141 189 252 336 191 256 342 455 193 259 346 461
49
Table S-2 continued Projected fuel price indices with assumed general price inflation rates of 2 3 4 and 5 by end-use sector and fuel type
Census Region 2 (Illinois Indiana Iowa Kansas Michigan MinnesotaMissouri Nebraska North Dakota Ohio South Dakota Wisconsin)
Projected April 1 Fuel Price Indices (April 1 2008 = 100)
----------------------------------------------------------------COMMERCIAL-----------------------------------------------------------------
Electricity
------------------------
Distillate Oil ------------------------
Residual Oil ------------------------
Natural Gas ------------------------
Coal------------------------
Inflation Rate
Inflation Rate Inflation Rate Inflation Rate Inflation Rate Year 2 3 4 5 2 3 4 5 2 3 4 5 2 3 4 5 2 3
4 5
2009 105 106 107 108 090 091 092 093 113 114 115 116 103 104 105 106 104 105 106
107 2010 108 110 112 115 085 086 088 090 111 113 115 117 101 103 105 107 106 108
110 113
2011 109 112 115 119 084 087 089 092 107 110 113 116 099 102 105 108 110 113 116
120 2012 109 113 117 122 081 085 088 091 095 099 103 107 099 103 107 111 112 116
121 125
2013 108 113 119 125 079 083 087 091 091 095 100 105 098 103 108 114 114 119 125
131 2014 108 114 121 129 079 084 089 094 091 096 102 108 098 104 111 117 116 122
130 137
2015 109 117 125 134 078 083 089 095 088 094 101 108 099 106 114 121 117 125 134
143 2016 111 120 130 140 077 083 089 097 087 094 101 109 101 109 117 127 119 129
139 150
2017 114 124 135 147 077 085 092 101 087 095 104 113 103 113 123 134 121 132 144
157 2018 117 129 142 156 080 088 097 107 090 099 109 120 107 118 130 143 123 136
149 164
2019 119 133 148 164 083 093 103 115 095 106 117 131 110 122 136 151 125 139 155
172 2020 122 137 154 172 087 098 110 123 100 112 126 141 111 125 141 158 127 143
161 180
2021 124 140 159 180 089 101 115 130 104 118 133 151 112 128 145 164 130 147 167
189 2022 126 145 166 190 092 105 120 137 107 122 140 160 116 133 152 174 133 153
175 200
2023 129 150 173 200 094 109 126 146 111 129 149 172 120 139 161 185 136 157 182
210 2024 132 154 180 210 097 114 133 155 116 135 158 184 125 146 170 198 138 162
189 220
2025 135 159 187 220 101 119 140 165 120 142 167 197 129 153 180 212 141 166 196
230 2026 137 164 195 231 105 125 148 176 125 149 177 210 134 160 191 227 143 171
203 242
2027 140 168 202 243 108 130 157 188 128 154 185 222 139 167 201 241 146 176 212
254 2028 143 174 212 256 112 136 165 200 133 161 196 237 145 176 214 259 150 182
221 268
2029 147 180 221 270 116 143 175 214 137 168 206 251 151 185 227 278 153 188 230
281 2030 151 188 232 286 121 149 185 228 142 175 217 268 157 194 240 297 157 194
240 296
2031 155 194 242 302 124 156 194 242 146 183 229 285 162 202 253 315 160 200 250
311 2032 158 200 253 318 128 162 204 257 152 191 241 304 166 210 265 334 164 207
261 328
2033 162 207 263 334 132 168 214 272 157 200 255 323 171 218 278 353 168 214 272
346 2034 166 213 274 352 136 175 225 288 162 209 268 344 176 227 292 374 171 220
283 363
2035 169 220 286 370 140 182 236 306 167 218 283 366 181 236 306 396 175 228 296
383 2036 173 227 298 390 144 189 248 324 173 228 298 390 186 245 321 420 179 236
309 404
2037 177 235 311 410 148 197 260 343 179 238 314 415 192 254 337 444 183 243 321
424 2038 181 242 324 431 153 204 273 364 185 248 332 442 197 264 353 471 187 251
336 447
50
Table S-2 continued Projected fuel price indices with assumed general price inflation rates of 2 3 4 and 5 by end-use sector and fuel type
Census Region 2 (Illinois Indiana Iowa Kansas Michigan MinnesotaMissouri Nebraska North Dakota Ohio South Dakota Wisconsin)
Projected April 1 Fuel Price Indices (April 1 2007 = 100)
----------------------------------------------------------------INDUSTRIAL-----------------------------------------------------------------
Electricity
------------------------
Distillate Oil ------------------------
Residual Oil ------------------------
Natural Gas ------------------------
Coal ------------------------
Inflation Rate
Inflation Rate Inflation Rate Inflation Rate Inflation Rate Year 2 3 4 5 2 3 4 5 2 3 4 5 2 3 4 5 2 3
4 5
2009 106 107 108 109 093 094 094 095 110 111 112 113 105 106 107 108 102 103 104
105 2010 108 110 112 115 088 089 091 093 107 109 111 113 104 106 108 111 104 106
108 110
2011 107 110 113 117 089 092 094 097 103 106 109 112 102 105 108 111 105 108 111
115 2012 106 110 115 119 087 091 094 098 093 097 101 105 101 105 109 113 106 110
115 119
2013 105 110 116 121 085 089 094 098 089 094 098 103 099 104 109 115 107 113 118
124 2014 104 111 117 124 086 091 096 102 089 094 100 106 098 104 111 117 109 116
122 130
2015 105 113 121 129 085 091 098 105 087 093 099 106 098 105 113 121 111 119 127
136 2016 107 116 125 135 084 091 098 106 085 092 099 107 099 107 116 125 113 122
132 142
2017 110 120 131 142 085 093 102 111 085 093 102 111 102 111 121 132 115 126 137
149 2018 113 124 137 151 088 097 107 117 088 097 107 117 105 115 127 140 118 130
143 158
2019 115 128 143 158 092 103 114 127 092 103 114 127 108 120 133 148 120 134 149
166 2020 117 132 148 166 097 109 122 137 096 108 122 137 108 122 137 153 123 138
155 174
2021 118 134 152 173 099 112 127 144 100 114 129 146 108 123 139 158 125 141 160
182 2022 121 138 158 181 101 116 133 152 103 118 135 155 111 128 146 167 128 146
168 192
2023 123 143 165 191 104 120 139 161 107 124 143 166 116 134 155 179 131 152 175
202 2024 126 147 172 200 107 125 146 170 112 131 153 178 120 141 164 191 134 157
183 213
2025 128 151 178 210 110 130 154 181 116 137 162 190 125 147 174 205 137 162 191
225 2026 131 156 185 220 114 136 162 192 120 144 171 203 130 155 185 219 141 168
200 237
2027 133 160 192 231 118 142 171 205 123 149 179 214 135 162 195 234 144 173 208
249 2028 136 166 201 243 122 148 180 217 128 155 188 228 141 171 208 251 147 179
217 263
2029 140 171 210 257 126 155 190 232 132 162 198 243 147 181 221 271 151 185 227
277 2030 144 178 220 272 131 162 201 248 137 169 209 258 153 190 235 290 155 192
237 293
2031 147 184 230 286 135 169 211 263 141 177 221 275 159 199 248 309 158 197 246
307 2032 150 190 239 301 139 175 221 278 146 185 233 293 164 207 261 328 162 204
258 324
2033 153 196 249 316 143 182 232 295 151 193 246 312 169 216 274 349 166 211 269
342 2034 156 202 259 332 147 189 243 312 156 201 259 332 174 225 289 371 169 218
280 359
2035 160 208 270 349 151 197 255 331 162 210 273 353 180 234 304 393 173 225 292
378 2036 163 214 281 367 155 204 268 350 167 219 287 376 186 244 320 418 177 233
305 399
2037 166 221 292 386 160 212 281 371 173 229 303 400 192 254 337 444 181 240 318
419 2038 170 228 304 406 164 220 294 392 179 239 320 426 198 265 354 472 185 248
332 442
51
Table S-3 Projected fuel price indices with assumed general price inflation rates of 2 3 4 and 5 by end-use sector and fuel type
Census Region 3 (Alabama Arkansas Delaware District of Columbia Florida Georgia Kentucky Louisiana
Maryland Mississippi North Carolina Oklahoma South Carolina Tennessee Texas Virginia West Virginia)
Projected April 1 Fuel Price Indices (April 1 2008 = 100)
--------------------------------------------------RESIDENTIAL---------------------------------------------------
Electricity
------------------------
Distillate Oil ------------------------
LPG ------------------------
Natural Gas ------------------------
Inflation Rate
Inflation Rate Inflation Rate Inflation Rate Year 2 3 4 5 2 3 4 5 2 3 4 5 2 3 4 5 2009 105 106 107 109 091 092 093 094 099 100 101 102 102 103 104 105 2010 108 110 112 115 086 088 089 091 098 100 102 104 101 103 105 107 2011 108 112 115 118 084 087 089 092 099 101 104 107 100 103 106 109 2012 109 114 118 123 082 085 089 092 100 104 108 112 100 104 109 113 2013 111 116 122 128 080 084 088 093 101 106 111 117 101 106 111 117 2014 112 118 126 133 080 085 090 095 102 108 115 121 102 108 114 121 2015 113 121 130 139 079 084 090 096 103 111 119 127 103 110 118 126 2016 115 125 135 146 078 084 091 098 105 114 123 133 104 113 122 132 2017 118 129 141 153 078 086 093 102 108 117 128 140 107 117 128 139 2018 120 132 146 160 081 089 098 108 110 121 134 147 111 122 134 148 2019 123 137 152 169 083 093 103 114 113 125 139 155 114 127 141 157 2020 125 141 158 177 086 096 108 121 115 129 145 163 117 131 147 165 2021 128 145 164 186 088 100 113 128 117 133 150 170 119 135 153 173 2022 130 150 171 196 090 104 119 136 120 137 157 179 122 140 161 184 2023 133 154 178 206 093 108 125 144 123 142 164 189 126 146 169 195 2024 136 159 185 216 097 113 132 154 126 147 171 200 131 153 178 208 2025 139 164 193 227 100 118 139 164 129 152 179 211 135 160 188 221 2026 142 169 201 239 104 124 147 175 132 157 187 222 140 167 198 235 2027 145 174 209 251 107 129 155 186 135 162 195 234 143 173 208 249 2028 148 180 218 264 111 134 163 198 138 168 204 247 149 181 220 266 2029 151 186 227 278 115 141 172 211 142 174 214 261 155 190 233 284 2030 154 191 237 292 119 147 182 225 146 180 223 275 160 198 245 303 2031 158 197 247 307 122 153 191 238 149 187 233 291 165 206 257 321 2032 161 204 257 323 126 159 200 252 153 193 244 307 169 214 269 339 2033 165 210 267 340 129 165 210 267 157 200 255 324 173 221 282 358 2034 168 217 278 357 133 171 220 283 161 207 266 342 178 230 295 379 2035 172 223 290 375 137 178 231 299 165 215 279 361 183 238 309 400 2036 175 230 302 395 141 185 242 317 169 222 291 381 188 247 324 423 2037 179 238 314 415 145 192 254 336 173 230 305 402 193 256 339 447 2038 183 245 327 436 149 200 267 355 178 238 318 424 198 266 355 473
52
Table S-3 continued Projected fuel price indices with assumed general price inflation rates of 2 3 4 and 5 by end-use sector and fuel type
Census Region 3 (Alabama Arkansas Delaware District of Columbia Florida Georgia Kentucky LouisianaMaryland Mississippi North Carolina Oklahoma South Carolina Tennessee Texas Virginia West Virginia)
Projected April 1 Fuel Price Indices (April 1 2008 = 100)
----------------------------------------------------------------COMMERCIAL-----------------------------------------------------------------
Electricity
------------------------
Distillate Oil ------------------------
Residual Oil ------------------------
Natural Gas ------------------------
Coal ------------------------
Inflation Rate
Inflation Rate Inflation Rate Inflation Rate Inflation Rate Year 2 3 4 5 2 3 4 5 2 3 4 5 2 3 4 5 2 3
4 5
2009 105 106 107 108 093 094 094 095 116 117 119 120 104 105 106 107 103 104 105
106 2010 108 110 112 114 088 089 091 093 114 117 119 121 102 104 106 108 103 105
107 109
2011 107 110 114 117 087 090 092 095 110 114 117 120 101 104 107 110 102 105 109
112 2012 108 112 116 121 084 088 091 095 105 109 113 118 101 105 109 114 101 105
109 114
2013 108 113 119 125 082 086 090 095 100 105 111 116 101 106 112 117 101 106 111
117 2014 108 115 121 129 082 087 092 098 099 105 111 118 102 108 114 121 101 107
113 120
2015 109 117 125 134 081 087 093 099 096 102 110 117 102 109 117 125 101 108 116
124 2016 111 121 130 141 080 086 093 100 092 100 108 116 104 112 121 131 102 110
119 128
2017 114 124 136 148 081 088 096 105 093 101 110 120 107 116 127 138 103 112 123
134 2018 116 128 141 155 083 092 101 111 096 105 116 128 110 122 134 147 104 115
126 139
2019 119 132 147 163 087 097 107 119 099 111 123 137 114 127 141 156 105 117 130
145 2020 121 136 153 171 090 102 114 128 103 116 130 146 116 131 147 165 108 121
136 153
2021 123 139 158 179 093 105 119 135 106 121 137 155 118 135 153 173 110 125 141
160 2022 126 144 165 188 095 109 125 143 109 125 144 164 122 140 160 183 112 128
147 168
2023 128 148 171 198 098 114 131 152 114 132 152 175 126 146 169 195 114 132 153
177 2024 131 153 178 208 101 118 138 161 118 138 162 188 131 153 179 208 117 136
159 185
2025 134 158 186 219 105 124 146 172 123 145 171 202 135 160 188 222 118 140 165
194 2026 137 163 194 230 109 130 154 184 128 153 182 216 140 167 199 236 120 143
171 203
2027 139 168 202 242 113 136 163 195 132 158 190 228 144 173 208 250 123 148 177
213 2028 143 174 211 256 117 142 172 208 136 166 201 243 150 182 221 268 125 152
184 223
2029 146 180 220 269 121 148 182 222 141 173 212 259 156 191 234 286 128 157 192
234 2030 150 185 229 283 126 156 193 238 146 181 224 276 161 200 247 305 131 162
200 247
2031 153 191 239 298 130 162 203 253 151 189 236 294 166 208 259 323 134 168 209
261 2032 156 197 249 313 134 169 213 268 156 197 249 313 171 216 272 342 137 173
219 275
2033 160 204 259 329 138 176 223 284 162 206 263 334 175 224 285 362 140 179 227
289 2034 163 210 270 346 142 182 235 301 167 215 277 355 180 232 299 383 143 185
238 305
2035 167 217 281 364 146 190 246 319 173 225 292 378 186 241 313 406 147 191 248
321 2036 170 224 293 383 150 197 258 338 179 235 308 403 191 251 329 430 150 197
258 338
2037 174 231 305 403 155 205 271 358 185 245 325 429 196 260 344 454 154 204 270
356 2038 178 238 318 424 159 213 285 380 191 256 343 457 202 270 361 481 157 211
282 375
53
Table S-3 continued Projected fuel price indices with assumed general price inflation rates of 2 3 4 and 5 by end-use sector and fuel type
Census Region 3 (Alabama Arkansas Delaware District of Columbia Florida Georgia Kentucky LouisianaMaryland Mississippi North Carolina Oklahoma South Carolina Tennessee Texas Virginia West Virginia)
Projected April 1 Fuel Price Indices (April 1 2008 = 100)
----------------------------------------------------------------INDUSTRIAL-----------------------------------------------------------------
Electricity
------------------------
Distillate Oil ------------------------
Residual Oil ------------------------
Natural Gas ------------------------
Coal ------------------------
Inflation Rate
Inflation Rate Inflation Rate Inflation Rate Inflation Rate Year 2 3 4 5 2 3 4 5 2 3 4 5 2 3 4 5 2 3
4 5
2009 106 107 108 109 092 093 094 095 108 109 110 111 106 107 108 109 102 103 104
105 2010 107 110 112 114 087 089 091 092 103 105 107 110 105 107 109 111 101 103
105 107
2011 106 109 113 116 088 091 094 096 100 103 106 109 101 104 107 111 101 104 107
110 2012 106 110 114 119 086 090 093 097 094 097 101 105 100 104 108 112 100 104
108 112
2013 106 111 117 122 085 089 093 098 090 094 099 104 099 104 109 114 101 106 111
116 2014 106 112 119 126 085 090 096 101 088 094 099 105 098 104 110 116 102 108
114 121
2015 107 114 122 131 085 091 097 104 086 092 098 105 097 104 111 119 103 110 118
126 2016 109 118 127 137 084 090 098 105 083 090 097 105 098 106 114 123 104 112
121 131
2017 111 122 133 145 085 093 101 110 083 091 099 108 100 110 120 130 105 115 125
137 2018 113 125 138 152 087 096 106 117 086 095 104 115 104 115 126 139 107 118
130 143
2019 116 129 144 160 091 102 113 126 090 100 111 123 107 119 133 148 109 121 134
149 2020 118 133 149 167 096 108 121 136 093 105 117 132 110 123 138 155 111 125
140 157
2021 120 136 155 175 098 111 126 143 096 109 124 140 111 126 143 162 113 129 146
165 2022 123 141 161 184 101 115 132 151 099 114 130 149 115 131 150 172 116 133
152 174
2023 125 145 167 193 103 120 138 160 103 119 138 159 119 138 159 184 118 137 158
182 2024 128 149 174 203 106 124 145 169 107 126 147 171 124 144 169 197 120 141
164 191
2025 131 154 182 214 110 130 153 180 112 132 155 183 128 151 178 210 123 145 171
201 2026 134 159 190 225 114 136 161 192 116 138 165 196 133 159 189 224 125 149
178 211
2027 137 164 197 237 117 141 170 204 119 144 172 207 137 164 198 237 128 154 185
222 2028 141 171 207 251 121 147 179 217 123 150 182 221 143 174 212 256 130 158
192 233
2029 144 177 216 264 126 154 189 231 128 157 192 235 150 184 226 276 133 164 201
245 2030 147 182 225 278 131 162 200 247 132 164 202 250 156 193 239 295 137 169
209 259
2031 150 188 235 293 135 169 211 263 137 171 214 266 161 202 252 314 139 174 218
271 2032 154 194 245 308 139 175 221 278 141 179 225 284 167 211 266 334 143 180
227 286
2033 157 200 255 324 143 182 232 294 146 187 238 302 172 220 280 355 146 187 237
302 2034 161 207 266 341 147 189 243 312 151 195 251 321 178 229 294 378 149 192
247 317
2035 164 213 277 359 151 196 255 330 156 204 264 342 184 239 310 402 153 199 258
334 2036 168 220 289 378 155 204 267 350 162 213 279 364 190 250 327 428 156 205
269 352
2037 171 227 301 397 160 212 281 370 167 222 294 388 196 260 345 455 159 212 280
370 2038 175 235 314 418 164 220 294 392 173 232 310 413 203 272 363 484 163 219
292 390
------------------------ ------------------------ ------------------------ ------------------------
54
Table S-4 Projected fuel price indices with assumed general price inflation rates of 2 3 4 and 5 by end-use sector and fuel type
Census Region 4 (Alaska Arizona California Colorado HawaiiIdaho Montana Nevada New Mexico Oregon Utah Washington Wyoming)
Projected April 1 Fuel Price Indices (April 1 2008 = 100)
--------------------------------------------------RESIDENTIAL---------------------------------------------------
Electricity Distillate Oil LPG Natural Gas
Inflation Rate
Inflation Rate Inflation Rate Inflation Rate Year 2 3 4 5 2 3 4 5 2 3 4 5 2 3 4 5 2009 103 104 105 106 077 078 079 080 099 100 101 102 102 103 104 105 2010 104 106 108 110 070 071 073 074 099 101 103 105 101 103 105 107 2011 104 107 110 113 068 070 072 074 099 102 105 108 099 102 105 109 2012 104 108 112 116 068 070 073 076 100 104 109 113 100 104 108 112 2013 105 111 116 122 068 071 075 079 101 106 112 117 100 105 110 115 2014 108 114 121 128 068 072 077 081 103 109 116 122 101 107 113 120 2015 110 118 126 135 068 072 077 083 105 112 120 128 102 110 117 125 2016 113 122 132 142 067 073 079 085 106 115 124 134 104 113 122 131 2017 115 126 137 150 069 075 082 089 109 119 129 141 107 117 127 139 2018 118 130 144 158 071 079 087 095 111 122 135 148 110 121 133 146 2019 121 135 150 167 074 083 092 102 114 126 141 156 113 125 140 155 2020 124 139 156 175 077 087 097 109 115 129 145 163 114 128 144 161 2021 126 143 162 183 080 090 102 116 116 132 150 169 114 129 147 166 2022 129 148 169 193 082 094 108 123 118 136 155 178 116 133 153 175 2023 132 153 176 204 085 099 114 132 122 141 163 188 121 140 161 186 2024 135 158 184 215 089 104 121 141 125 146 171 199 125 147 171 199 2025 139 164 193 228 092 108 128 150 129 152 179 210 130 154 181 213 2026 143 170 202 240 095 114 135 161 132 158 188 223 136 162 193 229 2027 146 176 211 253 099 120 144 172 136 163 196 235 141 169 203 244 2028 149 181 220 267 103 125 152 184 139 169 206 249 146 178 215 261 2029 153 188 230 282 107 131 160 196 144 176 216 264 152 187 229 280 2030 157 194 240 296 110 136 168 208 148 183 226 279 159 197 243 300 2031 160 201 250 312 113 141 176 220 152 190 237 295 163 205 256 318 2032 164 207 262 329 116 147 185 233 155 196 248 312 168 212 268 337 2033 168 214 273 347 119 152 194 246 159 203 259 329 173 220 280 356 2034 172 222 285 366 123 158 203 261 163 211 271 347 177 229 294 377 2035 176 229 298 385 126 164 213 276 168 218 283 367 182 237 308 399 2036 180 237 311 406 130 171 224 292 172 226 296 387 187 246 323 422 2037 185 245 325 428 134 177 235 310 176 234 310 409 193 256 338 446 2038 189 254 339 452 137 184 246 328 181 242 324 431 198 265 354 472
55
Table S-4 continued Projected fuel price indices with assumed general price inflation rates of 2 3 4 and 5 by end-use sector and fuel type
Census Region 4 (Alaska Arizona California Colorado HawaiiIdaho Montana Nevada New Mexico Oregon Utah Washington Wyoming)
Projected April 1 Fuel Price Indices (April 1 2008 = 100)
----------------------------------------------------------------COMMERCIAL-----------------------------------------------------------------
Electricity
------------------------
Distillate Oil ------------------------
Residual Oil ------------------------
Natural Gas ------------------------
Coal ------------------------
Inflation Rate
Inflation Rate Inflation Rate Inflation Rate Inflation Rate Year 2 3 4 5 2 3 4 5 2 3 4 5 2 3 4 5 2 3
4 5
2009 103 104 105 106 085 086 087 087 125 127 128 129 102 103 104 105 104 105 106
107 2010 103 105 107 109 079 080 082 083 126 129 131 134 100 102 104 106 107 109
111 113
2011 101 104 108 111 077 080 082 084 122 126 129 133 099 102 105 108 108 111 114
117 2012 101 105 109 113 076 079 083 086 102 106 110 114 099 103 107 111 108 113
117 122
2013 101 106 111 116 077 080 084 089 096 101 106 111 099 104 109 115 110 115 121
127 2014 101 107 114 120 077 082 087 092 097 103 109 115 100 106 112 119 112 119
126 133
2015 103 110 117 126 077 082 088 094 096 102 110 117 102 109 116 124 114 122 130
139 2016 104 113 122 132 076 083 089 096 095 103 111 120 104 112 121 131 115 124
134 145
2017 107 116 127 138 078 085 092 101 096 105 114 125 106 116 127 138 117 128 140
152 2018 109 120 132 145 081 089 098 108 100 110 121 133 110 121 133 146 121 134
147 162
2019 111 124 138 153 085 094 105 116 106 118 132 146 113 126 140 155 125 139 155
172 2020 113 127 142 160 089 100 112 126 114 128 144 161 114 128 144 162 128 144
162 181
2021 114 129 146 166 091 104 117 133 119 135 153 173 114 129 147 166 131 148 168
190 2022 116 133 152 174 094 108 123 141 123 141 161 184 117 134 153 175 134 153
176 201
2023 118 137 158 182 097 112 130 150 128 149 172 198 121 141 162 188 138 160 184
213 2024 121 141 165 192 100 117 137 160 134 156 183 213 127 148 173 201 142 166
194 226
2025 124 147 173 203 104 122 144 170 139 164 193 228 132 156 184 216 145 172 202
238 2026 127 152 181 215 108 129 153 182 144 172 205 243 138 165 196 233 150 178
212 252
2027 130 157 188 226 112 135 162 194 148 179 214 257 143 172 207 248 154 185 223
267 2028 134 162 197 239 116 141 171 207 153 187 226 274 149 181 220 267 158 192
233 282
2029 137 168 206 252 120 147 180 221 158 194 238 291 156 192 235 287 162 199 243
297 2030 140 174 215 265 124 154 190 234 164 203 251 310 163 202 250 308 165 205
253 312
2031 143 179 224 279 127 160 199 248 169 212 265 330 168 211 263 328 169 212 264
329 2032 146 185 233 294 131 166 209 263 175 221 279 351 173 219 276 347 173 219
276 347
2033 150 191 243 309 135 172 219 279 181 231 294 374 178 227 289 367 177 225 287
365 2034 153 197 254 325 139 179 230 295 187 241 310 398 183 236 303 389 181 233
300 385
2035 156 204 264 342 143 186 241 312 193 252 327 423 188 245 318 411 185 241 313
406 2036 160 210 275 360 147 193 253 331 200 263 345 451 193 254 333 436 189 249
326 426
2037 164 217 287 379 151 201 266 350 207 274 363 479 199 264 349 461 194 257 340
449 2038 167 224 299 399 156 209 279 371 214 286 383 510 205 274 366 488 199 266
356 474
56
Table S-4 continued Projected fuel price indices with assumed general price inflation rates of 2 3 4 and 5 by end-use sector and fuel type
Census Region 4 (Alaska Arizona California Colorado HawaiiIdaho Montana Nevada New Mexico Oregon Utah Washington Wyoming)
Projected April 1 Fuel Price Indices (April 1 2008 = 100)
----------------------------------------------------------------INDUSTRIAL-----------------------------------------------------------------
Electricity
------------------------
Distillate Oil ------------------------
Residual Oil ------------------------
Natural Gas ------------------------
Coal ------------------------
Inflation Rate
Inflation Rate Inflation Rate Inflation Rate Inflation Rate Year 2 3 4 5 2 3 4 5 2 3 4 5 2 3 4 5 2 3
4 5
2009 103 104 106 107 086 087 088 089 127 129 130 131 103 104 105 106 103 104 105
106 2010 104 106 108 110 080 082 084 085 129 132 134 137 100 102 104 106 105 107
109 111
2011 103 106 109 112 080 083 085 087 125 129 132 136 097 100 103 106 105 108 111
115 2012 102 106 111 115 079 083 086 089 105 109 113 118 096 099 103 107 106 110
114 119
2013 102 107 113 118 080 084 088 092 099 104 109 114 094 099 103 108 107 113 118
124 2014 103 109 116 123 081 086 091 096 100 106 112 119 093 099 105 111 110 116
123 130
2015 105 112 120 128 080 086 092 099 098 105 113 120 094 100 107 115 111 119 127
136 2016 107 116 125 135 080 087 094 101 098 106 114 123 095 102 110 119 112 121
131 141
2017 109 119 130 142 081 089 097 106 099 108 118 128 097 106 115 126 114 125 136
148 2018 112 123 135 149 084 093 102 113 102 113 124 137 099 109 120 132 117 129
142 156
2019 114 127 141 157 089 099 110 122 109 122 135 150 102 113 126 140 120 133 148
165 2020 116 130 146 164 094 105 118 133 117 131 148 166 102 115 129 145 123 138
155 174
2021 117 133 151 171 096 109 123 140 122 139 157 178 100 114 129 146 125 142 161
183 2022 119 137 157 179 098 113 129 148 126 145 165 189 101 116 133 152 128 147
169 193
2023 122 141 163 188 101 117 135 156 132 152 176 203 106 122 141 163 132 153 177
204 2024 125 146 170 199 104 122 142 165 137 160 187 218 111 130 151 177 136 159
186 216
2025 129 152 179 210 107 127 149 176 143 169 199 234 116 138 162 191 139 165 194
228 2026 132 157 187 222 111 133 158 188 148 177 210 250 123 146 174 207 143 170
203 241
2027 135 162 195 234 115 139 167 200 152 183 220 264 128 154 185 222 146 176 212
254 2028 138 168 204 247 119 145 175 212 158 192 232 281 134 163 198 239 150 182
221 268
2029 142 175 214 261 123 151 185 226 163 200 244 299 141 173 212 260 154 189 232
284 2030 145 180 223 275 127 158 195 241 168 208 258 318 148 184 227 281 157 195
241 298
2031 149 186 232 289 131 164 205 255 174 218 272 339 154 193 240 300 161 202 252
314 2032 152 192 242 305 135 170 215 270 180 227 287 361 159 201 254 319 164 208
262 330
2033 156 199 253 321 139 177 225 286 186 237 302 384 164 210 267 339 168 215 274
348 2034 159 205 264 338 142 184 236 303 192 248 319 409 170 219 281 360 173 222
286 367
2035 163 212 275 356 147 191 248 321 199 259 336 435 175 228 296 384 176 229 297
385 2036 167 219 287 375 151 198 260 339 206 270 354 463 181 238 312 408 180 237
311 406
2037 171 226 300 395 155 206 272 359 212 282 373 492 187 248 328 434 185 245 324
428 2038 175 234 312 416 159 214 285 380 220 294 393 524 194 259 346 462 188 252
337 450
57
Table S-5 Projected fuel price indices with assumed general price inflation rates of 2 3 4 and 5 by end-use sector and fuel type
United States Average
Projected April 1 Fuel Price Indices (April 1 2008 = 100)
--------------------------------------------------RESIDENTIAL---------------------------------------------------
Electricity
------------------------
Distillate Oil ------------------------
LPG ------------------------
Natural Gas ------------------------
Inflation Rate
Inflation Rate Inflation Rate Inflation Rate Year 2 3 4 5 2 3 4 5 2 3 4 5 2 3 4 5 2009 105 106 107 108 090 091 092 093 101 102 102 103 102 103 104 105 2010 107 109 111 113 085 087 088 090 100 102 104 106 101 103 105 107 2011 107 110 114 117 083 086 088 091 101 104 107 110 100 103 106 109 2012 108 112 117 121 081 085 088 091 102 106 110 115 101 105 109 113 2013 110 115 121 127 079 083 088 092 103 108 114 119 101 106 111 116 2014 111 118 125 132 079 084 089 094 104 111 117 124 101 107 114 120 2015 113 121 129 138 078 083 089 095 106 113 121 130 102 109 117 125 2016 115 124 134 145 077 083 090 097 108 116 126 136 104 112 121 131 2017 118 129 140 153 078 085 093 101 110 120 131 143 107 116 127 138 2018 120 133 146 161 080 088 097 107 113 124 137 150 110 121 133 146 2019 123 137 152 169 083 092 102 114 115 128 142 158 113 126 140 155 2020 125 141 158 177 085 096 107 120 117 132 148 166 115 129 145 162 2021 127 145 164 186 087 099 112 127 119 135 153 173 116 132 149 169 2022 130 149 171 195 090 103 118 135 122 139 160 182 119 137 156 179 2023 133 154 178 205 093 107 124 143 125 144 167 193 123 142 165 190 2024 136 159 185 216 096 112 131 153 128 149 174 203 127 149 174 203 2025 139 164 193 227 099 117 138 163 131 155 182 215 132 156 184 216 2026 142 169 201 239 103 123 146 174 135 160 191 227 137 163 194 231 2027 145 174 209 251 106 128 154 185 138 166 199 239 141 170 204 244 2028 148 180 218 264 110 134 162 196 142 172 209 253 146 178 216 261 2029 151 186 228 278 114 140 171 210 146 179 219 268 152 187 229 279 2030 155 192 237 293 118 146 181 223 149 185 229 283 158 195 241 298 2031 158 198 247 308 122 152 190 237 153 192 239 298 162 203 254 316 2032 162 204 258 324 125 158 199 251 157 198 250 315 167 211 265 334 2033 165 211 269 341 129 164 209 265 161 205 262 332 171 218 278 353 2034 169 218 280 359 132 170 219 281 165 213 274 351 176 226 291 373 2035 173 225 292 377 136 177 230 298 169 220 286 370 181 235 305 395 2036 176 232 304 397 140 184 241 315 174 228 299 391 186 244 320 418 2037 180 239 316 418 144 191 253 334 178 236 313 413 191 253 335 442 2038 184 247 330 439 148 199 265 353 183 245 327 436 196 263 351 467
58
Table S-5 continued Projected fuel price indices with assumed general price inflation rates of 2 3 4 and 5 by end-use sector and fuel type
United States Average
Projected April 1 Fuel Price Indices (April 1 2008 = 100)
----------------------------------------------------------------COMMERCIAL-----------------------------------------------------------------
Electricity
------------------------
Distillate Oil ------------------------
Residual Oil ------------------------
Natural Gas ------------------------
Coal ------------------------
Inflation Rate
Inflation Rate Inflation Rate Inflation Rate Inflation Rate Year 2 3 4 5 2 3 4 5 2 3 4 5 2 3 4 5 2 3
4 5
2009 104 105 106 107 092 093 094 095 104 105 106 107 103 104 105 106 104 105 106
107 2010 105 107 110 112 087 089 090 092 100 101 103 105 101 103 106 108 105 107
109 111
2011 105 108 111 114 086 089 091 094 097 100 103 106 100 103 106 109 106 109 112
115 2012 105 109 113 118 084 087 091 094 094 098 102 106 100 104 108 112 106 110
115 119
2013 105 110 115 121 082 086 090 095 092 097 101 106 100 105 110 116 107 113 118
124 2014 105 111 118 125 082 087 092 098 090 095 101 107 100 106 113 120 108 115
122 129
2015 106 114 122 130 081 087 093 099 087 093 100 107 101 108 116 124 110 117 125
134 2016 108 117 126 136 080 086 093 101 084 091 098 106 103 111 120 130 111 120
129 140
2017 111 121 132 144 081 088 096 105 085 093 101 110 106 115 126 137 112 122 133
145 2018 113 125 137 151 083 092 101 111 088 097 107 117 109 120 132 146 114 126
139 153
2019 116 129 143 159 087 097 108 120 091 101 113 125 112 125 139 155 116 129 144
159 2020 118 132 149 167 091 102 115 129 094 106 119 134 114 129 144 162 119 134
150 168
2021 119 135 153 174 093 106 120 135 098 111 126 142 116 131 149 169 121 138 156
177 2022 122 140 160 183 095 109 125 143 101 116 133 152 119 137 156 179 124 142
163 186
2023 124 144 166 192 098 114 132 152 105 122 140 162 123 143 165 190 127 147 169
196 2024 127 149 173 202 102 119 139 161 109 127 149 173 128 150 175 203 129 151
176 205
2025 130 153 181 213 105 124 146 172 113 133 157 185 133 157 185 217 132 156 184
217 2026 133 158 189 224 109 130 155 184 117 139 166 197 138 164 196 232 135 161
191 227
2027 136 163 196 236 113 136 163 196 120 144 173 207 142 171 206 247 138 166 200
240 2028 139 169 205 249 117 142 172 208 124 151 183 221 148 180 218 264 142 172
209 253
2029 143 175 215 262 121 149 182 222 129 158 194 237 154 189 232 283 145 177 217
266 2030 146 181 224 276 126 156 192 238 134 165 205 253 160 198 245 303 148 184
227 280
2031 150 187 234 292 129 162 202 252 138 173 216 269 165 206 258 321 152 190 237
295 2032 153 194 244 307 133 168 212 267 143 181 228 287 169 214 270 340 155 196
247 310
2033 157 200 255 323 137 175 223 283 148 189 241 306 174 222 283 360 159 202 258
327 2034 160 206 265 340 141 182 234 300 153 198 254 326 179 231 297 380 162 209
269 345
2035 164 213 277 358 145 189 245 318 159 206 268 347 184 240 311 403 166 216 280
362 2036 167 220 288 377 150 197 258 337 164 216 283 370 189 249 326 427 170 223
292 382
2037 171 227 301 397 154 204 270 357 170 225 298 394 195 259 342 452 174 231 305
403 2038 175 234 313 418 158 212 284 378 176 236 315 420 200 269 359 478 177 238
317 423
59
Table S-5 continued Projected fuel price indices with assumed general price inflation rates of 2 3 4 and 5 by end-use sector and fuel type
United States Average
Projected April 1 Fuel Price Indices (April 1 2008 = 100)
----------------------------------------------------------------INDUSTRIAL-----------------------------------------------------------------
Electricity
------------------------
Distillate Oil ------------------------
Residual Oil ------------------------
Natural Gas ------------------------
Coal ------------------------
Inflation Rate
Inflation Rate Inflation Rate Inflation Rate Inflation Rate Year 2 3 4 5 2 3 4 5 2 3 4 5 2 3 4 5 2 3
4 5
2009 105 106 107 108 091 092 093 094 107 108 109 110 105 106 107 108 102 103 104
105 2010 106 108 110 112 086 087 089 091 103 105 107 109 104 106 108 110 102 104
106 108
2011 105 108 111 114 087 089 092 095 100 103 106 109 101 104 107 110 103 106 109
112 2012 104 108 112 117 085 088 092 096 094 098 101 105 100 104 108 112 103 108
112 116
2013 104 109 114 120 084 088 092 097 090 095 099 104 098 103 108 114 105 110 115
121 2014 103 110 116 123 084 089 095 100 089 094 100 106 097 103 109 116 106 112
119 126
2015 104 112 120 128 084 090 096 103 086 092 099 106 097 104 111 119 107 115 123
132 2016 106 115 124 134 083 090 097 105 084 090 098 105 098 106 114 123 109 117
127 137
2017 109 119 130 141 084 092 100 109 084 092 100 109 100 109 119 130 111 121 132
144 2018 111 123 135 149 087 096 105 116 087 096 105 116 103 114 126 138 113 124
137 150
2019 114 127 141 157 091 101 113 125 090 101 112 124 107 119 132 147 115 128 142
158 2020 116 130 146 164 096 108 121 136 094 106 119 133 108 121 136 153 117 132
148 166
2021 117 133 151 171 098 111 126 142 097 110 125 142 108 123 139 158 119 136 154
174 2022 119 137 157 179 100 115 132 151 100 115 132 151 111 128 146 167 122 140
161 184
2023 122 141 163 189 103 119 138 159 104 121 139 161 115 134 155 178 125 145 168
194 2024 125 146 170 198 106 124 144 168 108 127 148 172 120 141 164 191 128 149
174 203
2025 128 151 178 209 110 129 152 179 113 133 157 184 125 147 174 204 130 154 181
213 2026 130 156 185 220 113 135 161 191 117 139 166 197 130 155 185 219 134 159
189 225
2027 133 160 193 231 117 141 170 203 120 144 173 208 134 161 194 233 136 164 197
236 2028 137 166 202 244 121 147 179 216 124 151 183 222 140 171 207 251 140 170
206 249
2029 140 172 211 258 125 154 189 230 128 157 193 236 147 180 221 270 142 175 214
262 2030 144 178 220 272 130 161 200 246 133 165 204 252 153 190 235 290 146 181
224 276
2031 147 184 230 286 134 168 210 261 138 172 215 268 159 198 248 309 149 187 233
291 2032 150 190 240 302 138 174 220 276 142 180 227 285 164 207 261 329 153 193
244 307
2033 154 196 250 317 142 181 230 293 147 188 239 304 169 216 275 349 156 199 254
322 2034 157 203 261 334 146 188 242 310 152 196 252 324 175 225 290 372 160 206
265 340
2035 161 209 272 352 150 195 254 328 158 205 266 345 180 235 305 395 164 213 277
358 2036 164 216 283 370 154 203 266 348 163 214 280 367 186 245 321 420 167 220
288 376
2037 168 223 295 389 159 211 279 368 168 224 296 391 193 256 338 446 171 227 301
397 2038 172 230 308 410 163 219 292 390 174 234 312 416 199 267 356 475 175 234
313 416
- NISTIR 85-3273-23
- ABSTRACT
- PREFACE
- ACKNOWLEDGMENTS
- CONTENTS
- LIST OF TABLES
- ABBREVIATIONS
- INTRODUCTION
- PART I TABLES FOR FEDERAL LIFE-CYCLE COST ANALYSIS
- PART II ENERGY PRICE INDICES FOR PRIVATE SECTOR LCC ANALYSIS
-
LIST OF TABLES (continued) Page
Bb-2 OMB UPV discount factors adjusted for fuel price escalation by end-use sector and fuel type Discount Rate = 24 (years 1 to 10) and 28 (years 11 to 30) (OMB Circular A-94) Census Region 2 (Illinois Indiana Iowa Kansas Michigan Minnesota Missouri Nebraska North Dakota Ohio South Dakota Wisconsin) 22
Bb-3 OMB UPV discount factors adjusted for fuel price escalation by end-use sector and fuel type Discount Rate = 24 (years 1 to 10) and 28 (years 11 to 30) (OMB Circular A-94) Census Region 3 (Alabama Arkansas Delaware District of Columbia Florida Georgia Kentucky Louisiana Maryland Mississippi North Carolina Oklahoma South Carolina Tennessee Texas Virginia West Virginia)23
Bb-4 OMB UPV discount factors adjusted for fuel price escalation by end-use sector and fuel type Discount Rate = 24 (years 1 to 10) and 28 (years 11 to 30) (OMB Circular A-94) Census Region 4 (Alaska Arizona California Colorado Hawaii Idaho Montana Nevada New Mexico Oregon Utah Washington Wyoming)24
Bb-5 OMB UPV discount factors adjusted for fuel price escalation by end-use sector and fuel type Discount Rate = 24 (years 1 to 10) and 28 (years 11 to 30) (OMB Circular A-94) United States Average25
Ca-1 Projected fuel price indices (excluding general inflation) by end-use sector and fuel type Census Region 1 (Connecticut Maine Massachusetts New Hampshire New Jersey New York Pennsylvania Rhode Island Vermont)28
Ca-2 Projected fuel price indices (excluding general inflation) by end-use sector and fuel type Census Region 2 (Illinois Indiana Iowa Kansas Michigan Minnesota Missouri Nebraska North Dakota Ohio South Dakota Wisconsin) 30
Ca-3 Projected fuel price indices (excluding general inflation) by end-use sector and fuel type Census Region 3 (Alabama Arkansas Delaware District of Columbia Florida Georgia Kentucky Louisiana Maryland Mississippi North Carolina Oklahoma South Carolina Tennessee Texas Virginia West Virginia) 32
Ca-4 Projected fuel price indices (excluding general inflation) by end-use sector and fuel type Census Region 4 (Alaska Arizona California Colorado Hawaii Idaho Montana Nevada New Mexico Oregon Utah Washington Wyoming) 34
Ca-5 Projected fuel price indices (excluding general inflation) by end-use sector and fuel type United States Average36
Cb-1 Projected average fuel price escalation rates (excluding general price inflation) by end-use sector and fuel type Census Region 1 (Connecticut Maine Massachusetts New Hampshire New Jersey New York Pennsylvania Rhode Island Vermont) 38
xi
LIST OF TABLES (continued) Page
Cb-2 Projected average fuel price escalation rates (excluding general price inflation) by end-use sector and fuel type Census Region 2 (Illinois Indiana Iowa Kansas Michigan Minnesota Missouri Nebraska North Dakota Ohio South Dakota Wisconsin) 39
Cb-3 Projected average fuel price escalation rates (excluding general price inflation) by end-use sector and fuel type Census Region 3 (Alabama Arkansas Delaware District of Columbia Florida Georgia Kentucky Louisiana Maryland Mississippi North Carolina Oklahoma South Carolina Tennessee Texas Virginia West Virginia)40
Cb-4 Projected average fuel price escalation rates (excluding general price inflation) by end-use sector and fuel type Census Region 4 (Alaska Arizona California Colorado Hawaii Idaho Montana Nevada New Mexico Oregon Utah Washington Wyoming) 41
Cb-5 Projected average fuel price escalation rates (excluding general price inflation) by end-use sector and fuel type United States Average 42
S-1 Projected fuel price indices with assumed general price inflation rates of 2 3 4 and 5 by end-use sector and fuel type Census Region 1 (Connecticut Maine Massachusetts New Hampshire New Jersey New York Pennsylvania Rhode Island Vermont) 45
S-2 Projected fuel price indices with assumed general price inflation rates of 2 3 4 and 5 by end-use sector and fuel type Census Region 2 (Illinois Indiana Iowa Kansas Michigan Minnesota Nebraska North Dakota Ohio South Dakota Wisconsin) 48
S-3 Projected fuel price indices with assumed general price inflation rates of 2 3 4 and 5 by end-use sector and fuel type Census Region 3 (Alabama Arkansas Delaware District of Columbia Florida Georgia Kentucky Louisiana Maryland Mississippi North Carolina Oklahoma South Carolina Tennessee Texas Virginia West Virginia)51
S-4 Projected fuel price indices with assumed general price inflation rates of 2 3 4 and 5 by end-use sector and fuel type Census Region 4 (Alaska Arizona California Colorado Hawaii Idaho Montana Nevada New Mexico Oregon Utah Washington Wyoming) 54
S-5 Projected fuel price indices with assumed general price inflation rates of 2 3 4 and 5 by end-use sector and fuel type United States Averagehelliphelliphelliphelliphellip57
xii
ABBREVIATIONS
A - Annual amount A0 - Annual amount at base-date prices AEO2008 - Annual Energy Outlook 2008 (DOE-EIA publication) ASTM - American Society for Testing and Materials BLCC - NIST Building Life Cycle Cost computer program COAL - Coal d - discount rate DIST - Distillate Oil DOE - US Department of Energy e - price escalation rate (annual rate of price change) EIA - Energy Information Administration (DOE) ELEC - Electricity ESPC - Energy Savings Performance Contract FEMP - Federal Energy Management Program FY - Fiscal Year GASLN - Gasoline LCC - Life-Cycle Cost LPG - Liquefied petroleum gas N - Number of discount periods (in years) NEMS - National Energy Modeling System NIST - National Institute of Standards and Technology NTGAS - Natural Gas OMB - Office of Management and Budget RESID - Residual Oil SPV - Single Present Value (factor) UESC - Utility Energy Services Contract UPV - Uniform Present Value (factor) UPV - Modified Uniform Present Value (factor)
xiii
INTRODUCTION
This report provides tables of present-value factors for use in the life-cycle cost analysis of capital investment projects for federal facilities It also provides energy price indices based on Department of Energy (DOE) forecasts from 2008 to 2038 The factors and indices presented in this report are useful for determining the present value of future project-related costs especially those related to operational energy costs Discount factors included in this report are based on two different federal sources (1) the DOE discount rate for projects related to energy conservation renewable energy resources and water conservation and (2) Office of Management and Budget (OMB) discount rates from Circular A-94 for use with most other capital investment projects in federal facilities
The DOE discount and inflation rates for 2008 are as follows
Real rate (excluding general price inflation) 30 Nominal rate (including general price inflation) 49 Implied long-term average rate of inflation 18
The DOE nominal discount rate is based on long-term Treasury bond rates averaged over the 12 months prior to the preparation of this report The nominal or market rate is converted to a real rate to correspond with the constant-dollar analysis approach used in most federal life-cycle cost (LCC) analyses The method for calculating the real discount rate from the nominal discount rate is described in 10 CFR 436 and uses the projected rate of general inflation published in the most recent Report of the Presidentrsquos Economic Advisors Analytical Perspectives The procedure would result in a discount rate for 2008 lower than the 30 floor prescribed in 10 CFR 436 Thus the 30 floor is used as the real discount rate for FEMP analyses in 2008 The implied long-term average rate of inflation was calculated as 18 Federal agencies and contractors to federal agencies are required by 10 CFR 436 to use the DOE discount rates when conducting LCC analyses related to energy conservation renewable energy resources and water conservation projects for federal facilities
The nominal and real discount rates applicable to general (non-energy or water) capital investments are published annually in OMB Circular A-94 Appendix C OMB has specified two basic types of discount rates (1) a discount rate for public investment and regulatory analyses and (2) a discount rate for cost-effectiveness lease-purchase and related analyses Only discount rates for the second type of analyses are included in this Annual Supplement since the primary purpose of this report is to support cost-effectiveness studies related to the design and operation of federal facilities
OMB discount rates for cost-effectiveness and lease-purchase studies are based on interest rates on Treasury Notes and Bonds with maturities ranging from 3 to 30 years Currently (as of January 2008) five maturities have been specifically identified by OMB and are shown here with the corresponding real interest rate to be used as the discount rate for studies subject to OMB Circular A-94
Maturity 3-year 5-year 7-year 10-year 30-yearRate 21 23 24 26 28
OMB suggests that the actual discount rate for an economic analysis be interpolated from these maturities and rates based on the study period used in the analysis Due to limitations on the size of this Annual Supplement discount factors for only two of these maturities are presented factors for short term analyses (up to 10 years) based on the 7-year real rate (24 ) and factors for long-term
1
analyses (longer than 10 years) based on the 30-year real rate (28 ) As a result these discount factors are for approximation purposes only It is suggested that the NIST Building Life Cycle Cost (BLCC) or DISCOUNT programs be used to compute the present value factors for the discount rate corresponding to the length of the study period when approximate values are not satisfactory for the project analysis (See preface for details on obtaining these programs)
The energy price indices and corresponding present value factors published in this report are computed from energy price forecasts provided to NIST by the Department of Energys Energy Information Administration (EIA) The EIA energy price forecast used in this report was the most recent available at the time that this report was prepared A description of the methodology used by EIA to project energy prices through 2038 is included in section B of this report DOE has not projected escalation rates for water prices to be used in the LCC analysis of water conservation projects Water escalation rates should be obtained from the local water utility when possible
Federal agencies and contractors to federal agencies are encouraged to seek energy price projections from their local utility to use in place of the DOEEIA regional projections especially when evaluating alternative fuel types In such cases the NIST BLCC or DISCOUNT programs can be used to calculate appropriate modified uniform present value (UPV) factors for use in the LCC analysis of federal energy conservation or renewable resource projects Otherwise 10 CFR 436 requires the use of the DOE energy price forecasts when conducting LCC analyses of such projects The UPV factors for energy costs presented in this report have been precalculated with the DOE forecast data Thus the use of these UPV factors automatically ensures that the DOE forecast data have been included in the analysis
All of the tables of discount factors contained in this report are based on real discount rates and are therefore intended for use only with economic analyses conducted in constant dollars (in which the purchasing power of the dollar is held constant) The energy price escalation rates and corresponding energy price indices contained in this report are also expressed in real terms If nominal discount rates and current dollar costs (which both include inflation) are used in the LCC analyses of federal projects choose the current-dollar-analysis option in the BLCC5 computer program which uses a nominal discount rate and adds the rate of general inflation to all dollar amounts
This report uses the term present value instead of present worth for the discount factors presented The meaning of these two terms is considered to be identical for purposes of economic analysis This change in terminology was made to be consistent with the terms used in the American Society for Testing and Materials (ASTM) compilation of standards on building economics (ASTM Standards on Building Economics 6th Edition ASTM West Conshohocken PA 2007)
In all of the tables the ldquoend-of-yearrdquo discounting convention is used that is all factors and indices are computed to adjust future dollar amounts to present value from the end of the year in which they are expected to occur The factors and indices in this publication which include energy price escalation rates (eg UPV factors and energy price indices) were calculated using April 1 2008 (the date of this publication) as their base date However these factors and indices can be used without adjustment for the LCC analysis of projects with other base dates until the release of the next revision of this publication (April 2009) Adjustment of these factors and indices for differences in the month-specific base date is not generally warranted due to uncertainties in estimating future energy prices
2
PART I TABLES FOR FEDERAL LIFE-CYCLE COST ANALYSIS
A Single Present Value and Uniform Present Value Factors for Non-Fuel Costs
Table A-1 presents the single present value (SPV) factors for finding the present value of future non-fuel non-annually recurring costs such as repair and replacement costs and salvage values The formula for finding the present value (P) of a future cost occurring in year t (Ct) is the following
1P = Ct times t = Ct times SPVt (1+ d )
where d = discount rate and t = number of time periods (years) between the present time and the time the cost is
incurred
Table A-2 presents uniform present value (UPV) factors for finding the present value of future non-fuel costs recurring annually such as routine maintenance costs The formula for finding the present value (P) of an annually recurring uniform cost (A) is the following
P = Atimes (1 d +
(1 d +
) d
N
) minus N
1 = AtimesUPVN
where d = discount rate and N = number of time periods (years) over which A recurs
Tables A-3 (abc) present modified uniform present value (UPV) factors for finding the present value of annually recurring non-fuel costs such as water costs which are expected to change from year to year at a constant rate of change (or escalation rate) over the study period The escalation rate can be positive or negative The formula for finding the present value (P) of an annually recurring cost at base-date prices (A0) changing at escalation rate e is the following
P = A0 times ⎜⎛ 1+ e
⎟⎞⎢⎡ 1minus ⎜⎛
1+ e ⎟⎞
N
⎥⎤ = AtimesUPV
N (d ne e)⎝ d minus e ⎠⎢⎣ ⎝1+ d ⎠ ⎥⎦
or
P = A0 times N = AtimesUPV N (d = e)
where A0 = annually recurring cost at base-date prices d = discount rate e = escalation rate and N = number of time periods (years) over which A recurs
3
Note if the discount rate is expressed in real terms ie net of general inflation then the escalation rate must also be expressed in real terms If the discount rate is expressed in nominal terms ie including general inflation then the escalation rate must also be expressed in nominal terms
In tables A-1 A-2 and A-3 (abc) SPV UPV and UPV factors are provided for both the DOE and the OMB Circular A-94 real discount rates current as of the date of this publication The FEMP SPV UPV and UPV factors were computed using the DOE discount rate The FEMP factors are for finding the present value of future costs associated with federal energy and water conservation projects and renewable energy projects The OMB SPV UPV and UPV factors were computed using the OMB discount rates The OMB factors are for finding the present value of future costs associated with most other federal projects (except those specifically exempted from OMB Circular A-94) The DOE and OMB discount rates used in computing these tables are real rates exclusive of general price inflation Thus the resulting discount factors are intended for use with future costs that are stated in constant dollars
Note We have added to table A-3a a column of UPV factors that incorporate an escalation rate of -18 the negative of the inflation rate used to calculate the DOE nominal discount rate for 2008 The UPV factors in this column can be used to calculate present values of fixed dollar amounts when performing a constant-dollar analysis An example might be a fixed contract payment in an ESPC project For these fixed amounts the assumption that in a constant-dollar analysis all cash flows change at the rate of general inflation (so that the differential escalation rate is zero) does not apply In real terms fixed amounts change at a differential rate equal to the negative of the inflation rate
Examples of How to Use the Factors
SPV (FEMP) To compute the present value of a replacement cost expected to occur in the 8th year for an energy efficient heating system go to Table A-1 find the 30 SPV factor for year 8 (0789) and multiply the factor by the replacement cost as of the base date
SPV (OMB Short-term) To compute the present value of a repair cost in the 5th year for a floor covering (non-energy related) go to Table A-1 find the 24 SPV factor for year 5 (0888) and multiply the factor by the repair cost as of the base date
SPV (OMB Long-term) To compute the present value of a repair cost in the 15th year for a floor covering (non-energy related) go to Table A-1 find the 28 SPV factor for year 15 (0661) and multiply the factor by the repair cost as of the base date
UPV (FEMP) To compute the present value of an annually recurring maintenance cost for a renewable energy system over 20 years go to Table A-2 find the 30 UPV factor for 20 years (1488) and multiply the factor by the annual maintenance cost as of the base date
UPV (OMB Short-term) To compute the present value of annually recurring costs of office cleaning over 10 years (for a project not primarily related to energy conservation) go to Table A-2 find the 24 UPV factor for 10 years (880) and multiply the factor by the annual cleaning cost as of the base date
4
UPV (OMB Long-term) To compute the present value of annually recurring costs of office cleaning over 25 years (for a project not primarily related to energy conservation) got to Table A-2 find the 28 UPV factor for 25 years (1781) and multiply the factor by the annual cleaning cost as of the base date
UPV (all) To compute the present value of annually recurring costs of water usage which are expected to increase at 2 faster than the rate of general inflation over 25 years find the UPV factor from table A-3 (a b or c as appropriate) that corresponds to 2 escalation and a 25 year study period From table A-3a (30 DOE discount rate) the corresponding UPV factor is 2208 Multiply this factor by the annual water cost as computed at base year prices to determine the present value of these water costs over the entire 25 years
UPV (negative inflation rate) To compute the present value of an annually recurring contract payment that is fixed over a contract period of 10 years find the UPV factor from table A-3a that corresponds to an escalation of -18 and a 10-year time period From table A-3a (30 DOE discount rate) the corresponding UPV factor is 776 Multiply this factor by the annual contract payment as of the base year to determine the present value of these contract payments over the entire 10-year period
Note UPV factors are generally applied to costs that recur annually in substantially the same amount Examples of such costs are routine operating and maintenance costs UPV factors are generally applied to costs that recur annually but change from year to year at a constant escalation rate Examples of such costs are water usage costs when they increase from year to year These costs usually occur every year over the service period of the building life If there is a planningdesignconstruction period before the service life begins during which these annual costs are not incurred the appropriate UPV (or UPV) factor for the service period is the difference between the UPV (or UPV) factor for the entire study period and the UPV (or UPV) factor for the planningdesignconstruction period For example if the planning designconstruction period is 3 years and the service period is 25 years for a total study period of 28 years the corresponding UPV factor (from Table A-2 DOE 30 discount rate) is 1876 - 283 = 1593
For further explanation and illustration of how to use these factors see NIST Handbook 135
5
Table A-1 SPV factors for finding the present value of future single costs (non-fuel)
Single Present Value (SPV) Factors---------- -----------------------------------------Number of DOE OMB Discount Ratesa
years frombase date
Discount rate 30
Short termb Long Termc
24 28 ---------- ------------- ---------- ---------
025 0993 0994 0993 050 0985 0988 0986 075 0978 0982 0980 1 0971 0977 0973 2 0943 0954 0946 3 0915 0931 0920 4 0888 0909 0895 5 0863 0888 0871 6 0837 0867 0847 7 0813 0847 0824 8 0789 0827 0802 9 0766 0808 0780 10 0744 0789 0759 11 0722 0738 12 0701 0718 13 0681 0698 14 0661 0679 15 0642 0661 16 0623 0643 17 0605 0625 18 0587 0608 19 0570 0592 20 0554 0576 21 0538 0560 22 0522 0545 23 0507 0530 24 0492 0515 25 0478 0501 26 0464 0488 27 0450 0474 28 0437 0462 29 0424 0449 30 0412 0437
---------- ------------- ---------- ---------
aOMB discount rates as of February 2008 bShort-term discount rate based on OMB discount rate for 7-year study period cLong-term discount rate based on OMB discount rate for 30-year study period
6
Table A-2 UPV factors for finding the present value of annually recurring uniform costs (non-fuel)
Uniform Present Value (UPV) Factors---------- -----------------------------------------Number of DOE OMB Discount Ratesa
years frombase date
Discount rate 30
Short termb Long Termc
24 28 ---------- ------------- ---------- ---------
1 097 098 097 2 191 193 192 3 283 286 284 4 372 377 373 5 458 466 461 6 542 553 545 7 623 637 628 8 702 720 708 9 779 801 786 10 853 880 862 11 925 936 12 995 1007 13 1063 1077 14 1130 1145 15 1194 1211 16 1256 1276 17 1317 1338 18 1375 1399 19 1432 1458 20 1488 1516 21 1542 1572 22 1594 1626 23 1644 1679 24 1694 1731 25 1741 1781 26 1788 1830 27 1833 1877 28 1876 1923 29 1919 1968 30 1960 2012
---------- ------------- ---------- ---------
aOMB discount rates as of February 2008 bShort-term discount rate based on OMB discount rate for 7-year study period cLong-term discount rate based on OMB discount rate for 30-year study period
7
8
Table A-3a UPV factors for finding the present value of annually recurring costs changing at a constant escalation rate DOE discount rate
DOE discount rate = 30
Modified Uniform Present Value (UPV) Factors (non-fuel)
---------------------------------------------------------------------------------------
Number of Annual rate of price change
years from -----------------------------------------------------------------------------
base date -4 -3 -2 -18 -1 0 1 2 3 4 5
--------------- ----- ----- ----- ----- ----- ----- ----- ----- ----- -----
1
093 094 095 095 096 097 098 099 100 101 102
2
180 183 186 186 189 191 194 197 200 203 206
3
261 266 272 273 277 283 288 294 300 306 312
4
337 345 354 356 363 372 381 390 400 410 420
5
407 419 432 434 445 458 472 486 500 515 530
6
472 489 506 509 524 542 561 580 600 621 642
7
533 555 577 581 599 623 648 673 700 728 757
8
590 616 644 649 672 702 733 766 800 836 873
9
644 675 708 714 742 779 817 857 900 945 992
10
693 730 768 776 809 853 899 948 1000 1055 1113
11
739 781 826 836 874 925 980 1038 1100 1166 1237
12
782 830 881 892 936 995 1059 1127 1200 1278 1363
13
822 876 934 946 996 1063 1136 1215 1300 1392 1491
14
859 919 983 997 1054 1130 1212 1302 1400 1506 1622
15
894 960 1031 1046 1109 1194 1287 1389 1500 1622 1756
16
927 998 1076 1092 1162 1256 1360 1474 1600 1739 1892
17
957 1034 1119 1137 1213 1317 1432 1559 1700 1857 2030
18
985 1068 1160 1179 1262 1375 1502 1643 1800 1976 2172
19
1011 1100 1199 1220 1309 1432 1571 1726 1900 2096 2316
20
1036 1130 1236 1258 1354 1488 1638 1808 2000 2217 2463
21
1059 1158 1271 1295 1398 1542 1705 1890 2100 2339 2612
22
1080 1185 1304 1330 1440 1594 1769 1970 2200 2463 2765
23
1100 1210 1336 1363 1480 1644 1833 2050 2300 2588 2921
24
1118 1234 1366 1395 1518 1694 1896 2129 2400 2714 3079
25
1135 1256 1395 1425 1556 1741 1957 2208 2500 2841 3241
26
1151 1277 1423 1454 1591 1788 2017 2285 2600 2970 3406
27
1166 1297 1449 1482 1626 1833 2076 2362 2700 3100 3574
28
1180 1316 1473 1508 1659 1876 2134 2438 2800 3231 3745
29
1193 1333 1497 1533 1690 1919 2190 2514 2900 3363 3920
30
1205 1350 1520 1557 1721 1960 2246 2588 3000 3497 4098
9
Table A-3b UPV factors for finding the present value of annually recurring amounts changing at a constant escalation rate OMB short-term discount rate
OMB short-term discount rate = 24 a
Modified Uniform Present Value (UPV) Factors (non-fuel)
---------------------------------------------------------------------------------------
Number of Annual rate of price change
years from -----------------------------------------------------------------------------
base date -5 -4 -3 -2 -1 0 1 2 3 4 5
--------------- ----- ----- ----- ----- ----- ----- ----- ----- ----- -----
1
093 094 095 096 097 098 099 100 101 102 103
2
179 182 184 187 190 193 196 199 202 205 208
3
259 264 269 275 281 286 292 298 304 309 315
4
333 341 350 359 368 377 387 396 406 416 426
5
401 414 426 439 452 466 480 494 509 524 539
6
465 482 498 516 534 553 572 592 612 634 656
7
524 545 567 589 613 637 663 689 717 745 775
8
579 605 632 660 689 720 752 786 821 858 897
9
630 661 693 727 763 801 841 883 927 973 1022
10
677 713 751 792 834 880 928 979 1033 1090 1151
aOMB discount rate as of February 2008 Short-term discount rate based on OMB discount rate for 7-year study period
10
Table A-3c UPV factors for finding the present value of annually recurring amounts changing at a constant escalation rate OMB long-term discount rate
OMB long-term discount rate = 28 a
----------
Modified Uniform Present Value (UPV) Factors (non-fuel)
-----------------------------------------------------------------------------
Number of years frombase date
Annual rate of price change
-5 -4 -3 -2 -1 0 1 2 3 4 5 -----------------------------------------------------------------------------
--------------- ----- ----- ----- ----- ----- ----- ----- ----- ----- -----
1
092 093 094 095 096 097 098 099 100 101 102
2
178 181 183 186 189 192 195 198 201 204 206
3
257 262 267 273 278 284 290 295 301 307 313
4
330 338 347 355 364 373 383 392 402 412 422
5
397 409 421 434 447 461 474 488 503 518 533
6
459 475 492 509 527 545 564 584 604 625 647
7
517 537 559 581 604 628 653 679 705 733 763
8
570 595 621 649 678 708 739 772 807 843 881
9
619 649 681 714 749 786 825 866 909 954 1002
10
665 700 737 776 818 862 909 958 1011 1067 1126
11
707 747 790 835 884 936 991 1050 1113 1180 1252
12
745 791 839 891 947 1007 1072 1141 1215 1295 1381
13
781 832 886 945 1009 1077 1151 1231 1318 1411 1512
14
814 870 931 996 1068 1145 1229 1321 1421 1529 1647
15
845 906 973 1045 1125 1211 1306 1410 1524 1648 1784
16
873 939 1012 1092 1179 1276 1381 1498 1627 1768 1925
17
899 971 1049 1136 1232 1338 1456 1586 1730 1890 2068
18
924 1000 1084 1178 1283 1399 1528 1673 1834 2013 2214
19
946 1027 1118 1219 1332 1458 1600 1759 1937 2138 2364
20
967 1053 1149 1257 1379 1516 1670 1844 2041 2264 2517
21
986 1076 1178 1294 1424 1572 1739 1929 2146 2392 2673
22
1003 1099 1206 1329 1468 1626 1807 2013 2250 2521 2832
23
1020 1119 1233 1362 1510 1679 1873 2097 2354 2652 2995
24
1035 1139 1257 1394 1550 1731 1939 2180 2459 2784 3161
25
1049 1157 1281 1424 1589 1781 2003 2262 2564 2917 3331
26
1061 1174 1303 1453 1627 1830 2066 2344 2669 3053 3504
27
1073 1189 1324 1480 1663 1877 2128 2425 2775 3189 3681
28
1084 1204 1343 1506 1698 1923 2189 2505 2880 3328 3862
29
1094 1218 1362 1531 1731 1968 2249 2585 2986 3468 4047
30
1104 1231 1380 1555 1764 2012 2308 2664 3092 3609 4236
aOMB discount rate as of February 2008 Long-term discount rate based on OMB discount rate for 30-year study period
B Modified Uniform Present Value Factors for Fuel Costs
This section presents FEMP and OMB modified uniform present value (UPV) discount factors for calculating the present value of energy usage for federal projects Factors are provided for the four major Census regions and for the overall United States The factors are modified in the sense that they incorporate energy price escalation rates based on future energy prices projected by DOE for the years 2008 to 2038 There are two sets of UPV tables the Ba tables present FEMP UPV factors based on the DOE discount rate (30 real) and the Bb tables present OMB UPV factors based on two OMB discount rates (24 real for short-term study periods of 1 to 10 years 28 real for long-term study periods of 11 to 30 years) The underlying energy price indices for the years 2008 to 2038 on which these UPV calculations are based are shown in tables Ca-1 through Ca-5 The corresponding average energy price escalation rates for selected time intervals between 2008 and 2038 are shown in tables Cb-1 through Cb-5
Energy Price Projections
The FEMP and OMB UPV factors incorporate energy price escalation rates computed from future energy prices projected by the Energy Information Administration (EIA) of the US Department of Energy Energy prices through 2030 were generated by EIA using the National Energy Modeling System (NEMS) and published in the Annual Energy Outlook 2008 (AEO2008) At the request of FEMP EIA extrapolated energy prices from 2031 to 2038 based on selected growth rates from the AEO2008 projections
NEMS is an energy market model designed to project the impacts of alternative energy policies or assumptions on US energy markets NEMS produces projections of the US energy future given current laws and policies and other key assumptions including macroeconomic indicators from Data Resources Inc the production policy of the Organization of Petroleum Exporting Countries the size of the economically recoverable resource base for fossil fuels and the rate of development and penetration of new technologies NEMS balances energy supply and demands with modules representing primary fuel supply end-use demand for four sectors and conversion of energy by refineries and electricity generators Macroeconomic and international oil modules reflect the impacts of energy prices production and consumption on world oil markets and the economy
The EIA energy price projections presented in this report like those of other forecasters are dependent on the data methodologies and specific assumptions used in their development Many of the assumptions concerning the future cannot be known with any degree of certainty Thus the projections are not statements of what will happen but what might happen given the particular assumptions and methodologies used Although EIA has endeavored to make these forecasts as objective reliable and useful as possible these projections should serve as an adjunct to not a substitute for the analytical process The AEO2008 was prepared by EIA as required under statute by federal legislation The price projections to 2038 were prepared in accordance with a Service Request from the Federal Energy Management Program
11
UPV Calculation Method
The formula for finding the present value (P) of future energy costs or savings is the following
N
P = A0 xsum I(2008+ t )
t = A0 xUPVN
iminus1 (1+ d )
where A0 = annual cost of energy as of the base date (April 1 2008) t = index used to designate the year of energy usage N = number of periods eg years over which energy costs or savings accrue I(2008+t) = projected average fuel price index1 given in Tables Ca-1 through Ca-5
for the year 2008+t (where I2008 = 100) and d = the real discount rate
This formula is based on end-of-year energy prices and end-of-year discounting Note that annual energy costs as of the base date of the LCC analysis (A0 to be supplied by the analyst) should reflect the current energy price schedule as of that date which may not be the same as the energy price itself on that date2 That is the annual energy cost should reflect summer-winter rate differences time-of-use rates block rates considerations and demand charges (as appropriate) anticipated to be in effect that year If energy and demand costs are calculated separately (as is sometimes done for electricity) the UPV factor should be applied to both costs
The data in the tables that follow are reported for the four Census regions and the US average Figure B-1 presents a map showing the states corresponding to the four Census regions The Census regions do not include American Samoa Canal Zone Guam Puerto Rico Trust Territory of the Pacific Islands or the Virgin Islands Analysts of federal projects in these areas should use data that are reasonable under the circumstances and may refer to the tables with US average data for guidance
1 For greater precision the UPV factors reported in the Ba and Bb tables were computed using the unrounded form of the indices given in Tables Ca-1 through Ca-5
2 While the UPV factors provided in this publication were computed using energy price indices that correspond to energy prices as of April 1 in the current and future years the analyst is encouraged to use for determining A0 the energy prices prevailing as of the base date of the LCC analysis for the project evaluated
12
13
Figure B-1
Source US Census Bureau
B1 FEMP Modified Uniform Present Value Factors
The FEMP Modified Uniform Present Value (FEMP UPV) factors presented in the Ba tables based on the current DOE discount rate (30 ) are for calculating the present value of energy costs or savings accruing over 1 to 25 years and are to be used in life-cycle cost analyses of federal energy conservation and renewable energy projects Factors are reported in the Ba tables for 30 years to accommodate a planningdesignconstruction period of up to 5 years (See Examples of How to Use FEMP UPV Factors below for instructions on use with planningdesignconstruction periods)
These factors apply only to annual energy usage or energy savings that are assumed to be the same each year over the service period The NIST BLCC computer program can compute the present value of energy usage and savings that are not the same in each year
Examples of How to Use the FEMP UPV Factors
FEMP UPV no planningdesignconstruction period To compute the present value of heating with natural gas over 25 years in a federal office building in New Mexico go to Table Ba-4 find the FEMP UPV factor for commercial natural gas for 25 years (1641) and multiply this factor by the annual heating cost at base-date natural gas prices
FEMP UPV with planningdesignconstruction period To compute a present value factor for a service period following a planningdesignconstruction period (1) find the FEMP UPV factor for the combined length of the planningdesignconstruction period and the service period (not to exceed 30 years) and (2) subtract from (1) the FEMP UPV factor for the planningdesign construction period alone The difference is the FEMP UPV factor for the years over which energy costs or savings actually accrue For example suppose a new federal office building in New York is being evaluated with several energy conserving design options It is expected to have a planningdesignconstruction period of 5 years after which it will be occupied for 25 years To compute the present value of natural gas costs over 25 years of occupancy go to Table Ba-1 and find the FEMP UPV factors for commercial natural gas for 5 years (443) and for 30 years (1899) The difference (1456) is the FEMP UPV factor for natural gas costs over 25 years beginning 5 years after the base date Multiply 1456 by the annual natural gas cost at base date prices (not occupancy-date prices) to calculate the present value of natural gas costs over the entire 25-year occupancy period
14
Table Ba-1 FEMP UPV Discount Factors adjusted for fuel price escalation by end-use sector and fuel type
15
Discount rate = 30 (DOE)
Census Region 1 (Connecticut Maine Massachusetts New HampshireNew Jersey New York Pennsylvania Rhode Island Vermont)
RESIDENTIAL COMMERCIAL INDUSTRIAL TRANSPORT
N Elec Dist LPG NtGas Elec Dist Resid NtGas Coal Elec Dist Resid NtGas Coal Gasln N
------ ----- ----- ----- ----- ----- ----- ----- ----- ----- ----- ----- ----- ----- ----- -
1 100 087 094 098 099 089 097 099 098 099 089 097 100 097 093 1
2 195 165 182 191 191 170 186 192 191 190 169 186 193 190 176 2
3 287 237 266 279 278 245 269 280 278 274 245 269 281 281 254 3
4 376 305 347 364 361 316 345 363 359 353 317 345 363 368 328 4
5 461 368 425 444 440 381 417 443 435 427 384 416 440 452 398 5
6 544 427 501 521 515 443 483 519 509 498 448 482 513 534 465 6
7 625 483 573 595 587 502 544 592 579 565 509 543 582 612 529 7
8 704 536 643 667 658 557 601 662 646 630 566 599 648 688 588 8
9 780 586 712 736 727 610 655 731 710 694 621 653 713 761 646 9
10 855 636 778 805 794 662 708 799 771 757 675 706 776 831 703 10 11 928 684 842 872 860 714 760 865 829 817 728 758 838 898 760 11 12 998 732 905 937 923 765 812 929 886 876 782 810 898 964 816 12 13 1066 778 965 999 985 814 863 991 942 931 834 861 955 1029 871 13 14 1131 824 1024 1060 1044 863 913 1052 996 986 885 911 1011 1091 924 14 15 1196 868 1081 1120 1103 911 963 1112 1049 1039 935 960 1066 1151 976 15 16 1258 912 1137 1179 1160 958 1012 1171 1100 1091 984 1009 1120 1210 1027 16 17 1319 956 1192 1237 1215 1004 1060 1229 1150 1142 1032 1057 1173 1266 1077 17 18 1378 998 1245 1294 1269 1049 1108 1286 1199 1191 1079 1104 1226 1321 1125 18 19 1436 1040 1296 1350 1322 1094 1154 1342 1247 1240 1126 1150 1277 1375 1173 19 20 1492 1082 1346 1405 1374 1138 1200 1398 1295 1287 1171 1195 1328 1426 1219 20 21 1547 1123 1396 1459 1424 1182 1245 1453 1341 1333 1217 1240 1378 1477 1264 21 22 1600 1163 1444 1512 1473 1225 1289 1507 1386 1379 1261 1284 1428 1526 1309 22 23 1652 1202 1490 1564 1521 1267 1333 1560 1430 1423 1305 1328 1477 1574 1353 23 24 1702 1241 1536 1615 1568 1308 1377 1611 1473 1466 1347 1371 1525 1621 1395 24 25 1752 1278 1581 1665 1614 1349 1419 1662 1514 1508 1389 1413 1572 1666 1437 25 26 1799 1315 1624 1713 1658 1389 1462 1712 1555 1549 1430 1455 1618 1710 1477 26 27 1846 1352 1666 1761 1701 1427 1503 1760 1594 1588 1470 1496 1663 1753 1517 27 28 1891 1387 1708 1807 1743 1465 1544 1807 1633 1627 1509 1536 1708 1795 1556 28 29 1935 1422 1748 1853 1785 1503 1584 1854 1670 1665 1548 1576 1751 1836 1594 29 30 1978 1456 1788 1897 1825 1539 1624 1899 1707 1702 1586 1615 1794 1876 1631 30
Note UPV factors are reported for years 26-30 to accommodate a planningconstruction period of up to 5 years See p 14 for instructions on use page xiii for abbreviations
Table Ba-2 FEMP UPV Discount Factors adjusted for fuel price escalation by end-use sector and fuel type
16
Discount Rate = 30 (DOE)
Census Region 2 (Illinois Indiana Iowa Kansas Michigan MinnesotaMissouri Nebraska North Dakota Ohio South Dakota Wisconsin)
RESIDENTIAL
COMMERCIAL INDUSTRIAL TRANSPORT
N Elec Dist LPG NtGas Elec Dist Resid NtGas Coal Elec Dist Resid NtGas Coal Gasln N
------ ----- ----- ----- ----- ----- ----- ----- ----- ----- ----- ----- ----- ----- ----- -
1 100 084 098 097 100 086 108 098 099 101 088 105 100 098 095 1
2 198 158 193 188 198 162 208 189 195 199 168 201 194 191 180 2
3 293 227 283 274 292 235 300 274 290 291 244 290 283 282 260 3
4 383 291 370 355 381 302 378 355 382 378 316 367 365 369 336 4
5 471 350 453 433 465 363 449 432 471 460 382 437 443 453 408 5
6 555 406 533 507 546 422 516 505 556 538 446 503 516 534 477 6
7 636 458 611 577 623 477 579 575 639 612 506 564 586 613 542 7
8 715 507 686 646 698 529 637 643 719 685 563 621 653 689 604 8
9 792 554 758 713 770 579 693 709 797 755 618 676 718 763 664 9
10 867 599 829 778 842 627 748 774 872 824 672 730 782 835 722 10 11 940 645 898 842 911 676 803 838 945 891 725 783 844 905 781 11 12 1011 689 965 904 978 724 858 900 1015 956 779 837 904 973 839 12 13 1080 732 1030 964 1044 771 913 959 1084 1018 831 889 961 1038 895 13 14 1146 774 1092 1022 1107 816 966 1017 1150 1078 881 941 1017 1102 950 14 15 1211 816 1154 1079 1169 861 1019 1074 1215 1137 931 992 1072 1165 1004 15 16 1273 857 1214 1136 1228 906 1072 1131 1278 1194 979 1043 1127 1226 1055 16 17 1334 898 1272 1191 1287 949 1124 1187 1339 1250 1027 1093 1181 1285 1106 17 18 1393 938 1329 1246 1343 992 1175 1242 1398 1303 1074 1142 1234 1343 1156 18 19 1450 978 1385 1300 1398 1035 1225 1296 1455 1355 1120 1191 1287 1399 1204 19 20 1505 1017 1440 1354 1451 1076 1275 1350 1511 1406 1166 1238 1339 1454 1252 20 21 1559 1055 1493 1407 1503 1118 1323 1404 1565 1456 1210 1285 1392 1508 1299 21 22 1612 1093 1546 1459 1554 1158 1371 1457 1618 1504 1254 1331 1444 1560 1344 22 23 1663 1130 1597 1510 1604 1198 1418 1509 1669 1551 1298 1377 1495 1610 1389 23 24 1712 1166 1647 1560 1653 1237 1464 1560 1719 1597 1340 1421 1545 1660 1433 24 25 1760 1201 1696 1609 1700 1276 1510 1609 1768 1642 1382 1465 1594 1708 1475 25 26 1807 1236 1744 1657 1746 1313 1555 1658 1815 1685 1423 1509 1642 1755 1517 26 27 1852 1270 1790 1704 1790 1350 1599 1706 1861 1727 1462 1551 1690 1800 1558 27 28 1896 1303 1836 1750 1834 1386 1642 1753 1906 1768 1501 1593 1736 1845 1598 28 29 1939 1336 1880 1795 1876 1422 1685 1799 1950 1808 1540 1634 1782 1888 1636 29 30 1980 1368 1924 1839 1917 1456 1727 1843 1993 1847 1577 1675 1827 1930 1674 30
Note UPV factors are reported for years 26-30 to accommodate a planningconstruction period of up to 5 years See p 14 for instructions on use page xiii for abbreviations
Table Ba-3 FEMP UPV Discount Factors adjusted for fuel price escalation by end-use sector and fuel type
17
Discount Rate = 30 (DOE)
Census Region 3 (Alabama Arkansas Delaware District of Columbia Florida Georgia Kentucky LouisianaMaryland Mississippi North Carolina Oklahoma South Carolina Tennessee Texas Virginia West Virginia)
RESIDENTIAL
COMMERCIAL INDUSTRIAL TRANSPORT
N Elec Dist LPG NtGas Elec Dist Resid NtGas Coal Elec Dist Resid NtGas Coal Gasln N
------ ----- ----- ----- ----- ----- ----- ----- ----- ----- ----- ----- ----- ----- ----- -
1 100 087 094 097 100 088 111 099 098 101 088 103 101 097 095 1
2 198 164 182 188 198 168 214 191 192 198 166 196 196 189 181 2
3 292 237 267 275 290 243 309 279 280 290 243 282 283 275 260 3
4 381 304 349 357 378 312 395 362 363 377 314 359 365 357 335 4
5 468 367 428 436 463 376 474 441 442 459 380 429 442 436 405 5
6 551 426 504 512 543 437 548 516 517 538 443 495 515 511 472 6
7 631 482 577 585 620 495 615 589 589 613 503 555 584 584 536 7
8 709 534 648 655 695 548 677 658 657 687 559 611 650 654 596 8
9 785 584 717 724 769 600 737 727 723 758 614 665 714 722 654 9
10 858 634 784 791 839 651 795 794 787 827 667 717 777 787 711 10 11 929 682 850 857 908 701 853 860 848 895 720 769 840 850 768 11 12 999 729 913 922 975 751 910 924 907 960 773 821 900 912 825 12 13 1066 776 975 985 1040 800 966 987 965 1023 825 871 959 971 880 13 14 1131 821 1035 1046 1103 847 1020 1048 1021 1085 875 921 1016 1029 934 14 15 1195 865 1093 1106 1164 894 1075 1108 1076 1145 924 970 1073 1085 986 15 16 1256 909 1150 1166 1223 940 1128 1168 1129 1203 972 1019 1129 1140 1037 16 17 1316 953 1206 1224 1281 985 1182 1226 1180 1259 1020 1067 1184 1193 1086 17 18 1375 995 1260 1281 1337 1030 1234 1284 1229 1314 1067 1115 1239 1245 1135 18 19 1431 1037 1312 1338 1392 1074 1286 1340 1277 1368 1113 1162 1293 1295 1182 19 20 1486 1078 1364 1393 1445 1118 1337 1396 1324 1420 1158 1208 1346 1343 1229 20 21 1540 1119 1414 1448 1497 1161 1387 1451 1369 1471 1202 1253 1399 1391 1274 21 22 1592 1159 1464 1502 1547 1203 1436 1506 1413 1521 1247 1298 1452 1437 1319 22 23 1643 1198 1511 1555 1596 1245 1484 1559 1456 1569 1290 1341 1504 1481 1363 23 24 1692 1237 1558 1607 1644 1286 1532 1611 1498 1616 1332 1385 1555 1525 1406 24 25 1740 1274 1604 1657 1691 1326 1579 1662 1539 1661 1374 1427 1605 1568 1447 25 26 1787 1311 1649 1706 1736 1365 1626 1712 1579 1706 1414 1469 1654 1609 1488 26 27 1832 1347 1692 1755 1780 1403 1671 1761 1618 1749 1454 1510 1703 1649 1528 27 28 1876 1383 1734 1802 1823 1441 1716 1809 1655 1791 1493 1551 1750 1688 1567 28 29 1919 1417 1776 1848 1864 1478 1760 1856 1692 1832 1531 1591 1797 1727 1605 29 30 1960 1451 1816 1893 1904 1514 1804 1902 1728 1872 1569 1630 1843 1764 1643 30
Note UPV factors are reported for years 26-30 to accommodate a planningconstruction period of up to 5 years See p 14 for instructions on use page xiii for abbreviations
Table Ba-4 FEMP UPV Discount Factors adjusted for fuel price escalation by end-use sector and fuel type
18
Discount Rate = 30 (DOE)
Census Region 4 (Alaska Arizona California Colorado HawaiiIdaho Montana Nevada New Mexico Oregon Utah Washington Wyoming)
RESIDENTIAL
COMMERCIAL INDUSTRIAL TRANSPORT
N Elec Dist LPG NtGas Elec Dist Resid NtGas Coal Elec Dist Resid NtGas Coal Gasln N
------ ----- ----- ----- ----- ----- ----- ----- ----- ----- ----- ----- ----- ----- ----- -
1 098 074 095 097 098 081 119 097 099 098 082 121 098 098 091 1
2 193 137 184 188 191 152 234 188 195 193 155 238 188 193 175 2
3 282 196 270 274 278 219 339 273 288 282 224 346 272 284 254 3
4 368 251 352 356 361 281 423 355 377 366 289 432 350 371 329 4
5 450 304 431 434 439 341 498 432 463 445 352 509 424 455 400 5
6 530 355 508 509 515 399 570 507 546 522 412 583 493 536 468 6
7 608 403 582 581 587 453 638 579 627 596 469 653 559 614 533 7
8 684 448 654 651 658 505 702 648 704 668 523 719 623 690 594 8
9 758 492 723 720 726 554 763 717 779 738 575 782 685 763 653 9
10 830 536 791 787 792 604 824 784 854 806 626 844 746 835 711 10 11 901 579 857 852 857 653 886 849 926 873 678 908 805 904 768 11 12 969 622 921 915 919 702 949 912 997 937 730 973 861 972 825 12 13 1035 663 982 975 979 750 1012 972 1066 998 780 1037 914 1038 880 13 14 1100 704 1041 1033 1037 797 1073 1031 1133 1058 830 1100 965 1102 933 14 15 1162 745 1099 1091 1093 843 1134 1089 1198 1116 878 1163 1015 1166 984 15 16 1224 785 1156 1148 1148 889 1195 1146 1263 1173 925 1225 1066 1227 1034 16 17 1284 825 1212 1204 1202 934 1255 1203 1326 1229 971 1287 1116 1287 1083 17 18 1343 864 1266 1260 1254 978 1314 1260 1387 1283 1017 1348 1167 1346 1129 18 19 1400 903 1319 1315 1305 1022 1373 1316 1448 1336 1062 1407 1217 1404 1175 19 20 1455 941 1371 1370 1355 1065 1430 1372 1506 1387 1107 1466 1266 1459 1219 20 21 1510 979 1422 1424 1404 1108 1486 1427 1564 1438 1150 1524 1317 1514 1263 21 22 1562 1016 1472 1477 1451 1150 1541 1482 1619 1487 1193 1581 1367 1567 1305 22 23 1614 1052 1520 1530 1497 1191 1596 1536 1674 1534 1235 1636 1416 1619 1346 23 24 1664 1088 1568 1581 1542 1231 1649 1589 1727 1581 1277 1691 1465 1669 1386 24 25 1713 1123 1614 1631 1585 1270 1702 1641 1778 1626 1317 1746 1513 1718 1425 25 26 1761 1157 1660 1680 1628 1308 1754 1692 1828 1670 1356 1799 1560 1766 1464 26 27 1807 1190 1704 1729 1669 1346 1805 1741 1877 1713 1395 1851 1606 1813 1501 27 28 1853 1223 1747 1776 1709 1383 1855 1790 1925 1755 1433 1903 1651 1858 1538 28 29 1897 1255 1789 1822 1748 1419 1904 1837 1971 1796 1470 1954 1696 1902 1574 29 30 1940 1286 1830 1867 1786 1454 1953 1884 2016 1836 1506 2004 1740 1945 1609 30
Note UPV factors are reported for years 26-30 to accommodate a planningconstruction period of up to 5 years See p 14 for instructions on use page xiii for abbreviations
Table Ba-5 FEMP UPV Discount Factors adjusted for fuel price escalation by end-use sector and fuel type
19
Discount Rate = 30 (DOE)
United States Average
RESIDENTIAL
COMMERCIAL INDUSTRIAL TRANSPORT
N Elec Dist LPG NtGas Elec Dist Resid NtGas Coal Elec Dist Resid NtGas Coal Gasln N
------ ----- ----- ----- ----- ----- ----- ----- ----- ----- ----- ----- ----- ----- ----- -
1 100 086 096 097 099 088 099 098 099 100 087 102 100 097 094 1
2 197 163 186 189 195 166 189 190 194 196 164 195 194 190 178 2
3 289 235 274 275 285 241 273 277 285 287 239 281 281 279 258 3
4 378 302 357 358 371 310 350 359 372 372 309 358 363 364 333 4
5 464 364 438 437 453 374 422 437 456 453 374 429 440 446 403 5
6 546 423 515 512 531 435 489 512 536 530 437 495 512 524 471 6
7 626 478 590 584 606 492 550 583 614 604 496 556 581 600 535 7
8 704 530 663 654 678 546 607 653 688 675 552 612 647 674 596 8
9 779 580 733 722 749 598 661 721 760 745 606 666 711 745 655 9
10 852 628 802 789 818 649 715 787 830 813 659 719 774 813 712 10 11 924 676 869 855 886 699 768 852 897 879 712 772 836 880 769 11 12 993 723 934 918 951 749 820 916 963 943 765 824 896 945 826 12 13 1060 769 996 979 1013 798 872 976 1027 1005 817 875 953 1008 882 13 14 1125 814 1057 1039 1074 846 922 1036 1089 1065 867 925 1009 1069 935 14 15 1189 859 1117 1098 1134 893 972 1095 1149 1123 916 975 1064 1129 987 15 16 1250 902 1175 1156 1191 939 1022 1153 1208 1180 964 1024 1118 1187 1038 16 17 1310 945 1231 1213 1247 985 1071 1210 1265 1235 1012 1073 1172 1243 1088 17 18 1369 988 1287 1269 1302 1030 1119 1267 1321 1289 1058 1121 1226 1298 1136 18 19 1425 1029 1341 1324 1355 1074 1166 1323 1375 1341 1104 1168 1278 1351 1183 19 20 1480 1070 1393 1378 1407 1117 1212 1378 1428 1392 1149 1214 1331 1403 1229 20 21 1534 1111 1445 1432 1458 1160 1258 1433 1479 1441 1194 1259 1383 1454 1274 21 22 1586 1151 1495 1486 1507 1203 1303 1487 1529 1490 1238 1304 1434 1503 1319 22 23 1637 1190 1545 1538 1555 1244 1347 1540 1578 1537 1281 1348 1485 1551 1362 23 24 1687 1228 1593 1589 1602 1285 1391 1591 1625 1583 1323 1392 1536 1598 1404 24 25 1735 1265 1640 1638 1648 1325 1434 1642 1671 1628 1364 1435 1585 1643 1446 25 26 1781 1302 1685 1687 1692 1364 1476 1692 1716 1672 1405 1477 1633 1688 1486 26 27 1827 1338 1730 1735 1735 1402 1518 1740 1760 1714 1444 1519 1681 1731 1525 27 28 1871 1373 1774 1781 1777 1440 1559 1788 1802 1755 1483 1559 1728 1773 1564 28 29 1914 1407 1816 1827 1818 1477 1600 1834 1844 1795 1521 1600 1774 1814 1602 29 30 1956 1441 1858 1871 1858 1513 1640 1880 1884 1834 1558 1639 1819 1853 1639 30
Note UPV factors are reported for years 26-30 to accommodate a planningconstruction period of up to 5 years See p 14 for instructions on use page xiii for abbreviations
B2 FEMP Modified Uniform Present Value Factors
The OMB Modified Uniform Present Value (OMB UPV) factors presented in the Bb tables based on the current OMB discount rates (24 short term and 28 long term) are for calculating the present value of energy costs accruing over 1 to 30 years when conducting a life-cycle cost analysis of a federal project not explicitly related to energy or water conservation or renewable resources Factors are reported in the Bb tables for 30 years These factors apply only to annual energy usage that is assumed to be the same each year over the service period The NIST BLCC computer program can compute the present value of energy usage and savings that are not the same in each year
Examples of How to Use the OMB UPV Factors
OMB UPV (OMB discount rate) To compute the present value over 30 years of electricity costs associated with the occupancy of a federal office building in Ohio (where energy conservation is not a specific consideration in the LCC analysis) go to Table Bb-2 find the OMB UPV factor for commercial electricity for 30 years (1968) and multiply this factor by the annual electricity cost in base-date dollars
Note Because the discount rate used to calculate the Bb tables (OMB discount rate) is usually different for years 1 to 10 than for years 11 to 30 these factors cannot be used with a planning designconstruction period as shown above for the Ba tables (DOE discount rate) Use the BLCC or DISCOUNT computer program for this purpose For further explanation of the use of UPV factors see NIST Handbook 135
20
Table Bb-1 OMB UPV Discount Factors adjusted for fuel price escalation by end-use sector and fuel type
21
Discount Rate = 24 (years 1 to 10) and 28 (years 11 to 30) (OMB Circular A-94a)
Census Region 1 (Connecticut Maine Massachusetts New HampshireNew Jersey New York Pennsylvania Rhode Island Vermont)
RESIDENTIAL
COMMERCIAL INDUSTRIAL TRANSPORT
N Elec Dist LPG NtGas Elec Dist Resid NtGas Coal Elec Dist Resid NtGas Coal Gasln N
------ ----- ----- ----- ----- ----- ----- ----- ----- ----- ----- ----- ----- ----- ----- -
1 100 087 094 099 099 089 098 100 099 099 089 098 100 098 093 1
2 197 166 183 193 193 171 188 194 193 192 170 187 195 192 177 2
3 290 240 269 283 281 248 272 283 281 277 248 272 284 284 257 3
4 381 309 352 369 366 320 350 369 364 358 322 350 368 373 333 4
5 469 374 433 452 447 387 424 451 443 435 390 423 448 460 405 5
6 555 436 511 532 525 452 493 529 519 507 457 491 523 545 474 6
7 639 494 586 609 601 513 556 605 592 577 520 555 595 626 540 7
8 722 549 660 684 674 571 615 679 663 646 580 614 665 705 603 8
9 802 602 732 757 747 627 672 751 730 713 638 670 733 782 664 9
10 882 654 802 830 818 682 728 823 794 779 695 727 800 856 724 10 11 938 691 852 881 869 721 768 874 838 826 736 766 847 908 768 11 12 1010 740 916 948 934 773 821 940 897 886 791 819 908 976 825 12 13 1079 788 978 1012 997 825 873 1004 954 943 845 871 967 1042 881 13 14 1147 834 1038 1075 1059 875 925 1066 1009 999 897 923 1024 1106 936 14 15 1213 880 1097 1137 1119 924 976 1128 1063 1054 948 973 1081 1168 990 15 16 1278 926 1155 1197 1177 972 1027 1189 1116 1107 999 1024 1137 1228 1043 16 17 1341 971 1211 1257 1235 1020 1077 1249 1168 1160 1048 1073 1192 1287 1094 17 18 1402 1015 1266 1316 1291 1067 1126 1308 1219 1211 1097 1122 1246 1343 1144 18 19 1462 1058 1319 1374 1345 1113 1174 1366 1269 1261 1146 1170 1299 1399 1193 19 20 1520 1101 1372 1431 1399 1159 1221 1424 1318 1311 1193 1217 1352 1453 1242 20 21 1577 1144 1423 1488 1452 1205 1268 1481 1366 1359 1240 1264 1405 1505 1289 21 22 1633 1186 1473 1543 1503 1250 1315 1537 1413 1406 1287 1310 1456 1557 1335 22 23 1687 1227 1522 1598 1553 1294 1361 1593 1459 1452 1332 1355 1508 1607 1381 23 24 1740 1267 1570 1651 1602 1337 1406 1647 1504 1497 1377 1400 1558 1656 1426 24 25 1791 1307 1616 1703 1650 1379 1451 1700 1548 1541 1421 1445 1607 1703 1469 25 26 1842 1346 1662 1754 1697 1421 1495 1752 1591 1584 1464 1489 1656 1750 1512 26 27 1891 1384 1707 1804 1742 1462 1539 1803 1632 1626 1506 1532 1704 1795 1554 27 28 1938 1422 1750 1853 1787 1502 1582 1854 1673 1667 1548 1574 1751 1840 1595 28 29 1985 1458 1793 1901 1830 1542 1625 1903 1712 1708 1588 1616 1797 1883 1635 29 30 2030 1494 1835 1948 1873 1580 1667 1951 1751 1747 1628 1658 1842 1925 1674 30
aOMB discount rate as of February 2008 See p 20 for instructions on use page xiii for abbreviations
Table Bb-2 OMB UPV Discount Factors adjusted for fuel price escalation by end-use sector and fuel type
22
Discount Rate = 24 (years 1 to 10) and 28 (years 11 to 30) (OMB Circular A-94a)
Census Region 2 (Illinois Indiana Iowa Kansas Michigan MinnesotaMissouri Nebraska North Dakota Ohio South Dakota Wisconsin)
RESIDENTIAL
COMMERCIAL INDUSTRIAL TRANSPORT
N Elec Dist LPG NtGas Elec Dist Resid NtGas Coal Elec Dist Resid NtGas Coal Gasln N
------ ----- ----- ----- ----- ----- ----- ----- ----- ----- ----- ----- ----- ----- ----- -
1 101 084 099 098 101 086 108 098 100 102 089 105 101 098 095 1
2 200 160 195 190 200 164 210 191 197 201 169 203 196 193 181 2
3 296 230 286 277 295 238 303 277 294 295 247 293 286 285 263 3
4 389 295 375 360 386 306 383 360 387 384 320 372 370 375 341 4
5 479 356 461 440 473 369 456 439 479 468 389 444 450 461 415 5
6 566 414 544 517 556 430 526 515 568 549 455 512 526 545 486 6
7 651 468 625 590 637 488 591 588 654 626 518 576 599 627 554 7
8 734 519 703 662 715 542 652 659 738 702 577 636 669 707 619 8
9 815 568 780 732 792 594 711 729 820 776 635 694 738 784 682 9
10 894 617 855 802 868 646 769 798 899 849 692 751 805 861 744 10 11 951 651 908 851 921 683 811 847 955 901 733 791 854 915 789 11 12 1023 697 977 915 990 732 868 910 1027 967 788 846 915 984 849 12 13 1093 741 1043 976 1057 780 924 971 1097 1031 841 900 973 1052 907 13 14 1162 784 1107 1036 1122 827 978 1031 1166 1093 893 953 1031 1117 963 14 15 1228 827 1170 1095 1185 873 1033 1090 1233 1153 944 1006 1087 1182 1018 15 16 1293 870 1232 1153 1247 919 1087 1148 1297 1212 994 1058 1144 1244 1071 16 17 1356 912 1293 1210 1307 964 1141 1206 1360 1270 1043 1110 1199 1306 1124 17 18 1417 954 1352 1267 1366 1009 1194 1263 1421 1325 1092 1161 1255 1366 1175 18 19 1476 995 1410 1323 1423 1053 1246 1319 1481 1379 1140 1211 1310 1424 1226 19 20 1533 1035 1467 1379 1478 1096 1298 1376 1539 1432 1187 1261 1364 1481 1275 20 21 1589 1075 1523 1434 1532 1139 1348 1431 1595 1484 1234 1310 1419 1537 1324 21 22 1644 1114 1577 1489 1586 1181 1398 1487 1651 1534 1280 1358 1473 1591 1371 22 23 1697 1153 1631 1542 1638 1223 1447 1541 1704 1583 1325 1405 1526 1644 1418 23 24 1749 1191 1683 1595 1689 1264 1496 1594 1757 1632 1370 1452 1578 1696 1464 24 25 1800 1228 1734 1646 1738 1305 1544 1646 1808 1678 1413 1498 1630 1747 1509 25 26 1849 1265 1785 1696 1786 1344 1591 1698 1858 1724 1456 1544 1681 1796 1552 26 27 1897 1301 1834 1746 1833 1383 1637 1748 1906 1768 1498 1589 1731 1844 1595 27 28 1943 1336 1882 1794 1879 1421 1683 1798 1954 1812 1539 1633 1780 1891 1637 28 29 1988 1370 1929 1842 1924 1459 1729 1846 2000 1854 1580 1676 1829 1937 1679 29 30 2032 1404 1975 1889 1968 1495 1773 1894 2045 1895 1619 1720 1876 1982 1719 30
aOMB discount rate as of February 2008 See p 20 for instructions on use page xiii for abbreviations
Table Bb-3 OMB UPV Discount Factors adjusted for fuel price escalation by end-use sector and fuel type
23
Discount Rate = 24 (years 1 to 10) and 28 (years 11 to 30) (OMB Circular A-94a)
Census Region 3 (Alabama Arkansas Delaware District of Columbia Florida Georgia Kentucky LouisianaMaryland Mississippi North Carolina Oklahoma South Carolina Tennessee Texas Virginia West Virginia)
RESIDENTIAL
COMMERCIAL INDUSTRIAL TRANSPORT
N Elec Dist LPG NtGas Elec Dist Resid NtGas Coal Elec Dist Resid NtGas Coal Gasln N
------ ----- ----- ----- ----- ----- ----- ----- ----- ----- ----- ----- ----- ----- ----- -
1 101 087 094 098 101 089 111 099 099 101 088 103 102 098 095 1
2 200 166 184 190 200 169 216 193 193 200 168 198 198 190 182 2
3 295 240 270 278 294 245 313 282 283 293 245 285 286 279 263 3
4 387 309 354 362 384 316 401 367 368 382 318 364 370 362 339 4
5 476 373 435 444 471 382 482 448 450 467 386 436 450 443 411 5
6 562 435 514 522 554 446 558 526 527 548 452 504 525 522 481 6
7 645 492 590 598 634 505 629 602 602 627 514 567 597 597 548 7
8 727 547 665 671 713 562 694 675 674 704 573 626 666 671 611 8
9 807 600 737 744 790 616 756 747 743 779 630 682 733 742 672 9
10 884 653 808 816 865 670 818 818 811 853 687 738 801 811 733 10 11 940 689 859 867 918 708 862 870 857 905 728 777 849 859 776 11 12 1011 738 924 933 987 760 920 935 918 972 782 830 911 922 835 12 13 1079 785 987 997 1053 810 977 999 977 1036 835 882 971 984 891 13 14 1147 832 1049 1060 1118 859 1034 1062 1035 1100 887 933 1030 1043 946 14 15 1212 878 1109 1122 1180 907 1089 1124 1091 1161 937 983 1088 1101 1000 15 16 1276 923 1168 1183 1242 954 1145 1186 1146 1221 987 1034 1146 1157 1052 16 17 1338 967 1225 1244 1301 1001 1200 1246 1199 1279 1036 1084 1203 1212 1103 17 18 1398 1012 1281 1303 1360 1047 1254 1306 1250 1336 1085 1133 1260 1266 1154 18 19 1457 1055 1336 1362 1416 1093 1308 1364 1300 1392 1132 1182 1315 1317 1203 19 20 1514 1098 1389 1419 1472 1138 1361 1423 1348 1446 1179 1229 1371 1368 1251 20 21 1570 1140 1442 1476 1526 1183 1413 1480 1395 1499 1226 1277 1426 1417 1299 21 22 1624 1182 1493 1533 1578 1227 1464 1537 1441 1551 1272 1323 1481 1465 1346 22 23 1677 1223 1543 1588 1630 1271 1515 1593 1486 1601 1317 1369 1536 1512 1391 23 24 1729 1263 1592 1642 1680 1314 1565 1647 1530 1651 1361 1414 1589 1558 1436 24 25 1779 1303 1640 1695 1729 1356 1614 1701 1573 1699 1405 1459 1642 1603 1480 25 26 1828 1342 1687 1747 1776 1397 1663 1753 1615 1745 1448 1503 1693 1646 1523 26 27 1876 1380 1733 1798 1822 1437 1711 1805 1656 1791 1490 1547 1744 1688 1565 27 28 1922 1417 1778 1848 1868 1477 1758 1856 1695 1836 1531 1589 1795 1730 1606 28 29 1968 1454 1822 1897 1912 1516 1805 1905 1734 1879 1571 1632 1844 1770 1647 29 30 2012 1490 1865 1944 1954 1555 1851 1954 1772 1921 1611 1674 1893 1810 1686 30
aOMB discount rate as of February 2008 See p 20 for instructions on use page xiii for abbreviations
Table Bb-4 OMB UPV Discount Factors adjusted for fuel price escalation by end-use sector and fuel type
24
Discount Rate = 24 (years 1 to 10) and 28 (years 11 to 30) (OMB Circular A-94a)
Census Region 4 (Alaska Arizona California Colorado HawaiiIdaho Montana Nevada New Mexico Oregon Utah Washington Wyoming)
RESIDENTIAL
COMMERCIAL INDUSTRIAL TRANSPORT
N Elec Dist LPG NtGas Elec Dist Resid NtGas Coal Elec Dist Resid NtGas Coal Gasln N
------ ----- ----- ----- ----- ----- ----- ----- ----- ----- ----- ----- ----- ----- ----- -
1 099 074 095 097 098 081 120 098 100 099 083 122 098 099 092 1
2 195 138 186 190 192 153 236 190 197 194 156 240 190 195 176 2
3 286 198 273 277 281 221 343 277 292 285 227 350 275 287 257 3
4 373 255 357 361 366 285 429 360 383 371 293 438 355 376 334 4
5 458 309 439 441 447 347 506 440 471 453 358 517 431 462 407 5
6 541 362 518 519 525 407 581 517 557 533 420 594 503 547 478 6
7 622 412 595 594 600 463 651 592 641 610 479 667 572 629 545 7
8 702 459 670 668 674 517 718 665 722 685 536 736 638 708 609 8
9 780 506 744 740 746 570 783 737 802 759 591 802 704 785 671 9
10 856 552 816 811 817 622 848 808 880 831 645 869 768 860 732 10 11 911 585 867 861 866 660 895 858 936 882 685 917 813 914 776 11 12 981 629 932 926 930 710 960 923 1009 948 738 983 871 984 835 12 13 1048 672 994 988 991 759 1024 985 1079 1011 790 1049 925 1051 891 13 14 1115 714 1055 1047 1051 808 1087 1045 1148 1073 841 1114 978 1118 945 14 15 1179 756 1115 1107 1109 855 1150 1104 1216 1132 890 1179 1030 1182 999 15 16 1243 797 1174 1165 1166 902 1213 1164 1282 1191 939 1243 1082 1246 1050 16 17 1305 838 1231 1224 1221 949 1275 1223 1347 1248 987 1307 1134 1308 1100 17 18 1365 879 1287 1281 1275 995 1336 1281 1411 1304 1035 1370 1186 1369 1148 18 19 1425 919 1343 1339 1328 1040 1396 1340 1474 1359 1081 1432 1238 1429 1196 19 20 1483 959 1397 1395 1380 1085 1456 1397 1535 1413 1127 1493 1290 1487 1242 20 21 1539 998 1450 1451 1431 1129 1514 1455 1595 1465 1173 1553 1342 1544 1287 21 22 1594 1037 1502 1507 1480 1173 1572 1513 1653 1517 1218 1612 1394 1599 1331 22 23 1648 1075 1553 1562 1528 1216 1629 1569 1710 1567 1262 1671 1446 1653 1374 23 24 1701 1112 1602 1616 1575 1258 1685 1625 1765 1615 1305 1728 1497 1706 1416 24 25 1752 1149 1651 1669 1621 1299 1740 1679 1819 1663 1347 1785 1547 1758 1457 25 26 1802 1184 1699 1721 1665 1340 1795 1732 1872 1709 1389 1841 1596 1808 1498 26 27 1851 1220 1745 1771 1709 1379 1849 1784 1923 1754 1430 1896 1645 1857 1537 27 28 1899 1254 1791 1821 1751 1418 1902 1836 1974 1799 1470 1951 1693 1905 1576 28 29 1946 1288 1835 1870 1793 1457 1954 1886 2023 1842 1509 2005 1740 1951 1614 29 30 1991 1321 1879 1917 1833 1494 2006 1935 2070 1884 1547 2058 1787 1997 1651 30
aOMB discount rate as of February 2008 See p 20 for instructions on use page xiii for abbreviations
Table Bb-5 OMB UPV Discount Factors adjusted for fuel price escalation by end-use sector and fuel type
25
Discount Rate = 24 (years 1 to 10) and 28 (years 11 to 30) (OMB Circular A-94a)
United States Average
RESIDENTIAL
COMMERCIAL INDUSTRIAL TRANSPORT
N Elec Dist LPG NtGas Elec Dist Resid NtGas Coal Elec Dist Resid NtGas Coal Gasln N
------ ----- ----- ----- ----- ----- ----- ----- ----- ----- ----- ----- ----- ----- ----- -
1 100 086 096 098 100 088 099 099 099 101 087 103 101 098 094 1
2 198 164 188 191 196 168 190 192 195 198 166 197 196 192 180 2
3 293 238 277 279 288 243 276 280 288 290 242 285 285 282 261 3
4 383 306 362 363 376 314 355 364 377 377 313 363 368 369 337 4
5 472 370 445 444 460 380 429 444 463 461 380 436 447 453 410 5
6 557 431 526 522 541 443 498 522 547 540 445 504 522 535 480 6
7 640 488 604 597 619 503 562 597 628 617 507 568 594 614 547 7
8 721 543 680 671 696 559 622 669 706 692 566 627 663 691 611 8
9 801 595 754 743 770 614 679 741 782 766 623 684 731 766 673 9
10 879 647 827 814 843 668 736 811 855 838 679 740 798 838 734 10 11 934 684 878 864 895 707 776 862 907 889 720 780 845 890 778 11 12 1005 732 945 929 962 758 830 926 974 955 774 833 906 956 836 12 13 1074 779 1009 992 1026 808 882 989 1040 1018 827 885 965 1020 893 13 14 1141 825 1071 1053 1089 857 934 1050 1104 1079 879 937 1022 1083 948 14 15 1206 871 1133 1114 1150 906 986 1111 1166 1139 929 988 1079 1145 1002 15 16 1270 916 1193 1173 1209 953 1037 1171 1226 1198 979 1039 1135 1205 1054 16 17 1332 960 1251 1232 1267 1000 1087 1230 1285 1255 1028 1089 1191 1263 1105 17 18 1392 1004 1308 1290 1324 1047 1137 1289 1343 1310 1076 1139 1246 1320 1155 18 19 1451 1047 1364 1348 1379 1093 1186 1346 1399 1364 1124 1188 1301 1375 1204 19 20 1508 1090 1419 1404 1433 1138 1234 1404 1454 1417 1171 1236 1355 1429 1252 20 21 1564 1132 1473 1460 1486 1182 1281 1461 1507 1469 1217 1283 1409 1482 1299 21 22 1618 1174 1526 1516 1537 1227 1328 1517 1560 1520 1263 1330 1463 1533 1345 22 23 1672 1214 1577 1570 1588 1270 1375 1572 1610 1569 1308 1376 1517 1584 1390 23 24 1723 1254 1628 1624 1637 1313 1421 1627 1660 1617 1352 1422 1569 1633 1435 24 25 1774 1294 1677 1676 1685 1355 1466 1680 1709 1664 1395 1467 1621 1680 1478 25 26 1823 1332 1725 1727 1731 1396 1511 1732 1756 1710 1438 1511 1672 1727 1521 26 27 1871 1370 1772 1778 1777 1436 1555 1783 1802 1755 1480 1555 1722 1772 1562 27 28 1918 1407 1818 1827 1821 1476 1598 1834 1847 1798 1521 1598 1771 1817 1603 28 29 1963 1444 1863 1875 1865 1515 1641 1883 1891 1841 1561 1641 1820 1860 1643 29 30 2008 1479 1907 1922 1907 1553 1684 1931 1934 1882 1600 1683 1868 1902 1682 30
aOMB discount rate as of February 2008 See p 20 for instructions on use page xiii for abbreviations
C Projected Average Fuel Price Indices and Escalation Rates (Real)
Tables Ca-1 through Ca-5 present projected fuel price indices for the four Census regions and for the United States These indices when multiplied by annual energy costs computed at base-date prices (ie as of April 1 2008) provide estimates of future-year costs (also as of April 1) in constant base-date dollars Constant-dollar cost estimates are needed when discounting is performed with a real discount rate (ie a rate that does not include general price inflation)
These indices were used in the calculation of the UPV factors for energy prices in the Ba and Bb tables in this publication While they are based on April 1 energy prices to maintain consistency in the computation of these UPV factors the level of precision implied here is not required for most LCC analyses That is the analyst need not calibrate base-year energy prices precisely to April 1 2008 levels to use these indices (or the corresponding UPV factors) instead the analyst should use current price levels as of the base-date of the LCC analysis regardless of the time of the year that the study is undertaken
Example of How to Use the Indices
To estimate the price of industrial coal in 2012 in Connecticut (in constant 2008 dollars) go to Table Ca-1 find the year 2012 index for industrial coal (098) and multiply by the price for industrial coal in Connecticut in 2008
For further explanation of how to use these tables see NIST Handbook 135
Tables Cb-1 through Cb-5 present the projected average fuel price escalation rates (percentage change compounded annually) for selected periods from 2008 to 2038 for the four Census regions and for the overall United States Note that these are real rates exclusive of general price inflation Their use results in prices expressed in constant dollars
The average fuel escalation rates consolidate the information provided by the indices in the Ca tables so that trends in projected price changes can be seen at a glance They are provided primarily to accommodate computer programs (such as BLCC) which require price escalation rates as inputs
Unless there is a compelling reason to use escalation rates it is recommended that you use the indices in the Ca tables when you need estimates of future-year energy prices since the indices include year-to-year information rather than averages over a number of years
Example of How to Use the Escalation Rates
To estimate the unit price of residential natural gas at the end of 2018 (p18) in Wyoming using the DOE energy price escalation rates go to Table Cb-4 and find the 2008 to 2013 and the 2013 to 2018 escalation rates for residential natural gas (-20 for 5 years and -01 for 5 years respectively) Enter these values and the unit price of residential natural gas in Wyoming in 2008 (p08) into the following formula Then solve for the 2018 energy price (stated in 2008 dollars)
26
N ki
py = p0 timesprod(1+ ei ) i=1
p18 = p08 times (1+ e1 )k1 times (1+ e2 )k2
= p08 times (1minus 002)5 times (1minus 0001)5
= p08 times 09039 times 09950 = p08 times 0899
where py = price at end of year y p0 = unit price at base date ei = annual compound escalation rate for period i from the Cb tables (in decimal form) and ki = number of years over which escalation rate ei occurs
Note that the compounded escalation rate factor (0899) corresponds to the fuel price index in region 4 residential natural gas for the year 2018 in table Ca-4 (090)
The data in the Ca and Cb tables on the following pages are reported for the four Census regions and the US average Figure B-1 on page 13 presents a map showing the states corresponding to the four Census regions The Census regions do not include American Samoa Canal Zone Guam Puerto Rico Trust Territory of the Pacific Islands or the Virgin Islands Analysts of federal projects in these areas should use data which are reasonable under the circumstances and may refer to the tables with US average data for guidance
27
Table Ca-1 Projected fuel price indices (excluding general inflation) by end-use sector and fuel type
28
Census Region 1 (Connecticut Maine Massachusetts New HampshireNew Jersey New York Pennsylvania Rhode Island Vermont)
----------------- Projected April 1 Fuel Price Indices (April 1 2008 = 100)
----- ----- ----- ----- ----- ----- ----- ----- ----- ----- ----- ----- ----- ----- ----- Sector and Fuel 2009 2010 2011 2012 2013 2014 2015 2016 2017 2018 2019 2020 2021 2022 2023 ----------------- ----- ----- ----- ----- ----- ----- ----- ----- ----- ----- ----- ----- ----- ----- -----
Residential ElectricityDistillate Oil
103 089
101 083
100 079
100 076
100 073
099 071
099 069
099 066
100 066
101 066
101 067
100 068
099 068
100 069
100 070
LPG 096 093 092 091 091 090 089 089 089 089 089 089 089 089 089
Natural Gas 101 099 097 095 093 092 091 091 091 092 093 092 092 093 094
Commercial ElectricityDistillate Oil
102 092
098 085
095 083
093 079
091 076
090 074
089 072
089 070
090 069
091 070
091 071
091 073
090 073
090 074
091 074
Residual Oil 100 094 090 087 083 079 075 071 070 071 073 074 075 076 077
Natural Gas 102 099 096 094 092 091 089 089 090 091 092 092 091 092 093
Coal 101 099 095 091 088 088 087 085 083 082 081 081 081 082 082
Industrial ElectricityDistillate Oil
102 091
097 085
091 084
089 081
086 077
084 077
083 075
083 072
083 072
084 072
084 074
083 077
082 077
082 077
083 078
Residual Oil 100 094 090 086 082 079 075 071 070 071 073 074 075 076 077
Natural Gas 103 099 096 093 090 087 085 084 084 085 086 085 084 085 085
Coal 100 099 099 098 098 097 096 096 095 094 094 094 094 094 094
TransportationMotor Gasoline 096 088 086 083 081 080 078 076 075 076 078 080 080 081 081
----------------- ----- ----- ----- ----- ----- ----- ----- ----- ----- ----- ----- ----- ----- ----- -----
Table Ca-1 continued Projected fuel price indices (excluding general inflation) by end-use sector and fuel type
29
Census Region 1 (Connecticut Maine Massachusetts New HampshireNew Jersey New York Pennsylvania Rhode Island Vermont)
----------------- Projected April 1 Fuel Price Indices (April 1 2008 = 100)
----- ----- ----- ----- ----- ----- ----- ----- ----- ----- ----- ----- ----- ----- ----- Sector and Fuel 2024 2025 2026 2027 2028 2029 2030 2031 2032 2033 2034 2035 2036 2037 2038 ----------------- ----- ----- ----- ----- ----- ----- ----- ----- ----- ----- ----- ----- ----- ----- -----
Residential ElectricityDistillate Oil
100 071
101 072
101 073
101 074
101 075
102 076
102 077
102 078
103 078
103 079
103 080
103 080
103 081
104 082
104 082
LPG 090 090 090 090 091 092 092 092 093 093 094 094 095 095 096
Natural Gas 095 096 097 098 099 101 102 103 103 104 105 105 106 107 107
Commercial ElectricityDistillate Oil
091 075
092 076
092 078
092 079
093 080
094 081
094 082
095 083
095 084
095 085
096 085
096 086
097 087
097 088
097 089
Residual Oil 079 080 081 081 082 084 085 087 088 089 091 092 093 095 096
Natural Gas 095 096 097 098 100 102 104 105 105 106 107 108 109 109 110
Coal 083 083 083 084 085 086 086 087 087 087 088 088 088 088 088
Industrial ElectricityDistillate Oil
084 078
084 079
085 081
085 082
086 083
086 084
087 085
087 086
087 087
088 088
088 088
089 089
089 090
089 091
090 091
Residual Oil 078 079 081 081 082 083 085 086 087 089 090 091 092 094 095
Natural Gas 087 088 089 090 092 094 095 096 097 099 100 101 102 103 104
Coal 094 094 093 094 094 094 094 095 095 095 095 096 096 096 096
TransportationMotor Gasoline 082 082 082 083 084 085 085 086 087 087 088 088 089 089 090
----------------- ----- ----- ----- ----- ----- ----- ----- ----- ----- ----- ----- ----- ----- ----- -----
Table Ca-2 Projected fuel price indices (excluding general inflation) by end-use sector and fuel type
30
Census Region 2 (Illinois Indiana Iowa Kansas Michigan MinnesotaMissouri Nebraska North Dakota Ohio South Dakota Wisconsin)
----------------- Projected April 1 Fuel Price Indices (April 1 2008 = 100)
----- ----- ----- ----- ----- ----- ----- ----- ----- ----- ----- ----- ----- ----- ----- Sector and Fuel 2009 2010 2011 2012 2013 2014 2015 2016 2017 2018 2019 2020 2021 2022 2023 ----------------- ----- ----- ----- ----- ----- ----- ----- ----- ----- ----- ----- ----- ----- ----- ----- Residential
ElectricityDistillate Oil
103 086
104 079
103 076
102 072
101 068
100 067
100 064
100 062
100 061
101 062
101 062
101 063
101 063
101 064
101 065
LPG 101 100 099 098 097 096 095 095 095 095 096 095 095 095 096
Natural Gas 100 097 094 092 090 088 087 087 087 088 089 088 087 088 089
Commercial
ElectricityDistillate Oil
103 088
104 081
102 079
100 075
098 072
096 070
095 068
095 065
095 065
096 065
096 067
096 068
096 069
096 069
096 070
Residual Oil 111 106 101 088 082 080 077 074 073 074 076 079 080 081 083
Natural Gas 101 097 093 091 089 087 086 086 086 087 088 088 087 088 089
Coal 102 102 103 103 103 103 102 102 101 101 100 100 100 101 101
Industrial
ElectricityDistillate Oil
104 091
104 084
101 084
098 080
095 077
093 076
092 074
092 072
092 072
093 072
093 074
092 076
092 076
091 077
092 077
Residual Oil 108 102 097 086 081 079 076 072 071 072 074 076 077 078 080
Natural Gas 103 100 096 093 090 087 086 085 085 086 087 085 084 084 086
Coal 100 100 099 098 097 097 097 096 096 097 097 097 096 097 097
Transportation
Motor Gasoline 098 090 088 086 083 082 080 078 078 079 081 083 083 083 083
----------------- ----- ----- ----- ----- ----- ----- ----- ----- ----- ----- ----- ----- ----- ----- -----
Table Ca-2 continued Projected fuel price indices (excluding general inflation) by end-use sector and fuel type
31
Census Region 2 (Illinois Indiana Iowa Kansas Michigan MinnesotaMissouri Nebraska North Dakota Ohio South Dakota Wisconsin)
----------------- Projected April 1 Fuel Price Indices (April 1 2008 = 100)
----- ----- ----- ----- ----- ----- ----- ----- ----- ----- ----- ----- ----- ----- ----- Sector and Fuel 2024 2025 2026 2027 2028 2029 2030 2031 2032 2033 2034 2035 2036 2037 2038 ----------------- ----- ----- ----- ----- ----- ----- ----- ----- ----- ----- ----- ----- ----- ----- -----
Residential ElectricityDistillate Oil
101 066
100 067
100 068
100 069
100 070
100 071
101 072
101 073
101 074
101 074
101 075
101 076
101 076
101 077
101 078
LPG 096 097 097 098 099 100 100 101 102 102 103 104 104 105 105
Natural Gas 091 092 094 095 096 098 100 101 102 103 103 104 105 106 107
Commercial ElectricityDistillate Oil
096 071
096 072
096 073
096 074
097 075
097 077
098 078
098 079
099 080
099 080
099 081
099 082
099 083
100 083
100 084
Residual Oil 084 086 087 088 089 090 092 093 094 096 097 098 100 101 102
Natural Gas 091 092 094 095 097 100 101 103 103 104 105 106 107 108 109
Coal 101 100 100 100 101 101 101 101 102 102 102 103 103 103 103
Industrial ElectricityDistillate Oil
092 078
092 079
091 080
091 081
092 082
092 083
093 085
093 086
093 086
093 087
093 088
094 089
094 089
094 090
094 091
Residual Oil 081 083 084 085 086 087 088 090 091 092 093 095 096 097 099
Natural Gas 088 089 091 092 095 097 099 101 102 103 104 105 107 108 109
Coal 098 098 099 099 099 100 100 100 100 101 101 101 102 102 102
TransportationMotor Gasoline 083 084 084 085 086 087 088 088 089 089 090 091 091 092 092
----------------- ----- ----- ----- ----- ----- ----- ----- ----- ----- ----- ----- ----- ----- ----- -----
----------------- ----- ----- ----- ----- ----- ----- ----- ----- ----- ----- ----- ----- ----- ----- -----
----------------- ----- ----- ----- ----- ----- ----- ----- ----- ----- ----- ----- ----- ----- ----- -----
----------------- ----- ----- ----- ----- ----- ----- ----- ----- ----- ----- ----- ----- ----- ----- -----
32
Table Ca-3 Projected fuel price indices (excluding general inflation) by end-use sector and fuel type
Census Region 3 (Alabama Arkansas Delaware District of Columbia Florida GeorgiaKentucky Louisiana Maryland Mississippi North Carolina Oklahoma South Carolina
Tennessee Texas Virginia West Virginia)
Projected April 1 Fuel Price Indices (April 1 2008 = 100)
Sector and Fuel 2009 2010 2011 2012 2013 2014 2015 2016 2017 2018 2019 2020 2021 2022 2023
Residential ElectricityDistillate Oil
103 089
104 083
102 079
101 076
100 073
099 071
099 068
099 066
099 066
099 066
099 067
099 067
099 068
099 068
099 069
LPG 097 094 093 092 091 091 090 090 090 090 091 091 090 091 091
Natural Gas 100 097 094 093 092 090 089 089 090 091 092 092 092 093 094
Commercial ElectricityDistillate Oil
103 091
103 084
101 082
099 078
098 074
096 073
095 071
095 068
095 067
095 068
095 070
095 071
095 072
095 072
095 073
Residual Oil 114 110 104 097 091 088 083 079 078 078 080 081 082 083 084
Natural Gas 102 098 095 093 092 090 089 089 089 090 091 092 092 093 094
Coal 101 099 097 093 092 090 088 087 086 085 085 085 085 085 085
Industrial ElectricityDistillate Oil
104 090
103 084
100 083
098 080
096 077
094 076
093 074
093 071
093 071
093 072
093 074
093 076
093 076
093 076
093 077
Residual Oil 106 099 094 086 081 079 075 071 070 071 072 073 074 075 077
Natural Gas 104 101 096 092 089 087 084 083 084 085 086 086 086 087 088
Coal 100 097 095 092 091 090 089 089 088 088 087 088 088 088 088
TransportationMotor Gasoline 098 091 087 084 081 080 078 076 076 077 079 081 081 081 081
----------------- ----- ----- ----- ----- ----- ----- ----- ----- ----- ----- ----- ----- ----- ----- -----
----------------- ----- ----- ----- ----- ----- ----- ----- ----- ----- ----- ----- ----- ----- ----- -----
----------------- ----- ----- ----- ----- ----- ----- ----- ----- ----- ----- ----- ----- ----- ----- -----
33
Table Ca-3 continued Projected fuel price indices (excluding general inflation) by end-use sector and fuel type
Census Region 3 (Alabama Arkansas Delaware District of Columbia Florida GeorgiaKentucky Louisiana Maryland Mississippi North Carolina Oklahoma South Carolina
Tennessee Texas Virginia West Virginia)
Projected April 1 Fuel Price Indices (April 1 2008 = 100)
Sector and Fuel 2024 2025 2026 2027 2028 2029 2030 2031 2032 2033 2034 2035 2036 2037 2038
Residential ElectricityDistillate Oil
099 070
099 071
099 073
099 073
100 074
100 076
100 077
100 078
100 078
100 079
100 079
101 080
101 081
101 082
101 082
LPG 091 092 092 092 093 094 094 095 095 096 096 097 097 098 098
Natural Gas 095 097 098 098 100 102 103 104 105 106 106 107 108 109 109
Commercial ElectricityDistillate Oil
095 074
095 075
096 076
096 077
096 078
097 080
097 081
097 082
097 083
097 084
097 085
098 085
098 086
098 087
098 088
Residual Oil 086 088 090 090 092 093 094 096 097 099 100 101 103 104 106
Natural Gas 095 097 098 099 101 103 104 105 106 107 108 109 110 110 111
Coal 085 085 084 084 084 084 085 085 085 085 086 086 086 086 087
Industrial ElectricityDistillate Oil
093 077
093 078
094 080
094 081
095 082
095 083
095 085
095 085
095 086
096 087
096 088
096 088
096 089
097 090
097 091
Residual Oil 078 080 081 082 083 084 085 087 088 089 090 092 093 094 096
Natural Gas 090 092 093 094 097 099 101 102 104 105 106 108 109 111 112
Coal 088 088 088 088 088 088 088 088 089 089 089 089 090 090 090
TransportationMotor Gasoline 081 082 083 083 084 085 086 086 087 088 088 089 089 090 091
Table Ca-4 Projected fuel price indices (excluding general inflation) by end-use sector and fuel type
34
Census Region 4 (Alaska Arizona California Colorado HawaiiIdaho Montana Nevada New Mexico Oregon Utah Washington Wyoming)
----------------- Projected April 1 Fuel Price Indices (April 1 2008 = 100)
----- ----- ----- ----- ----- ----- ----- ----- ----- ----- ----- ----- ----- ----- -----
Sector and Fuel 2009 2010 2011 2012 2013 2014 2015 2016 2017 2018 2019 2020 2021 2022 2023
----------------- ----- ----- ----- ----- ----- ----- ----- ----- ----- ----- ----- ----- ----- ----- -----
Residential ElectricityDistillate Oil
101 076
100 067
098 064
096 063
095 062
096 060
096 059
096 058
097 057
097 058
098 060
097 061
097 062
098 062
098 063
LPG 098 095 094 093 092 091 091 091 091 091 091 091 090 090 090
Natural Gas 100 097 094 092 090 089 089 089 089 090 091 090 088 088 090
Commercial ElectricityDistillate Oil
101 083
099 076
096 073
093 071
091 069
090 069
089 067
089 065
089 065
089 066
089 068
089 070
088 071
088 071
088 072
Residual Oil 123 122 115 094 087 086 083 081 080 082 086 090 092 093 095
Natural Gas 100 097 093 092 090 089 088 088 089 090 091 090 088 088 090
Coal 102 102 101 100 100 100 099 098 098 100 100 101 101 101 102
Industrial ElectricityDistillate Oil
101 085
100 077
097 076
094 073
093 072
092 072
091 070
091 068
091 068
091 069
092 072
091 074
090 074
091 075
091 075
Residual Oil 125 124 118 097 089 088 086 083 083 084 088 092 094 096 098
Natural Gas 101 096 091 088 085 083 082 081 081 081 082 081 077 077 079
Coal 101 100 099 098 097 097 096 096 096 096 096 097 097 097 098
TransportationMotor Gasoline 094 089 087 085 082 081 079 077 077 078 079 081 080 080 081
----------------- ----- ----- ----- ----- ----- ----- ----- ----- ----- ----- ----- ----- ----- ----- -----
Table Ca-4 continued Projected fuel price indices (excluding general inflation) by end-use sector and fuel type
35
Census Region 4 (Alaska Arizona California Colorado HawaiiIdaho Montana Nevada New Mexico Oregon Utah Washington Wyoming)
----------------- Projected April 1 Fuel Price Indices (April 1 2008 = 100)
----- ----- ----- ----- ----- ----- ----- ----- ----- ----- ----- ----- ----- ----- ----- Sector and Fuel 2024 2025 2026 2027 2028 2029 2030 2031 2032 2033 2034 2035 2036 2037 2038 ----------------- ----- ----- ----- ----- ----- ----- ----- ----- ----- ----- ----- ----- ----- ----- -----
Residential ElectricityDistillate Oil
098 065
099 065
100 067
100 068
100 069
101 070
101 071
102 072
102 072
102 073
103 073
103 074
104 075
104 075
104 076
LPG 091 092 093 093 094 095 096 096 097 097 098 098 099 099 100
Natural Gas 091 093 095 097 098 101 103 104 104 105 106 107 108 108 109
Commercial ElectricityDistillate Oil
088 073
089 074
089 076
089 077
090 078
091 079
091 080
091 081
091 082
091 082
091 083
092 084
092 084
092 085
092 086
Residual Oil 097 099 101 102 103 104 106 107 109 110 112 113 115 116 118
Natural Gas 092 094 097 098 100 103 105 107 108 108 109 110 111 112 113
Coal 103 104 105 106 106 107 107 107 108 108 108 109 109 109 110
Industrial ElectricityDistillate Oil
091 076
092 077
092 078
093 079
093 080
094 081
094 082
094 083
095 084
095 084
095 085
095 086
096 087
096 087
096 088
Residual Oil 100 102 104 105 106 107 109 110 112 113 115 116 118 120 121
Natural Gas 081 083 086 088 090 093 096 098 099 100 101 103 104 105 107
Coal 099 100 100 100 101 102 102 102 102 103 103 103 104 104 104
TransportationMotor Gasoline 080 080 080 080 080 081 081 081 082 082 083 083 084 085 085
----------------- ----- ----- ----- ----- ----- ----- ----- ----- ----- ----- ----- ----- ----- ----- -----
Table Ca-5 Projected fuel price indices (excluding general inflation) by end-use sector and fuel type
36
United States Average
----------------- Projected April 1 Fuel Price Indices (April 1 2008 = 100)
----- ----- ----- ----- ----- ----- ----- ----- ----- ----- ----- ----- ----- ----- ----- Sector and Fuel 2009 2010 2011 2012 2013 2014 2015 2016 2017 2018 2019 2020 2021 2022 2023 ----------------- ----- ----- ----- ----- ----- ----- ----- ----- ----- ----- ----- ----- ----- ----- -----
Residential ElectricityDistillate Oil
103 089
103 082
101 078
100 075
099 072
099 070
098 068
098 066
098 065
099 066
099 066
099 067
098 068
099 068
099 069
LPG 099 096 095 094 093 093 092 092 092 092 093 092 092 092 093
Natural Gas 100 097 095 093 091 090 089 089 089 090 091 090 090 090 091
Commercial ElectricityDistillate Oil
102 090
101 084
099 081
097 078
095 074
093 073
092 071
092 068
093 068
093 068
093 070
093 072
092 072
092 072
092 073
Residual Oil 102 096 092 087 083 080 076 072 071 072 073 075 076 077 078
Natural Gas 101 098 094 093 091 089 088 088 088 089 090 090 089 090 092
Coal 102 101 100 098 097 096 095 095 094 094 093 094 094 094 094
Industrial ElectricityDistillate Oil
103 089
102 082
099 082
096 079
094 076
092 075
091 073
091 071
091 070
091 071
092 073
091 076
091 076
091 076
091 077
Residual Oil 105 099 094 087 082 079 075 071 070 071 073 074 075 076 077
Natural Gas 103 100 095 092 089 086 084 083 084 085 086 085 084 084 086
Coal 100 098 097 096 095 094 094 093 093 092 092 092 092 093 093
TransportationMotor Gasoline 096 090 087 084 082 081 079 077 077 077 079 081 081 081 081
----------------- ----- ----- ----- ----- ----- ----- ----- ----- ----- ----- ----- ----- ----- ----- -----
Table Ca-5 continued Projected fuel price indices (excluding general inflation) by end-use sector and fuel type
37
United States Average
----------------- Projected April 1 Fuel Price Indices (April 1 2008 = 100)
----- ----- ----- ----- ----- ----- ----- ----- ----- ----- ----- ----- ----- ----- ----- Sector and Fuel 2024 2025 2026 2027 2028 2029 2030 2031 2032 2033 2034 2035 2036 2037 2038 ----------------- ----- ----- ----- ----- ----- ----- ----- ----- ----- ----- ----- ----- ----- ----- ----- Residential
ElectricityDistillate Oil
099 070
099 071
099 072
099 073
100 074
100 075
100 076
100 077
101 078
101 078
101 079
101 080
101 080
101 081
102 082
LPG 093 094 094 095 095 096 097 097 098 098 099 099 100 100 101
Natural Gas 093 094 096 097 098 100 102 103 104 104 105 106 107 107 108
Commercial
ElectricityDistillate Oil
093 074
093 075
093 076
093 077
094 079
094 080
094 081
095 082
095 083
095 084
096 084
096 085
096 086
096 087
097 088
Residual Oil 079 081 082 082 083 085 086 088 089 090 092 093 094 096 097
Natural Gas 093 095 097 098 100 102 103 105 105 106 107 108 109 110 111
Coal 094 095 095 095 095 095 096 096 096 097 097 097 097 098 098
Industrial
ElectricityDistillate Oil
091 077
091 078
091 079
091 080
092 081
093 083
093 084
093 085
094 086
094 086
094 087
094 088
094 089
095 089
095 090
Residual Oil 079 080 082 082 083 085 086 087 089 090 091 092 094 095 096
Natural Gas 088 089 091 092 095 097 099 101 102 103 105 106 107 108 110
Coal 093 093 094 094 094 094 094 095 095 095 096 096 096 096 096
Transportation
Motor Gasoline 081 082 082 083 083 084 085 085 086 087 087 088 088 089 089
----------------- ----- ----- ----- ----- ----- ----- ----- ----- ----- ----- ----- ----- ----- ----- -----
----------------- ----- ----- ----- ----- ----- -----
----------------- ----- ----- ----- ----- ----- -----
----------------- ----- ----- ----- ----- ----- -----
Table Cb-1 Projected average fuel price escalation rates excluding general inflation by end-use sector and fuel type
Census Region 1 (Connecticut Maine Massachusetts New HampshireNew Jersey New York Pennsylvania Rhode Island Vermont)
Percentage change compounded annually
2008 2013 2018 2023 2028 2033 Sector and Fuel to to to to to to
2013 2018 2023 2028 2033 2038
Residential Electricity -01 02 -01 03 03 02 Distillate Oil -62 -18 09 14 11 08 LPG -20 -03 00 04 05 05 Natural Gas -14 -03 04 12 10 06
Commercial Electricity -18 -02 00 06 05 04 Distillate Oil -54 -16 13 14 12 09 Residual Oil -37 -29 16 13 16 15 Natural Gas -16 -03 05 14 12 08 Coal -24 -15 01 07 05 03
Industrial Electricity -29 -05 -03 07 05 04 Distillate Oil -50 -13 14 12 12 09 Residual Oil -38 -28 15 13 16 14 Natural Gas -22 -10 01 14 14 11 Coal -03 -09 00 -01 03 03
TransportationMotor Gasoline -41 -12 13 06 08 07
38
----------------- ----- ----- ----- ----- ----- -----
----------------- ----- ----- ----- ----- ----- -----
----------------- ----- ----- ----- ----- ----- -----
Table Cb-2 Projected average fuel price escalation rates excluding general inflation by end-use sector and fuel type
Census Region 2 (Illinois Indiana Iowa Kansas Michigan MinnesotaMissouri Nebraska North Dakota Ohio South Dakota Wisconsin)
Percentage change compounded annually
2008 2013 2018 2023 2028 2033 Sector and Fuel to to to to to to
2013 2018 2023 2028 2033 2038
Residential Electricity 02 -00 -01 -01 01 -00 Distillate Oil -73 -20 11 15 11 09 LPG -07 -03 00 07 07 06 Natural Gas -21 -04 03 16 12 08
Commercial Electricity -04 -04 01 01 04 02 Distillate Oil -65 -17 14 15 13 09 Residual Oil -38 -21 23 16 14 14 Natural Gas -23 -04 04 18 14 09 Coal 06 -04 00 00 03 03
Industrial Electricity -10 -05 -02 00 04 01 Distillate Oil -51 -13 14 12 12 08 Residual Oil -42 -23 20 16 14 14 Natural Gas -21 -09 00 20 17 12 Coal -06 -01 01 04 04 03
TransportationMotor Gasoline -36 -11 11 06 08 07
39
----------------- ----- ----- ----- ----- ----- -----
----------------- ----- ----- ----- ----- ----- -----
----------------- ----- ----- ----- ----- ----- -----
Table Cb-3 Projected average fuel price escalation rates excluding general inflation by end-use sector and fuel type
Census Region 3 (Alabama Arkansas Delaware District of Columbia FloridaGeorgia Kentucky Louisiana Maryland Mississippi North Carolina Oklahoma South
Carolina Tennessee Texas Virginia West Virginia)
Percentage change compounded annually
2008 2013 2018 2023 2028 2033 Sector and Fuel to to to to to to
2013 2018 2023 2028 2033 2038
Residential Electricity 00 -03 01 01 01 01 Distillate Oil -62 -18 09 14 11 09 LPG -18 -02 02 05 05 05 Natural Gas -17 -02 07 13 11 07
Commercial Electricity -05 -05 00 02 02 02 Distillate Oil -58 -17 14 15 13 09 Residual Oil -19 -29 15 17 14 14 Natural Gas -17 -03 08 14 12 08 Coal -18 -14 -01 -02 03 04
Industrial Electricity -09 -06 -00 03 02 02 Distillate Oil -52 -13 14 12 13 09 Residual Oil -41 -28 16 17 14 14 Natural Gas -22 -10 07 18 17 13 Coal -18 -08 00 00 03 02
TransportationMotor Gasoline -40 -12 12 06 08 07
40
----------------- ----- ----- ----- ----- ----- -----
----------------- ----- ----- ----- ----- ----- -----
----------------- ----- ----- ----- ----- ----- -----
Table Cb-4 Projected average fuel price escalation rates excluding general inflation by end-use sector and fuel type
Census Region 4 (Alaska Arizona California Colorado HawaiiIdaho Montana Nevada New Mexico Oregon Utah Washington Wyoming)
Percentage change compounded annually
2008 2013 2018 2023 2028 2033 Sector and Fuel to to to to to to
2013 2018 2023 2028 2033 2038
Residential Electricity -09 03 02 05 04 04 Distillate Oil -93 -10 16 18 10 08 LPG -17 -02 -02 07 07 05 Natural Gas -20 -01 -01 19 14 08
Commercial Electricity -19 -04 -03 05 03 02 Distillate Oil -70 -10 18 16 11 09 Residual Oil -28 -12 31 16 13 13 Natural Gas -21 00 01 22 15 08 Coal -01 00 06 07 03 04
Industrial Electricity -15 -02 -02 06 04 03 Distillate Oil -63 -08 17 13 11 08 Residual Oil -22 -13 31 16 13 13 Natural Gas -32 -09 -07 28 21 13 Coal -05 -03 05 05 04 03
TransportationMotor Gasoline -38 -11 07 -01 05 07
41
----------------- ----- ----- ----- ----- ----- -----
----------------- ----- ----- ----- ----- ----- -----
----------------- ----- ----- ----- ----- ----- -----
Table Cb-5 Projected average fuel price escalation rates excluding general inflation by end-use sector and fuel type
United States Average
Percentage change compounded annually
2008 2013 2018 2023 2028 2033 Sector and Fuel to to to to to to
2013 2018 2023 2028 2033 2038
Residential Electricity -02 -01 00 02 02 02 Distillate Oil -64 -18 10 14 11 09 LPG -14 -02 01 06 06 06 Natural Gas -18 -03 03 15 12 07
Commercial Electricity -11 -04 -01 03 04 02 Distillate Oil -58 -16 13 14 13 09 Residual Oil -36 -29 16 14 16 15 Natural Gas -19 -03 05 17 13 08 Coal -06 -07 01 03 03 03
Industrial Electricity -13 -05 -02 03 04 02 Distillate Oil -54 -12 15 12 12 09 Residual Oil -40 -27 17 15 15 14 Natural Gas -23 -10 02 20 18 13 Coal -11 -05 02 02 03 03
TransportationMotor Gasoline -39 -11 11 04 07 07
42
PART IIENERGY PRICE INDICES FOR PRIVATE SECTOR LCC ANALYSIS
This section presents tables of projected nominal (ie including inflation) fuel price indices for four fuels in the residential sector and five fuels in the commercial sector for each of the years from 2008 through 2038 These price indices are based on the DOE energy price projections reported in Part I Section B of this document used to calculate the FEMP and OMB UPV factors for energy costs Tables S-1 to S-5 are provided as an update to similar tables originally published in Comprehensive Guide for Least-Cost Energy Decisions (NBS SP 709)
As a convenience for the user the indices include the effect of four alternative hypothetical rates of general price inflation 2 3 4 and 5 Selection of these rates is in no way intended to suggest what actual rates might be Use of the indices produce price estimates in current dollars inclusive of general price inflation Current-dollar prices are needed when discounting is performed with discount rates that include general price inflation (ie nominal or market discount rates)
The calculated indices with inflation rates of 2 3 4 and 5 allow the analyst to perform evaluations based on the assumption of a positive rate of general price inflation that changes the purchasing power of the dollar Performing evaluations in current dollars is sometimes preferred for private investment decisions primarily because it facilitates the treatment of taxes
The indices in Tables S-1 through S-5 are derived from the indices reported in Tables Ca-1 through Ca-5 by means of the following equation
IS = IC times (1+ g )N
where IS = index found in Tables S-1 through S-5 IC = index found in Tables Ca-1 through Ca-5 g = annual rate of general price inflation in decimal form and N = number of years in this case equal to the year of the index minus 2007
Example of How to Use the Indices
Suppose you wish to estimate the annual cost of natural gas for a house in Maryland in year 2011 given the annual cost in 2008 (April 1) prices and you expect an annual inflation rate of 3 per year From table S-3 find the column with residential natural gas indices at an inflation rate of 3 then locate the index for the year 2011 This index is 103 Multiply the annual cost in 2008 prices by the index to find the estimated annual cost in year 2011 prices
If this annual cost in year-2011 prices is to be discounted to present value you must use a nominal discount rate that includes the same assumption with regard to general price inflation (3 in this example) To obtain a present-value cost over the entire study period the present-value calculation must be repeated for each year that there are natural gas costs and the results summed (UPV factors are not given for private sector use because of the large number of
43
tables required to cover potential discount rates that might be used by the analyst) The BLCC computer program can perform LCC analyses using any inflation rate and discount rate in constant or in current (market) dollars The DISCOUNT program included with BLCC can compute UPV factors based on DOE energy price escalation rates using any inflation rate and discount rate (See page iv for more information on these programs) Of course the private sector analyst may use the UPV factors reported in Part I provided the analysis is performed in constant dollars and the desired discount rate corresponds to the DOE or OMB discount rates used in Part I
For further explanation of the use of these indices see NBS Special Publication 709 appendix B Part I
The data in the tables that follow are reported for the four Census regions and the US average Figure B-1 on page 13 presents a map showing the states corresponding to the four Census regions The Census regions do not include American Samoa Canal Zone Guam Puerto Rico Trust Territory of the Pacific Islands or the Virgin Islands Analysts of federal projects in these areas should use data which are reasonable under the circumstances and may refer to the tables with US average data for guidance
44
45
Table S-1 Projected fuel price indices with assumed general price inflation rates of 2 3 4 and 5 by end-use sector and fuel type
Census Region 1 (Connecticut Maine Massachusetts New HampshireNew Jersey New York Pennsylvania Rhode Island Vermont)
Projected April 1 Fuel Price Indices (April 1 2008 = 100)
--------------------------------------------------RESIDENTIAL---------------------------------------------------
Electricity
------------------------
Distillate Oil ------------------------
LPG ------------------------
Natural Gas ------------------------
Inflation Rate
Inflation Rate Inflation Rate Inflation Rate Year 2 3 4 5 2 3 4 5 2 3 4 5 2 3 4 5 2009 105 106 107 108 091 092 093 094 098 099 100 101 103 104 105 106 2010 105 108 110 112 086 088 089 091 097 099 101 103 103 105 107 109 2011 106 109 112 115 084 087 089 092 098 101 104 107 102 105 109 112 2012 108 113 117 122 082 086 089 092 099 103 107 111 103 107 111 115 2013 110 115 121 127 080 084 089 093 100 105 110 116 103 108 114 119 2014 112 118 125 133 080 085 090 095 101 107 114 120 103 110 116 123 2015 114 122 130 139 079 084 090 097 102 110 117 125 104 112 120 128 2016 116 126 136 147 078 084 091 098 104 113 122 131 106 115 124 134 2017 120 131 142 155 079 086 094 102 106 116 127 138 109 119 130 141 2018 123 135 149 164 081 089 098 108 109 120 132 145 112 123 136 150 2019 125 139 155 172 084 093 103 115 111 124 138 153 115 128 143 158 2020 127 143 160 180 086 097 108 122 113 127 143 160 117 132 148 166 2021 129 146 166 188 088 100 114 129 115 130 148 167 119 135 153 173 2022 131 151 172 197 091 104 119 136 117 135 154 176 122 140 160 183 2023 135 156 180 208 094 108 125 145 120 139 161 185 126 146 169 195 2024 138 161 188 219 097 113 132 154 123 144 168 195 130 152 177 207 2025 141 166 196 231 100 118 140 164 126 149 175 206 134 158 186 219 2026 144 172 204 243 104 124 147 175 129 154 183 217 139 165 196 233 2027 147 177 213 255 107 129 155 186 132 159 190 228 142 171 206 247 2028 151 183 222 269 111 135 164 198 135 164 199 241 147 179 217 263 2029 154 189 232 283 115 141 173 211 139 170 209 255 153 187 229 281 2030 158 196 242 299 119 148 182 225 142 176 218 269 158 195 242 298 2031 161 202 252 314 123 153 192 239 146 182 228 284 162 203 253 316 2032 165 209 263 331 126 159 201 253 149 189 238 299 166 210 265 334 2033 169 215 274 348 130 166 211 268 153 195 249 316 171 218 278 353 2034 172 222 286 366 133 172 221 283 157 202 260 333 175 226 290 372 2035 176 229 298 385 137 179 232 300 161 209 271 352 180 234 304 394 2036 180 237 310 406 141 185 243 318 165 217 284 371 185 243 318 416 2037 184 244 323 427 145 193 255 337 169 224 297 391 190 252 333 440 2038 188 252 337 449 149 200 267 356 173 232 310 413 195 261 349 465
46
Table S-1 continued Projected fuel price indices with assumed general price inflation rates of 2 3 4 and 5 by end-use sector and fuel type
Census Region 1 (Connecticut Maine Massachusetts New HampshireNew Jersey New York Pennsylvania Rhode Island Vermont)
Projected April 1 Fuel Price Indices (April 1 2008 = 100)
----------------------------------------------------------------COMMERCIAL-----------------------------------------------------------------
Electricity
------------------------
Distillate Oil ------------------------
Residual Oil ------------------------
Natural Gas ------------------------
Coal ------------------------
Inflation Rate
Inflation Rate Inflation Rate Inflation Rate Inflation Rate Year 2 3 4 5 2 3 4 5 2 3 4 5 2 3 4 5 2 3
4 5
2009 104 105 106 107 093 094 095 096 102 103 104 105 104 105 106 107 103 104 105
106 2010 102 104 106 108 089 091 092 094 098 100 102 104 103 105 107 109 103 105
107 109
2011 100 103 106 110 088 090 093 096 096 099 102 105 102 105 108 111 101 104 107
110 2012 101 105 109 113 086 089 093 096 094 097 101 105 102 106 110 114 099 103
107 111
2013 101 106 111 117 084 088 092 097 091 096 101 106 102 107 112 118 098 102 108
113 2014 101 107 114 120 084 089 094 100 089 094 100 106 102 108 115 121 099 105
111 117
2015 102 110 117 125 083 089 095 102 086 092 099 106 103 110 118 126 100 107 114
122 2016 104 113 122 132 082 088 095 103 084 090 098 105 105 113 122 132 099 108
116 125
2017 107 117 128 139 083 090 098 107 084 092 100 109 107 117 128 139 099 108 118
129 2018 110 122 134 148 085 094 103 114 087 096 106 116 111 122 135 148 100 110
121 133
2019 113 126 140 156 089 099 110 122 090 101 112 124 114 127 141 157 101 112 125
139 2020 115 130 146 163 092 104 117 131 094 105 118 132 116 131 147 165 103 116
130 146
2021 116 132 150 170 095 107 122 138 097 110 125 141 118 134 152 172 105 120 136
153 2022 119 136 156 179 097 111 127 146 100 115 132 150 122 139 160 182 108 124
142 162
2023 122 141 163 189 100 116 134 155 104 120 139 161 126 145 168 194 111 128 148
171 2024 125 146 171 199 103 121 141 164 108 126 147 171 130 152 177 207 113 132
155 180
2025 128 152 179 210 107 126 149 175 112 132 156 183 134 159 187 220 116 137 162
190 2026 132 157 187 222 111 132 157 187 116 138 164 195 139 166 197 235 119 142
169 201
2027 135 162 195 233 115 138 166 199 118 142 171 205 143 172 207 248 123 148 178
214 2028 139 169 204 248 118 144 175 212 123 149 181 219 149 181 219 266 127 154
187 226
2029 142 174 214 261 123 151 185 226 128 157 192 234 155 190 232 284 130 160 196
240 2030 146 181 223 276 127 158 195 241 132 164 203 250 160 198 245 303 134 166
205 253
2031 149 187 233 291 131 164 205 256 137 171 214 267 165 206 258 321 137 171 214
267 2032 153 193 244 307 135 171 215 271 142 179 226 284 169 214 270 340 140 176
223 280
2033 157 200 254 323 139 177 226 287 147 187 238 303 174 222 283 359 143 183 232
295 2034 160 207 266 341 143 184 237 304 152 196 252 323 179 231 296 380 147 189
243 311
2035 164 214 277 359 147 192 249 322 157 204 265 344 184 239 310 402 150 195 253
327 2036 168 221 289 378 152 199 261 341 163 214 280 366 189 248 325 425 153 201
264 345
2037 172 228 302 399 156 207 274 362 168 223 295 390 194 258 341 450 157 208 276
364 2038 176 236 316 421 160 215 287 383 174 233 312 416 200 267 357 476 160 215
287 382
47
Table S-1 continued Projected fuel price indices with assumed general price inflation rates of 2 3 4 and 5 by end-use sector and fuel type
Census Region 1 (Connecticut Maine Massachusetts New HampshireNew Jersey New York Pennsylvania Rhode Island Vermont)
Projected April 1 Fuel Price Indices (April 1 2008 = 100)
----------------------------------------------------------------INDUSTRIAL-----------------------------------------------------------------
Electricity
------------------------
Distillate Oil ------------------------
Residual Oil ------------------------
Natural Gas ------------------------
Coal ------------------------
Inflation Rate
Inflation Rate Inflation Rate Inflation Rate Inflation Rate Year 2 3 4 5 2 3 4 5 2 3 4 5 2 3 4 5 2 3
4 5
2009 104 105 106 107 093 094 095 096 102 103 104 105 105 106 107 108 102 103 104
105 2010 101 103 105 107 088 090 092 094 098 100 102 104 103 105 108 110 103 105
107 109
2011 097 100 103 106 089 091 094 097 096 099 102 105 101 104 107 111 105 108 111
114 2012 097 101 105 109 087 091 094 098 093 097 101 105 100 104 108 113 106 110
115 119
2013 095 100 105 110 086 090 094 099 091 095 100 105 099 104 109 114 109 114 120
125 2014 094 100 106 112 086 091 097 103 088 094 099 105 098 104 110 116 110 116
123 131
2015 095 102 109 117 086 092 098 105 086 092 099 105 098 104 112 119 111 118 127
135 2016 097 105 113 122 085 091 099 107 083 090 097 105 099 107 115 124 112 121
131 142
2017 099 109 118 129 086 094 102 111 084 092 100 109 101 110 120 131 114 124 135
147 2018 102 113 124 137 088 097 107 118 087 096 106 116 104 114 126 139 115 127
139 153
2019 104 116 129 144 093 103 115 127 090 100 112 124 107 119 132 147 117 130 144
160 2020 106 119 133 150 097 109 123 138 093 105 118 132 108 121 136 153 119 134
151 169
2021 106 121 137 155 099 113 128 144 096 110 124 141 108 123 140 158 122 138 157
178 2022 108 124 142 163 102 117 134 153 100 114 131 150 112 128 146 167 124 142
163 186
2023 111 129 149 172 105 121 140 162 103 120 138 160 115 133 154 178 127 147 170
196 2024 115 134 156 182 107 125 146 171 107 125 146 171 119 139 162 189 129 150
176 205
2025 118 139 164 193 111 131 155 182 111 131 155 182 123 145 171 201 131 155 183
215 2026 121 144 171 203 115 137 163 194 115 137 163 194 128 152 181 215 133 159
189 225
2027 123 148 178 214 119 143 172 206 117 141 170 204 131 158 190 227 137 164 197
237 2028 127 155 188 227 123 149 181 219 122 148 179 217 136 166 201 244 139 169
205 249
2029 130 160 196 240 127 156 191 234 126 155 190 232 142 174 213 261 142 174 214
261 2030 134 166 205 253 132 163 202 249 131 162 201 248 147 183 226 279 146 180
223 275
2031 137 172 215 267 136 170 212 264 136 170 212 264 152 190 238 296 149 187 233
290 2032 141 178 224 282 140 176 222 280 140 177 224 281 157 198 250 314 153 193
243 306
2033 144 184 234 297 144 183 233 296 145 185 236 300 162 206 263 334 156 199 253
322 2034 148 190 245 314 148 190 245 314 150 194 249 319 167 215 276 354 160 206
264 339
2035 151 197 256 331 152 198 257 333 155 202 263 340 172 224 290 376 164 213 276
358 2036 155 204 267 349 156 205 269 352 161 211 277 362 177 233 305 399 167 219
287 376
2037 159 211 279 368 161 214 283 373 166 221 292 386 183 243 321 424 171 227 300
396 2038 163 218 291 388 166 222 297 395 172 231 308 411 189 253 338 450 174 234
312 416
48
Table S-2 Projected fuel price indices with assumed general price inflation rates of 2 3 4 and 5 by end-use sector and fuel type
Census Region 2 (Illinois Indiana Iowa Kansas Michigan MinnesotaMissouri Nebraska North Dakota Ohio South Dakota Wisconsin)
Projected April 1 Fuel Price Indices (April 1 2008 = 100)
--------------------------------------------------RESIDENTIAL---------------------------------------------------
Electricity
------------------------
Distillate Oil ------------------------
LPG ------------------------
Natural Gas ------------------------
Inflation Rate
Inflation Rate Inflation Rate Inflation Rate Year 2 3 4 5 2 3 4 5 2 3 4 5 2 3 4 5 2009 105 106 107 108 088 089 090 091 103 104 106 107 102 103 104 105 2010 108 111 113 115 082 084 085 087 104 106 108 110 101 103 105 107 2011 110 113 116 119 080 083 085 088 105 108 111 114 099 102 105 108 2012 110 115 119 124 078 081 084 087 106 110 114 119 099 103 107 111 2013 112 117 123 129 075 079 083 087 107 112 118 123 099 104 109 115 2014 113 120 127 135 075 079 084 089 108 114 121 128 099 105 112 118 2015 115 123 132 141 073 079 084 090 109 117 125 134 100 107 115 123 2016 117 127 137 148 072 078 084 091 111 120 130 140 102 110 119 128 2017 120 131 143 156 073 080 087 095 114 124 135 147 104 114 124 135 2018 123 136 149 164 075 083 091 101 116 128 141 155 107 118 130 143 2019 126 140 156 173 078 086 096 107 119 132 147 164 110 123 137 152 2020 128 144 162 181 080 090 101 113 121 136 152 171 112 126 141 159 2021 130 148 168 190 082 093 106 120 122 139 158 178 113 128 145 165 2022 133 152 174 199 085 097 111 127 125 144 164 188 116 133 153 174 2023 135 157 181 209 088 101 117 135 129 149 172 199 120 139 161 186 2024 138 161 188 220 091 106 124 144 132 154 180 210 124 145 170 198 2025 140 166 195 230 094 111 131 154 135 160 188 222 129 152 179 211 2026 143 170 203 241 098 116 138 164 139 166 197 234 134 159 190 225 2027 145 175 210 252 101 121 146 175 143 172 206 247 138 166 199 239 2028 149 181 219 265 104 127 154 186 147 178 217 262 143 174 211 256 2029 152 186 228 279 108 133 163 199 151 185 227 278 149 183 224 274 2030 155 193 238 294 112 138 171 211 155 192 238 294 155 192 237 293 2031 159 199 248 309 115 144 180 224 159 199 249 310 159 199 249 310 2032 162 205 258 325 118 150 189 237 164 207 261 328 164 207 261 328 2033 165 211 268 341 122 156 198 252 168 214 273 346 168 215 273 347 2034 168 217 279 358 125 162 208 267 172 222 285 366 173 223 287 368 2035 172 223 290 376 129 168 218 282 177 230 298 386 178 231 300 389 2036 175 230 302 394 133 175 229 299 181 238 312 408 183 240 315 412 2037 179 237 314 414 137 182 240 317 186 247 327 431 188 250 330 436 2038 182 244 326 434 141 189 252 336 191 256 342 455 193 259 346 461
49
Table S-2 continued Projected fuel price indices with assumed general price inflation rates of 2 3 4 and 5 by end-use sector and fuel type
Census Region 2 (Illinois Indiana Iowa Kansas Michigan MinnesotaMissouri Nebraska North Dakota Ohio South Dakota Wisconsin)
Projected April 1 Fuel Price Indices (April 1 2008 = 100)
----------------------------------------------------------------COMMERCIAL-----------------------------------------------------------------
Electricity
------------------------
Distillate Oil ------------------------
Residual Oil ------------------------
Natural Gas ------------------------
Coal------------------------
Inflation Rate
Inflation Rate Inflation Rate Inflation Rate Inflation Rate Year 2 3 4 5 2 3 4 5 2 3 4 5 2 3 4 5 2 3
4 5
2009 105 106 107 108 090 091 092 093 113 114 115 116 103 104 105 106 104 105 106
107 2010 108 110 112 115 085 086 088 090 111 113 115 117 101 103 105 107 106 108
110 113
2011 109 112 115 119 084 087 089 092 107 110 113 116 099 102 105 108 110 113 116
120 2012 109 113 117 122 081 085 088 091 095 099 103 107 099 103 107 111 112 116
121 125
2013 108 113 119 125 079 083 087 091 091 095 100 105 098 103 108 114 114 119 125
131 2014 108 114 121 129 079 084 089 094 091 096 102 108 098 104 111 117 116 122
130 137
2015 109 117 125 134 078 083 089 095 088 094 101 108 099 106 114 121 117 125 134
143 2016 111 120 130 140 077 083 089 097 087 094 101 109 101 109 117 127 119 129
139 150
2017 114 124 135 147 077 085 092 101 087 095 104 113 103 113 123 134 121 132 144
157 2018 117 129 142 156 080 088 097 107 090 099 109 120 107 118 130 143 123 136
149 164
2019 119 133 148 164 083 093 103 115 095 106 117 131 110 122 136 151 125 139 155
172 2020 122 137 154 172 087 098 110 123 100 112 126 141 111 125 141 158 127 143
161 180
2021 124 140 159 180 089 101 115 130 104 118 133 151 112 128 145 164 130 147 167
189 2022 126 145 166 190 092 105 120 137 107 122 140 160 116 133 152 174 133 153
175 200
2023 129 150 173 200 094 109 126 146 111 129 149 172 120 139 161 185 136 157 182
210 2024 132 154 180 210 097 114 133 155 116 135 158 184 125 146 170 198 138 162
189 220
2025 135 159 187 220 101 119 140 165 120 142 167 197 129 153 180 212 141 166 196
230 2026 137 164 195 231 105 125 148 176 125 149 177 210 134 160 191 227 143 171
203 242
2027 140 168 202 243 108 130 157 188 128 154 185 222 139 167 201 241 146 176 212
254 2028 143 174 212 256 112 136 165 200 133 161 196 237 145 176 214 259 150 182
221 268
2029 147 180 221 270 116 143 175 214 137 168 206 251 151 185 227 278 153 188 230
281 2030 151 188 232 286 121 149 185 228 142 175 217 268 157 194 240 297 157 194
240 296
2031 155 194 242 302 124 156 194 242 146 183 229 285 162 202 253 315 160 200 250
311 2032 158 200 253 318 128 162 204 257 152 191 241 304 166 210 265 334 164 207
261 328
2033 162 207 263 334 132 168 214 272 157 200 255 323 171 218 278 353 168 214 272
346 2034 166 213 274 352 136 175 225 288 162 209 268 344 176 227 292 374 171 220
283 363
2035 169 220 286 370 140 182 236 306 167 218 283 366 181 236 306 396 175 228 296
383 2036 173 227 298 390 144 189 248 324 173 228 298 390 186 245 321 420 179 236
309 404
2037 177 235 311 410 148 197 260 343 179 238 314 415 192 254 337 444 183 243 321
424 2038 181 242 324 431 153 204 273 364 185 248 332 442 197 264 353 471 187 251
336 447
50
Table S-2 continued Projected fuel price indices with assumed general price inflation rates of 2 3 4 and 5 by end-use sector and fuel type
Census Region 2 (Illinois Indiana Iowa Kansas Michigan MinnesotaMissouri Nebraska North Dakota Ohio South Dakota Wisconsin)
Projected April 1 Fuel Price Indices (April 1 2007 = 100)
----------------------------------------------------------------INDUSTRIAL-----------------------------------------------------------------
Electricity
------------------------
Distillate Oil ------------------------
Residual Oil ------------------------
Natural Gas ------------------------
Coal ------------------------
Inflation Rate
Inflation Rate Inflation Rate Inflation Rate Inflation Rate Year 2 3 4 5 2 3 4 5 2 3 4 5 2 3 4 5 2 3
4 5
2009 106 107 108 109 093 094 094 095 110 111 112 113 105 106 107 108 102 103 104
105 2010 108 110 112 115 088 089 091 093 107 109 111 113 104 106 108 111 104 106
108 110
2011 107 110 113 117 089 092 094 097 103 106 109 112 102 105 108 111 105 108 111
115 2012 106 110 115 119 087 091 094 098 093 097 101 105 101 105 109 113 106 110
115 119
2013 105 110 116 121 085 089 094 098 089 094 098 103 099 104 109 115 107 113 118
124 2014 104 111 117 124 086 091 096 102 089 094 100 106 098 104 111 117 109 116
122 130
2015 105 113 121 129 085 091 098 105 087 093 099 106 098 105 113 121 111 119 127
136 2016 107 116 125 135 084 091 098 106 085 092 099 107 099 107 116 125 113 122
132 142
2017 110 120 131 142 085 093 102 111 085 093 102 111 102 111 121 132 115 126 137
149 2018 113 124 137 151 088 097 107 117 088 097 107 117 105 115 127 140 118 130
143 158
2019 115 128 143 158 092 103 114 127 092 103 114 127 108 120 133 148 120 134 149
166 2020 117 132 148 166 097 109 122 137 096 108 122 137 108 122 137 153 123 138
155 174
2021 118 134 152 173 099 112 127 144 100 114 129 146 108 123 139 158 125 141 160
182 2022 121 138 158 181 101 116 133 152 103 118 135 155 111 128 146 167 128 146
168 192
2023 123 143 165 191 104 120 139 161 107 124 143 166 116 134 155 179 131 152 175
202 2024 126 147 172 200 107 125 146 170 112 131 153 178 120 141 164 191 134 157
183 213
2025 128 151 178 210 110 130 154 181 116 137 162 190 125 147 174 205 137 162 191
225 2026 131 156 185 220 114 136 162 192 120 144 171 203 130 155 185 219 141 168
200 237
2027 133 160 192 231 118 142 171 205 123 149 179 214 135 162 195 234 144 173 208
249 2028 136 166 201 243 122 148 180 217 128 155 188 228 141 171 208 251 147 179
217 263
2029 140 171 210 257 126 155 190 232 132 162 198 243 147 181 221 271 151 185 227
277 2030 144 178 220 272 131 162 201 248 137 169 209 258 153 190 235 290 155 192
237 293
2031 147 184 230 286 135 169 211 263 141 177 221 275 159 199 248 309 158 197 246
307 2032 150 190 239 301 139 175 221 278 146 185 233 293 164 207 261 328 162 204
258 324
2033 153 196 249 316 143 182 232 295 151 193 246 312 169 216 274 349 166 211 269
342 2034 156 202 259 332 147 189 243 312 156 201 259 332 174 225 289 371 169 218
280 359
2035 160 208 270 349 151 197 255 331 162 210 273 353 180 234 304 393 173 225 292
378 2036 163 214 281 367 155 204 268 350 167 219 287 376 186 244 320 418 177 233
305 399
2037 166 221 292 386 160 212 281 371 173 229 303 400 192 254 337 444 181 240 318
419 2038 170 228 304 406 164 220 294 392 179 239 320 426 198 265 354 472 185 248
332 442
51
Table S-3 Projected fuel price indices with assumed general price inflation rates of 2 3 4 and 5 by end-use sector and fuel type
Census Region 3 (Alabama Arkansas Delaware District of Columbia Florida Georgia Kentucky Louisiana
Maryland Mississippi North Carolina Oklahoma South Carolina Tennessee Texas Virginia West Virginia)
Projected April 1 Fuel Price Indices (April 1 2008 = 100)
--------------------------------------------------RESIDENTIAL---------------------------------------------------
Electricity
------------------------
Distillate Oil ------------------------
LPG ------------------------
Natural Gas ------------------------
Inflation Rate
Inflation Rate Inflation Rate Inflation Rate Year 2 3 4 5 2 3 4 5 2 3 4 5 2 3 4 5 2009 105 106 107 109 091 092 093 094 099 100 101 102 102 103 104 105 2010 108 110 112 115 086 088 089 091 098 100 102 104 101 103 105 107 2011 108 112 115 118 084 087 089 092 099 101 104 107 100 103 106 109 2012 109 114 118 123 082 085 089 092 100 104 108 112 100 104 109 113 2013 111 116 122 128 080 084 088 093 101 106 111 117 101 106 111 117 2014 112 118 126 133 080 085 090 095 102 108 115 121 102 108 114 121 2015 113 121 130 139 079 084 090 096 103 111 119 127 103 110 118 126 2016 115 125 135 146 078 084 091 098 105 114 123 133 104 113 122 132 2017 118 129 141 153 078 086 093 102 108 117 128 140 107 117 128 139 2018 120 132 146 160 081 089 098 108 110 121 134 147 111 122 134 148 2019 123 137 152 169 083 093 103 114 113 125 139 155 114 127 141 157 2020 125 141 158 177 086 096 108 121 115 129 145 163 117 131 147 165 2021 128 145 164 186 088 100 113 128 117 133 150 170 119 135 153 173 2022 130 150 171 196 090 104 119 136 120 137 157 179 122 140 161 184 2023 133 154 178 206 093 108 125 144 123 142 164 189 126 146 169 195 2024 136 159 185 216 097 113 132 154 126 147 171 200 131 153 178 208 2025 139 164 193 227 100 118 139 164 129 152 179 211 135 160 188 221 2026 142 169 201 239 104 124 147 175 132 157 187 222 140 167 198 235 2027 145 174 209 251 107 129 155 186 135 162 195 234 143 173 208 249 2028 148 180 218 264 111 134 163 198 138 168 204 247 149 181 220 266 2029 151 186 227 278 115 141 172 211 142 174 214 261 155 190 233 284 2030 154 191 237 292 119 147 182 225 146 180 223 275 160 198 245 303 2031 158 197 247 307 122 153 191 238 149 187 233 291 165 206 257 321 2032 161 204 257 323 126 159 200 252 153 193 244 307 169 214 269 339 2033 165 210 267 340 129 165 210 267 157 200 255 324 173 221 282 358 2034 168 217 278 357 133 171 220 283 161 207 266 342 178 230 295 379 2035 172 223 290 375 137 178 231 299 165 215 279 361 183 238 309 400 2036 175 230 302 395 141 185 242 317 169 222 291 381 188 247 324 423 2037 179 238 314 415 145 192 254 336 173 230 305 402 193 256 339 447 2038 183 245 327 436 149 200 267 355 178 238 318 424 198 266 355 473
52
Table S-3 continued Projected fuel price indices with assumed general price inflation rates of 2 3 4 and 5 by end-use sector and fuel type
Census Region 3 (Alabama Arkansas Delaware District of Columbia Florida Georgia Kentucky LouisianaMaryland Mississippi North Carolina Oklahoma South Carolina Tennessee Texas Virginia West Virginia)
Projected April 1 Fuel Price Indices (April 1 2008 = 100)
----------------------------------------------------------------COMMERCIAL-----------------------------------------------------------------
Electricity
------------------------
Distillate Oil ------------------------
Residual Oil ------------------------
Natural Gas ------------------------
Coal ------------------------
Inflation Rate
Inflation Rate Inflation Rate Inflation Rate Inflation Rate Year 2 3 4 5 2 3 4 5 2 3 4 5 2 3 4 5 2 3
4 5
2009 105 106 107 108 093 094 094 095 116 117 119 120 104 105 106 107 103 104 105
106 2010 108 110 112 114 088 089 091 093 114 117 119 121 102 104 106 108 103 105
107 109
2011 107 110 114 117 087 090 092 095 110 114 117 120 101 104 107 110 102 105 109
112 2012 108 112 116 121 084 088 091 095 105 109 113 118 101 105 109 114 101 105
109 114
2013 108 113 119 125 082 086 090 095 100 105 111 116 101 106 112 117 101 106 111
117 2014 108 115 121 129 082 087 092 098 099 105 111 118 102 108 114 121 101 107
113 120
2015 109 117 125 134 081 087 093 099 096 102 110 117 102 109 117 125 101 108 116
124 2016 111 121 130 141 080 086 093 100 092 100 108 116 104 112 121 131 102 110
119 128
2017 114 124 136 148 081 088 096 105 093 101 110 120 107 116 127 138 103 112 123
134 2018 116 128 141 155 083 092 101 111 096 105 116 128 110 122 134 147 104 115
126 139
2019 119 132 147 163 087 097 107 119 099 111 123 137 114 127 141 156 105 117 130
145 2020 121 136 153 171 090 102 114 128 103 116 130 146 116 131 147 165 108 121
136 153
2021 123 139 158 179 093 105 119 135 106 121 137 155 118 135 153 173 110 125 141
160 2022 126 144 165 188 095 109 125 143 109 125 144 164 122 140 160 183 112 128
147 168
2023 128 148 171 198 098 114 131 152 114 132 152 175 126 146 169 195 114 132 153
177 2024 131 153 178 208 101 118 138 161 118 138 162 188 131 153 179 208 117 136
159 185
2025 134 158 186 219 105 124 146 172 123 145 171 202 135 160 188 222 118 140 165
194 2026 137 163 194 230 109 130 154 184 128 153 182 216 140 167 199 236 120 143
171 203
2027 139 168 202 242 113 136 163 195 132 158 190 228 144 173 208 250 123 148 177
213 2028 143 174 211 256 117 142 172 208 136 166 201 243 150 182 221 268 125 152
184 223
2029 146 180 220 269 121 148 182 222 141 173 212 259 156 191 234 286 128 157 192
234 2030 150 185 229 283 126 156 193 238 146 181 224 276 161 200 247 305 131 162
200 247
2031 153 191 239 298 130 162 203 253 151 189 236 294 166 208 259 323 134 168 209
261 2032 156 197 249 313 134 169 213 268 156 197 249 313 171 216 272 342 137 173
219 275
2033 160 204 259 329 138 176 223 284 162 206 263 334 175 224 285 362 140 179 227
289 2034 163 210 270 346 142 182 235 301 167 215 277 355 180 232 299 383 143 185
238 305
2035 167 217 281 364 146 190 246 319 173 225 292 378 186 241 313 406 147 191 248
321 2036 170 224 293 383 150 197 258 338 179 235 308 403 191 251 329 430 150 197
258 338
2037 174 231 305 403 155 205 271 358 185 245 325 429 196 260 344 454 154 204 270
356 2038 178 238 318 424 159 213 285 380 191 256 343 457 202 270 361 481 157 211
282 375
53
Table S-3 continued Projected fuel price indices with assumed general price inflation rates of 2 3 4 and 5 by end-use sector and fuel type
Census Region 3 (Alabama Arkansas Delaware District of Columbia Florida Georgia Kentucky LouisianaMaryland Mississippi North Carolina Oklahoma South Carolina Tennessee Texas Virginia West Virginia)
Projected April 1 Fuel Price Indices (April 1 2008 = 100)
----------------------------------------------------------------INDUSTRIAL-----------------------------------------------------------------
Electricity
------------------------
Distillate Oil ------------------------
Residual Oil ------------------------
Natural Gas ------------------------
Coal ------------------------
Inflation Rate
Inflation Rate Inflation Rate Inflation Rate Inflation Rate Year 2 3 4 5 2 3 4 5 2 3 4 5 2 3 4 5 2 3
4 5
2009 106 107 108 109 092 093 094 095 108 109 110 111 106 107 108 109 102 103 104
105 2010 107 110 112 114 087 089 091 092 103 105 107 110 105 107 109 111 101 103
105 107
2011 106 109 113 116 088 091 094 096 100 103 106 109 101 104 107 111 101 104 107
110 2012 106 110 114 119 086 090 093 097 094 097 101 105 100 104 108 112 100 104
108 112
2013 106 111 117 122 085 089 093 098 090 094 099 104 099 104 109 114 101 106 111
116 2014 106 112 119 126 085 090 096 101 088 094 099 105 098 104 110 116 102 108
114 121
2015 107 114 122 131 085 091 097 104 086 092 098 105 097 104 111 119 103 110 118
126 2016 109 118 127 137 084 090 098 105 083 090 097 105 098 106 114 123 104 112
121 131
2017 111 122 133 145 085 093 101 110 083 091 099 108 100 110 120 130 105 115 125
137 2018 113 125 138 152 087 096 106 117 086 095 104 115 104 115 126 139 107 118
130 143
2019 116 129 144 160 091 102 113 126 090 100 111 123 107 119 133 148 109 121 134
149 2020 118 133 149 167 096 108 121 136 093 105 117 132 110 123 138 155 111 125
140 157
2021 120 136 155 175 098 111 126 143 096 109 124 140 111 126 143 162 113 129 146
165 2022 123 141 161 184 101 115 132 151 099 114 130 149 115 131 150 172 116 133
152 174
2023 125 145 167 193 103 120 138 160 103 119 138 159 119 138 159 184 118 137 158
182 2024 128 149 174 203 106 124 145 169 107 126 147 171 124 144 169 197 120 141
164 191
2025 131 154 182 214 110 130 153 180 112 132 155 183 128 151 178 210 123 145 171
201 2026 134 159 190 225 114 136 161 192 116 138 165 196 133 159 189 224 125 149
178 211
2027 137 164 197 237 117 141 170 204 119 144 172 207 137 164 198 237 128 154 185
222 2028 141 171 207 251 121 147 179 217 123 150 182 221 143 174 212 256 130 158
192 233
2029 144 177 216 264 126 154 189 231 128 157 192 235 150 184 226 276 133 164 201
245 2030 147 182 225 278 131 162 200 247 132 164 202 250 156 193 239 295 137 169
209 259
2031 150 188 235 293 135 169 211 263 137 171 214 266 161 202 252 314 139 174 218
271 2032 154 194 245 308 139 175 221 278 141 179 225 284 167 211 266 334 143 180
227 286
2033 157 200 255 324 143 182 232 294 146 187 238 302 172 220 280 355 146 187 237
302 2034 161 207 266 341 147 189 243 312 151 195 251 321 178 229 294 378 149 192
247 317
2035 164 213 277 359 151 196 255 330 156 204 264 342 184 239 310 402 153 199 258
334 2036 168 220 289 378 155 204 267 350 162 213 279 364 190 250 327 428 156 205
269 352
2037 171 227 301 397 160 212 281 370 167 222 294 388 196 260 345 455 159 212 280
370 2038 175 235 314 418 164 220 294 392 173 232 310 413 203 272 363 484 163 219
292 390
------------------------ ------------------------ ------------------------ ------------------------
54
Table S-4 Projected fuel price indices with assumed general price inflation rates of 2 3 4 and 5 by end-use sector and fuel type
Census Region 4 (Alaska Arizona California Colorado HawaiiIdaho Montana Nevada New Mexico Oregon Utah Washington Wyoming)
Projected April 1 Fuel Price Indices (April 1 2008 = 100)
--------------------------------------------------RESIDENTIAL---------------------------------------------------
Electricity Distillate Oil LPG Natural Gas
Inflation Rate
Inflation Rate Inflation Rate Inflation Rate Year 2 3 4 5 2 3 4 5 2 3 4 5 2 3 4 5 2009 103 104 105 106 077 078 079 080 099 100 101 102 102 103 104 105 2010 104 106 108 110 070 071 073 074 099 101 103 105 101 103 105 107 2011 104 107 110 113 068 070 072 074 099 102 105 108 099 102 105 109 2012 104 108 112 116 068 070 073 076 100 104 109 113 100 104 108 112 2013 105 111 116 122 068 071 075 079 101 106 112 117 100 105 110 115 2014 108 114 121 128 068 072 077 081 103 109 116 122 101 107 113 120 2015 110 118 126 135 068 072 077 083 105 112 120 128 102 110 117 125 2016 113 122 132 142 067 073 079 085 106 115 124 134 104 113 122 131 2017 115 126 137 150 069 075 082 089 109 119 129 141 107 117 127 139 2018 118 130 144 158 071 079 087 095 111 122 135 148 110 121 133 146 2019 121 135 150 167 074 083 092 102 114 126 141 156 113 125 140 155 2020 124 139 156 175 077 087 097 109 115 129 145 163 114 128 144 161 2021 126 143 162 183 080 090 102 116 116 132 150 169 114 129 147 166 2022 129 148 169 193 082 094 108 123 118 136 155 178 116 133 153 175 2023 132 153 176 204 085 099 114 132 122 141 163 188 121 140 161 186 2024 135 158 184 215 089 104 121 141 125 146 171 199 125 147 171 199 2025 139 164 193 228 092 108 128 150 129 152 179 210 130 154 181 213 2026 143 170 202 240 095 114 135 161 132 158 188 223 136 162 193 229 2027 146 176 211 253 099 120 144 172 136 163 196 235 141 169 203 244 2028 149 181 220 267 103 125 152 184 139 169 206 249 146 178 215 261 2029 153 188 230 282 107 131 160 196 144 176 216 264 152 187 229 280 2030 157 194 240 296 110 136 168 208 148 183 226 279 159 197 243 300 2031 160 201 250 312 113 141 176 220 152 190 237 295 163 205 256 318 2032 164 207 262 329 116 147 185 233 155 196 248 312 168 212 268 337 2033 168 214 273 347 119 152 194 246 159 203 259 329 173 220 280 356 2034 172 222 285 366 123 158 203 261 163 211 271 347 177 229 294 377 2035 176 229 298 385 126 164 213 276 168 218 283 367 182 237 308 399 2036 180 237 311 406 130 171 224 292 172 226 296 387 187 246 323 422 2037 185 245 325 428 134 177 235 310 176 234 310 409 193 256 338 446 2038 189 254 339 452 137 184 246 328 181 242 324 431 198 265 354 472
55
Table S-4 continued Projected fuel price indices with assumed general price inflation rates of 2 3 4 and 5 by end-use sector and fuel type
Census Region 4 (Alaska Arizona California Colorado HawaiiIdaho Montana Nevada New Mexico Oregon Utah Washington Wyoming)
Projected April 1 Fuel Price Indices (April 1 2008 = 100)
----------------------------------------------------------------COMMERCIAL-----------------------------------------------------------------
Electricity
------------------------
Distillate Oil ------------------------
Residual Oil ------------------------
Natural Gas ------------------------
Coal ------------------------
Inflation Rate
Inflation Rate Inflation Rate Inflation Rate Inflation Rate Year 2 3 4 5 2 3 4 5 2 3 4 5 2 3 4 5 2 3
4 5
2009 103 104 105 106 085 086 087 087 125 127 128 129 102 103 104 105 104 105 106
107 2010 103 105 107 109 079 080 082 083 126 129 131 134 100 102 104 106 107 109
111 113
2011 101 104 108 111 077 080 082 084 122 126 129 133 099 102 105 108 108 111 114
117 2012 101 105 109 113 076 079 083 086 102 106 110 114 099 103 107 111 108 113
117 122
2013 101 106 111 116 077 080 084 089 096 101 106 111 099 104 109 115 110 115 121
127 2014 101 107 114 120 077 082 087 092 097 103 109 115 100 106 112 119 112 119
126 133
2015 103 110 117 126 077 082 088 094 096 102 110 117 102 109 116 124 114 122 130
139 2016 104 113 122 132 076 083 089 096 095 103 111 120 104 112 121 131 115 124
134 145
2017 107 116 127 138 078 085 092 101 096 105 114 125 106 116 127 138 117 128 140
152 2018 109 120 132 145 081 089 098 108 100 110 121 133 110 121 133 146 121 134
147 162
2019 111 124 138 153 085 094 105 116 106 118 132 146 113 126 140 155 125 139 155
172 2020 113 127 142 160 089 100 112 126 114 128 144 161 114 128 144 162 128 144
162 181
2021 114 129 146 166 091 104 117 133 119 135 153 173 114 129 147 166 131 148 168
190 2022 116 133 152 174 094 108 123 141 123 141 161 184 117 134 153 175 134 153
176 201
2023 118 137 158 182 097 112 130 150 128 149 172 198 121 141 162 188 138 160 184
213 2024 121 141 165 192 100 117 137 160 134 156 183 213 127 148 173 201 142 166
194 226
2025 124 147 173 203 104 122 144 170 139 164 193 228 132 156 184 216 145 172 202
238 2026 127 152 181 215 108 129 153 182 144 172 205 243 138 165 196 233 150 178
212 252
2027 130 157 188 226 112 135 162 194 148 179 214 257 143 172 207 248 154 185 223
267 2028 134 162 197 239 116 141 171 207 153 187 226 274 149 181 220 267 158 192
233 282
2029 137 168 206 252 120 147 180 221 158 194 238 291 156 192 235 287 162 199 243
297 2030 140 174 215 265 124 154 190 234 164 203 251 310 163 202 250 308 165 205
253 312
2031 143 179 224 279 127 160 199 248 169 212 265 330 168 211 263 328 169 212 264
329 2032 146 185 233 294 131 166 209 263 175 221 279 351 173 219 276 347 173 219
276 347
2033 150 191 243 309 135 172 219 279 181 231 294 374 178 227 289 367 177 225 287
365 2034 153 197 254 325 139 179 230 295 187 241 310 398 183 236 303 389 181 233
300 385
2035 156 204 264 342 143 186 241 312 193 252 327 423 188 245 318 411 185 241 313
406 2036 160 210 275 360 147 193 253 331 200 263 345 451 193 254 333 436 189 249
326 426
2037 164 217 287 379 151 201 266 350 207 274 363 479 199 264 349 461 194 257 340
449 2038 167 224 299 399 156 209 279 371 214 286 383 510 205 274 366 488 199 266
356 474
56
Table S-4 continued Projected fuel price indices with assumed general price inflation rates of 2 3 4 and 5 by end-use sector and fuel type
Census Region 4 (Alaska Arizona California Colorado HawaiiIdaho Montana Nevada New Mexico Oregon Utah Washington Wyoming)
Projected April 1 Fuel Price Indices (April 1 2008 = 100)
----------------------------------------------------------------INDUSTRIAL-----------------------------------------------------------------
Electricity
------------------------
Distillate Oil ------------------------
Residual Oil ------------------------
Natural Gas ------------------------
Coal ------------------------
Inflation Rate
Inflation Rate Inflation Rate Inflation Rate Inflation Rate Year 2 3 4 5 2 3 4 5 2 3 4 5 2 3 4 5 2 3
4 5
2009 103 104 106 107 086 087 088 089 127 129 130 131 103 104 105 106 103 104 105
106 2010 104 106 108 110 080 082 084 085 129 132 134 137 100 102 104 106 105 107
109 111
2011 103 106 109 112 080 083 085 087 125 129 132 136 097 100 103 106 105 108 111
115 2012 102 106 111 115 079 083 086 089 105 109 113 118 096 099 103 107 106 110
114 119
2013 102 107 113 118 080 084 088 092 099 104 109 114 094 099 103 108 107 113 118
124 2014 103 109 116 123 081 086 091 096 100 106 112 119 093 099 105 111 110 116
123 130
2015 105 112 120 128 080 086 092 099 098 105 113 120 094 100 107 115 111 119 127
136 2016 107 116 125 135 080 087 094 101 098 106 114 123 095 102 110 119 112 121
131 141
2017 109 119 130 142 081 089 097 106 099 108 118 128 097 106 115 126 114 125 136
148 2018 112 123 135 149 084 093 102 113 102 113 124 137 099 109 120 132 117 129
142 156
2019 114 127 141 157 089 099 110 122 109 122 135 150 102 113 126 140 120 133 148
165 2020 116 130 146 164 094 105 118 133 117 131 148 166 102 115 129 145 123 138
155 174
2021 117 133 151 171 096 109 123 140 122 139 157 178 100 114 129 146 125 142 161
183 2022 119 137 157 179 098 113 129 148 126 145 165 189 101 116 133 152 128 147
169 193
2023 122 141 163 188 101 117 135 156 132 152 176 203 106 122 141 163 132 153 177
204 2024 125 146 170 199 104 122 142 165 137 160 187 218 111 130 151 177 136 159
186 216
2025 129 152 179 210 107 127 149 176 143 169 199 234 116 138 162 191 139 165 194
228 2026 132 157 187 222 111 133 158 188 148 177 210 250 123 146 174 207 143 170
203 241
2027 135 162 195 234 115 139 167 200 152 183 220 264 128 154 185 222 146 176 212
254 2028 138 168 204 247 119 145 175 212 158 192 232 281 134 163 198 239 150 182
221 268
2029 142 175 214 261 123 151 185 226 163 200 244 299 141 173 212 260 154 189 232
284 2030 145 180 223 275 127 158 195 241 168 208 258 318 148 184 227 281 157 195
241 298
2031 149 186 232 289 131 164 205 255 174 218 272 339 154 193 240 300 161 202 252
314 2032 152 192 242 305 135 170 215 270 180 227 287 361 159 201 254 319 164 208
262 330
2033 156 199 253 321 139 177 225 286 186 237 302 384 164 210 267 339 168 215 274
348 2034 159 205 264 338 142 184 236 303 192 248 319 409 170 219 281 360 173 222
286 367
2035 163 212 275 356 147 191 248 321 199 259 336 435 175 228 296 384 176 229 297
385 2036 167 219 287 375 151 198 260 339 206 270 354 463 181 238 312 408 180 237
311 406
2037 171 226 300 395 155 206 272 359 212 282 373 492 187 248 328 434 185 245 324
428 2038 175 234 312 416 159 214 285 380 220 294 393 524 194 259 346 462 188 252
337 450
57
Table S-5 Projected fuel price indices with assumed general price inflation rates of 2 3 4 and 5 by end-use sector and fuel type
United States Average
Projected April 1 Fuel Price Indices (April 1 2008 = 100)
--------------------------------------------------RESIDENTIAL---------------------------------------------------
Electricity
------------------------
Distillate Oil ------------------------
LPG ------------------------
Natural Gas ------------------------
Inflation Rate
Inflation Rate Inflation Rate Inflation Rate Year 2 3 4 5 2 3 4 5 2 3 4 5 2 3 4 5 2009 105 106 107 108 090 091 092 093 101 102 102 103 102 103 104 105 2010 107 109 111 113 085 087 088 090 100 102 104 106 101 103 105 107 2011 107 110 114 117 083 086 088 091 101 104 107 110 100 103 106 109 2012 108 112 117 121 081 085 088 091 102 106 110 115 101 105 109 113 2013 110 115 121 127 079 083 088 092 103 108 114 119 101 106 111 116 2014 111 118 125 132 079 084 089 094 104 111 117 124 101 107 114 120 2015 113 121 129 138 078 083 089 095 106 113 121 130 102 109 117 125 2016 115 124 134 145 077 083 090 097 108 116 126 136 104 112 121 131 2017 118 129 140 153 078 085 093 101 110 120 131 143 107 116 127 138 2018 120 133 146 161 080 088 097 107 113 124 137 150 110 121 133 146 2019 123 137 152 169 083 092 102 114 115 128 142 158 113 126 140 155 2020 125 141 158 177 085 096 107 120 117 132 148 166 115 129 145 162 2021 127 145 164 186 087 099 112 127 119 135 153 173 116 132 149 169 2022 130 149 171 195 090 103 118 135 122 139 160 182 119 137 156 179 2023 133 154 178 205 093 107 124 143 125 144 167 193 123 142 165 190 2024 136 159 185 216 096 112 131 153 128 149 174 203 127 149 174 203 2025 139 164 193 227 099 117 138 163 131 155 182 215 132 156 184 216 2026 142 169 201 239 103 123 146 174 135 160 191 227 137 163 194 231 2027 145 174 209 251 106 128 154 185 138 166 199 239 141 170 204 244 2028 148 180 218 264 110 134 162 196 142 172 209 253 146 178 216 261 2029 151 186 228 278 114 140 171 210 146 179 219 268 152 187 229 279 2030 155 192 237 293 118 146 181 223 149 185 229 283 158 195 241 298 2031 158 198 247 308 122 152 190 237 153 192 239 298 162 203 254 316 2032 162 204 258 324 125 158 199 251 157 198 250 315 167 211 265 334 2033 165 211 269 341 129 164 209 265 161 205 262 332 171 218 278 353 2034 169 218 280 359 132 170 219 281 165 213 274 351 176 226 291 373 2035 173 225 292 377 136 177 230 298 169 220 286 370 181 235 305 395 2036 176 232 304 397 140 184 241 315 174 228 299 391 186 244 320 418 2037 180 239 316 418 144 191 253 334 178 236 313 413 191 253 335 442 2038 184 247 330 439 148 199 265 353 183 245 327 436 196 263 351 467
58
Table S-5 continued Projected fuel price indices with assumed general price inflation rates of 2 3 4 and 5 by end-use sector and fuel type
United States Average
Projected April 1 Fuel Price Indices (April 1 2008 = 100)
----------------------------------------------------------------COMMERCIAL-----------------------------------------------------------------
Electricity
------------------------
Distillate Oil ------------------------
Residual Oil ------------------------
Natural Gas ------------------------
Coal ------------------------
Inflation Rate
Inflation Rate Inflation Rate Inflation Rate Inflation Rate Year 2 3 4 5 2 3 4 5 2 3 4 5 2 3 4 5 2 3
4 5
2009 104 105 106 107 092 093 094 095 104 105 106 107 103 104 105 106 104 105 106
107 2010 105 107 110 112 087 089 090 092 100 101 103 105 101 103 106 108 105 107
109 111
2011 105 108 111 114 086 089 091 094 097 100 103 106 100 103 106 109 106 109 112
115 2012 105 109 113 118 084 087 091 094 094 098 102 106 100 104 108 112 106 110
115 119
2013 105 110 115 121 082 086 090 095 092 097 101 106 100 105 110 116 107 113 118
124 2014 105 111 118 125 082 087 092 098 090 095 101 107 100 106 113 120 108 115
122 129
2015 106 114 122 130 081 087 093 099 087 093 100 107 101 108 116 124 110 117 125
134 2016 108 117 126 136 080 086 093 101 084 091 098 106 103 111 120 130 111 120
129 140
2017 111 121 132 144 081 088 096 105 085 093 101 110 106 115 126 137 112 122 133
145 2018 113 125 137 151 083 092 101 111 088 097 107 117 109 120 132 146 114 126
139 153
2019 116 129 143 159 087 097 108 120 091 101 113 125 112 125 139 155 116 129 144
159 2020 118 132 149 167 091 102 115 129 094 106 119 134 114 129 144 162 119 134
150 168
2021 119 135 153 174 093 106 120 135 098 111 126 142 116 131 149 169 121 138 156
177 2022 122 140 160 183 095 109 125 143 101 116 133 152 119 137 156 179 124 142
163 186
2023 124 144 166 192 098 114 132 152 105 122 140 162 123 143 165 190 127 147 169
196 2024 127 149 173 202 102 119 139 161 109 127 149 173 128 150 175 203 129 151
176 205
2025 130 153 181 213 105 124 146 172 113 133 157 185 133 157 185 217 132 156 184
217 2026 133 158 189 224 109 130 155 184 117 139 166 197 138 164 196 232 135 161
191 227
2027 136 163 196 236 113 136 163 196 120 144 173 207 142 171 206 247 138 166 200
240 2028 139 169 205 249 117 142 172 208 124 151 183 221 148 180 218 264 142 172
209 253
2029 143 175 215 262 121 149 182 222 129 158 194 237 154 189 232 283 145 177 217
266 2030 146 181 224 276 126 156 192 238 134 165 205 253 160 198 245 303 148 184
227 280
2031 150 187 234 292 129 162 202 252 138 173 216 269 165 206 258 321 152 190 237
295 2032 153 194 244 307 133 168 212 267 143 181 228 287 169 214 270 340 155 196
247 310
2033 157 200 255 323 137 175 223 283 148 189 241 306 174 222 283 360 159 202 258
327 2034 160 206 265 340 141 182 234 300 153 198 254 326 179 231 297 380 162 209
269 345
2035 164 213 277 358 145 189 245 318 159 206 268 347 184 240 311 403 166 216 280
362 2036 167 220 288 377 150 197 258 337 164 216 283 370 189 249 326 427 170 223
292 382
2037 171 227 301 397 154 204 270 357 170 225 298 394 195 259 342 452 174 231 305
403 2038 175 234 313 418 158 212 284 378 176 236 315 420 200 269 359 478 177 238
317 423
59
Table S-5 continued Projected fuel price indices with assumed general price inflation rates of 2 3 4 and 5 by end-use sector and fuel type
United States Average
Projected April 1 Fuel Price Indices (April 1 2008 = 100)
----------------------------------------------------------------INDUSTRIAL-----------------------------------------------------------------
Electricity
------------------------
Distillate Oil ------------------------
Residual Oil ------------------------
Natural Gas ------------------------
Coal ------------------------
Inflation Rate
Inflation Rate Inflation Rate Inflation Rate Inflation Rate Year 2 3 4 5 2 3 4 5 2 3 4 5 2 3 4 5 2 3
4 5
2009 105 106 107 108 091 092 093 094 107 108 109 110 105 106 107 108 102 103 104
105 2010 106 108 110 112 086 087 089 091 103 105 107 109 104 106 108 110 102 104
106 108
2011 105 108 111 114 087 089 092 095 100 103 106 109 101 104 107 110 103 106 109
112 2012 104 108 112 117 085 088 092 096 094 098 101 105 100 104 108 112 103 108
112 116
2013 104 109 114 120 084 088 092 097 090 095 099 104 098 103 108 114 105 110 115
121 2014 103 110 116 123 084 089 095 100 089 094 100 106 097 103 109 116 106 112
119 126
2015 104 112 120 128 084 090 096 103 086 092 099 106 097 104 111 119 107 115 123
132 2016 106 115 124 134 083 090 097 105 084 090 098 105 098 106 114 123 109 117
127 137
2017 109 119 130 141 084 092 100 109 084 092 100 109 100 109 119 130 111 121 132
144 2018 111 123 135 149 087 096 105 116 087 096 105 116 103 114 126 138 113 124
137 150
2019 114 127 141 157 091 101 113 125 090 101 112 124 107 119 132 147 115 128 142
158 2020 116 130 146 164 096 108 121 136 094 106 119 133 108 121 136 153 117 132
148 166
2021 117 133 151 171 098 111 126 142 097 110 125 142 108 123 139 158 119 136 154
174 2022 119 137 157 179 100 115 132 151 100 115 132 151 111 128 146 167 122 140
161 184
2023 122 141 163 189 103 119 138 159 104 121 139 161 115 134 155 178 125 145 168
194 2024 125 146 170 198 106 124 144 168 108 127 148 172 120 141 164 191 128 149
174 203
2025 128 151 178 209 110 129 152 179 113 133 157 184 125 147 174 204 130 154 181
213 2026 130 156 185 220 113 135 161 191 117 139 166 197 130 155 185 219 134 159
189 225
2027 133 160 193 231 117 141 170 203 120 144 173 208 134 161 194 233 136 164 197
236 2028 137 166 202 244 121 147 179 216 124 151 183 222 140 171 207 251 140 170
206 249
2029 140 172 211 258 125 154 189 230 128 157 193 236 147 180 221 270 142 175 214
262 2030 144 178 220 272 130 161 200 246 133 165 204 252 153 190 235 290 146 181
224 276
2031 147 184 230 286 134 168 210 261 138 172 215 268 159 198 248 309 149 187 233
291 2032 150 190 240 302 138 174 220 276 142 180 227 285 164 207 261 329 153 193
244 307
2033 154 196 250 317 142 181 230 293 147 188 239 304 169 216 275 349 156 199 254
322 2034 157 203 261 334 146 188 242 310 152 196 252 324 175 225 290 372 160 206
265 340
2035 161 209 272 352 150 195 254 328 158 205 266 345 180 235 305 395 164 213 277
358 2036 164 216 283 370 154 203 266 348 163 214 280 367 186 245 321 420 167 220
288 376
2037 168 223 295 389 159 211 279 368 168 224 296 391 193 256 338 446 171 227 301
397 2038 172 230 308 410 163 219 292 390 174 234 312 416 199 267 356 475 175 234
313 416
- NISTIR 85-3273-23
- ABSTRACT
- PREFACE
- ACKNOWLEDGMENTS
- CONTENTS
- LIST OF TABLES
- ABBREVIATIONS
- INTRODUCTION
- PART I TABLES FOR FEDERAL LIFE-CYCLE COST ANALYSIS
- PART II ENERGY PRICE INDICES FOR PRIVATE SECTOR LCC ANALYSIS
-
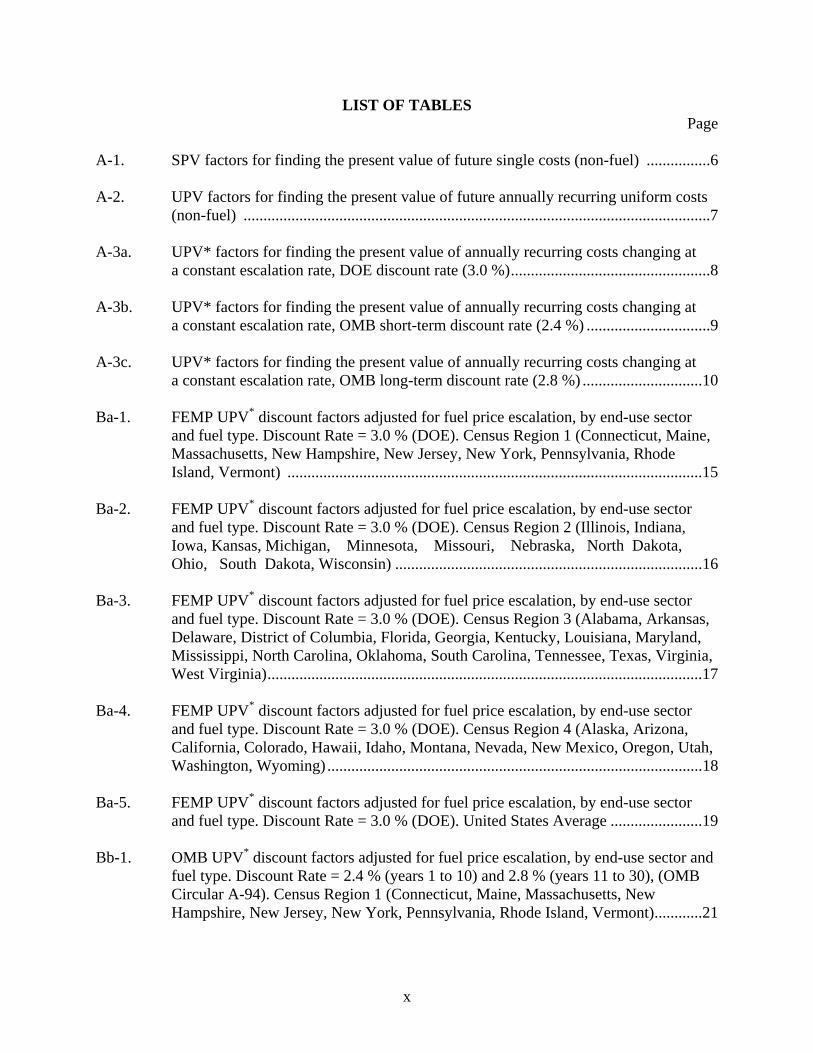