NIST Study of technology for detecting pre-ignition conditions of ...
75
NISTIR 5950 Study of Technology for Detecting Pre-Ignition Conditions of Cooking-Related Fires Associated with Electric and Gas Ranges and Cooktops, Final Report Building and Fire Research Laboratory Gaithersburg, Maryland 20899 lhited States Department of Commerce Technology Administration National Institute of Standards and Technology Products Identified -Excepted by
-
Upload
truongdiep -
Category
Documents
-
view
214 -
download
1
Transcript of NIST Study of technology for detecting pre-ignition conditions of ...

NISTIR 5950
Study of Technology for Detecting Pre-IgnitionConditions of Cooking-Related Fires Associatedwith Electric and Gas Ranges and Cooktops,Final Report
Building and Fire Research LaboratoryGaithersburg, Maryland 20899
lhited States Department of CommerceTechnology AdministrationNational Institute of Standards and Technology
Products Identified
-Excepted by

NISTIR 5950
Study of Technology for Detecting Pre-IgnitionConditions of Cooking-Related Fires Associatedwith Electric and Gas Ranges and Cooktops,Final Report
Erik L. Johnsson
January 1998Building and Fire Research LaboratoryNational Institute of Standards and TechnologyGaithersburg, MD 20899
U.S. Department of CommerceWilliam M. Daley, SecretaryTechnology AdministrationGary R Bachula, Acting Under Secretary
for TechnologyNational Institute of Standards and TechnologyRaymond G. Kammer, Director
&hcts Identified
-Excepted bvo,e. .Firms NotifleA,
Comments Proce:seJ.
. .
Prepared for:U. S. Consumer Product Safety CommissionDirectorate for Engineering SciencesDivision of Electrical EngineeringBethesda, MD 20814Contract No.: CPSC-IAG-95-1145

CPSC-IAG%1145
Executive Summary
A significant portion of residential fires stem from kitchen cooking fires. Existing firedata indicate that these kitchen cooking fires primarily are unattended and most often involve oilor grease. Previous study has determined that strong indicators of impending ignition for severalfoods cooked on range surfaces are temperatures, smoke particulates, and hydrocarbon gases. Thepurpose of this experimental investigation was to determine the feasibility of utilizing one ormore of these common characteristics of the pre-ignition environment as input to one or moresensor(s) in a pre-fire detection device. This device would detect approaching ignition and allowalarm or shutoff of the range for foods cooked on electric and gas ranges without generating falsealarms during a variety of normal, or standard, cooking activities.
The aspect of feasibility explored by the National Institute of Standards and Technologywas the physical possibility of differentiating between the characteristics of broad ranges of pre-ignition and normal environments. The ultimate goal of the overall study being conducted bythe Consumer Product Safety Commission (CPSC) is to evaluate the overall feasibility ofincorporating such a device into ranges that would react with alarm or shutdown to pre-ignitionconditions and reduce the occurrence of unwanted kitchen fires without undue disruption ofattended cooking. This evaluation of overall feasibility by the CPSC includes consideration ofthe reasonableness and magnitude of the social and economic costs and benefits in addition to thephysical feasibility of a detection system.
In order to evaluate the physical feasibility of a pre-ignition range-fire detector, asubstantial number of cooking procedures were examined. Simulations of unattended cookingleading to ignition as well as normal, or standard, cooking procedures that have the potential tomimic pre-ignition characteristics were included in the study. A total of 16 cases consisting of5 normal, 5 unattended, and 6 that progressed from normal to unattended were tested on a typicalelectric range with an inactive range hood. To determine the effects of range type and hoodstatus on sensor performance, two cases were repeated with the range hood active and three caseswere repeated on a gas range. The total number of variations was 21, and each case was repeatedonce for a total of 42 tests.
A variety of measurements was made for each test. An aspirated sample probe was usedto pump gases to carbon monoxide, carbon dioxide, andhydrocarbon analyzers. Thermocouplesprovided temperature measurements at locations near the food and in and around the range andrange hood. Hydrocarbon-gas sensors of varying sensitivities to different types of hydrocarbongases were placed on and around the range and range hood to enable evaluation of the responseof potential detector components. Household photoelectric and ionization smoke detectors wereplaced around the room to evaluate the degree of false alarm incidence using these existingtechnologies.
The following conclusions are based on measurements and observations of combinationsof specific ranges, pans, foods, and ventilation so extrapolation to other conditions should bemade with caution.
l Measurements confirm that the cooking environment near the range during unattendedcooking approaching ignition exhibits significantly higher levels of temperatures,
. . .111

CFSC-IAG95-1145
hydrocarbons, and particulates than the cooking environment produced by most normal,standard cooking procedures.Some attended, standard cooking procedures, such as blackening of fish, may produceconditions similar to those conditions approaching ignition because the proceduresthemselves are purposefully designed to use extreme temperatures.Several sensors positioned in certain locations offer high levels of differentiation whenused alone. Depending on the setting of the threshold, a majority of cooking cases wouldappropriately cause alarm or not alarm.No single sensor performed faultlessly without the use of modifications of the detectionsystem to account for special attended cooking cases, but one gas sensor on the rangehood and a thermocouple contacting the bottom of the cooking pan were most effective.Standard household photoelectric and ionization smoke detectors identify pre-ignitionconditions well, but generate a significant number of false alarms when used alone for theparticular tests conducted.A limited effort at algebraically combining three sets of two sensor signals generates morerobust differentiation, and for the best pair, pre-fire and normal conditions were clearlyseparated with the exception of one attended cooking case which would produce a falsealann rather than a failure to alarm.Results with impact on detection were insensitive to range type, range-hood status, andpan material.Based on the findings of this investigation, pre-fire detection systems for range-topcooking are physically feasible and merit further consideration.

CPSC-IAG-95-1145
Acknowledgements
This work was sponsored by the U.S. Consumer Product Safety Commission with thesupport of the U. S. Fire Administration pursuant to Interagency Agreement No. CPSC-IAG-95.1145. Although they were developed in conjunction with CPSC staff, the materials presentedhere do not necessarily represent the views of the U.S. Consumer Product Safety Commission.
The author expresses appreciation to the Association of Home Appliance Manufacturersand Underwriters Laboratories for their cooperation and assistance and to the range manufacturersfor their generous donation of ranges and helpful insights throughout the project.
The author wishes to acknowledge the hard work of Roy McLane and Marco Femandezin preparing and installing the sensors and other laboratory apparatus, Emil Braun in designingthe electronics needed for the sensors and detectors, and Michelle King and Marco Femandez inconducting the experiments. The author also expresses appreciation to Laurean DeLauter, GaryRoadarmel, and others of the NIST Building 205 crew for their help with safety.
V
. II-_-“” .“-.,A.- mm. _ --- -WI --

CF’SC-IAG95-1145
Contents
ExecutiveSummary . . . . . . . . . . . . . . . . . . . . . . . . . . . . . . . . . . . . . . . . . . . . . . . iii
Acknowledgements . . . . . . . . . . . . . . . . . . . . . . . . . . . . . . . . . . . . . . . . . . . . . . . . . v
Contents . ..-................................................... vi
List of Figures . . . . . . . . . . . . . . . . . . . . . . . . . . . . . . . . . . . . . . . . . . . . . . . . . . . viii
ListofTables . . . . . . . . . . . . . . . . . . . . . . . . . . . . . . . . . . . . . . . . . . . . . . . . . . . xi
1.0 Introduction . . . . . . . . . . . . . . . . . . . . . . . . . . . . . . . . . . . . . . . . . . . . . . . . . . 11.1 ReviewofPhaseI . . . . . . . . . . . . . . . . . . . . . . . . . . . . . . . . . . . . . . . . . 11.2 Introduction to Phase II . . . . . . . . . . . . . . . . . . . . . . . . . . . . . . . . . . . . . 2
2.0 Experimental . . . . . . . . . . . . . . . . . . . . . . . . . . . . . . . . . . . . . . . . . . . . . . . . . . 22.1 Gene&Design . . . . . . . . . . . . . . . . . . . . . . . . . . . . . . . . . . . . . . . . . . . 2
21.1 Facility Construction . . . . . . . . . . . . . . . . . . . . . . . . . . . . . . . . . 22.1.2 Kitchen Ranges and Range Hood . . . . . . . . . . . . . . . . . . . . . . . . . 32.1.3 Test Case Cooking Procedures and Parameters . . . . . . . . . . . . . . . . 4
2-2 Instrumentation . . . . . . . . . . . . . . . . . . . . . . . . . . . . . . . . . . . . . . . . . . . 92.2.1 Gas Analyzers. . . . . . . . . . . . . . . . . . . . . . . . . . . . . . . . . . . . . . 92.2.2 Thermocouples . . . . . . . . . . . . . . . . . . . . . . . . . . . . . . . . . . . . . 172.2.3 Laser-Attenuation and Scattering Apparatus . . . . . . . . . . . . . . . . . 182.2.4 Video and Photographic Equipment . . . . . . . . . . . . . . . . . . . . . . 18
2.3 Sensors and Detectors . . . . . . . . . . . . . . . . . . . . . . . . . . . . . . . . . . . . . . 182.3.1 Gas Sensors . . . . . . . . . . . . . . . . . . . . . . . . . . . . . . . . . . . . . . 192.32 SmokeDetectors . . . . . . . . . . . . . . . . . . . . . . . . . . . . . . . . . . . 22
2.4 General Procedure . . . . . . . . . . . . . . . . . . . . . . . . . . . . . . . . . . . . . . . . 222.5 Data Acquisition, Reduction, and Plotting . . . . . . . . . . . . . . . . . . . . . . . . 22
3.0 Results . . . . . . . . . . . . . . . . . . . . . . . . . . . . . . . . . . . . . . . . . . . . . . . . . . . . . 253.1 General Experimental Results . . . . . . . . . . . . . . . . . . . . . . . . . . . . . . . . 253.2 Gas Concentrations. . . . . . . . . . . . . . . . . . . . . . . . . . . . . . . . . . . . . . . . 253.3 Gas-Sensor Responses . . . . . . . . . . . . . . . . . . . . . . . . . . . . . . . . . . . . . . 273.4 Smoke-Detector Responses . . . . . . . . . . . . . . . . . . . . . . . . . . . . . . . . . . 273.5 Temperatures . . . . . . . . . . . . . . . . . . . . . . . . . . . . . . . . . . . . . . . . . . . . 27
3.5.1 Pan andFood . . . . . . . . . . . . . . . . . . . . . . . . . . . . . . . . . . . . . 423.5.2 Range andRangeHood . . . . . . . . . . . . . . . . . . . . . . . . . . . . . . 42
3.6 Laser Attenuation and Scattering . . . . . . . . . . . . . . . . . . . . . . . . . . . . . . 423.7 Recorded Images . . . . . . . . . . . . . . . . . . . . . . . . . . . . . . . . . . . . . . . . . 49
vi

CPSC-IAG%-1145
Contents cont’d.
4.0 Analysis and Discussion . . . . . . . . . . . . . . . . . . . . . . . . . . . . . . . . . . . . . . . . . . 494.1 Analysis Techniques . . . . . . . . . . . . . . . . . . . . . . . . . . . . . . . . . . . . . . . 494.2 Detection Potential of Devices . . . . . . . . . . . . . . . . . . . . . . . . . . . . . . . . 51
4.2.1 GasSensors . . . . . . . . . . . . . . . . . . . . . . . . . . . . . . . . . . . . . . 514.2.2 Thermocouples . . . . . . . . . . . . . . . . . . . . . . . . . . . . . . . . . . . . 694.2.3 Combinations of Sensors . . . . . . . . . . . . . . . . . . . . . . . . . . . . . 734.2.4 Smoke Detectors . . . . . . . . . . . . . . . . . . . . . . . . . . . . . . . . . . . . 78
4.3 Effects of Cooking-Environment Variables . . . . . . . . . . . . . . . ., . . . . . . . 854.3.1 Food and Cooking Method . . . . . . . . . . . . . . . . . . . . . . . . . . . . 854.3.2 RangeType . . . . . . . . . . . . . . . . . . . . . . . . . . . . . . . . . . . . . . 894.3.3 Range-Hood Status . . . . . . . . . . . . . . . . . . . . . . . . . . . . . . . . . 934.3.4 PanMaterial . . . . . . . . . . . . . . . . . . . . . . . . . . . . . . . . . . . . . . 98
4.4 Reproducibility . . . . . . . . . . . . . . . . . . . . . . . . . . . . . . . . . . . . . . . . . . 984.4.1 Measurement Uncertainty . . . . . . . . . . . . . . . . . . . . . . . . . . . . . 984.4.2 Consistency Between Phase I and II Results . . . . . . . . . . . . . . .4.4.3 Consistency Within Phase II Results . . . . . . . . . . . . . . . . . . . . .
5.0 Summary and Conclusions . . . . . . . . . . . . . . . . . . . . . . . . . . . . . . . . . . . . . .5.1 Summary . . . . . . . . . . . . . . . . . . . . . . . . . . . . . . . . . . . . . . . . . . . . .5.2 Conclusions . . . . . . . . . . . . . . . . . . . . . . . . . . . . . . . . . . . . . . . . . . . .5.3 Suggestions for Future Work . . . . . . . . . . . . . . . . . . . . . . . . . . . . . . . .
6.0 References . . . . . . . . . . . . . . . . . . . . . . . . . . . . . . . . . . . . . . . . . . . . . . . . .
7.0 Appendices . . . . . . . . . . . . . . . . . . . . . . . . . . . . . . . . . . . . . . . . . . . . . . . . .
Appendix A. General Test Procedure . . . . . . . . . . . . . . . . . . . . . . . . . . . . .Appendix B. Sample Test Log Sheet . . . . . . . . . . . . . . . . . . . . . . . . . . . . .Appendix C. Data Analysis - Sample ProgramControl File . . . . . . . . . . . . .
vii
101101
106106106108
109
110
111113115

CPSC-IAG%1145
List of Figures
Figure 1.Figure 2.Figure 3.
Figure 4.Figure 5.
Figure 6.
Figure 7.
Figure 8.
Figure 9.
Figure 10.
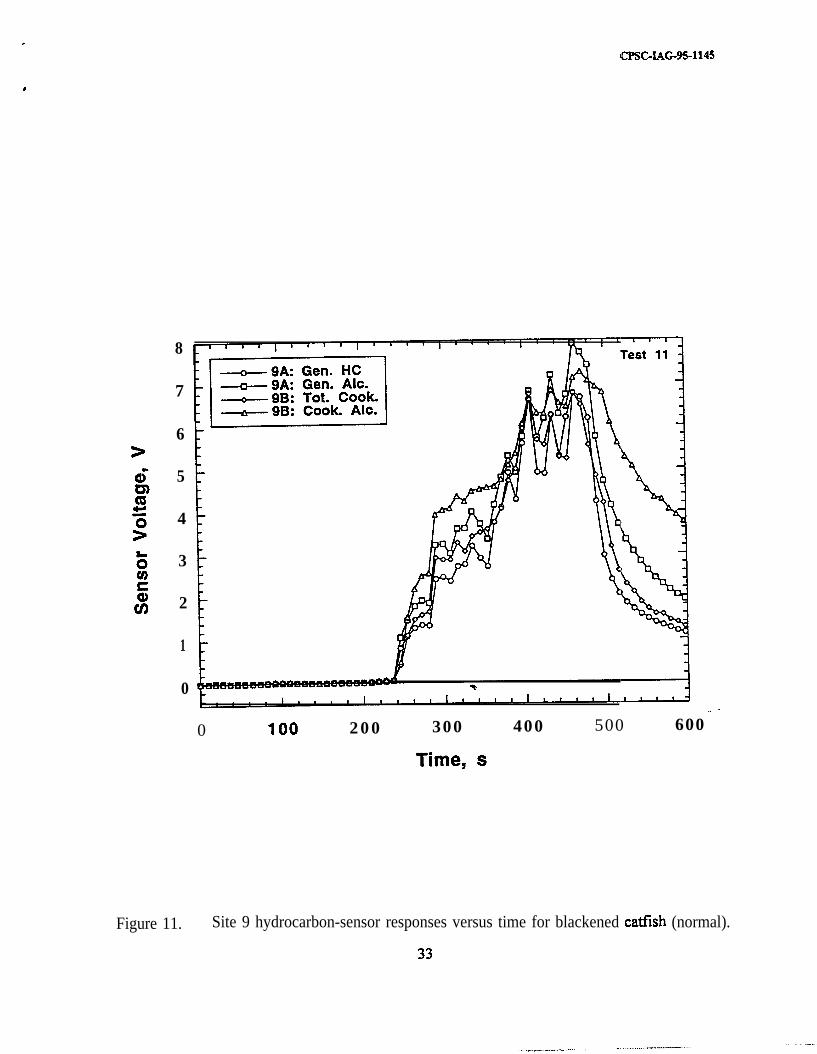
Figure 11.
Figure 12.
Figure 13.
Figure 14.
Figure 15.
Figure 16.
Figure 17.
Figure 18.Figure 19.
Figure 20.
Figure 21.
Figure 22.
Categories of tests . . . . . . . . . . . . . . . . . . . . . . . . . . . . . . . . . . . . . .Locations of near-range probes and thermocouples . . . . . . . . . . . . . . . .Schematic of near-range configuration, instruments, sensors, andthermocouples . . . . . . . . . . . . . . . . . . . . . . . . . . . . . . . . . . . . . . . . .Locations of sensors and thermocouples away from the range . . . . . . . . .CO, hydrocarbon, and CO, concentrations versus time for french-friedpotatoes in soybean oil (normal+unattended). . . . . . . . . . . . . . . . . . . .CO, hydrocarbon, and CO, concentrations versus time for blackened cadish(normal) . . . . . . . . . . . . . . . . . . . . . . . . . . . . . . . . . . . . . . . . . . . . .Site 7 hydrocarbon-sensor responses versus time for french-fried potatoesin soybean oil (normal+unattended). . . . . . . . . . . . . . . . . . . . . . . . . .Site 9 hydrocarbon-sensor responses versus time for french-fried potatoesin soybean oil (normal+unattended). . . . . . . . . . . . . . . . . . . . . . . . . .Site 11 hydrocarbon-sensor responses versus time for french-fried potatoesin soybean oil (normal+unattended). . . . . . . . . . . . . . . . . . . . . . . . . .Sites 7,9, 11 water vapor and CO-sensor responses versus time for french-fried potatoes in soybean oil (normal+unattended). . . . . . . . . . . . . . . . . .Site 9 hydrocarbon-sensor responses versus time for blackened catfish(normal ). . . . . . . . . . . . . . . . . . . . . . . . . . . . . . . . . . . . . . . . . . . . . .Site 9 hydrocarbon-sensor responses versus time for chicken in soybti oil(unattended). . . . . . . . . . . . . . . . . . . . . . . . . . . . . . . . . . . . . . . . . . .All photoelectric detector alarm signals versus time for ,french-friedpotatoes in soybean oil (normal+unattended). . . . . . . . . . . . . . . . . . . .All ionization detector alarm signals versus time for french-fried potatoesin soybean oil (normal+unattended). . . . . . . . . . . . . . . . . . . . . . . . . .All photoelectric detector alarm signals versus time for broiled steak(n0rma.I ). . . . . . . . . . . . . . . . . . . . . . . . . . . . . . . . . . . . . . . . . . . . . .All ionization detector alarm signals versus time for broiled steak(normal). . . . . . . . . . . . . . . . . . . . *)’ . . . . . . . . . . . . . . . . . . . . . . . .Temperatures near the pan versus time for french-fried potatoes in soybeanoil (normal+unattended). . . . . . . . . . . . . . . . . . . . . . . . . . . . . . . . . .Temperatures near the pan versus time for blackened catfish (normal). . . .Temperatures near the pan versus time for chicken in soybean oil(unattended). . . . . . . . . . . . . . . . . . . . . . . . . . . . . . . . . . . . . . . . . . .Temperatures of the range versus time for French-fried potatoes in soybeanoil (normal+unattended). . . . . . . . . . . . . . . . . . . . . . . . . . . . . . . . . .Temperatures above the range versus time for french-f&d potatoes insoybean oil (normal+unattended). . . . . . . . . . . . . . . . . . . . . . . . . . . .Temperatures of the range versus time for water and oil (normal+unattended ). . . . . . . . . . . . . . . . . . . . . . . . . . . . . . . . . . . . . . . . . . . .
1213
1516
26
28
29
30
31
32
33
34
35
36
37
38
3940
41
43
44
45
. . .Vlll
- _- .---- .1- --

CPSC-IAG%-1145
List of Figures cont’d.
Figure 23.
Figure 24.
Figure 25.Figure 26.
Figure 27.
Figure 28.
Figure 29.
Figure 30.
Figure 31.
Figure 32.
Figure 33.
Figure 34.
Figure 35.
Figure 36.
Figure 37.
Figure 38.
Figure 39
Figure 40.
Figure 41.
Figure 42.
Temperatures above the range versus time for water and oil (normal-,unattended). . . . . . . . . . . . . . . . . . . . . . . . . . . . . . . . . . . . . . . . . . . .Laser attenuation versus time for french-fried potatoes in soybean oil(normal+unattended). . . . . . . . . . . . . . . . . . . . . . . . . . . . . . . . . . . . .Laser attenuation versus time for water and oil (normal+unattended). . . .Pan-bottom temperature versus time for cooling-lag test of 500 mL oil onthe type-A electric range. . . . . . . . . . . . . . . . . . . . . . . . . . . . . . . . . . .Site 6 total-cooking-gas sensor maximum normal and minimum ignitionoutput 30 s before ignition versus test number. Data for the gas-range tests(35-38) are from the site 4 total-cooking-gas sensor. . . . . . . . . . . . . . . .Site 9 carbon monoxide sensor maximum normal and minimum ignitionoutput 30 s before ignition versus test number. . . . . . . . .‘. . . . . . . . . . .Site 10 total-cooking-gas sensor maximum normal and minimum ignitionoutput 30 s before ignition versus test number. Data for the gas-range tests(35-38) are from the site 8 total-cooking-gas sensor. . . . . . . . . . . . . . . .Site 7 general-alcohol sensor maximum normal and minimum ignitionoutput 30 s before ignition versus test number. . . . . . . . . . . . . . . . . . . .Site 7 cooking-alcohol sensor maximum normal and minimum ignitionoutput 30 s before ignition versus test number. . . . . . . . . . . . . . . . . . . .Site 9 general-hydrocarbon sensor maximum normal and minimum ignitionoutput 30 s before ignition versus test number. . . . . . . . . . . . . . . . . . . .Site 9 general-alcohol sensor maximum normal and minimum ignitionoutput 30 s before ignition versus test number. . . . . . . . . . . . . . . . . . . .Site 9 total-cooking-gas sensor maximum normal and minimum ignitionoutput 30 s before ignition versus test number. . . . . . . . . . . . . . . . . . . .Site 9 cooking-alcohol sensor maximum normal and minimum ignitionoutput 30 s before ignition versus test number. . . . . . . . . . . . . . . . . . . .Site 11 general-hydrocarbon sensor maximum normal and minimumignition output 30 s before ignition verse test number. . . . . . . . . . . . . .Site 11 general-alcohol sensor maximum normal and minimum ignitionoutput 30 s before ignition versus test number. . . . . . . . . . . . . . . . . . . .Site 11 total-cooking-gas sensor maximum normal and minimum ignitionoutput 30 s before ignition versus test number. . . . . . . . . . . . . . . . . . . .Site 11 cooking-alcohol sensor maximum normal and minimum ignitionoutput 30 s before ignition versus test number. . . . . . . . . _ . . . . . . . . . .Site 19 thermocouple temperature maximum-normal and minimum ignitionoutput 30 s before ignition versus test number. . . . . . . . . . . . . . . . . . . .Focus-burner pan-bottom temperature maximum normal and minimumignition output 30 s before ignition versus test number. . . . . . . . . . . . . .Focus-burner pan-bottom temperature maximum normal and minimumignition output 60 s before ignition versus test number. . . . . . . . . . . . . .
46
4748
50
52
53
55
59
60
61
62
63
64
65
66
67
68
70
71
72

CPSC-IAG%1145
List of Figures cont’d.
Figure 58.
Figure 59.
Le.-- Figure 60.
Figure 61.
Figure 62.
Figure 63.
Figure 64.
Figure 65.
Figure 66.
Figure 67.
Figure 68.
Table 1.Table 2.Table 3.Table 4.Table 5.Table 6.Table 7.Table 8.
Site 9 general-alcohol sensor response versus time before ignition for waterand oil (normal+unattended) for the electric (A) range with the hood ona n d o f f . . . . . . . . . . . . . . . . . . . . . . . . . . . . . . . . . . . . . . . . . . . . . . .Site 9 general-alcohol sensor response versus time for broiled steak(normal) for the electric (A) range with the hood on and off. . . . . . . . . .Site 9 general-alcohol sensor response versus time before ignition forchicken (normal+unattended) for the electric (A) range with the hood onandoff...............................................Site 9 general-alcohol sensor responses versus test number for water andoil (normal+unattended), broiled steak (normal), and chicken in oil(normal+unattended) for the electric (A) range with the hood on andoff..................................................Food temperature versus time before ignition for soybean oil (unattended)on the electric (A) ranges in aluminum and stainless-steel pans. . . . . . . .Site 9 general-alcohol sensor response versus time before ignition forsoybean oil (unattended) on the electric (A) ranges in aluminum andstainless-steel pans. . . . . . . . . . . . . . . . . . . . . . . . . . . . . . . . . . . . . .Food temperature versus time before ignition for soybean oil (unattended)ontheelectric(A)rangeforPhaseIandPhaseU. . . . . . . . . . . . . . . .Laser attenuation versus time before ignition for soybean oil (unattended)ontheelectric(A)rangeforPhaseIandPhaseII. . . . . . . . . . . . . . . .Site 9 general-alcohol sensor maximum normal and minimum ignitionoutput 30 s before ignition versus cooking case number for tests using theelectric (A) range and inactive hood. . . . . . . . . . . . . . . . . . . . . . . . . .Pan-bottom temperature maximum normal and minimum ignition output30 s before ignition versus cooking case number for tests using the electric(A) range and inactive hood. . . . . . . . . . . . . . . . . . . . . . . . . . . . . . . .Heating time to ignition versus cooking case number for tests using electric(A) range and inactive hood. . . . . . . . ? . . . . . . . . . . . . . . . . . . . . . .
List of Tables
Case description and procedure list . . . . . . . . . . . . . . . . . . . . . . . . . . .Experimental test matrix . . . . . . . . . . . . . . . . . . . . . . . . . . . . . . . . . .Instrumentation list . . . . . . . . . . . . . . . . . . . . . . . . . . . . . . . . . . . . . .List of sensors . . . . . . . . . . . . . . . . . . . . . . . . . . . . . . . . . . . . . . . . .Identification key for sensors and detectors . . . . . . . . . . . . . . . . . . . . .Sensor and detector location descriptions . . . . . . . . . . . . . . . . . . . . . . .Selected sensors’ false-alarm and alarm-failure performance for 42 tests . .Smoke detectors’ false alarm and alarm failure performance for 42 tests . .
94
95
96
97
99
100
102
103
104
105
107
510142021235684

CPSC-L&G%1145
Figure 43.
Figure 44.
Figure 45.
Figure 46.
Figure 47.
Figure 48.
Figure 49.
Figure 50.
Figure 51.
Figure 52.
Figure 53.
Figure 54.
Figure 55.
Figure 56.
Figure 57.
List of Figures cont’d.
Focus-burner pan-bottom temperature multiplied by site 7 general-alcoholsensor voltage maximum norma and minimum ignition output 30 s beforeignition versus test number. # signifies results from substitutethermocouple data. . . . . . . . . . . . . . . . . . . . . . . . . . . . . . . . . . . . . . .Focus-burner pan-bottom temperature multiplied by site 7 cooking-alcoholsensor voltage maximum normal and minimum ignition output 30 s beforeignition versus test number. # signifies results from substitutethermocouple data. . . . . . . . . . . . . . . . . . . . . . . . . . . . . . . . . . . . . . .Focus-burner pan-bottom temperature multiplied by site 9 cooking-alcoholsensor voltage maximum normal and minimum ignition output 30 s beforeignition versus test number. # signifies results from substitutethermocouple data. . . . . _ . . . . . . . . . . . . . . . . . . . . . . . . . . . . . . . . .Focus-burner pan-bottom temperature multiplied by site 9 cooking-alcoholsensor voltage maximum normal and minimum ignition output 60 s beforeignition versus test number. # signifies results from substitutethermocouple data. . . . . . . . . . . . . . . . . . . . . . . . . . . . . . . . . . . . . . .Average photoelectric smoke-detector alarm time for all tests versus sitenumber. . . . . . . . . . . . . . . . . . . . . . . . . . . . . . . . . . . . . . . . . . . . . .Sites 5-l 3 photoelectric smoke detectors ratio of alarm times to normaltimes for all tests versus test number. . . . . . . . . . . . . . . . . . . . . . . . . .Sites 5-13 photoelectric smoke detectors ratio of alarm times to ignitiontimes for all tests versus test number. . . . . . . . . . . . . . . . . . . . . . . . . .Sites 14-17 photoelectric smoke detectors ratio of alarm times to normaltimes for all tests versus test number. . . . . . . . . . . . . . . . . . . . . . . . . .Sites 14-17 photoelectric smoke detectors ratio of alarm times to ignitiontimes for all tests versus test number. . . . . . . . . . . . . . _ . . . . . _ . . . . .Average ionization smoke-detector alarm time for. all tests versus sitenumber. . . . . . . . . . . . . . . . . . . . . . . . . . . . . . . . . . . . . . . ..-....Sites 14-17 ionization smoke detectors qtio of alarm times to normal timesfor all tests versus test number. . . . . . . . . . . . . . . . . . . . . . . . . . . . . .Sites 14-17 ionization smoke detectors ratio of alarm times to ignitiontimes for all tests versus test number. . . . . . . . . . . . . . . . . . . . . . . . . .Pan-bottom temperature versus time before ignition for chicken in oil(normal+unattended) for the electric (A) and gas (B) ranges. . . . . . . . . .Site 9 general-alcohol sensor response versus time before ignition forchicken in oil (normal+unattended) for the electric (A) and gas (B)ranges. . . . . . . . . . . . . . . . .* . . . . . . . . . . . . . .* . . . . . . . . . . . . .*Laser attenuation versus time before ignition for chicken in oil (normal+u.nattended)fortheelectric(A)andgas(B)ranges.. . . . . . . . . . . . . . . .
74
75
76
77
79
80
81
82
83
86
87
88
90
91
92
X

CPSC-IAG%1145
1.0 Introduction
Nearly 3,700 deaths, about 19,000 injuries, and over $4 billion in property damage werecaused in 1995 in the United States by over 400,000 residential fires [l]. In recent analyses ofdata collected through the National Fire Incident Reporting System, NFIRS, the National FireProtection Association has estimated that range/oven appliance fires, a majority of which involvefood, average about 20% of all residential fires and are responsible for approximately 20% of theinjuries, 5% of the deaths, and 5% of the property loss associated with residential fires [2]. Untilrecently, there was little research directed toward increasing understanding off the pre-ignitionconditions of food fires that might be monitored to indicate an incipient ftre or of the devices thatmight be used to detect and act upon such conditions. The objective of this project is to identifypre-ignition conditions and the methods and devices that can be used to detect such conditionsand alert, or intervene, to reduce the risk of food fires associated with electric and gas ranges andcooktops and thereby reduce the number of cooking-related fires in homes. The ultimate goalof the overall study being conducted by the Consumer Product Safety Commission (CPSC) is toevaluate the overall feasibility, including cost and benefit, of incorporating such devices intoranges.
1.1 Review of Phase I
The objective was addressed through two major activities in Phase I. The details areprovided in the Phase I report [3]. In order to identify the pre-ignition conditions, experimentswere performed to monitor specific aspects of the environment and how they changed as ignitionconditions were approached. Various foods were heated at high settings using electric and gasranges with the range hood on for half of the tests. Temperatures of the surroundings close tothe pan, plume velocity, and laser-attenuation measurements were recorded. A Fourier transforminfrared, m spectrometer was used to determine if the production of any specific gas specieswas significant. Analysis of the experimental results determined that strong indicators ofapproaching ignition were high temperatures close to the pan, smoke particulate levels, andhydrocarbon gases. Monitoring one or more of these conditions was deemed promising forsuccessful detection of approaching food ignition. Addftional results of the Phase I work werethat each of the particular electric and gas ranges tested produced similar ignition signatures forthe same foods, but required different heating periods to achieve them, and that the particular -range hood used did not have a significant effect on ignition conditions. The Phase I testingfocused on three foods: soybean oil, bacon, and table sugar.
The second Phase I activity was the identification of methods, materials, and devices withpotential for detecting and responding to pre-ignition conditions. This was accomplished witha literature and patent search which focused on sensing devices and technologies capable ofdetecting cooking-related conditions as well as control technologies capable of shutting off gasand electric ranges in the event of a detected threat. The bibliographical information ontechnologies related to these goals was provided with comments regarding their potentialusefulness in a kitchen range pre-ignition detection system. The most promising, technologies formonitoring the conditions of interest included tin-oxide sensors for hydrocarbon gases and carbon
1

CRXXAG%1145 .
monoxide, scattering- and attenuation-type photoelectric smoke detectors, and thermocouplethermometry. The search also revealed that logical processing of two or more detected signalshas been used in other applications and could be utilized for food pre-ignition detection to limitfalse alarms. Finally, it was determined that control technologies exist that could be used uponthe detection of pre-fire conditions for the shutdown and restart of gas and electric ranges.
1.2 Introduction to Phase II
Phase I demonstrated that common signatures of approaching ignition exist for the threefoods cooked on electric and gas ranges. Phase II was designed to obtain additional data oncooking cases and practical sensors. The objective of Phase II was to determine whether thereis potential for devices, alone or in conjunction with others, to detect approaching ignition andallow alarm or shutoff of the range for foods cooked on electric and gas ranges withoutgenerating undue false alarms during a variety of normal and usually safe cooking activities. Theterm “normal” will be used in this report to describe accepted, standard cooking proceduresderived Corn recipes or range/oven operation manuals. “Normal” will also indicate that theprocedure is attended or monitored. The tern “false alarm” will generally be used to describea situation in which a sensor output surpasses an established ahum threshold when normalcooking is occurring rather than unattended cooking, which is heating maintained at a high levelbeyond standard practice. Additional clarification of these terms will be used as specificsituations are described.
The experiments were designed to (1) establish whether or not a set of normal cookingpractices and a set of pre-ignition situations generate sufficiently diierent signatures todiscriminate between these conditions, and (2) test a few readily available detection devices withthe ability to respond to the signatures identified by (1). The experiments addressed a broad, yetfmite, range of common cooking configurations to determine whether there is potential to detectimpending food fires. The nature and extent of practical difficulties that might limit theapplication of certain devices were also assessed.
2.0 Experimental
2.1 General Design
The purpose of these tests was described in the Phase II introduction. In order toaccomplish the purpose, a kitchen facility was necessary which included sources of electricalpower and natural gas, ranges, range hood, and some means of air flow control. It was alsonecessary to develop a set of cooking cases and procedures that would reflect a broad range ofenvironments for which the performance of the various sensors could be examined. This sectionaddresses the design of these experimental elements.
2.1.1 Facility Construction
A small, stand-alone laboratory was built for the Phase I testing and was used again for
2

CPSC-LAG%1145
Phase II. It was located in Building 205, the Large-Fire Facility, at the National Institute ofStandards and Technology (NIST). The interior dimensions of the room were: 3.66 m (12 ft)width, 2.44 m (8 fi) depth, and 2.44 m (8 fi) height. Details of the room’s constructionincluding a drawing are contained in the Phase I report [3]. The same cabinets were retained toreproduce a kitchen environment. Additional access holes were made in the room walls forexternal supplies of electrical power and natural gas as well as a large amount of sensor wiring.A range hood (described in Section 2.1.2) was installed above the range. The same range-hoodductwork and room exhaust hood and ductwork were used as described for Phase 1 [3].
Electrical power and natural gas were provided in a similar manner as before [3]. Thesame 220 V house circuit, boosted to 240 V. was used. Additional 120 V electrical cords wereadded to accommodate the several power supplies needed for sensors, detectors, and heatingtapes. A higher capacity rotameter was used on two tests due to a much higher natural-gasdemand. The flow was monitored either with the 4.7 L/min (10 SCFH) rotameter used for PhaseI or the higher capacity 23.6 L/min (50 SCFH) rotameter. The gas delivery pressure wasmaintained at 1.7 kPa (7.0 in of water).
2.1.2 Kitchen Ranges and Range Hood
Four different ranges were used in these tests: A - electric with open-coil sheathed heatingelements; B - high-outpuf sealed-burner gas; C - electric smoothtop; and D - down-draft electricslide-in with a grilling attachment. The majority (34) of the tests were conducted on range Afour tests utilized range B, and two tests each were performed on ranges C and D. Each rangewas 76 cm (30 in) wide. The electric range with open-coil elements had two 15 cm (6 in) andtwo 20 cm (8 in) burners. The 15 cm and 20 cm burner elements were rated at 1.33 kW and2.35 kW, respectively, for 240 V electricity. The front set of burners on each range was usedfor the pan of focus as in Phase I in order to allow comparison with the previous measurements.The larger, highereutput burner was always used for the pan of focus to maximize the foodheating rate and minimize the time to ignition. The gas range had two 2.6 kW (9000 BTU/h)burners and two 3.5 kW (12000 BTU/h) burners. The gas range’s large burner was on the leftin contrast to the right for the electric range. The smoothtop electric range, including the ovenand burners, was rated for 11.4 kW at 120/240 V. It waS used only for the oven’s self-cleaningcapability. The down-d& range was used for its grilling and down-draft features, and it wasrated for 14.1 kW at 120/240 with a fan capacity of 236 L/s (500 c&n). The grilling attachmentwas located on the right side of the range.
The range hood was a 76 cm (30 in) wide model made of stainless steel, and it had a170 L/s (360 din) flow capacity. This unit’s cost and flow capacity were above average for therange hoods on the market, yet such models were generally available. The hood openingextended 45 cm (18 in) out from the wall and tapered from about 75 cm (29.5 in) wide at thewall to 63 cm (25 in) at the front over the frontmost 24 cm (9 in). It was not in use for mostexperiments, but was engaged at maximum flow for several experiments in order to determineits effect on the results.
3

CFSC-IAG%-1145
2.1.3 Test Case Cooking Procedures and Parameters
The purpose of this set of experiments was to characterize the environment precedingignition during simulated unattended cooking and the potential for false-alarm generation duringperiods of normal cooking. In order to maximize the data available from each test, some testscombined an initial period of normal cooking followed by a period of simulated unattendedcooking on high heat. Some normal cooking tests which were not extended to unattendedsituations were chosen because they ordinarily utilize high heat and/or produce visible andsometimes accumulating smoke. Other tests were similar to the Phase I tests in that theysimulated the unattended, high-heating situation from the beginning.
Three parameters were varied in order to establish their effects on the pre-ignition andnormal cooking signatures: (1) food type, (2) range type, and (3) hood operation. A widervariety of foods was tested than in Phase I. Industry input was sought to develop a representativeset of cooking cases. Although there are nearly an infinite number of cooking situations, sixteendifferent cases were studied to encompass a sufEciently broad range of cooking activities toensure that any evidence for a detection window between normal and dangerous conditions wasbroadly applicable. Gas and electric ranges were of interest because of potential differences inthermal and chemical environments due to the ranges themselves, regardless of the food beingcooked, as well as the different temperature-time histories for the same cooking operation. Therange-hood status was of interest primarily because a forced air flow has the potential to eitherenhance the signals generated during normal cooking or weaken those generated duringapproaching ignition. Any detection system must not be confused by the use or non-use of arange hood. A range hood with 70% greater flow capacity than that used in Phase I was installedin order to answer questions about the effect of a hood having a flow capacity closer to themaximum generally available on the market.
Table 1 describes the sixteen cooking cases tested in Phase II. All single-pan cases useda large, front burner. For all multi-pan cases, the combustible-food pan was located on the large,front burner. This baseline set of tests used the A-type electric range (except for cases 6 and 15as is explained later). The range hood was inactive to allow for worst-case build-up of cookingproducts. Cases 1 and 3 are unattended and were selected to establish pre-ignition conditionsusing the Phase II instrumentation set for the same wes tested in Phase I. Cases 4, 5, 7-9, 11,and 13 were selected to represent normal cooking activities. Cases 7-g,, 11 and 13 involveunattended cooking following a period of normal cooking procedures. These cases are designated“normal+unattended” and were designed to provide both normal and pre-ignition data. Casesl-3, 10, 12, and 14 simulate unattended cooking for the entire duration of the tests. Allunattended cases, whether following normal cooking or not, utilize the highest burner setting evenif the normal procedure does not prescribe heating on high. This was done to achieve the fastestignition possible which was deemed the most dangerous situation. Case 61 employs the C-typesmoothtop range with the self-cleaning oven feature. Two additional normal cooking cases, 15and 16, were added based on suggestions from the range industry. Case 15 uses the D-typedown-draft grilling range, and case 16 uses the A-type electric range. Cases 1 and 2 weredesigned to assess effects of differences in cookware material. The number of tests designed toexamine cooking behaviors using electric ranges with the range hood off totalled 32 (16 cases,
l
4

. .
CPSC-IAG-95-1145
Table 1. Case description and procedure list.
Cooking Cases Descriptions General Procedures
1. Soybean oil (A) 500 mL oil in a 26 cm (10 in) diameter Heat on high until ignition.(unattended) stainless-steel (aluminum bottom)
frying pan.
2. Soybean oil (B) 500 mL oil in a 26 cm (10 in) diameter Heat on high until ignition.(unattended) heavy gauge aluminum frying pan.
3. Bacon (unattended) 227 g (8 oz) bacon in a 26 cm (10 in) Thaw bacon, Heat on high until ignition.diameter stainless-steel (aluminumbottom) frying pan.
4, Water - multiple pans 4 pans: 2.5 L water in 3.8 L (4 qt) Heat 1 pan of water on high with pan covered, but(normal) stainless-steel (aluminum bottom) sauce allowing for pressure release. After water is rapidly
pans. boiling, remove cover from pan. Heat the remaining 34 pans and remove the covers one at a time every 20 min
after they have reached boiling. Then maintain the boilinganother 20 min after all of the covers are removed.
5. Broiled steak(normal)
454 g (1 lb) T-bone steak and 15 mL Thaw meat, preheat broiler for 4 min. Slash meat every(1 tbsp) soybean oil in broiling pan. 5 cm (2 in). Place broiler such that meat is approximately
8 cm (3.1 in) from the heating element. Broil for 10 minwith the door closed. Turn meat and broil for 10 min
I more with the door partly open.
6. Self-cleaning oven 227 g (8 oz) of raw beef suet. Divide suet in many (approx. 25) small pieces andoperation with debris distribute evenly in broiler pan. Activate the self-cleaning(normal) oven cycle.
5

CPSC-lAG-954145
8. Macaroni and cheese 206 g (7.25 oz) macaroni in 1.42 L Boil water rapidly on high heat. Add macaroni and stir.(normaljunattended) (6 cps) water in 2.8 L (3 qt) medium Boil 9 min. Drain and mix in margarine, milk, and
gauge aluminum sauce pan. Additions: cheese. Place back on burner on high heat.59 mL (4 tbsp) margarine, 59 mL(0.25 cp) skim milk, cheese saucepacket.
9. Soybean oil and 1 pan: 500 mL oil in a 26 cm (10 in) Heat oven to 204 OC (400 OF), and heat water on high onwater diameter stainless-steel (aluminum three burners. After 9 min, heat oil on high on one burner(normal-+unattended) bottom) frying pan. for 5 min. Decrease heat under oil to medium-low. After
3 pans: 2.5 L,water in a 3.8 L (4 qt) 18 min, increase heat under oil to high until ignition.stainless-steel (aluminum bottom) saucepot.
10. Soybean oil - 4 pans: 500 mL oil in a 26 cm (10 in) Heat oven to 204 OC (400 OF), and heat oil on high on allmultiple pans diameter stainless-steel (aluminum burners for 5 min. Decrease heat on all four burners to(normal-+unattended) bottom) frying pan. medium-low. After 15 min, change one burner’s heat
setting to high until ignition.
6

. .
CPSC-IAG-95.1145
Cooking Cases Descriptions General Procedures
11. Chicken in soybean Approximately 750 g (1.65 lb) of Heat oil to 190 OC (374 OF) on high. Introduce chicken tooil chicken (3 whole legs) in 500 mL oil. Reduce heat to medium and turn chicken every 4 min(normal+unattended) soybean oil in a 26 cm (10 in) diameter for 20 min. Increase heat to high until ignition.
stainless-steel (aluminum bottom)frying pan.
12. Chicken in soybean Approximately 750 g (1.65 lb) of Heat oil to 190 OC (374 OF) on high. Introduce chicken tooil chicken (3 whole legs) in 500 mL oil. Maintain high heat until ignition.(unattended) soybean oil in a 26 cm (10 in) diameter
stainless-steel (aluminum bottom)frying pan.
13, Stir-fry vegetables in 283 g (10 oz) stir-fry vegetable mix Heat oil to 280 OC (536 OF) on high. Introducesoybean oil and 50 mL (3.4 tbsp) soybean oil in a vegetables. Stir vegetables constantly at medium-high heat(normal junattended) 3 6 cm (14 in) diameter stainless-steel for 5 min. Increase heat to high until ignition.
wok with burner ring.
14, Stir-fry vegetables in 283 g (10 oz) itir-fry vegetable mix Heat oil to 280 OC (536 OF) on high. Introducesoybean oil and 50 mL (3.4 tbsp) soybean oil in a vegetables. Stir vegetables for 15 s to coat with oil.(unattended) 36 cm (14 in) diameter stainless-steel Maintain heat on high until ignition.
wok with burner ring.
15. Grilled steak(normal)
Grill 454 g (1 lb) T-bone steak on Thaw meat, and preheat grill for 5 min. Slash meat everygrilling attachment of down-draft range. two inches. Place meat on grill. Grill for 5 min, turn
meat and grill for 5 min. Repeat.
7

CP$C!-IAG-95-1145
II Cooking Cases Descriptions General Procedures
16. Blackened catfish(normal)
Approximately 227 g (8 oz) catfishfillet and 50 mL (3.4 tbsp) meltedbutter in a 26 cm (10 in) diameterstainless-steel (aluminum bottom) l
frying pan.
Heat butter to 100 OC (212 OF). Pre-heat pan on high for3 min. Put melted butter in pan. Place fillet in pan,Sprinkle blackening seasonings on the exposed side. Heatfor 2 min, turn and season, heat for 2 min, and removefrom heat.

cF%c-LAG-95-1145
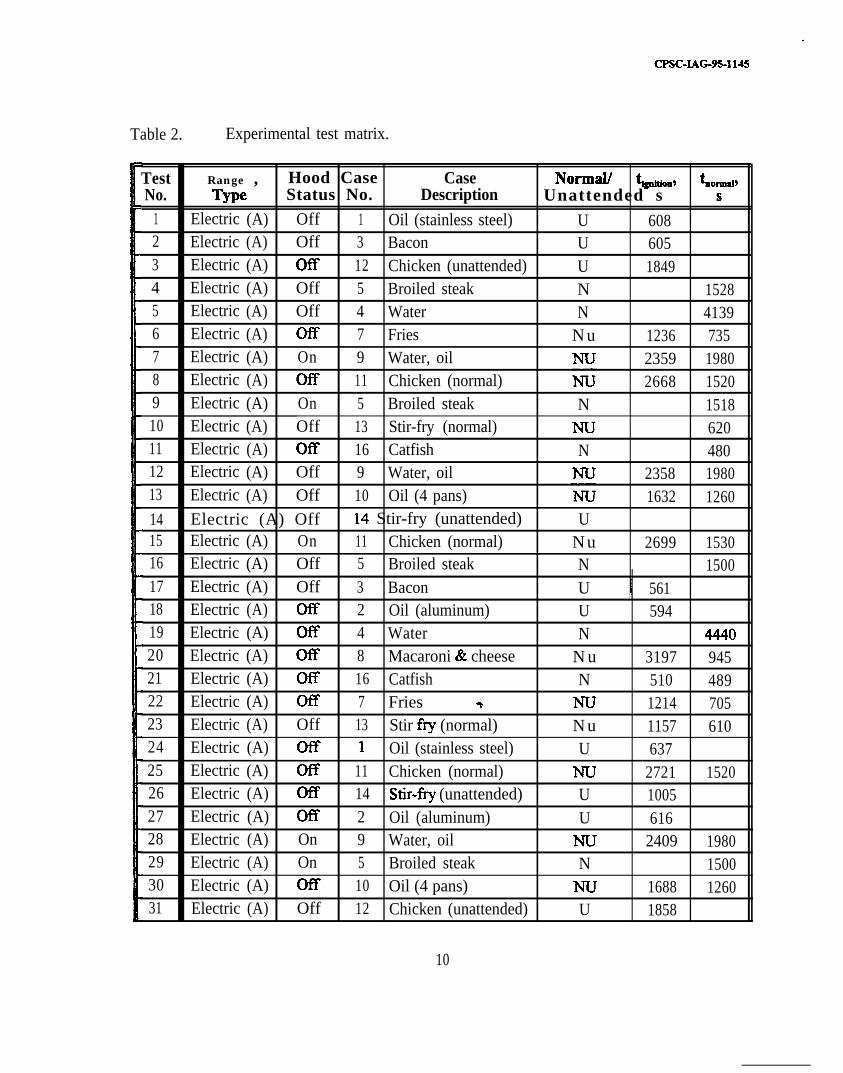
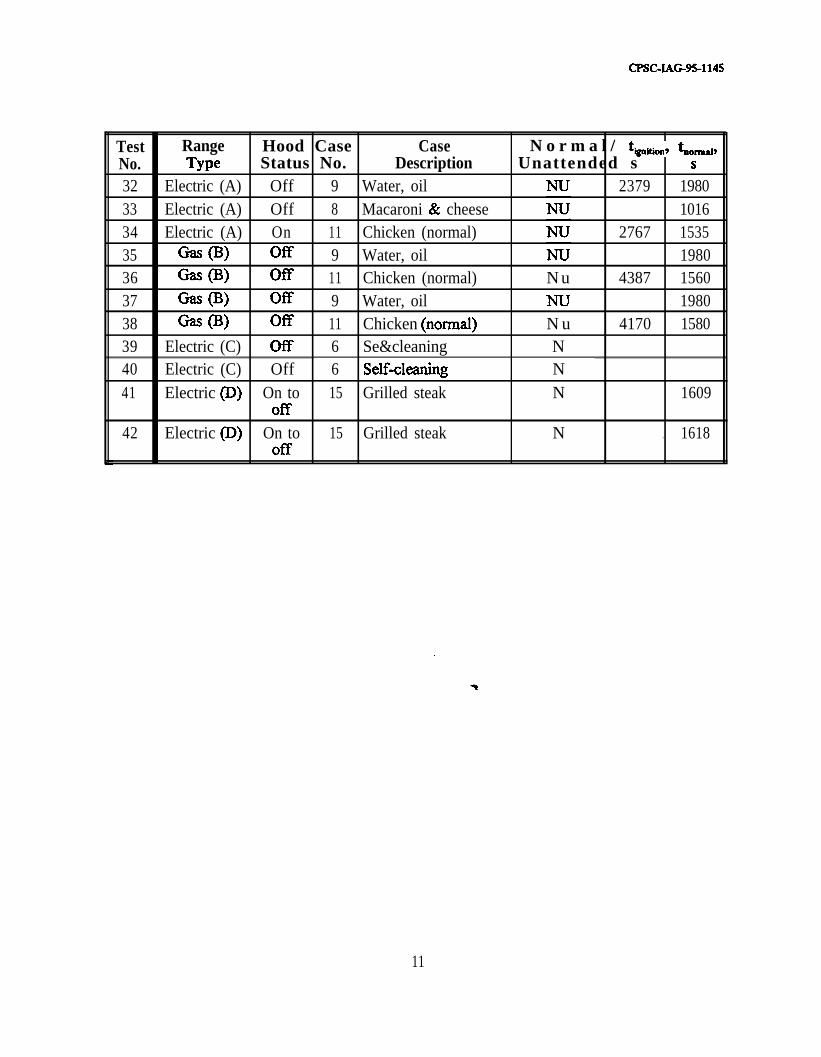
2 tests/case). The initial tests and their repeats were randomized within each range type tominimize systematic errors. Table 2 lists the tests in the order they were conducted. The timeslisted in Table 2 are discussed in Section 4.1.
Cases 5, 9, and 11 were repeated (an additional two tests each) with the range hood onto evaluate the effects of the range hood’s air flow on the measurements. The high-flow-capacityrange hood was used with its highest setting for each of these tests. Air flow velocities in thehood were measured with a bidirectional probe [4,51. Phase I test results were insensitive to theflow induced by a moderate-flow-capacity range hood (31. Cases 9 and 11 were repeated (anadditional two tests each) on the B-type gas range with the range hood inactive to characterizethe effects of range type on the measurements. The additional tests to examine these variablestotalled 10 (5 cases and 2 tests/case). Figure 1 shows the categories of tests that were conducted.
One additional test was not fully instrumented and therefore is not included in the caselist. It characterized the residual heating effect of a deenergized electric burner. A stainless-steel/aluminum-bottom frying pan, like those used for the cooking tests with 500 mL of soybeanoil, was placed on the large burner on range A with thermocouples monitoring burner, pan, andfood temperatures. At 30 s to 60 s before previously experienced ignition times, the burner wasdeenergized, and data were obtained regarding thermal inertia and time to temperature decrease.This information about time to temperature decrease was used to ascertain the minimum periodpreceding ignition required to shut down the range in order to prevent reaching ignitionconditions. In other words, this established the latest shutdown time for this test after whichignition would not occur. Only one test was conducted so the results only provide a roughestimate of this time. Additional testing by the CPSC was planned to provide more data on thisissue.
2.2 Instrumentation
A variety of instruments was used to characterize the pre-ignition cooking environment.Measurements focused on those aspects showing the most potential from Phase I. Table 3describes the instrumentation used in the discrimination test series.
2.2.1 Gas Analyzers
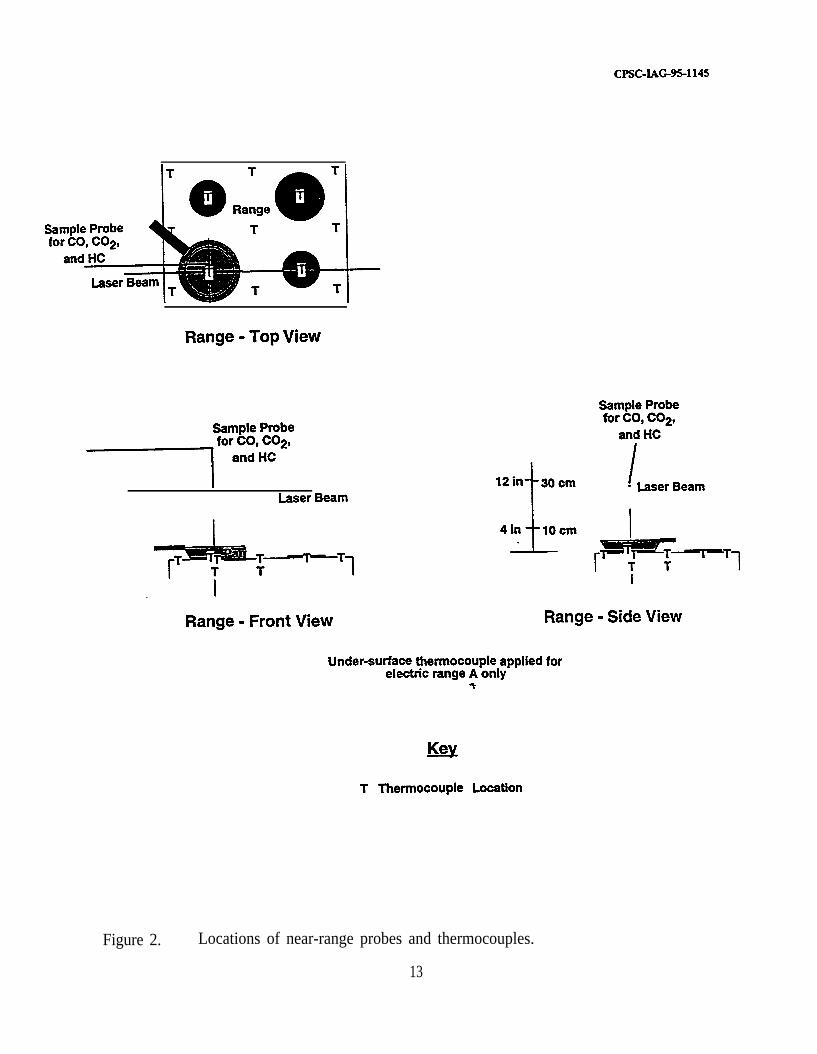
A gas-sampling probe was located 23 cm (9 in) above the center of the large burnersurface in order to monitor the gases evolved from the cooking process. The probe consisted ofa 2.4 m (8 ft) length of 6.4 mm (0.25 in) OD copper tubing. The probe is portrayed in Figure2. A pump was used to draw gases through the probe to a rack of analyzers. A portion of theunaltered sample passed through a total-hydrocarbon (HC) analyzer. The remainder of the flowpassed through a dry-ice trap, a paper filter, and a tube of desiccant, and then into a combinationcarbon dioxide (COJ and carbon monoxide (CO) analyzer. Heating tape was wrapped aroundthe probe from approximately 7 cm (2.5 in) above the probe tip to the sample inlet for thehydrocarbon analyzer. The heating tape was maintained at approximately 50 OC (122 OF) bythree variable current supplies in order to limit condensation. The hydrocarbon analyzer was a
9
.
CPSC-IAG%-1135
Table 2. Experimental test matrix.
Test Range , Hood Case Case Normal/ bitioa9 horn9No. Type Status No. Description Unattended s S
1 Electric (A) Off 1 Oil (stainless steel) U 6082 Electric (A) Off 3 Bacon U 6053 Electric (A) OfY 12 Chicken (unattended) U 18494 Electric (A) Off 5 Broiled steak N 15285 Electric (A) Off 4 Water N 41396 Electric (A) OfY 7 Fries N u 1236 7357 Electric (A) On 9 Water, oil 2359 19808 Electric (A) OfY 11 Chicken (normal) 2668 15209 Electric (A) On 5 Broiled steak N 151810 Electric (A) Off 13 Stir-fry (normal) 62011 Electric (A) OfY 16 Catfish N 48012 Electric (A) Off 9 Water, oil 2358 198013 Electric (A) Off 10 Oil (4 pans) 1632 126014 Electric (A) Off 14 Stir-fry (unattended) U15 Electric (A) On 11 Chicken (normal) N u 2699 153016 Electric (A) Off 5 Broiled steak N b 150017 Electric (A) Off 3 Bacon U 1 56118 Electric (A) oflf 2 Oil (aluminum) U 59419 Electric (A) m 4 Water N 44020 Electric (A) off 8 Macaroni & cheese N u 3197 94521 Electric (A) off 16 Catfish N 510 48922 Electric (A) off 7 Fries z Nu 1214 70523 Electric (A) Off 13 Stir fry (normal) N u 1157 61024 Electric (A) off 1 Oil (stainless steel) U 63725 Electric (A) off 11 Chicken (normal) 2721 152026 Electric (A) olff 14 Stir&y (unattended) U 100527 Electric (A) off 2 Oil (aluminum) U 61628 Electric (A) On 9 Water, oil 2409 198029 Electric (A) On 5 Broiled steak N 150030 Electric (A) m 10 Oil (4 pans) 1688 126031 Electric (A) Off 12 Chicken (unattended) U 1858
10
CPSC-lAG%-1145
Test Range Hood Case Case N o r m a l / tmition, fnormd,No. Type Status No. Description Unattended s S
32 Electric (A) Off 9 Water, oil 2379 198033 Electric (A) Off 8 Macaroni & cheese 101634 Electric (A) On 11 Chicken (normal) 2767 153535 -m off 9 Water, oil 198036 Go9 off 11 Chicken (normal) N u 4387 156037 *m off 9 Water, oil 198038 GM9 ofi 11 Chicken (nomal) N u 4170 158039 Electric (C) off 6 Se&cleaning N40 Electric (C) Off 6 Self%saning N41 Electric (D) On to 15 Grilled steak N 1609
Off
42 Electric (D) On to 15 Grilled steak N . 1618Off
11

CPSC-IAG%1145 _
he-Fire/Normal Cooking Hood Effect TestsDiscrimination Tests (Electric Range,
(Electric Range, Hood Off) Hood On)
Range Effect Tests(Gas Range, Hood Off)
I 1. Oil(unattended) steel pan I
I 2. Oil(unattended) aluminum pan I
I 3. Bacon(unattended)
I 4. Watermultiple batches, sudden lid
removal I
I 5. Steak H 5. Steakbroiled in oven (normal) broiled in oven (normal) I
6, Selfeleaning ovenI . operation withdebris I
I 7. French fries in oil(normal to unattended) I
m
8. Macaroni & cheese(normal to unattended)
9. Water and oilmultiple burners
(normal to unattended)
\9. Water and oil 9. Water and oilmultiple burners multiple burners
(normal to unattended) (normal to unattended)
1 11. Chicken in oil I I I 11. Chicken in oil I1 (normal to unattended) I
12. Chicken in oil(unattended\
P 3. Stir-fried vegetables in oil(normal to unattended) I
4. Stir-fried vegetables in oil(unattended) I
I 15. Steak grilled on surface(normah I
I 16. Blackened catfish(normal) I
Figure 1. Categories of tests.
(normal to unattended)b
(normal to unattended)
12
CPSC-LAG%-1145
Saf 0
Range - Top View
Sample Probe
Laser BeamI- Laser Beam
I
Range - Front View Range - Side View
Under-surface thermocouple applied forelectric range A only
‘+
1 Thermocouple Location
Figure 2. Locations of near-range probes and thermocouples.
13

Table 3.
,
CFSC-IAG%-1145
Instrumentation list.
Instrument Measurement LOCdiOU
Laser (HeNe) and Laser attenuation and scattering by 23 cm (9 in) above burnerphotodiodes smoke related to relative aerosol mass surface. See Figure 3
concentration above cooking area
Thermocouples Temperatures See Figures 2, 3, 4
Total-hydrocarbon Hydrocarbon gas volumetric Above hydrocarbon food,analyZer concentration as methane equivalent see Figure 2
(only those not condensable < 50°C)
Carbon dioxide Carbon dioxide volumetric Above hydrocarbon food,=e= concentration (dry basis) see Figure 2
Carbon monoxide Carbon monoxide volumetric Above hydrocarbon food,-b= concentration (dry basis) see Figure 2
Bidirectional Range-hood duct flow velocity 30 cm (12 in) before lastprobe WI vertical section of duct
Video camera Visual record of cooking area Outside room, focused onphenomena cooking region
Data acquisition Data collection Outside roomsystem
14

CPSC-IAG%-1145
Overall View
Key .
@ Sensor Housing LocationT Thermocouple Location
Figure 3. Schematic of near-range configuration, instruments, sensors, and thermocouples.
15

CPSC-IAG9S-1145
Gas and 240 V
03
lop view
Exhaust Hood1
f: 30cm
-7
a-
Exhausti m H o o d
@#&RangeHood
fl
2.4mz
3.7 m (12’) 24 m (83
Front View Right Side View
01 Sensor Houslng Location
Figure 4. Locations of sensors and thermocouples away from the range.
16

CBC-IAG%-1145
Rosemount Model 4OOA*. The hydrocarbon measurement was calibrated in terms of theequivalent concentration of methane. The combination CO? and CO analyzer was an InfraredIndustries Dual Gas Analyzer and used non-dispersive infrared technology. Both COZ and COconcentrations were measured from dry gas samples.
2.2.2 Thermocouples
Thermocouples were used to measure temperatures in three general areas: near the food,around the range, and above the range. For the area near the food, thermocouples were placedat the center of each burner and contacted to the pan bottom if a pan was present. The contactwas not through permanent fastening, but was ensured by spring loading the thermocouple. Forelectric range A, the thermocouple was located inside the center coil of the burner element anddid not contact the element itself. For the gas range, the thermocouples were also bent in orderto contact the pan bottom, and for protection, ceramic tubes were placed around thethermocouples in the vicinity where they passed through the flame. One thermocouple wasplaced in the food near the center of the pan. The pan and food thermocouples were all Omegamodel number KMQSS-020(G)-12 [stainless-steel sheathed, 0.51 mm (0.020 in) sheath diameter,K-type (Chromel-Alumel), grounded, 30 cm (12 in) long]. For range A, additional thermocoupleswere located on the drip pan centered below the burner and on the surface beneath the drip pancentered below the burner.
For the area around the range, thermocouples were placed on the top surface at left,center, and right positions along the front and midway back from the front of the burner area ofthe range. For range A, a thermocouple was also placed beneath the top surface of the range atthe center left to right and front to rear of the burner area. These locations are depicted in Figure2. A thermocouple was placed on the upper surface inside the oven 5.5 cm (2.2 in) behind thedoor opening and centered across the oven.
For the area above the range, one thermocouple was placed above the food in the buoyantplume approximately 3 mm (0.1 in) below the end of the sample probe. Thermocouplesaccompanied each of the sensor-group sites located on or near the range hood as well as thoselocated on the ceiling. These are shown in Figures 3 and 4. A pair of thermocouples wereplaced on the inside surface of the front edge of the r&ge hood. These thermocouples wereOmega model no. SAl-K 130 gauge, 0.25 mm (0.010 in) diameter, K-type (Chromel-Alumel),91 cm (36 in) long, Teflon insulated, self-adhesive backing]. A thermocouple was also locatedunder each of the left and right filter elements of the hood. These thermocouples and those usedat each sensor site and on the range surface were Omega model no. 5TC-GG-(K)-30<72) [30gauge, 0.25 mm (0.010 in) diameter, K-type (Chromel-Alumel), 183 cm (72 in) long, glass braid
*Certain commercial equipment, instruments, or materials are identified in this report tospecify adequately the experimental procedure which allows its duplication. Such identificationdoes not imply recommendation, endorsement, or disapproval by the National Institute ofStandards and Technology, nor does it imply that the materials or equipment identified arenecessarily the best available for the purpose. Some of the materials or equipment were used ina manner or conditions for which they were not designed.
17

CF’SC-lAG%-1145
insulation]. The assortment of thermocouples used for the experiments cost approximately $10to $30 each.
2.2.3 Laser-Attenuation and Scattering Apparatus
Laser attenuation and scattering measurements were performed in order to monitor thequantity and characteristics of the smoke produced during each test. Laser attenuation is due tolight reflection and absorption and is the fraction of initial laser intensity that does not transmitthrough a cloud of particulates. A laser-attenuation system consists of a laser and a light detector,such as a photodiode, aligned optically so the laser light passes through the medium to bemeasured and into the photodetector. In Phase I, two laser-attenuation systems were used at twodifferent heights above the burner of interest, 18 cm (7 in) and 28 cm (11 in) [3]. For Phase II,only one laser-attenuation system was used at a height of 23 cm (9 in), but in addition to anattenuation measurement, attempts were made to gather light-scattering data at two angles. TheHe-Ne laser-attenuation and scattering system was arranged such that the beam passed throughthe axis of symmetry of the pan of focus. The optics were open and accessible rather than self-contained such as in photoelectric smoke detectors. The He-Ne laser was a Melles Griot modelnumber 05.LLR-811 and generated a 1 mW beam. It was mounted on a verticz&ranslation standto enable alignment. The laser and photodiode detector are depicted in Figure 3.
Laser-light scattering is the fraction of initial laser intensity that is reflected by a cloudof particulates. Relative scattered-light intensities were measured by two additional photodiodeswhich were mounted on optical rods and connected to power sources and signal amplifiers. Thescattering was measured at 5’ and 10” from the forward direction. The photodiodes (HamamatsuS1337-lOlOBQ, 100 mm2 active surface area), operational amplifier circuits,, power source box,and mountings with connections for power input and signal output were the same as those usedby Pitts et al [4] and for Phase I [3]. An iris was also placed in front of each photodiode andopened to approximately 4 mm (0.16 in) to reduce the amount of stray light that could reach thephotodiodes. For the scattering photodiode detectors, narrow band-pass filters (Melles Griot03FIL006,632.8 nm) were installed to only allow light of the laser’s wavelength to pass through.The pre-test output of the attenuation photodiode amplifier with unobstructed laser light was 7 V- 9 v. *
2.2.4 Video and Photographic Equipment
As in Phase I, a VHS video camera was centered outside of the doorway of the laboratoryand focused to capture a view of the cooking scene. Close views were recorded at early stagesof heating and wider views were recorded when smoke generation began. A zoom-lens camerawas used to take still 35 mm slide photographs of the test area and cooking process.
2.3 Sensors and Detectors
This section describes the readily available gas sensors and smoke detectors which wereinstalled to determine their capability to differentiate between normal and pre-ignition conditions.
18

CFYX-IAG9S-1145
2.3.1 Gas Sensors
Criteria were developed for the sensors to be used in the study as part of the Phase I NISTeffort. The following list highlights the key sensor selection considerations. These criteria werefor test purposes only and are not universal guidelines for sensor selection.
1. Available as a functioning model, even if a prototype.2. Cost less than $250 for one or $500 for multiple samples.3. Reusable - not ruined, destroyed, or altered by detection of the pre-ignition
signature or by a power off/on cycle.4. Unobtrusive, with potential for additional miniaturization or installation within/on
the range without obstruction of cooking activities, counter space, or hood flows.5. Include instructions or ready access to consultation with the manufacturer.6. Have a means of perceiving the pre-ignition signature from a range-mounted
location, or if non-range-mounted, require little modification or installation effort.7. Capable of continuous analog output or an analog alarm signal output.8. Not susceptible to contaminant accumulation.Tin-oxide gas sensors were selected from two manufacturers based on these criteria and
applied to this investigation. The first, Figaro, markets several Taguchi-type thin-film sensorswith sensitivities geared towards specific groups of gases. The sensors used were those marketedas sensitive to general hydrocarbons (TGSS 13), general alcohols and volatile organic compounds(TGS822), general cooking gases (TGS880), cooking alcohols (TGS882), and water vapor(TGS883). Except for the water-vapor sensor, each of these sensors responded to several gasesincluding methane, carbon monoxide, ethanol, propane, isobutane, and hydrogen, but withdifferent combinations of sensitivities. The gas sensor sensitivities were affected by bothtemperature and humidity so sensor outputs resulted from combined reaction to levels of thehydrocarbon gas mixture, water vapor, and temperature. The effects of the three variables onsensor output were in the same direction, i.e., increased levels of each variable increased sensoroutput. Costs for the gas sensors ranged from $10 to $25 each.
The sensors were connected to output circuits and 15 V dc power supplies. The sensors’internal heating elements were supplied with a 5 V heating voltage. Three to six sensors werepowered by each power supply. Sensors were placed iqlividually or with one or two others ina sensor housing. The housings consisted of 4.4 cm (1.75 in) long pieces of 7.0 cm (2.75 in) ODbakelite tubing with 0.3 cm (0.12 in) wall thickness attached to a 0.5 cm (0.19 in) thick disk ofbakelite at one end with mounting holes for the sensors.
Carbon monoxide sensors were purchased from Capteur Sensors and Analysers, Ltd.These were thick-film tin-oxide sensors (part no. lC-G-S-0-05-CM-E-07) and came with a filterto eliminate hydrocarbons. Their cost was approximately $70 each. Each CO s,ensor used a 5 Vdc power supply and had its own printed circuit board to regulate the heating ele:ment to maintaina constant temperature between 400 OC (750 OF) and 500 “C (930 OF). The sensor’s resistancevaried depending on the gas concentration, and a simple voltage-divider circuit was constructedto provide an output signal.
The approximate sensor locations are shown in Figures 3 and 4. Table 4 summarizes thesensors used in the discrimination test series. Table 5 is the key for all of the individual sensors
19

.
CFSC-IAG-95-1145
Table 4. List of sensors.
sensor Measurement Location
Thermocouples Temperatures See Figures 2, 3,4
Smoke-particulate sensors Voltage representing detector Several locations.(4 ionization and 8 photoelectric) response and transition to See Figures 3,4
alarm state
Gas sensors (tin-oxide type): Voltage representing response Several locations.carbon monoxide, hydrocarbons, to contacting gases See Figures 3,4volatile organics, cooking gases,cooking alcohols, water vapor
20
____- -..-e- -~.+---lt-yI..- , _. .--*-*- .- _“.--.-...
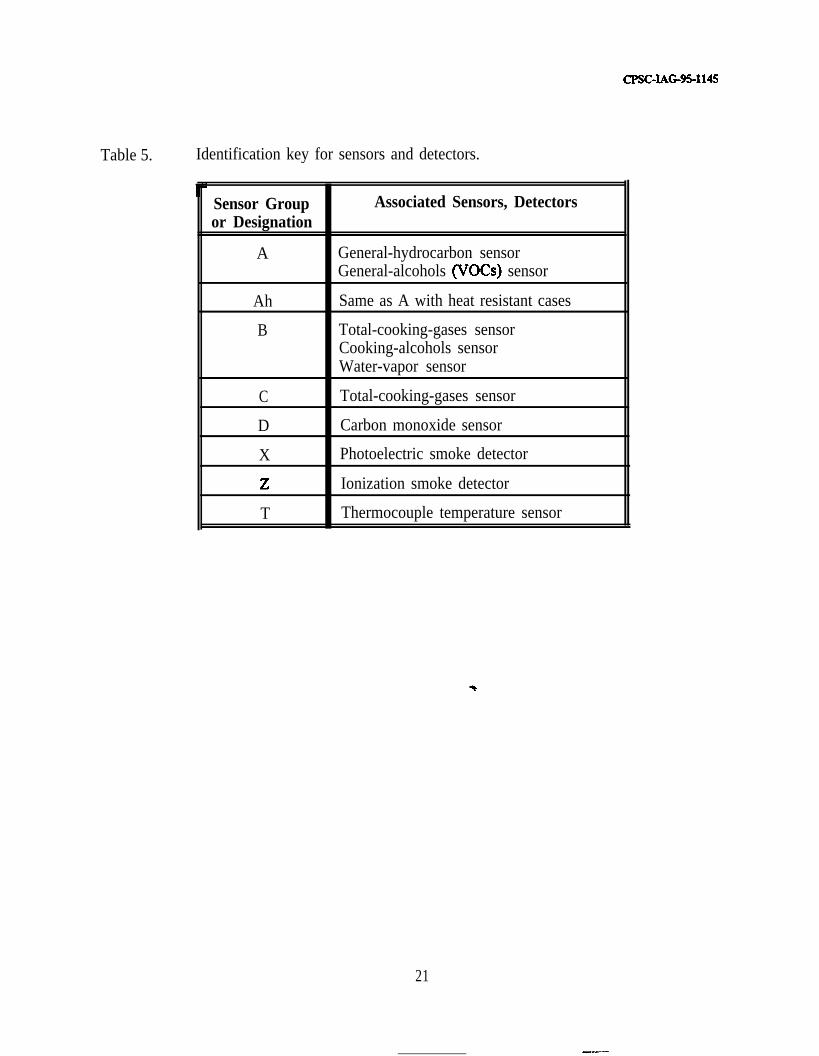
Table 5.
CPSC-xAcas-1145
Identification key for sensors and detectors.
Sensor Group Associated Sensors, Detectorsor Designation
A General-hydrocarbon sensorGeneral-alcohols (VOCs) sensor
Ah Same as A with heat resistant cases
B Total-cooking-gases sensorCooking-alcohols sensorWater-vapor sensor
C Total-cooking-gases sensor
D Carbon monoxide sensor
X Photoelectric smoke detector
z Ionization smoke detector
T Thermocouple temperature sensor
21

CPSC-IAG95-1145
and sensor groups and types employed in the following tables and figures. The locations of thesensors and sensor groups are depicted in Figures 2-4. Table 6 lists the sensors groups and theirrelative orientations. Twenty-five sensors were mounted in 16 housings in 11 locations near therange. A site for various sensors was not a single point, but an area where: some combinationof sensors was clustered. Two of the general sensors were ordered with special heat-resistanthousings, and these were placed at site 9 near the majority of food ignitions. The heat-resistantversions cost about $25 each which was about twice as much as the regular models.
2.3.2 Smoke Detectors
The photoelectric-type smoke-detector models used were a type available for householdor commercial use. They consisted of a detector module, mounting base, and test cable. Themodel numbers were Detection Systems DS-250, MB4W, and TCZOOO, respectively. The basediameter was 16 cm (6.3 in). The plug-in test cable produced an analog voltage signal. Theeight detectors were all powered by a single 12 V dc power supply. Alarm signals were alsorecorded from the photoelectric detectors. These detectors cost about $45 each.
The ionization-type smoke detectors were an inexpensive model ($lO-$15 each) designatedfor home use. The manufacturer donated three of the four units used and provided modificationinstructions that enabled retrieval of analog responses and alarm voltages without affectingproduct performance. The ionization-detector diameter was 14.2 cm (5.6 in). The four detectorswere each powered by individual 9 V batteries.
Both types of smoke detectors were only used for providing an alarm signal and not forquantitative smoke-obscuration measurements. The detectors were all listed and labeled byUnderwriters Laboratories (UL). The detector locations are shown in Figures 3 and 4 anddescribed in Table 6 using Table 5 as the key.
2.4 General Procedure
Each experiment began with no heat applied to the food and ended soon after ignition ofthe food or upon completion of the cooking procedure. The general steps involved in theseexperiments are provided in Appendix A. Usually qo or three personnel would conduct eachtest. Because of the frequency with which fires occurred, additional help was often notified whenthe food was about to ignite. A test log sheet was used to make notes of the times and natureof phenomena and observations. A sample blank sheet is included as Appendix B.
2.5 Data Acquisition, Reduction, and Plotting
Data acquisition, reduction, and plotting were accomplished using the same equipment andsoftware as in Phase I. A more complete description of these processes is included in the PhaseI report 131. A computer, scanner box, and digital voltmeter constituted the data acquisitionsystem. The data system had a capacity of 60 instrument channels and 160 thermocouplechannels, but 56 and 42, respectively, were actually used. The data system was capable ofscanning the 98 channels at 8 s intervals, which was the setting for most tests, but a few of the
22

CPSC-IAG95-1145
Table 6. Sensor and detector location descriptions.

wall and front wall (s
24

CPSC-IAG%-1145
longer tests utilized 10 s, 12 s, or 30 s time intervals due to the expected slow rates of changeof the measured variables.
A data acquisition program developed at the Building and Fire Research Laboratory wasused in conjunction with a computer. The program produces data files as follows: ascii testdescriptions are placed at the top of the file, followed by digitized background readings, rangecalibration measurements, and finally the time dependent test data.
The reduction of data was performed with RAPID [6] software which was developed atNIST especially for fire tests. More details concerning the use of RAPID are available in thePhase I report (31. RAPID requires an input data file of data collected by the data acquisitionsystem and a program control file which contains the data channel descriptions and commandinstructions for data analysis. A sample program control file is included as Appendix C. Thefinal output of the reduction process is a file containing the reduced data in columns. This fileis readable by a variety of computer plotting and analysis programs. A complete set of the datain electronic form will be available through the CPSC.
Data plotting was performed on a Macintosh Centris 650 with Kaleidagraph version 3.0software. The use of Kaleidagraph is described in the Phase I report [3]. A set of 11 plots wascreated for each test to visually inspect the time behavior of the measured variables. These plotsare attenuation, carbon monoxide, selected hydrocarbons, ionization detecto:rs, photoelectricdetectors, site 11 gas sensors, site 7 gas sensors, site 9 gas sensors, temperatures near the food,selected temperatures on the range, and selected temperatures above the range surface. Similarplots for certain tests will be presented as examples in Section 3. Some data smoothing wasemployed to clarify general trends in the midst of large signal fluctuations. Smoothing is notedon the appropriate plots. A description of smoothing techniques is in the Phase I report [3].
3.0 Results
3.1 General Experimental Results ’
Selected plots of measured quantities are included in this section with notes regardingparticularly interesting features. Primarily, results from baseline tests performed on the electricrange A will be shown in this section. A discussion o&nge and hood effects is provided inSection 4.3. Statistical analyses of the test measurements are provided in Section 4. A smallnumber of tests are used as examples because of the large total number of measurements for eachof 42 tests. The trends are typical although there are some variations in detailed behavior andmeasured values from test to test. Important quantitative differences are addressed in Section 4.
3.2 Gas Concentrations
The results of gas-analyzer measurements for two tests are shown in Figures 5 and 6.Figure 5 is a plot of CO, CO,, and total-hydrocarbon concentrations versus time for a test offrench-fried potatoes cooked in 500 mL of soybean oil. The concentrations of CO and CO2 weremeasured on a dry basis (water removed). The concentration unit of parts per million isdesignated by ppm. The CO, concentration increased from an initial background level of 0.1%
25

CF’SC-IAG%-I 145
I Test **600
sL
3 0 0 -E0
1 0 0 -
7 0 0 800 900 1 0 0 0 1100 1200 1300
Time, s
Figure 5. CO, hydrocarbon, and CO* concentrations versus time for French-fried potatoes insoybean oil (normakunattended).
26

CPSC-LAG%1145
to about 0.3% before ignition. The CO concentration increased from 0 ppm to about 200 ppmwith all of the rise occurring in the 300 s preceding ignition. The hydrocarbon concentrationincreased from 0% to 0.5% over about the same period as CO. After ignition, CO andhydrocarbon concentrations continued to rise because the lid used to smother the fire increasedinterior pan and food temperatures and thus smoke production. The late peak of CO,concentration reflects the use of the fire extinguisher to cool the pan and extingui.sh reignitions.
Figure 6 shows the corresponding results for a test of blackened catfish. The ignition lineappears delayed relative to the analyzer signals because for this particular test, the food ignitedabout 30 s after the pan was removed from the hot burner and placed on a cold burner away fromthe gas sampling probe. The COZ concentration remained near its background level through 480 swhen the pan was removed from the heat. No extinguisher was used so the CO* level remainedlow. The CO concentration increased from 0 ppm initially to about 1200 ppm at 480 s with mostof the rise occurring after 380 s. The hydrocarbon concentration increased from 0% to 2%between 240 s and 480 s.
3.3 Gas-Sensor Responses
There are a larger representation of gas-sensor plots included compared to any othersensor type because there were 25 individual gas sensors. The focus of the figures is on thosesensors that were located along the plane of symmetry of the range and responded with relativestrength. The plots show sensor output voltage versus time. Output voltages have had initialbackground voltages subtracted from them. The responses of the hydrocarbon- and alcohol-gassensors at sites 7, 9, and 11 for a test of french-fried potatoes cooked in 500 mL, of soybean oilare shown in Figures 7, 8, and 9. The water-vapor and CO-sensor responses for the same sitesand test are shown in Figure 10. In each plot, the responses to the introduction of the fries tothe hot oil at 285 s are shown. Figure 11 shows the responses of the hydrocarbon sensors at site9 for a blackened catfish test with no ignition. Figure 12 shows the responses of the hydrocarbonsensors at site 9 for unattended chicken in 500 mL of soybean oil.
3.4 Smoke-Detector Responses
The two kinds of smoke detectors had differen; cooking condition responses as theyreached alarm states. The photoelectric detectors simply changed from a nonalarm zero voltagevalue abruptly to an alarm-state voltage of 5 V. Figure 13 shows the output signals for all of thephotoelectric detectors versus time for a french-fries test. The ionization detectors reacted in agradual fashion related more closely to the amount of smoke contacting them. When the voltageoutput crossed zero and became negative, the alarm was activated. Figure 14 shows the outputsignals for the four ionization detectors for the same french-fries test. Figures 15 and 16 are thecorresponding plots of photoelectric and ionization detector outputs for a broiled-steak test.
3.5 Temperatures
The plots of temperature are divided into two categories: near the pan or food, and on therange upward to the range hood.
27

CPSC-IAG95-1145
8 0 0
6 0 0
0 1 0 0 .2 0 0 3 0 0 4 0 0 5 0 0 6 0 0
Time. sI -
Figure 6. CO, hydrocarbon, and CO2 concentrations versus time for blackened catfish(normal).
c’28
_ -.-_- XL -- ..l”.l .^-.-.“w--l ---.. - -

cP!jc-TAG%-1145
>A3g
12
IO
8
6
4
2
0
200 4 0 0 600 800 1000 1200
Time, s
Figure 7. Site 7 hydrocarbon-sensor responses versus time for french-ftied potatoes insoybean oil (normakunattended).
29

CPSC-IAG%1145
8 -
6 -
4 -
2 -
0
Test 22rP
0 200 4 0 0 600 800 1000 1200
Time, s
Figure 8. Site 9 hydrocarbon-sensor responses versus time for french-fried potatoes insoybean oil (nonnakunattended).
30

CPSC-lAG%1145
12
10
8
6
Test 22
0 200 4 0 0 600 800 1000 1200
Time, s
Figure 9. Site 11 hydrocarbon-sensor responses versus time for French-fried potatoes insoybean oil (normkunattended).
31

CPSC-IAG%-I145 ,
I .5
1
0.5
0 -1 I” I I” l
.“ “ “ “ “ “ “ ‘ I
0 200 4 0 0 600 800 1000 1200
Time, s
Figure 10. Sites 7, 9, 11 water-vapor and CO-sensor responses versus time for French-friedpotatoes in soybean oil (normakunattended).
32
CPSC-IAG%-1145
8
7
6
5
4
3
2
1
0
0 100 2 0 0 300 400 500 600
Time, s
Figure 11. Site 9 hydrocarbon-sensor responses versus time for blackened catfish (normal).
33

CF’SC-LAG-951145
12
10
8
6
T- 7 1 I I I I T--
__o__ 9A: Gen. HC- 9A: Gen. Ale.- 9B: Tot. Cook.-9B: Cook. AL.
i ’ *I t I I I I I I I I I t I t I
0 400 800 1200 1600
Time, s
S
Figure 12. Site 9 hydrocarbon-sensor responses versus time for chicken in soybean oil(unattended).
34

cP!K-IAG-95-1145
>A
8
g
5I
4 -
3 -
2 -
1 -
:.
...
9;..
.:
I..
. l. .*
I..
. 0. ..I
..11: :13
I..
IIiIiI.14,97
I
i
I
i
I?
’ I16
- 5X: Alarm~~~~-.~-- 9X: Alarm-----11X: Alarma - - . - 13X: Alarm- - - 14X: Alarm- - - 15X: Alarm- 16X: Alarm---0----- 17X: Alarm
t,g,=1214 s
~~‘~~111111,,,,1,,,,~,,,,~,, I
900 950 1000 1050 1100 1150 1200
Time, s
Figure 13. All photoelectric detector ahum signals versus time for French-fkied potatoes insoybean oil (normakunattended).
Cl35

CPSC-lAG95-1145
-6.l...-.l- j5Z: Alafrm
- 16Z: Alarm
- 8
.../ . .c -Ii-I ;-. ..+:
!!! :I ‘-. .IL-I _6 0 0 8 0 0
Time, s
1 0 0 0 1 2 0 0
Figure 14. All ionization detector alarm signals versus time for french-fried potatoes insoybean oil (normatkunattended).
36

CPSC-IAG%-1145
4 -
3 -
5
2 -
1 -
d0 ‘1- Y.
.: .:
I ;-I . : I
: ..I :I .: . : I. * .:. I . : I
.. :.: 0. .: . : I
Il .
..
.: I
..
.:
.
.
.. * :
.. I
I.
:
:9 11 j&I7I 14’ 1. .. . .. :: . I.... I
:0 : Il
.:
.
.,
l l I.
.0 I I
.l 8
:l : I
. I. :
. .
.. . :
.I
- 5X: Alarm. . . . . . . . . 9X: Alarm--- - -11X: Alarm. . . . - 13X: Alarm- - - 14X: Alarm- - - 15X: Alarm- 16X: Alarm--------- 17X: Alarm
6 5 0 7 0 0 7 5 0 8 0 0 8 5 0 9 0 0 9 5 0
Time, s
Figure 15. All photoelectric detector alarm signals versus time for broiled steak (normal).
37

CPSC-XAG%-1145
2
1
0
-I
- 2
- 3
Test 16 -
0 2 0 0 4 0 0 6 0 0 8 0 0 1 0 0 0 1 2 0 0 1 4 0 0 1 6 0 0
Time, s
Figure 16. All ionization detector alarm signals versus time for broiled steak (normal).
38
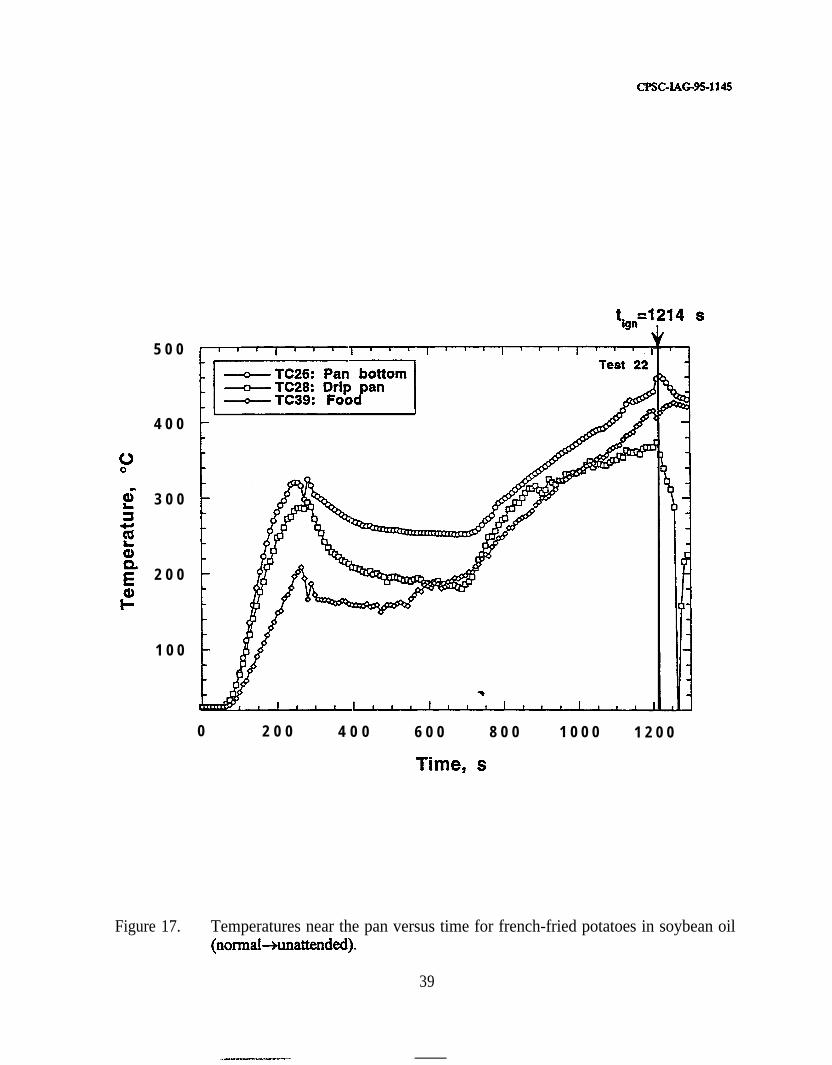
CPSC-IAG%-1145
5 0 0
4 0 0
3 0 0
2 0 0
1 0 0
Test 22~;fjq”““““;
0 2 0 0 4 0 0 6 0 0 8 0 0 1 0 0 0 1 2 0 0
Time, s
Figure 17. Temperatures near the pan versus time for french-fried potatoes in soybean oil(normakunattended).
39

500
400
300
200
100
CPSC-IAG%-1145
0 1 0 0 200 3 0 0 400 500 600
Time, s
Figure 18. Temperatures near the pan versus time for blackened catfish (normal).
40

CPSC-JAG%-1145
PP3E
600
500
4 0 0 -
3 0 0 -
2 0 0 -
1 0 0 -
0 400 8 0 0 1200 1600
Time, s
Figure 19. Temperatures near the pan versus time for chicken in soybean oil (unattended).
41
CPSCXAG%1145
3.51 Pan and Food
Figure 17 shows a plot of three thermocouple responses versus time for a french-fried-potatoes test. Numbered thermocouples and their corresponding locations are described inAppendix C. Thermocouple 26 measured the temperature on the pan bottom. Pan temperaturesoften increased following ignition because the thermocouple remained in contact with the panafter the lid was put in place which trapped additional heat in the pan and raised its temperature.Thermocouple 26 malfunctioned for portions of tests 24-32. Thermocouple 28 was located nearthe center of the drip pan under the burner. Thermocouple 39 was located in the food itself.Since the food thermocouple was not fixed in the pan, temperature plots often show fluctuationsdue to stirring or turning of the fcad which exposed the thermocouple to relatively colder orhotter local areas. Figures 18 and 19 show the corresponding three temperature-time historiesplotted for the cases of catflsh and chicken in oil (unattended), respectively. The lower foodtemperature beginning at about 250 s in P&e 18 was due to the introduction of the fish intothe pan.
3.5.2 Range and Range Hood
Figure 20 shows a plot of tlhermocouple responses versus time associated with the rangefor a french-fried-potatoes test. Thermocouples 19,22, and 23 were located on the center of therange surface, at the center of the front edge, and in the right front comer near the focus burner,respectively. Thermocouples 29 and 30 were located underneath the drip pan of the focus burnerand underneath the range surface at the center of the range, respectively. The sharp drop insometemperatures after ignition was due to the cold gas from the CO2 fne extinguisher. Figure 21shows thermocouple responses from above the range for the same test. Thermocouple 9 waslocated at site 9 with the gas sensors on the center of the front of the range hood. Thermocouple35 was located under the right-side hood filter. Thermocouple 40 was located just below the endof the gas-sampling probe. Figures 22 and 23 show results for the same locations as in Figures20 and 21 except that they were produced by a test of water on three burners with the oven onand oil on the focus burner. Also, thermocouple 3 1 on Figure 22 shows the additional trace ofthe oven temperature which exhibited a cycling behavior.
3.6 Laser Attenuation and Scattering
Figures 24 and 25 show laser-attenuation measurements versus time for tests of fiench-fried potatoes and water and oil, respectively: The circles represent the actual data points, andthe curves were generated by partially smoothing the data. A 2% smooth, for example, replacesa data point with a point generated from a least-squares cuwe fit through the original point andthe surrounding 2% of all of tlhe data. Light-scattering measurements were found to beimpractical due to very low signa&to-noise ratios.
42
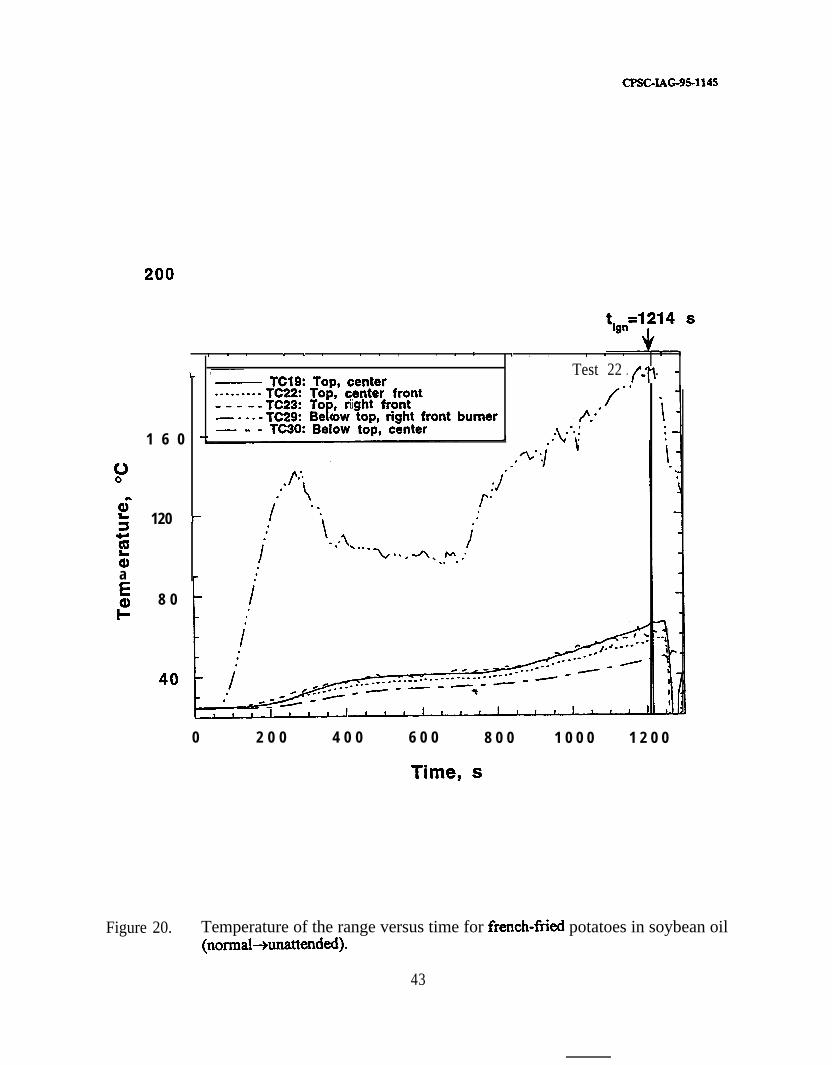
CPSC-JAG%1145
2oo
‘ I
I 1 8 I I I I 1 1 1 , . 1 1 I1 I 1
~L Test 22- TC19: lop, center
.TC22: Top, center front
f,y . . -. . . ..I.. -
- TC23:-1: -‘: - TC29:
ToBe ow top, right front burnerP
, iight front
- - - TC30: Below top, center1 6 0 -
00
f 120 .-
zza r
8 0
0 2 0 0 4 0 0 6 0 0 8 0 0 1 0 0 0 1 2 0 0
Time, s
Figure 20. Temperature of the range versus time for french-fried potatoes in soybean oil(normabunattended).
43

CPSC-IAG%-1145
1 2 1 4 s
1 0 0
8 0
6 0
4 0
2 0
,..:
0.
: -.
0 2 0 0 4 0 0 6 0 0 8 0 0 1 0 0 0 1 2 0 0
Time, s
Figure 21. Temperatures above the range versus time for french-fried potatoes in soybean oil(normabunattended).
44

.
CPSC-LAG-%1145
tg2358 sI
2 0 0 I 1 8
','' ' ' ' ' a ' ' ' ' 1 1 I 1 I 1
_ lest 12
I!\\
c
1 5 0 r
1 0 0 r
50 -
0 4 0 0 8 0 0 1 2 0 0 1 6 0 0 2 0 0 0 2 4 0 0
Time, s
Figure 22. Temperatures of the range versus time for water and oil (normabunattended).
45

CPSC-IAG%1145
00Bsz5eEg
80 -
60 -
0 4 0 0 8 0 0 1 2 0 0 1 6 0 0 2 0 0 0 2 4 0 0
Time, s
Figure 23. Temperatures above the range versus time for water and oil (normabunattended). -
46

CFSC-IAG%-1145
1
0 . 8
0 . 6
0 . 4
0 . 2
00 2 0 0 4 0 0 6 0 0 8 0 0 1 0 0 0 1 2 0 0
Time, s
Figure 24. Laser attenuation versus time for french-fried potatoes in soybean oil(normakunattended).
47

CPSC-IAG%1145
Test 12Circles actual dataDashed cuwe loA sImoothed
0 . 8z>
r”0 0.6za3E 0a,
0 4 0 0 8 0 0 1 2 0 0 1 6 0 0 2 0 0 0 2 4 0 0
Time, s
Figure 25. Laser attenuation versus time for water and oil (normahunattended).
48

CPSC-IAG%1145
3.7 Recorded Images
The videotape recordings provide considerable qualitative and quantitative detailsconcerning the tests. The instants of ignition are clearly defined, allowing more exact times andmodes of ignition to be determined. The recordings are also useful for characterizing the depthand thickness of the smoke layer for each experiment.
A total of 120 slide photographs were taken for this experimental series. The slidesportray the experimental apparatus, cooking phenomenon, and pre- and post-test images of thefood.
4.0 Analysis and Discussion
4.1 Analysis Techniques
Table 2 lists the tests and their corresponding designations as normal, unattended, or both.Depending on the designation, times for ignition and times chosen as normal are listed as wellfor each test. The normal times are when the heating period of a test was concluded or when theunattended portion of a test began. A few unattended tests (10, 14,33,35, and 37) did not leadto ignition, but the times when heating was stopped were used as ignition times. These tests wereamong those performed for the cases of stir-fry vegetables, macaroni and cheese, and oil andwater (with the gas range). This was done because the levels of smoke and/or melting of metalwere judged sufficiently undesirable or potentially dangerous enough to warrant designating thesituations as alarm-worthy.
The normal and ignition times were used for each test to perform analyses. Since theidentification of a detection window, or distinct difference between normal and ignitionconditions, for all tests is the objective, the maximum measured values during the normal cookingperiods and the minimum measured values in the 30 s (and sometimes 60 s for comparison)preceding ignition were calculated for every variable. In figures to follow, these are designatedby “nMax” and “i3OMin”, respectively. The minimum was the data point of least value oftypically three or four points from the 30 s period. The normal maximum values were thehighest levels that occurred during normal cooking. Minima and maxima were used rather thanaverages in order to capture the sensor signals that would be employed by an actual detectionsystem including noise or fluctuations inherent in the measurements. Table 2 lists the normal andignition times used for the data anakysis.
Unless otherwise stated, all of the minima are from the 30 s preceding ignition. Thirtyseconds was chosen as the pre-ignition time of primary focus based on the cooling-lag test onelectric range A which indicated an 11 s delay before food and pan-bottom temperatures beganto decrease after power was cut off. Figure 26 shows the pan-bottom and food temperaturesversus time for the cooling-lag test. Thirty seconds provides nearly 20 s of additional timepreceding ignition as an added safety factor.
Most of the measurements showed that the variables sensed did not generate signals thatwould be useful inputs for a pre-Cre detection system. They showed insufficient or nodifferentiation between normal and pre-fire conditions so they have no potential as detection
49

cxsc-IAG-95-114s
4 4 0
4 3 000
4 2 0.6L
3 8 0
Burner Off +
3 7 0 l - J - - d - -6 0 8 0
Cube FitT61UX d 105 s
Time, s
Figure 26. Pan-bottom temperature and food temperatures versus time for cooling-lag test of500 mL oil on the type-A electric range.
50

CPSC-IAG%1145
devices at their specific locations. Instruments such as the laser-attenuation system and gasanalyzers are not candidates for detector components because of their bulk and expense. Thefocus of analysis, therefore, was placed on the sensors located along the plane of symmetry ofthe range to see if single sensors alone could successMly provide coverage across the width ofthe range. Less focus was given to sensors off of the plane of symmetry because a detectionsystem requiring localized coverage by 2 or 4 sensors of each type would be prohibitive due tohigher costs and complexity. Performance results for gas sensors, thermocouples, and smokedetectors are summarized in Sections 4.2.1 through 4.2.4.
4.2 Detection Potential of Devices
The following list of questions was generated through discussions between MST, CPSC,and range-industry representatives. The questions reflect important considerations in theevaluation of the detection success and implementation potential of the devices.1. Does detection occur with suEicient time for the actuation of a shutoff device and cooling
of the area so ignition cannot occur?2. Does the device diction consistently with the range hood on and of?‘?3. Does the device fail to respond to normal conditions, or not generate false alarms?4. Can the device be exposed to a kitchen environment, especially contaminants, with a rate
of deterioration in performance consistent with 20 years of range life expectancy?5. What is the probable capability in reducing food fires?6. How easily can the device be: incorporated into a new range/cooktop?7. Is the device useful as a retrofit, as a new component, or as an external independent
device?8. What is the cost of the device as purchased, and what might be the mass produced costs,
costs for range installation, or costs for modification as retrofits available frommanufacturers or suppliers?
Points 1-5 are addressed in the following sections, and the NIST study especially focuses onpoints l-3. Points 6-8 should be dealt with through the engineering development of a detectionsystem.
4.2.1 Gas Sensors *
Figures 27 and 28 are examples of sensor outputs that were found not to be especiallyuseM for discriminating between nomal and pre-ignition conditions. Figure 27 shows thenormal maxima and pre-ignition minima for the total-cooking-gas sensor at site 6, which waslocated behind the focus burner on the splash panel of the range. On the plot, the individual testnumbers are on the independent axis. Since the gas burner of focus was located on the oppositeside of the range from the primary electric burner, data from the site 4 sensor replaced the site6 data for the gas-range tests. The signals were generally weak with no clear separation betweennormal and pre-ignition conditions. This result was due to the relatively low height of the sensorabove the range surface which prevented exposure to the majority of the cooking gases.
Figure 28 shows the response of the CO sensor located on the range hood at site 9. Theregions of maximum normal points and minimum ignition points overlap substantially. For an
51

Sen
sor
Vo
ltag
e, V
0P,
000”
-.....
......
......
......@
......
......
......
......
....
......
......
......
......
1
......
......
.*...
......
......
......
......
......
... I......
......
......
......
.... I...
......
......
......
......
......
......
......
......
....
......
......
......
......
......
......
......
......
......
..... n
1
......
......
......
......
......
......
... 1......
......
......
......
......
......
......
......
......
f....
......
......
......
...:
......
......
......
......
.... i
..;...
......
......
......
......
......
......
......
.....
.1..
g...
......
......
......
...
t
3“..
......
......
......
......
.I iI
......
......
......
......
......
......
......
......
......
..i
+....
......
......
......
......
......
.x*.
......
.f...
......
......
......
......
!......
......
......
......
......
......
......
......
......
......
......
......
......
.....
......
......
......
....... l
......
......
......
....
......
......
......
......
....
i....
......
......
......
.....
i...
....
....
....
....
....
....
....
....
....
....
....
....
....
....
....
....
....
....
....
....
....
....
....
....
....
....
....
....
....
....
....
....
....
....
....
....
....
....
⌧f
fI
......
.....
.....
t..
C...
....
....
....
....
....
....
....
....
....
....
....
....
....
....
....
....
....
....
....
....
....
....
....
....
....
....
....
.......
......)+*.
.....
i ...
....
....
....
....
....
....
....
....
....
....
....
....
....
....
....
....
....
....
....
....
....
....
....
....
....
....
....
....
....
....
....
...$
t.....
......
......
......
.....
bI...
......
......
......
......
iI
/
....
....
....
....
....
....
....
....
....
....
....
....
....
......
......
......
......
......
......
......
......
......
......
......
.....
I
....
....
....
....
....
....
....
....
....
....
....
....
....
.. .......
.....⌧:
....
....
....
....
....
....
...
....
....
....
....
....
....
....
....
....
....
....
....
....
....
....
....
....
...
....
....
....
....
....
...
~~~~~~~~~~~~~~~
......
......
......
......
...i
......
......
......
......
....
I....
....
....
....
....
....
....
....
....
....
....
....
....
I-....
..........
..........
..........
..........
.........
i. . . . . . . . . .
. . . . . . . . . .
. . . . . . . . I. . . .
. . . . . . . .
. . . . . . . .
. . . . . . .I
1. . . . .
. j( . . . . .
. . .:..:..
.--. .
. . . . . . . .
. . X. . . . . . .
. . . ... . .
. . . . . . .
. . . . . . .
. . . . . . .
. . .. . . .
. . . . . . .
. . . . . . .
. . . . . . .
. . .. . . .
. . . . . . .
. . . . . . .
. . . . . . .
. .. . . .
. . . . . . .
. . . . . . .
. . . . . .
..m:
m.....
........
..... . . .
. . . . . . .
. . . . . . .
. . . . . . .
. . . . . . .
. . . . . . .
. . . . . . .
. . . . . . .
. . . . . . .
. . . . .
x ,
1..*....
........
........
.*..
. . . . . . .
..*....
........
...mI
I I
I I
II
I I
III
1I
1
a

0
Sen
sor
Vo
ltag
e, V
00
00
4iiD
b;n
iaoa
i\,
. . . . . . ..
*...........
. . . . . . . .
. . . . . . . .
. . . ..B
. . . . . . . . .
. . . . . . . . .
. . . . . . .
. . . . . . . .
. . . . . ..-
. . . . . . . . . .
. . . .. . . . .
. . . . . . . . . .
. . . . . ..-
-.......*,
..........
.
. . . . . . . . . .
. . . . . . . . . .
. . .. . . . .
. . . . . . . .
. . . . . . ..M
. ..*.....
. . . . . . .
. . ..*.......
..-. . . . .
. . . . . . . . . .
. . . . . . . . .
. . . . . . . .
. . . . . . . .
. . ..m
... .. . . . . .
. . . . . . . . .
. . . . . . . .
. . . . . . . .
..w

CPSC-IAG-95-1145
alarm threshold of 0.32 V, the sensor generated a 25% false-alarm rate and 20% failure-to-alarmrate. This sensor, while in one of the best locations for exposure to plume gases, did not showsignificant enough differences between normal and pre-ignition CO levels to make it a goodcandidate for a detection system.
Figure 29 shows the results for the site 10 total-cooking-gas sensor. Since the gas burnerof focus was located on the opposite side of the range from the primary electric burner, data fromthe site 8 sensor replaced the she 10 data for the gas-range tests. For an alarm threshold of4.8 V, the sensor generated a 19% false-alarm rate and a 7% failure-to-alarm rate.
Some false alarms occurred for cases that may be characterized as special which has animcact on the performance characterization of each sensor. The tests have been separated intocategories reflecting these specia3 cases in Table 7. Table 7 is a chart which lists the sensorsdiscussed in this section and the slection on thermocouples, their associated figures, their assignedalarm thresholds, and their false-alarm and failure-to-alarm rates based on the thresholds. Thefollowing paragraphs discuss the information in Table 7 and its interpretation.
The thresholds in Table 7 were selected with an effort to minimize both false alarms andfailures to alarm, but the chosen values are not the only valid settings nor are they necessarilythe best. For the alarm columlnrs in Table 7, the numbers in parentheses are the percentagesreflected by the test numbers that are listed. The percentages were calculated by dividing thenumber of incidents of false alarm or alarm failure (failure to alarm) by the total numbers ofopportunities for each. These totals are 32 for false alarms and 30 for failures to alarm andreflect the number of tests or portions of tests that were normal and unattended, respectively.
The special cooking-case columns in Table 7 are steak, fish, cleaning, and other. Theblackened-fish case is an inherently attended cooking procedure for which a temporarydeactivation (with automatic reactivation) of the detection system by the operator could preventdisruption of cooking by range <hutdown. Another solution to special attended cooking casescould be motion detector technology which could confirm that a process is indeed attended.Broiling of steak and the self-cleaning oven cases are operations that don’t utilize the rangesurface and are also not a threat for ignition. Inclusion of an input to the detection systemalgorithm indicating that the oven is in use for broiling or self-cleaning could prevent theseactivities from being disrupted. In the “other” category, cases 5, 10, and 19 appear for somesensors. Case 10 is stir-fry vegetables which is another inherently attended cooking procedurewhich could be protected from disruption as de&b& previously. Cases 5 and 19 are multiplepans of boiling water. The reason that these normal cases generated higher readings was that oilresidue from previous tests was not completely removed from the burners and produced somesmoke for several minutes in the early heating period. If this occurred in a real kitchen, theprevention of the production of smoke could be considered a positive situation, and the shutdownof the range would alert the operator that debris should be cleaned from a burner.
Additional columns in Table 7 are for ‘real” false alarms, and “real” and “other” failuresto alann. The tests listed under the “real” columns could not be accounted for in the ways thatoven broiling and cleaning and attended cooking could be. Therefore the “real” tests representdeficiencies in the ability of particular sensors to differentiate between normal and pre-ignitionconditions. The “other” instances are considered in the discussion of specific sensor results.Based on the preceding explanations of the table, the gas sensors already discussed did not
54

CPSC-IAG95-1145
1 2
1 0
8
6
4
2
00 5
r X Max l i30Min
1 0 1 5 2 0 2 5 3 0 3 5 4 0
Test Number
Figure 29. Site 10 total-cooking-gas sensor maximum normal and minimum ignition output30 s before ignition versus test number. Data for the gas-range tests (35-38) arefrom the site 8 total-waking-gas sensor.
55
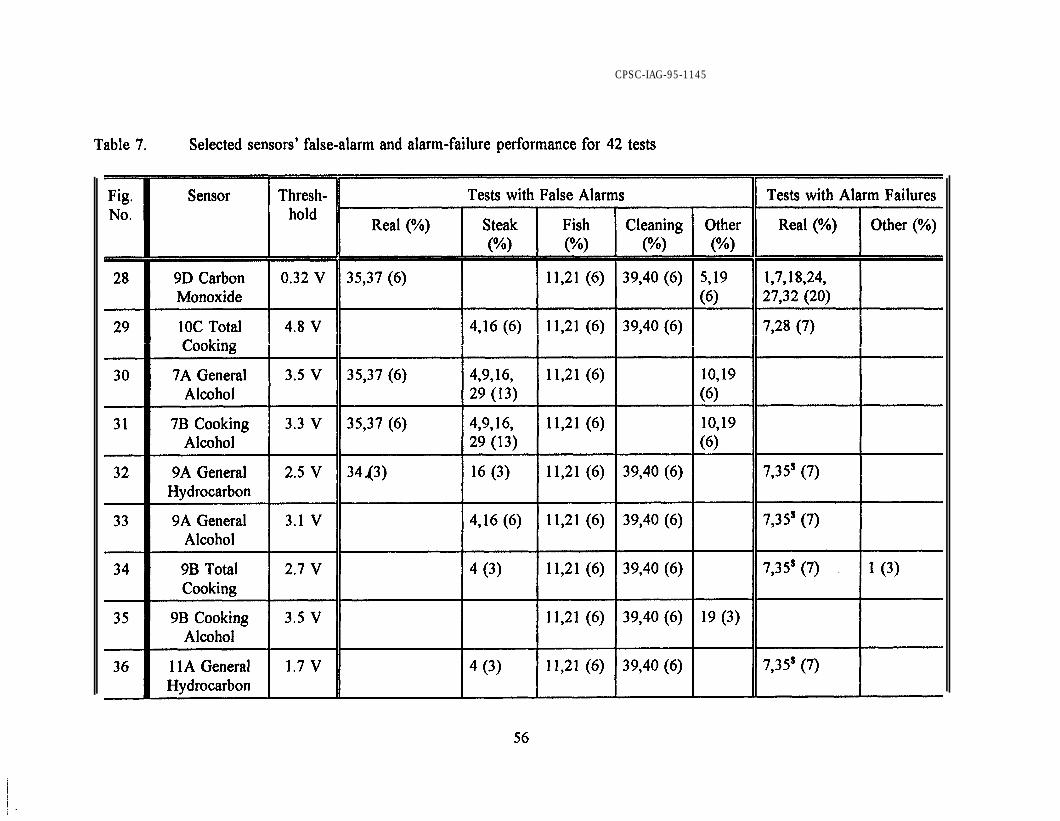
CPSC-IAG-95-1145
Table 7. Selected sensors’ false-alarm and alarm-failure performance for 42 tests
56

n,m_m-

CFSC-JAG%1145
perform as poorly as first stated. The site 9 CO sensor generated 6% false-alarm and 20%failure-to-alarm rates. The site 10 total-cooking-gas sensor generated 0% and 7% rates,respectively.
The responses for the best #gas sensors at sites 7, 9, and 11, which were the three major
sites on the range’s plane of symmetry, are presented in the following figures. These sensorsshowed significant differentiation between normal and pre-fire conditions. None of the gassensors produced complete separation of the conditions sufEcient to allow its use as a singledetector that would have both acceptable false-alarm and failure-to-alarm rates unless the specialcases were considered in the detection scheme. The site 9B cooking-alcohol sensor was mosteffective, and with the use of modifications to the detection system to account for special attendedcooking cases would perform perfectly.
Figures 30 and 3 1 are for gas sensors at site 7. Figure 30 shows the site 7 general-alcoholsensor’s normal maxima and ignition minima for each test. An alarm threshold set at 3.5 Vwould not produce any failures to alarm, but 12 instances of false alarms would have occurredin the 42 tests. Some of the false alarms are special cases as have been noted. The sensorswould have alarmed for all of the broiled-steak tests, the self-cleaning-oven tests, the blackened-catfish tests, and some of the stir-fried-vegetable and multiple-water tests. The remaining teststhat would produce false alarms are 35 and 37 which are both water-and-oil tests heated on thegas range. No failures to alarm would be generated by this sensor. Figure 31 shows thecompiled test results for the site ‘7 cooking-alcohol sensor. With a threshold set at 3.3 V, theidentical set of false alarms would occur as for the site 7 general-alcohol sensor with the samereasoning.
Figures 32 through 35 atre for site 9 gas sensors. Figure 32 shows the generalhydrocarbon-gas sensor’s responses. For a threshold set at 2.5 V, two water-and-oil tests, 7 and35, would result in failure to alarm. Test 35, however, did not proceed to ignition, and the datapoint results from the time when heating was stopped so only one failure to alarm is authentic.Catfish tests 11 and 21, steak test 16, self-cleaning tests 39 and 40, and normal-to-unattendedchicken test 34 would all produce false alarms. Figure 33 shows the plot for the general-alcoholsensor at site 9. With a threshold of 3.1 V, this sensor would perform very similarly as the site9 general-hydrocarbon sensor. The differences would be a false alarm for steak test 4 and nofalse alarm for chicken test 34. Figure 34 shows theplot for the site 9 total-cooking-gas sensor.With a threshold of 2.7 V, it would perform just as the site 9 general-alcohol sensor except steaktest 16 would not produce a false alarm. Figure 35 shows the responses of the cooking-alcoholssensor at site 9. This sensor would produce no failures-to-alann with an alarm threshold of3.5 V. The only false alarms would occur for catfish tests 11 and 2 1, self-cleaning oven tests39 and 40, and water test 19 with the smoking oil on the rear burner. This gas sensor had thebest performance of the site 7 and 9 sensors discussed thus far.
Figures 36 through 39 show the results for the site 11 gas sensors. For the general-hydrocarbon sensor results shown in Figure 36, many of the ignition voltages are much lowerthan for previous sensors and are close to the main body of normal-cooking maxima. A thresholdof 1.7 V would produce the same set of faults as the total-cooking-gas sensor at site 9. Figure37 shows that a threshold of 3 V would produce the same results for the general-alcohol sensoras the site 11 general-hydrocarbon sensor. Other threshold values could be chosen which would
58

Sen
sor
Vo
ltag
e, V
0 cn 4: f;:
1 I
II
I I
I I
II
..
..
..
..
..
..
..
..
..
..
..
..
..
..
..
..
..
..
..
..
..
..
..
..
..
..
..
..
..
..
..q
..-
..
..
..
..
..
..
..
..
..
..
..
..
..
..
..
..
..
..
..
..
..
..
..
..
..
..
..
..
..
..
.*
..a-
..
..
..
..
..
..
..
..
..
..
..
..
..
..
..
..
..
..
..
..
..
..
..
....a
..
..
..
..
..
..
..
..
..
.
I I
II
II
I I
I I
II
I I
I I
II
-..
....
....
....
....
...
....
....
....
...
....
....
....
....
...
....
....
....
....
....
....
...
....
....
....
....
...
....
....
....
....
...
.q
..-
-..
....
....
....
....
...
....
....
....
.
.
....
....
....
....
....
....
...
....
....
....
....
...
....
....
....
....
....
....*
....
....
....
... *
..a
-
-..
....
....
....
....
....
....
....
....
...
....
....
....
....
....
...
....
....
....
....
....
...
....
....
....
....
...
....
....e
....
....
....
....
...
. .. ......
. .... ..
.Z.\
t.. ... ....
. .. ......
........ .
..........
....b...
......
......
.. l
..... ....
.... .
..........
..........
..........
..........
...* .. ......
........ .
.........
... i....... ..
.. .. .. ....
. . .
..
..
..
. .
..
...
..
..
.
..
.. .
..
..
..
..
...
..
..
..
..
..
..
..
..
..
. .
..
. .
. .....
...
...........
..
....
...
...........
....
....
....
....
....
...
....
....
....
....
...
....
....
.
....
..
...
...
........
. ...................
l .
. ...
....
....
....
...
....
....
..
. ...................
...........
.........
I..
....
....
....
....
...
....
....
....
....
....
...
....
....
....
....
....
...
....
...
l...
......
......
......
......
......
......
.....
.
l...
.....
......
......
......
......
.....
.l
......
......
......
......
......
......
......
......
......
......
.....
....
......
......
....
......
......
....:
....
......
......
......
......
...
......
......
......
......
......
......
......
......
...
......
......
......
......
......
......
......
......
......
......
......
.....
-...
......
......
....
......
....
......
......
......
......
......
......
......
......
......
......
......
.....
.
-...
......
......
......
......
......
......
......
......
......
......
......
......
......
......
......
......
.....
.-
.... ⌧
......
......
....
......
......
....
......
......
......
......
......
......
......
......
......
......
......
......
......
......
......
...
I
II
I I
I
I I
I
I
II
I
II

CPSC-IAG-95-114s
1 2
1 0
0 5 10 15 20 25 30 35 40
Test Number
Figure 31. Site 7 cooking-alcohol sensor maximum normal and minimum ignition output 30 sbefore ignition vetlsus test number.
60

Sen
sor
Vo
ltag
e, V
......................
......................
.. ..................
......................
.....................
............... ......
............
......................
....~::::::
::xxK/-:
/..................... . 1...........
........ /.....................
.....................
..................
......................
................ ......
............... .......
......................
............. ........
.....................
............... .......
....... .............
.....................
............. / $.......
...........
k........
....... ..I.... t......
...........
............
...........
............
...........
........~
... 1....”......
...........
.........
......l.
......
......
......
......
......
......
......
......
......
......
......
......
......
......
......
...1.....
...j
I-. .
. . . .
. . . .
. x . .
. . i .
. . . +
. . . .
. . . .
. . . .
. . . I. .
. ..I...............
I. . . .
. . . .
. . . .
. . . .
. . . .
. I. . . .
. . . .
. . . .
. . . .
. . . .
.f . . .*
. . . .
. . . .
. . . .
. . f .
. . . .
. . . 4
. . . . . . . . . . . . . . . . . . . . . . .. . .
. . . . . . . . . . . . .. . . . . . . . . . . . .
. . . . . . . . . . . . . . . . . . . . . . . . . . .
. .. . . . . . . . . . . . . . . . . . . . .. . . .
. . . . . . . . . .. . . . . . . . . . . . . .
. . . . . . . .. . . . . . . . . . . . . . .
kx . . . . . . . . I..Y...] . . . .
i . . . . . . . . . . . . . . /. . . . . . . . . . . . .
. . . . . . . . . . . . . . . . . . . . . . . . . . .
. .. . . . . . . . . . . . . . . . . . . . .. . . . .
. . . . . . .. . . . . . . . . . . . .
. . . . . . . . . .. . . . . . . . . . . . . . .
. . . . . . . . . . . . . . . . . . . . .. . . . . .
. . . . . . . . . . . . . . . . . . . . . . . . . .
. . . . . . . . . .. . . . . . . . . . . . . . . . . .
. . . . . . . . .... . . . . . . . . . . . .
. . . . . . . . ). . . . . . . . . . . . . . . . . . .
. . j. . . . . . . . . . . . . . . . . . . . .1
“:“:i=j
. . . . . . . . . . . . . . . . . . . . . . . . . . . .
.. _ _
_ . .

cPsmAG%1145
14 )IlJljlr~~,. . . . .-_
1
; : : : : : i i.; : : ; ; i : : . ~*--f--#~~f-i i : : : : ; .:;;::::ii:: : : : : ::i .; .. ii:i ; :i : :: :i : . : : : ; i i i : : : i * :: : ; f ; 2. : i ; ; : : . :. : i ‘ii;:. . : : :
o i -, . . . . , i : i q.. ;
0 i3OMin 1
Ti
;.-I-:I::ii::
-y:;::::j-
j;.:-j-:;
::.y-
igiiA..; ,: 4i:;L
0 5 IO 15 20 25 30 35 40
Test Number
Figure 33. Site 9 general-alcohol sensor maximum normal and minimum ignition output 30 sbefore ignition versus test number.
62

Sen
sor
Vo
ltag
e, V
L”
I
-...............................
.....................
I
1 f
...................... t
...............................
I
............
. .
. .
.........................................~
...........i......................
...................... ........
....”....... IV
.........
I-
I...
......
......
......
......
....# .
......
......
......
.,
q....
......
......
......
.+....
......
......
...... t...
......
......
......
....*
. .....
....k
. . .
. . . .
. I.
....
....
.. j(
. . .
. . .
. . f
. . . .
. . . I
....
....
....
.. i
. . .
. . .
. . . .
. . .
. . .
. . .
. . . t
. . .
. . .
. . .
. . .
. . . .
. . . .
. . f...
. . .
. . .
. . .
. . .
...~ . .
I-...
......I
.....W
...
......
......
+.....
..f....
......
....+.
......
......
......
...+*..
......
......
.....j.
......
......
......
.... I
1...
......
l . .
~~
~~
~~
~~
~~
~~
$Y
~.
....
...
..............
......................
......................
.......................
. ..
. .
...f
....
...
....
....
....
..I
......................
1......................
/a..
....
....
....
....
. / p
..I
...
....
.~..
....
...............
......................
......................
.......................
. .. .
...........
............
......I...
.... 1..
..........
;.J..
.i..a......
............
..........
............
...........
............
...........
.......
............
.....
............
..I.........
............
. f......)
(..........
...........
............
...........
.......
...........
..........
..........
............
..A........
............
....~ 1 I
II--
............
...........
............
...........
......
.........
r 1......
.....w..
...........
...........
.........*
..........
............
..........
............
........
...........
..........
............
..1 ’
Iii..
............
...........
............
..........
............
........
il”‘. ......
............
.....r .........q
x. . .
. . .. . .
. . . . . .
. . . . . .
. +.. . .
. . . I..
......
......
i.““
‘.“““
“““‘.
.*..~
......
......
... . . l
1. . . .
. . . .
. . . .
. . . .
. . . .
. . .
. . . . . . . . I -I
..
..
..
..
..
..
..
..
..
..
..
..
..
..
..
..
..
..
..
..
..
..
..
..
..
..
..
..
..
..
..
..
..
..
..
..
..
..
...A
............&
..
..
..
..
..
..
..
..
..
..
..
..
..
..
..
..
..
..
..
....:
..
..
..
..
..
..
..
..
..
..
.ii
..
..
..
..
..
..
..
..
..
..
..
..
..
..
..
..
..
..
..
..
..
..
..
..
..
..
..
..
..
..
...i .
...-
..
..
..
..
..
..
..
..
..
..
..
..
..
..
..
..
..
..
..
..
..
..
..
..
..
..
.Ii
..
..
..
..
..
..
..
..
..
..
..
..
..
..
..
..
..
..
..
..
..
..
..
.
..
..
..
..
..
..
..
..
..
..
..
..
..
..
..
..
..
..
..
..
..
..
..
..
..
..
..
..
..
..
..
..
..
..
..
..
..
..
..
..
..
..
..
..
..
..
..
.0
..
..
..
..
..
..
..
..
..
..
..
..
..
..
..
..
..
..
..
..
..
..
..
..
..
..
..
..
..
..
..
..
..
..
..
..
..
..
..
..
..
..
..
..
..
..
..
..
..
..
.
..
..
..
..
..
..
..
..
..
..
..
..
..
..
..
..
..
..
..
..
..
..
..
..
..
..
..
.G
..
..
..
..
..
..
..
..
..
..
..
..
..
..
..
..
..
..
..
..
..
..
..
..
..
..
..
.
..
..
..
..
..
..
..
..
..
..
..
..
..
..
..
..
..
..
..
..
..
..
..
..
..
..
..
.3
!!
..
..
..
..
..
..
..
..
..
..
..
..
..
..
..
..
..
..
..
..
..
..
..
..
..
..
..
.:
f-
. . . .
. . . .
f . .
. . . .
. . . .
N . .
. . .
. . . +
. . . .
. . . I
....
....
....
.. j.
. . . .
. . . .
. . . .
. . .l
. . .
.�.....
......
......
......
I1. .
. . .
. . .
..*...
........
.. . . . . . . . f�
t,.
....
.. 1”.
. . .
. 1
......... t
......................t
......................
......................................
......... I
;.
........j(......t.......I
......................f
..l
......
...t
......
......
......
.....
1.
......
......
......
....
......
......
......
.....
......
......
......
....
......
......
....T
......
......
......
....
......
......
......
f iI7
..~.
......
......
......
......
......
......
......
.....
......

CPSC-xAG95-1145
12
1 0
8
6
I X nMax l i3OMin
0 5 101 1 5 2 0 2 5 3 0 3 5 4 0
Test Number
Figure 35. Site 9 cooking-alcohol sensor maximum normal and minimum ignition output 30 sbefore ignition versus test number.
64