
NIRCam Detector Behavior
36
1 March 11, 2014 NIRCam Detector Behavior Marcia Rieke
description
NIRCam Detector Behavior. Marcia Rieke. Replacement Detectors Have Been Installed. SFM3. SFM4. L FM3. LFM4. Performance Parameters. Basic Performance Characteristics Linearity regime Saturation levels Subarray behavior -- timing, performance, size constraints P ersistance Stability - PowerPoint PPT Presentation
Transcript of NIRCam Detector Behavior

1
March 11, 2014
NIRCam Detector Behavior
Marcia Rieke

2
March 11, 2014
Replacement Detectors Have Been Installed
SFM3
SFM4
LFM3
LFM4

3
March 11, 2014
Performance Parameters
Basic Performance CharacteristicsLinearity regimeSaturation levelsSubarray behavior -- timing, performance, size constraintsPersistanceStabilityJitter tracking
5 MHz column buffersfast normal shift register + logic
glow
and
cross
talk shield
g low and crosstalk shield
Additional row of reference pixels for diagnostic purposes
2048 x 2048 pixel array(2040 x 2040 sensitive pixels)
4 rows and columns containing reference pixels
4 rows and columns containing reference pixels
serial interface
clock buffers
fast guide shift register + logic
Slow
gui
de s
hift
regi
ster
+ lo
gic
Slow
nor
mal
shi
ft re
gist
er +
logi
c
decoders for horizontal start and stop address
I/O Pads & output buffers
deco
ders
for v
ertic
al s
tart
and
sto
p ad
dres
s
SW and LW arms view same patch of sky but with different pixel scales.
Two variants on full frame mode:
Subarray uses a single output and can be positioned any where.
Stripe reads out a number of rows through 4 outputs, restricted to 2048xnrows.
NIRCam uses “Sample Up the Ramp” aka Multiaccum but may have co-adds.

4
March 11, 2014
QE and Noise QE: (values from Teledyne tests) SW ≥ 0.80 at 2.0 microns LW ≥ 0.80 at 3.5 microns SFM3 SFM4 LFM3 LFM416991: 0.80 16989: 0.92 17161: 0.87 17158: 0.8317005: 0.92 17023: 0.9317011: 0.95 17024: 0.9117047: 0.92 17048: 0.88 Total Noise: (values from Arizona tests) Requirement is ≤ 9.0 e- in 1000 secs, all noise sources included SFM3 SFM4 LFM3 LFM416991: 5.9e- 16989: 6.0e- 17161: 8.4e- 17158: 7.9e-17005: 5.7e- 17023: 6.0e-17011: 6.4e- 17024: 6.4e-17047: 6.0e- 17048: 5.8e-
Correlated Double Sample Noise:(values from Arizona tests)Requirement is ≤ 21 e SFM3 SFM4 LFM3 LFM416991: 15.2 e- 16989: 15.1 e- 17161: 15.6e- 17158: 15.2 e-17005: 14.2 e- 17023: 15.2 e-17011: 17.8 e- 17024: 18.1 e-17047: 11.1 e- 17048: 11.7 e-

5
March 11, 2014
Sample QE Data From Teledyne
LFM4 17158LFM3 17161
SFM3 16991 SFM4 17048
The SW parts shown have the lowest QEs of all the SW parts.

6
March 11, 2014
Sample Total Noise Measurements
SFM4 17023SFM3 17011
LFM3 17161
Upturn due to light leak
Upturn due to light leak
LFM4 17158
Blue = CDS Red = Total Noise

7
March 11, 2014
SW Illuminated Images
SFM3 SFM4GL Dewar illumination pattern has not been removed from these images.

8
March 11, 2014
LW Illuminated Images
LFM3 LFM4
Test dewar illumination pattern has not been removed from these images.

9
March 11, 2014
Linearity
0 200 400 600 800 1000 1200 14000
5000
10000
15000
20000
25000
30000
35000
40000
Data Linear Fit
Time (seconds)
Sign
al D
N (1
DN
=3.0
e-)
80%
50%
The unit cell for the H2RG arrays with its source follower circuit is inherently non-linear. We have demonstrated that the non-linearity can be adequately corrected to 90% of full well. The final linearity calibration will be derived from ISIM-level testing using the ASICs.

10
March 11, 2014
Well Depths
The well depth is required to be greater than 60,000 e- with a detector back bias of 0.25 volts.
90% Fill Well Depths (e-) SFM3 SFM4
16991: 91800 16989: 98800 17005: 99400 17023: 102600 17011: 92900 17024: 93700 17047: 90200 17048: 91000
LFM3 – 17161: 78400LFM4 – 17158: 76500
From Arizona tests and analysis.

11
March 11, 2014
Saturation LevelsSaturation levels have been computed for as-built telescope and NIRCam, and assume 80% well fill for LW parts (eg. 60,000 e-).Parameters:Telescope area: 25.37 m2 Telescope reflectivity >1.6l mm: 0.94Grism throughput: 0.45Grism R: 1600Detector QE: 0.85
Filter NIRCam Throughput
Background e-/sec/pixel
Johnson L limit
Johnson V, K for G2V
L limit for imaging
F277W 0.54 0.5 2.6 4.1, 2.65 7.1
F322W2 0.54 0.9 2.6 4.1, 2.65 7.8
F356W 0.59 0.4 2.7 4.2, 2.75 7.2
F410M 0.58 0.2 2.7 4.2, 2.75 6.1
F444W 0.58 1.2 2.7 4.2, 2.75 7.1
Saturation Limits for 32x2048 Grism Subarray, 32x32 Imaging Subarray
Fraction of flux in brightest pixel: 0.15
How many candidate stars are we likely to miss with these limits?

12
March 11, 2014
Subarrays/Stripe Mode
Size FOV (arcsec) Frame
Comment (pixels) SW LW (msec)
16x16 0.512 1.04 9.56 Smallest useful LW subarray without target acquisition (TA)32x32 1.02 2.08 19.00 LED imaging; Smallest useful SW subarray w/out TA64x64 2.05 4.16 53.24 Nominal LW TA subarray
96x96 3.07 6.24 107.96Small-defocus transit photometry, SW channel; WFSC fine-phasing and routine monitoring operations
128x128 4.10 8.32 183.16 Nominal SW TA subarray160x160 5.12 10.4 278.84 Large-defocus transit photometry, SW channel320x320 10.24 20.8 1064 Nominal LW coronagraphic subarray640x640 20.48 41.6 4172 Nominal SW coronagraphic subarray
102416 N/A67 1.0
170.84LW grism spectroscopy (TA may be required)
2048x32 N/A134 x2.0
683.36 Includes top,bottom ref pixels, allows for some curvature in spectrum
• Subarrays need to be sized in 64 pixel increments but can be any rectangular location
• Subarrays are read out through a single output amplifier• Stripe mode gives regions of nrowsx2048 pixels through 4 output amplifiers• Timings below are approximate and will include ~0.5% overheads for rolling
reset of the rest of the array• Performance is similar to full array (eg. CDS noise) but “reset anomaly” is
very apparent

13
March 11, 2014
Series of Subarray Dark Ramps
0 20 40 60 80 100 120 140 160 180 20026700
26750
26800
26850
26900
26950
27000
27050
27100
27150
27200
Sample
DC
LEVE
L
Output of a single pixel in a 160x160 subarray with 20-samples per ramp. Reset behavior will be different with ASIC readout (and will be checked during Thermal-Vac). Baseline varies due to kTC noise (~35 electrons).

14
March 11, 2014
Latent Images
We have taken data to allow a calibration of the form below where the two time constants are ~60 seconds and ~1000 seconds.
Our latent data were taken using flood illumination (have a check that point source illumination produces the same result). Acquisition started from having the array in the dark followed by illumination, followed by 4000 secs of dark. Rapid illumination produces smaller latents than slow illumination.Latents are smaller in 5-micron cut-off arrays than in the 2.5 micron devices.
10 100 1000 100000
0.1
0.2
0.3
0.4
0.5
0.6
0.7
0.8
0.9
17005
vvh vh hrate mrate srate rate
Time since illumination
Pea
k po
st il
lum
rat
e D
N /
s
10 100 1000 100000
0.1
0.2
0.3
0.4
0.5
0.6
0.7
17005
Medium 0.37 Medium high 0.53 high 0.70vhigh 1.0 vvh 1.4 max 1.7
Time since illumination (sec)
Post
Illu
min
ation
Rat
e (D
N/s
)
Rate Dependence Well Fill Dependence
15
March 11, 2014
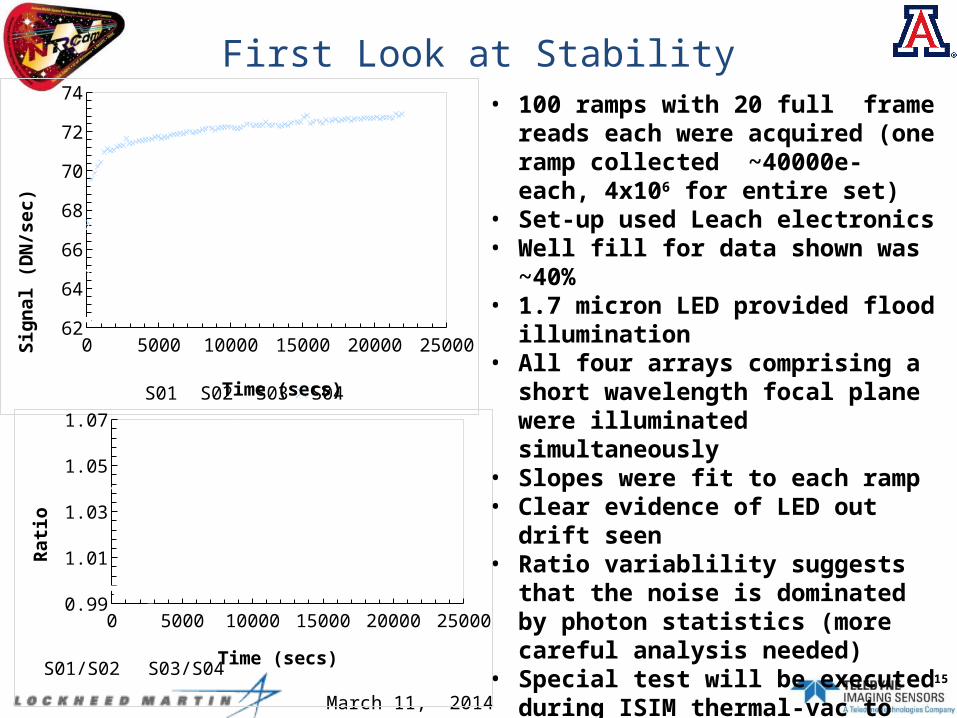
First Look at Stability
0 5000 10000 15000 20000 2500062
64
66
68
70
72
74
S01 S02 S03 S04Time (secs)
Sign
al (D
N/s
ec)
0 5000 10000 15000 20000 250000.99
11.011.021.031.041.051.061.07
S01/S02 S03/S04Time (secs)
Ratio
• 100 ramps with 20 full frame reads each were acquired (one ramp collected ~40000e- each, 4x10⁶ for entire set)
• Set-up used Leach electronics• Well fill for data shown was ~40%• 1.7 micron LED provided flood
illumination• All four arrays comprising a short
wavelength focal plane were illuminated simultaneously
• Slopes were fit to each ramp• Clear evidence of LED out drift seen• Ratio variablility suggests that the
noise is dominated by photon statistics (more careful analysis needed)
• Special test will be executed during ISIM thermal-vac to look at this using ASICs

16
March 11, 2014
Jitter Tracking
Rectangle is 32 pixels wide
+4 Waves Weak Lens ImageIf desirable, the short wavelength arm could be used to observe the target star simultaneously with a grism or filter in the long wavelength arm.
Use of a 1% filter and/or weak lenses to spread out the light would likely be required.
There may also be operational constraints on the shape of the region to be readout (might have to be the same size as the LW subarray). A 32x2048 subarray would give pointing information every 1.31 to 1.98 seconds. Is this mode worth pursuing? And a corollary, should we measure in SW and LW arms simultaneously?

17
March 11, 2014
Other Issues• Adjacent pixels are not completely independent of each
other – they are capacitatively coupled at the 0.5-1% level. Called “IPC”, Interpixel Capacitance
1484 1485 1486 1487 1488
1605 0.003 0.003 0.002 0.003 0.002
1604 0.001 0.003 0.003 0.002 0.003
1603 0.003 0.004 0.019 0.004 0.002
1602 0.002 0.02 2.847 0.02 0.002
1601 0.002 0.004 0.018 0.003 0.002
1600 0.003 0.003 0.003 0.003 0.003
1599 0.003 0.002 0.003 0.003 0.003
Illustrated using a hot pixel.
• Arrays have “Random Telegraph Noise” (popcorn noise)• Pixel will spontaneously jump in its DC-Level, may return to
baseline even within same ramp• Quoted noise includes the effect• Is a rare occurrance, need to analyze existing data to check
whether some pixels are “repeaters”, measure rates• NIRCam is close to properly sampled spatially but still will
be vulnerable to small amounts of “missing” charge due to centration

18
March 11, 2014
Backup Information

April 10, 2013
16989
Dark Illuminated
19

April 10, 2013
16989 Latent ImagesLatent Map
10 100 1000 100000
0.05
0.1
0.15
0.2
0.25
0.3
0.35 16689
vvh vh hrate mrate srate rate
Time since illumination
Pea
k po
st il
lum
rate
AD
U/s
20
1000 10000 100000-0.01
-1.73472347597681E-18
0.01
0.02
0.03
0.04
Time (sec)
Rate
(Dn/
sec ,
1 D
N=2.
8e-)
10 100 1000 10000 1000000
0.1
0.2
0.3
0.4
0.5
0.6
0.7
16689 - 1st Set 16689 - 2nd set 17023 - pre 1
Time (sec)
Rate
(Dn/
sec ,
1 D
N=2
.8e-
)

April 10, 2013
16991
Dark Illuminated
21
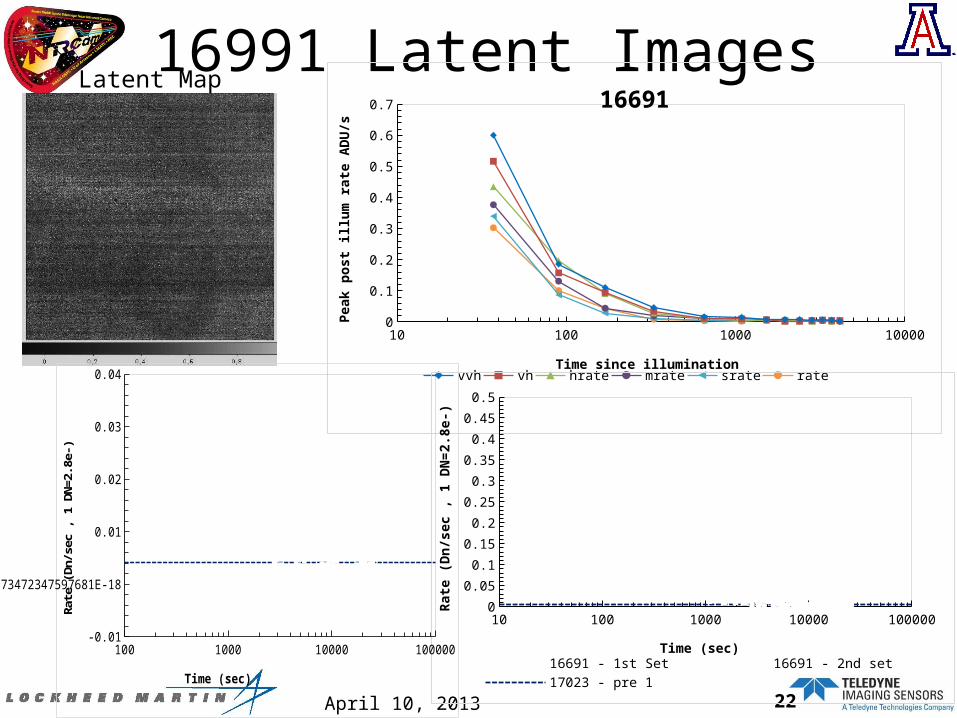
April 10, 2013
16991 Latent ImagesLatent Map
10 100 1000 100000
0.1
0.2
0.3
0.4
0.5
0.6
0.7 16691
vvh vh hrate mrate srate rateTime since illumination
Peak
pos
t illu
m ra
te A
DU/s
22
10 100 1000 10000 1000000
0.05
0.1
0.15
0.2
0.25
0.3
0.35
0.4
0.45
0.5
16691 - 1st Set 16691 - 2nd set 17023 - pre 1
Time (sec)
Rate
(Dn/
sec ,
1 D
N=2
.8e-
)
100 1000 10000 100000-0.01
-1.73472347597681E-18
0.01
0.02
0.03
0.04
Time (sec)
Rate
(Dn/
sec ,
1 D
N=2.
8e-)

17005
Dark Illuminated
23

17005 Latent ImagesLatent Map
10 100 1000 100000
0.1
0.2
0.3
0.4
0.5
0.6
0.7
0.8
0.917005
vvh vh hrate mrate srate rateTime since illumination
Pea
k po
st il
lum
rate
ADU
/s
10 100 1000 10000 1000000
0.1
0.2
0.3
0.4
0.5
0.6
0.7
0.8
0.9
17005 - 1st Set 17005 - 2nd set 17005 - pre 117005 - pre 2
Time (sec)
Rate
(Dn/
sec ,
1 D
N=2
.8e-
)
100 1000 10000 100000-0.01
-1.73472347597681E-18
0.01
0.02
0.03
0.04
Time (sec)
Rate
(Dn/
sec ,
1 D
N=2
.8e-
)
24

17011
Dark Illuminated
25
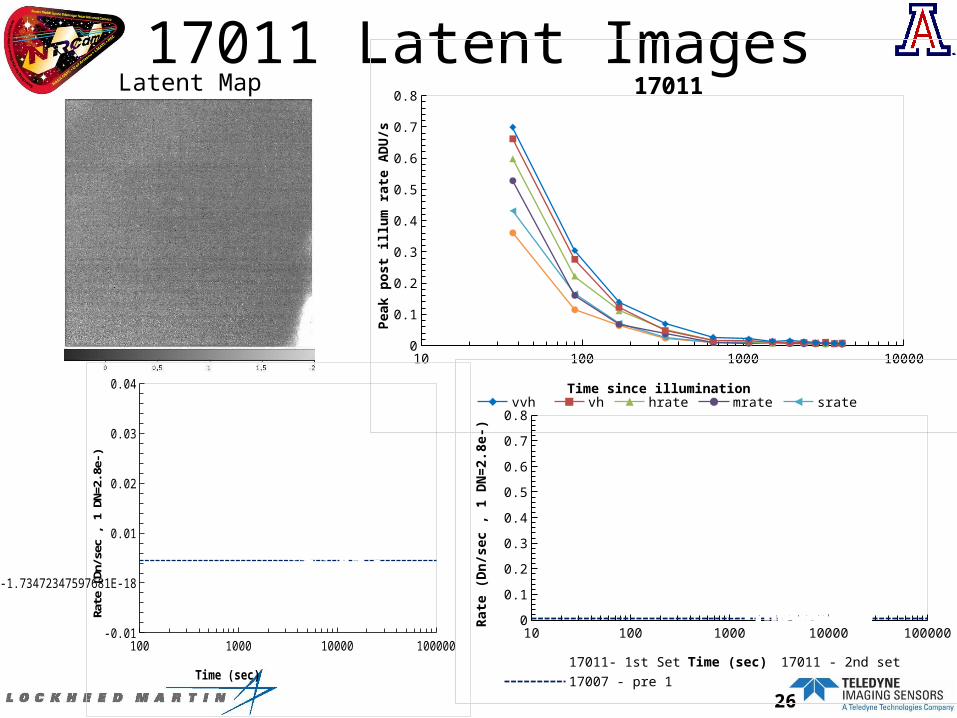
17011 Latent ImagesLatent Map
10 100 1000 100000
0.1
0.2
0.3
0.4
0.5
0.6
0.7
0.817011
vvh vh hrate mrate srate rate
Time since illumination P
eak
post
illu
m ra
te A
DU/s
26
100 1000 10000 100000-0.01
-1.73472347597681E-18
0.01
0.02
0.03
0.04
Time (sec)
Rate
(Dn/
sec ,
1 D
N=2.
8e-)
10 100 1000 10000 1000000
0.1
0.2
0.3
0.4
0.5
0.6
0.7
0.8
17011- 1st Set 17011 - 2nd set 17007 - pre 1Time (sec)
Rate
(Dn/
sec ,
1 D
N=2
.8e-
)

17023
Dark Illuminated
27

17023 Latent ImagesLatent Map
10 100 1000 100000
0.1
0.2
0.3
0.4
0.5
0.6
0.7
0.8 17023
vvh vh hrate mrate srate rate
Time since illumination
Pea
k po
st il
lum
rate
ADU
/s
28
10 100 1000 10000 1000000
0.1
0.2
0.3
0.4
0.5
0.6
0.7
0.8
17023 - 1st Set 17023 - 2nd set 17023 - pre 1Time (sec)
Rate
(Dn/
sec ,
1 D
N=2
.8e-
)
1000 10000 100000-0.01
-1.73472347597681E-18
0.01
0.02
0.03
0.04
Time (sec)
Rate
(Dn/
sec ,
1 D
N=2.
8e-)

17047
Dark Illuminated
29

17047 Latent ImagesLatent Map
10 100 1000 100000
0.1
0.2
0.3
0.4
0.5
0.6
0.7
0.8 17025
vvh vh hrate mrate srate rate
Time since illumination P
eak
post
illu
m ra
te A
DU/s
30
100 1000 10000 100000-0.01
-1.73472347597681E-18
0.01
0.02
0.03
0.04
Time (sec)
Rate
(Dn/
sec ,
1 D
N=2.
8e-)
10 100 1000 10000 1000000
0.10.20.30.40.50.60.70.80.9
1
17025- 1st Set 17025- 2nd set 17023 - pre 1
Time (sec)
Rate
(Dn/
sec ,
1 D
N=2
.8e-
)

17024
Dark Illuminated
31

17024 Latent ImagesLatent Map
10 100 1000 100000
0.1
0.2
0.3
0.4
0.5
0.6
0.7 17047
vvh vh hrate mrate srate rate
Time since illumination P
eak
post
illu
m ra
te A
DU/s
32
100 1000 10000 100000-0.01
-1.73472347597681E-18
0.01
0.02
0.03
0.04
Time (sec)
Rate
(Dn/
sec ,
1 D
N=2.
8e-)
10 100 1000 10000 1000000
0.1
0.2
0.3
0.4
0.5
0.6
0.7
0.8
17047 - 1st Set 17047 - 2nd set 17023 - pre 1
Time (sec)
Rate
(Dn/
sec ,
1 D
N=2
.8e-
)

17161 = Long Wavelength Replacement #1 (LFM3)
Dark Illuminated

17161
10 100 1000 10000 1000000
0.05
0.1
0.15
0.2
0.25
0.3
0.35
0.4
0.45
Tconstant1 Tconstant2 darkTime since illumination
AD
U/s
ec
10 100 1000 10000 1000000
0.010.020.030.040.050.060.070.080.09
0.1
Tconstant1 Tconstant2 darkTime since illumination
AD
U/s
ec
10 100 1000 100000.00
0.05
0.10
0.15
0.20
0.25
0.30
vvlow vlow low medium high
Time since illumination
Pea
k po
st il
lum
rate
A
DU
/s

17158 = Long Wavelength Replacement #2 (LFM4)
Dark Illuminated

17158
10 100 1000 100000.00
0.05
0.10
0.15
0.20
0.25
0.30
0.35
vvlow vlow low medium high vhigh
Time since illumination
Pea
k po
st il
lum
rate
A
DU
/s
10 100 1000 10000 1000000
0.1
0.2
0.3
0.4
0.5
0.6
Tconstant1 Tconstant2 dark
Time since illumination
AD
U/s
ec
10 100 1000 10000 1000000
0.02
0.04
0.06
0.08
0.1
Tconstant1 Tconstant2 darkTime since illumination
ADU
/sec


