
Nimbus-7 Earth Radiation Budget Compact Solar … Reference Publication 1346 1994 Nimbus-7 Earth...
56
NASA Reference Publication 1346 1994 Nimbus-7 Earth Radiation Budget Compact Solar Data Set User's Guide H. Lee Kyle Goddard Space Flight Center Greenbelt, Maryland Lanning M. Penn Douglas Hoyt Brenda J. Vallette Research and Data Systems Corporation Greenbelt, Maryland Douglas Love Sastri Vemury Scientific Management and Applied Research Technologies, Inc. Silver Spring, Maryland https://ntrs.nasa.gov/search.jsp?R=19950006254 2018-07-13T01:52:05+00:00Z
Transcript of Nimbus-7 Earth Radiation Budget Compact Solar … Reference Publication 1346 1994 Nimbus-7 Earth...

NASAReferencePublication1346
1994
Nimbus-7 Earth Radiation Budget
Compact Solar Data SetUser's Guide
H. Lee Kyle
Goddard Space Flight Center
Greenbelt, Maryland
Lanning M. Penn
Douglas HoytBrenda J. Vallette
Research and Data Systems CorporationGreenbelt, Maryland
Douglas Love
Sastri Vemury
Scientific Management and
Applied Research Technologies, Inc.
Silver Spring, Maryland
https://ntrs.nasa.gov/search.jsp?R=19950006254 2018-07-13T01:52:05+00:00Z

This publication is available from the NASA Center for AeroSpace Information,
800 Elkridge Landing Road, Linthicum Heights, MD 21090-2934, (301) 621-0390.

TABLE OF CONTENTS
Section Pa_p__age
1. INTRODUCTION .............................................. 1
. THE MEASUREMENT ENVIRONMENT ............................... 1
2.1 Sun in View ............................................. 1
2.2 Scheduling .............................................. 22.3 Off-Axis Pointing .......................................... 4
. THE SUMMARY SOLAR TAPES (SST) ................................ 6
3.1 Contents Summary ......................................... 6
3.2 Summary of Problems and Suggested Corrections ...................... 6
. THE CHANNEL 10C SOLAR TAPES (CST) ............................. 9
4.1 The Counts Tapes .......................................... 9
4.2 Data Sorting and Calibration ................................... 94.2.1 Criteria for Reiecting Data as Noisy ........................ 10
4.2.2 The Channel 10c Calibration Equation ....................... 104.3 Electrical Calibration Data ................................... 12
4.4 Orbital Mean Counts and Earth-Sun Distances ....................... 26
4.5 Calibrated Orbital Irradiances ................................. 28
. PHYSICAL STRUCTURE OF THE TAPES (SST AND CST) ................. 34
5.1
5.25.3
5.4
5.5
5.6
5.75.8
Tape Origins ............................................ 34Gross Format of SST ...................................... 34
Standard Header Record Format ................................ 35Format of the SST Data Files ................................. 37
Gross Format of CST ...................................... 39
Format of the CST Data Files ................................. 40
Program to Read the Solar Summary Tape (SST) ..................... 41
Program to Read the Channel 10c Sununary Tape (CST) ................ 45
REFERENCES .................................................... 50
°°°ili


1. INTRODUCTION
The Nimbus-7 Earth Radiation Budget (ERB) solar measurements extend over 15 years from November
16, 1978 to mid-December 1993. Included are the peaks of solar cycles 21 and 22. The ERB experiment
was designed to measure three components of the Earth's radiation budget: the total irradiance from theSun plus the broad spectral components, the Earth's reflected solar radiation, and the thermal radiation
emitted by the Earth. Initially planned to operate only 1 or 2 years, both the Nimbus-7 satellite and the
ERB experiment have operated some 15 years. The calibrated Earth flux and total solar irradiance
products have been well documented and widely distributed (Jacobowitz, et al., 1984; Kyle, et al., 1985,
1993a,b, 1994; Hoyt, et al., 1992). However, the original data set left the raw counts solar measurements
scattered over about 170 tapes where they were mixed with the Earth flux measurements. These raw solar
counts have now been gathered together for easier review. This compact data set is described by the
present document.
The present calibration procedures are described in some detail in Hoyt, et al. (1992) and Kyle, et al.(1993b). The condensed solar data set and this document are meant for those individuals who wish to
examine the actual measurements. The user of this data set should also obtain and read Kyle, et al.
(1993b), although a few excerpts from this document will be repeated below.
The ERB solar telescope contained ten sensors but only seven real spectral pass bands; these are shown
in Table 1. Channels 1 and 2 are similar to the Earth-viewing channel 13 and measure most of the
incident solar spectrum. Channels 3 and 10c have no covering and are, therefore, sensitive to an even
broader spectral region. A series of overlapping spectral bands are measured by channels 4 to 9. Only
channel 10c (c for cavity) had on-board calibration capabilities. The data from channels 1-9 have not been
widely used because of uncertainties in the inflight characterization of these sensors (Kyle et al., 1993b).
Channel 10c is much better understood (Hoyt et al., 1992).
Since the channel 10c data have the widest distribution, two compact solar counts data sets were formed.
The larger contains the measurements from all ten channels and is called the Summary Solar Tape (SST)
set. There are fourteen 38,000-bpi, 3480 tape cartridges, about one per year, with 1978 and 1979
measurements combined on one tape as are the 1992 and 1993 results. The channel 10c Solar Tape (CST)
set consists of two tape cartridges plus the calibrated orbit-by-orbit irradiances and some inflight
calibration data on PC computer disks.
2. THE MEASUREMENT ENVIRONMENT
2.1 Sun in View
The ERB instrument is mounted on the leading (front) side of the Nimbus-7 satellite with its solar
telescope facing forward and its Earth flux channels looking towards the Earth. The satellite is in a nearly
circular, 955-km high, Sun-synchronous orbit, with a retrograde inclination to the equator of 99.3 °. Theorbital period is 104 minutes so there are 13.85 orbits per day. The solar sensors see the Sun once perorbit as the satellite crosses the sunrise terminator near the South Pole.

Table 1. Characteristics of ERB Solar Channels
Wavelength Limits Noise Equivalent
Channel (#m) Filter lrradiance (W • m 2)
1" 0.2 to 3.8 Suprasil W 1.77 x 10 2
2 •
3
4
0.2 to 3.8
10ct
(0.2 to) 50
0.536 to 2.8
Suprasil W
None
OG530
1.77 x 10 -2
1.43 x 10 -2
1.94 x 10 .2
5 0.698 to 2.8 RG695 1.91 x 10 .2
6 0.398 to 0.508 Interference Filter 3.58 x 10 .2
7 0.344 to 0.460 Interference Filter 5.73 x 10 .2
Interference Filter
Interference Filter
None
0.300 to 0.410
0.275 to 0.360
(0.2 to) 50
7.55 x 10 z
0.94 x 10 .2
2.39x IO 2
The unencumbered field of view for all channels is 10°; the maximum field is 26 ° for
channels 1 through 8 and 10c. The maximum FOV for channel 9 is 28 °. All are types ofEppley wire-bound thermopiles.
* Channels 1 and 2 are redundant; Channel 1 is normally shuttered. Its shutter, whenopened for comparison measurements, covers channel 3.
t Channel 10c is a self-calibrating cavity channel added to Nimbus-7 and replacing aUV channel (0.246 to 0.312 #m) on Nimbus-6.
The solar sensors view cold, deep space during most of the orbit and these data are of interest only for
calibration purposes. All of the ERB data are recorded on the ERB Master Archive tapes (MATs). There
is one MAT for every three data-day period. The wide-field-of-view (WFOV) Earth flux measurements
and the solar observations are pulled off onto a monthly solar and Earth flux data tape (SEFDT). The
measurements are grouped into 16-second packages called major frames. Thus, there are 390 major
frames in each 104-minute orbit, but only 55 major frames per orbit of solar data are placed on the
SEFDTs. There are 51 major frames centered at to, the time at the middle of the solar observation. For
calibration purposes, there are also two major frames at (to-minus 13 minutes) and two at (to plus 13minutes). These 55 major frames, per orbit of solar data have been collected from the SEFDTs and
placed on the SST and CST compact tapes for ease of access.
2.2 Scheduling
Solar measurements were made from November 1978 to December 1993 but scheduling and other
problems caused some data gaps. The major gaps are enumerated and discussed in Table 2. At launch,
the Nimbus-7 satellite carried instruments for eight different scientific programs. There was not enough
power to operate all of these instruments simultaneously so they were placed on a powersharing schedule.
For the first several years, the ERB instrument was normally on a 3-day-on/I-day-off schedule. In later
years, when a number of the other instruments had failed, the ERB instrument was kept on full time.
2
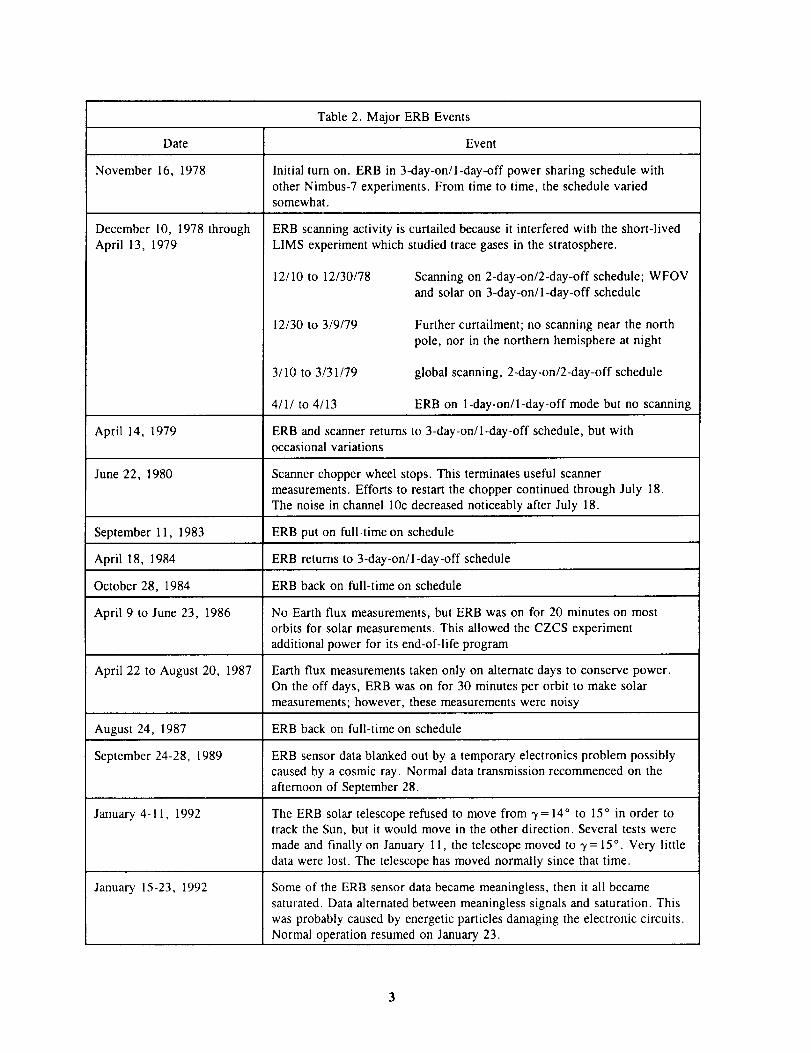
Table2. MajorERBEvents
Date Event
November16,1978 Initialturnon.ERBin3-day-on/I-day-offpowersharingschedulewithotherNimbus-7experiments.Fromtimetotime,theschedulevariedsomewhat.
December10,1978through ERBscanningactivityisApril 13,1979 LIMSexperimentwhich
12/10to 12/30/78
12/30to3/9/79
curtailedbecauseit interferedwiththeshort-livedstudiedtracegasesin thestratosphere.
Scanningon2-day-on/2-day-offschedule;WFOVandsolaron3-day-on/I-day-offschedule
Furthercurtailment;noscanningnearthenorthpole,norin thenorthernhemisphereatnight
3/10to3/31/79 globalscanning,2-day-on/2-day-offschedule
4/1/to4/13 ERBon1-day-on/I-day-offmodebutnoscanning
April14,1979 ERBandscannerreturnsto3-day-on/I-day-offschedule,butwithoccasionalvariations
June22,1980 Scannerchopperwheelstops.Thisterminatesusefulscannermeasurements.Effortsto restartthechoppercontinuedthroughJuly18.Thenoiseinchannel10cdecreasednoticeablyafterJuly18.
September11,1983 ERBputonfull-timeonschedule
April18,1984 ERBreturnsto3-day-on/I-day-offschedule
October28,1984 ERBbackonfull-timeonschedule
April9 toJune23,1986 NoEarthfluxmeasurements,butERBwasonfor20minutesonmostorbitsforsolarmeasurements.ThisallowedtheCZCSexperimentadditionalpowerforitsend-of-lifeprogram
April22toAugust20,1987 Earthfluxmeasurementstakenonlyonalternatedaystoconservepower.Ontheoff days,ERBwasonfor30minutesperorbittomakesolarmeasurements;however,thesemeasurementswerenoisy
August24,1987 ERBbackonfull-timeonschedule
September24-28,1989 ERBsensordatablankedoutbyatemporaryelectronicsproblempossiblycausedbyacosmicray.Normaldatatransmissionrecommencedontheafternoonof September28.
January4-11,1992
January15-23,1992
The ERB solar telescope refused to move from 3,= 14 ° to 15 ° in order totrack the Sun, but it would move in the other direction. Several tests were
made and finally on January 11, the telescope moved to 3,= 15 °. Very little
data were lost. The telescope has moved normally since that time.
Some of the ERB sensor data became meaningless, then it all became
saturated. Data alternated between meaningless signals and saturation. This
was probably caused by energetic panicles damaging the electronic circuits.
Normal operation resumed on January 23.

Table2.MajorERBEvents
Date Event
June17-September2, 1992 TheSunwasnotclearlyvisibleduring this period. The solar telescope can
move only over the range, 3,= +20 ° . The precession of the orbit over the
years combined with the seasonal progression of the Sun relative to thesatellite moved the Sun out of the unrestricted field of view of channel 10c
during this period.
January 25, 1993 The continued precession of the orbit again moved the Sun out of theunrestricted field of view of channel 10c.
February 9, 1993 ERB electronics turned off.
Fall 1993
April 10, 1994
October 4October 12
October 17
October 25
October 27
November
December 12
December 31
January 4, 1994
ERB turned on for warmup.
Started recording data.
Electronic problems started.Sun in view but data bad.
Problems, no data products through November 11.
Some or all data missing on November 13, 14, 24, 25,
26, 27.
Sun at edge of clear field of view.End of recorded data.
ERB turned off.
April 10, 1994 Spacecraft stopped communicating. Brief random contacts
occurred later. Everything appeared normal except for the
communications problem.
The satellite orbit drifted slowly, and eventually this moved the Sun out of the solar sensors field-of-view.
This terminated the experiment in December 1993. The direction of the Sun with respect to the satellite
also varied seasonally. This caused the Sun to be out of view during the summer of 1992 and during
almost all of 1993. Intermittent electronic problems also caused the loss of a few days of data during the
later years. The worst case occurred in the fall of 1993 when approximately 3 weeks of possible
measurements were lost due to electronic problems. It is theorized that the electronic problems were
initialized by energetic particles temporarily damaging one or more solid-state components in the ERB
electronics. In each case, the ERB electronics returned to normal after a period of time.
Only the MATS were made for October 1994. The data were not considered of general interest because
of the poor quality of much of it, so no SEFDT was produced for this month. SEFDTs were produced
for November and December 1994. From November 12 on, missing data occurred due both to data
transmission problems and instrument electronic problems.
2.3 Off-Axis Pointing
The solar sensors have a 10 ° unobstructed field-of-view (FOV) and it was planned that the Sun would
pass through, or close to, the center of the FOV during the measurement. If this does not occur, the solar
measurement is termed "off-axis." At the time of the measurement, the satellite to Sun direction varies
seasonally. To compensate for this, the ERB solar telescope is moved in 1 ° steps to match the solar
direction. Ideally this would cause the Sun to pass within one-half degree of the FOV center for all
measurements. The pointing of the telescope away from the satellite orbit plane is given by the -r-angle,
and this angle is recorded in the ERB data stream at the satellite. In 1989, it was discovered that the ERB

scale that recorded the 3,-angle had slipped, during the experiment, by 1 ° (Hoyt et al., 1992; Kyle et al.,
1993b). Thus, during much of the experiment, the Sun had passed about 1 ° to one side of the center ofthe FOV.
After this discovery, no effort was made to correct the pointing of the solar telescope. But data were
collected to allow corrections to be accurately made for off-axis measurements. To date, the actual
corrections have only been made for channel 10c, but they can also be made for the other channels. As
discussed in Kyle et al. (1993b) and in Section 3.2, some of the sensors (channel 5 for instance) are quite
sensitive to off-axes pointing.
The channel 5 solar transit measurements, in counts, for three different off-axis angles are shown in
Figure 1. The Sun was quite stable during this period so that the off-axis angle, g, is the major variable.
Channels 1-9 had fairly reflective baffles. This causes a local minimum in the signal when the Sun is in
the center of the field of view. Away from the center, the increased reflection from the baffles actually
causes the signal to rise until the Sun begins to leave the clear field of view. Notice that the localminimum value increases as the off-axis angle increases until the local minimum vanishes entirely. The
shape of the solar transit curve varies from channel to channel and a few such as channel 9, show
practically no local minimum at any angle.
1710-
Channel 5 Counts
1700-
1690-
1680-
1670-
1660:
_ 1650-
1640-
1630.
1620_
1610-
1600--90-80-70-60-50-40-30-20-10 0 10 20 30 40 50 60 70 80 90100
Seconds
Orbit Nos. I --_- 65902 _ 6590565913
Figure 1. Channel 5 solar transits for off-axis angles of (g = -0.I °, orbit 65,902), (g = -1.2 °, orbit65, 905), and g = -4.2 o, orbit 65,913).

In the SEFDT algorithm, the on-Sun time to was determined by finding the center of the local minimumon channel 5. If no minimum was found, to was set to the southern terminator for the selection of solar
data records. The true on Sun time occurs when the solar elevation angle (see Table 13) passes through
zero. Since problems occurred from time to time with the recorded value of this angle, this method was
not used in the production program. Channel 10c is a cavity radiometer with black painted baffles and
it shows a signal maximum at to. When the channel 10c data were reprocessed (Hoyt et al., 1992), to wastaken as the time associated with this maximum.
Any reanalysis of the solar data should include an analysis of the off-axis response of the channels beingstudied. An attempt was made to measure these before launch, but the solar simulator used was not stable
enough to yield accurate results. Therefore, several inflight tests were made to measure the response asa function of the off-axis angle, g. These tests and the measured response function for channel 10c are
described by Kyle et al. (1993b). A summary appears in Hoyt et al. (1992). The test data are in both the
SEFDT and SST archives. We plan to also determine the response functions for the other solar channels,but this has not yet been done.
3. THE SUMMARY SOLAR TAPES (SST)
3.1 Contents Summary
These tapes contain all of the solar channel data that were on SEFDTs. This includes the actual solar
channel read out in counts, housekeeping data, and orbital averages. The housekeeping data include the
time, geometric angles, sensor temperatures, and the Earth-Sun distance. The orbital averages arecollected in separate files and include the mean sensor counts and the calculated irradiances when the Sunis near the center of the field of view.
There were numerous problems with the MAT and SEFDT calibration algorithms. After considerable
study, the ERB Nimbus Experiment Team (NET) decided to process the data with the existing, imperfectMAT and SEFDT algorithms. As improved algorithms were developed, the MATs, and in some cases
the SEFDTs, were used as input tapes for the reprocessing. Only the corrected Earth flux data were
placed back on the SEFDTs using a program called SEFDT FIX. Funding for the Earth flux calibration
program was eventually terminated; thus, the Earth flux irradiances for channels 12-14 are only corrected
through October 1987 (see Kyle 1993a). Solar channels 1-9 suffered considerable degradation and, in
addition, had no inflight calibration capability. No calibration corrections were developed for these
channels. The SEFDT calibration algorithm for channel 10c was moderately accurate, but resulted in a
noise level that at times tended to obscure true solar variations. In 1989 and 1990, a much improved
channel 10c algorithm was developed (Hoyt, 1992) and all the previous data were reprocessed. Theseimproved irradiances were not placed on the SEFDT but were released as a separate product. Moredetails on channels 1-9 are given in Section 3.2, while channel 10c is discussed in Section 4.
3.2 Summary of Problems and Suggested Corrections
Figure 2 shows the relative changes in the measured channel 1-9 irradiances for the first 12 years of theexperiment (November 1978 through November 1990). The readings are normalized by the values fromday 1 (November 16, 1978). The major part of the changes arise from the sensors themselves.
Identification of true solar variations requires considerable analysis at this SEFDT stage. Most of the
variations shown arise from changes in the opacity of the Suprasil-W windows which cover channels (1,2
and 4-9). Outgassed vapors from the instrument and the satellite formed an obscuring film on these
windows. During solar excitation maxima, the solar extreme ultraviolet radiation sharply increases andthis results in a large increase in atomic oxygen at the spacecraft altitude. This tends to scour off the film
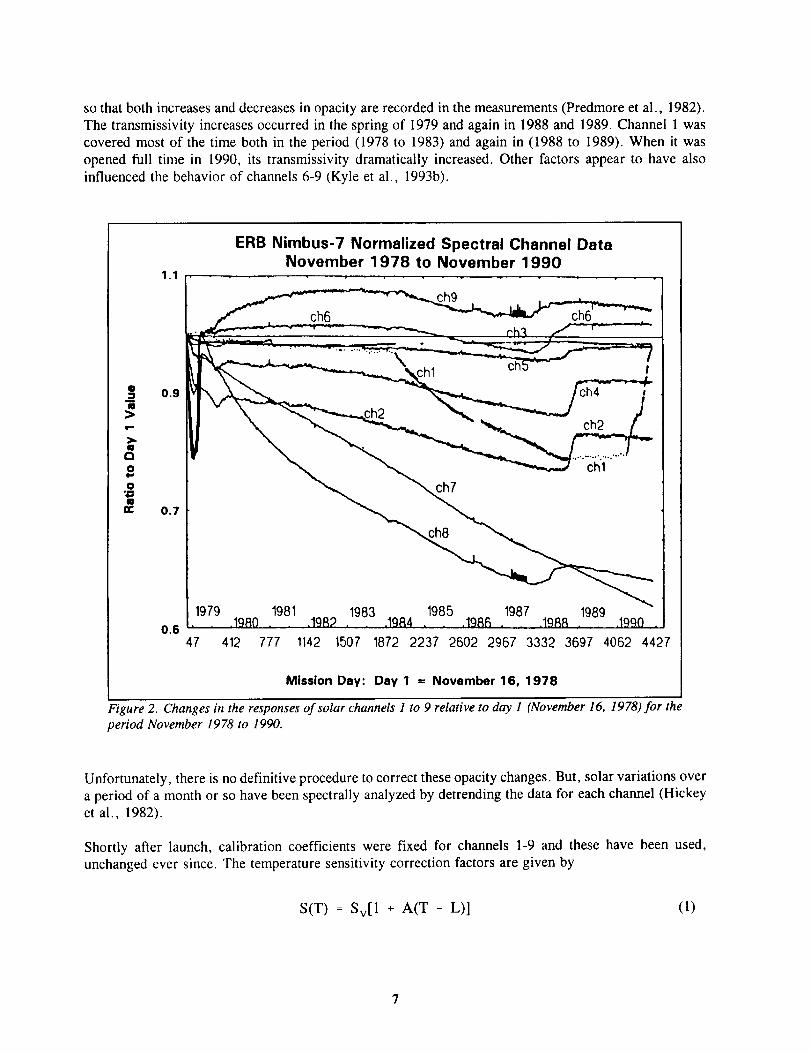
sothatbothincreasesanddecreasesinopacityarerecordedin themeasurements(Predmoreetal., 1982).Thetransmissivityincreasesoccurredin thespringof 1979andagainin 1988and1989.Channel1wascoveredmostof thetimebothin theperiod(1978to 1983)andagainin (1988to 1989).Whenit wasopenedfull timein 1990,its transmissivitydramaticallyincreased.Otherfactorsappearto havealsoinfluencedthebehaviorof channels6-9 (Kyleet al., 1993b).
m>
>.IIQO
O
1.1
0.9
0.7
1979
0.547 412
ERB Nimbus-7 Normalized Spectral Channel DataNovember 1978 to November 1990
ch9
ch6 ch6
ch7
ch8
1981 1983 1985 1987 1989
777 1142 1507 1872 2237 2602 2967 3332 3697 4062 4427
Mission Day: Day 1 = November 16, 1978
Figure 2. Changes in the responses of solar channels 1 to 9 relative to day 1 (November 16, 1978)for the
period November 1978 to 1990.
Unfortunately, there is no definitive procedure to correct these opacity changes. But, solar variations over
a period of a month or so have been spectrally analyzed by detrending the data for each channel (Hickey
et al., 1982).
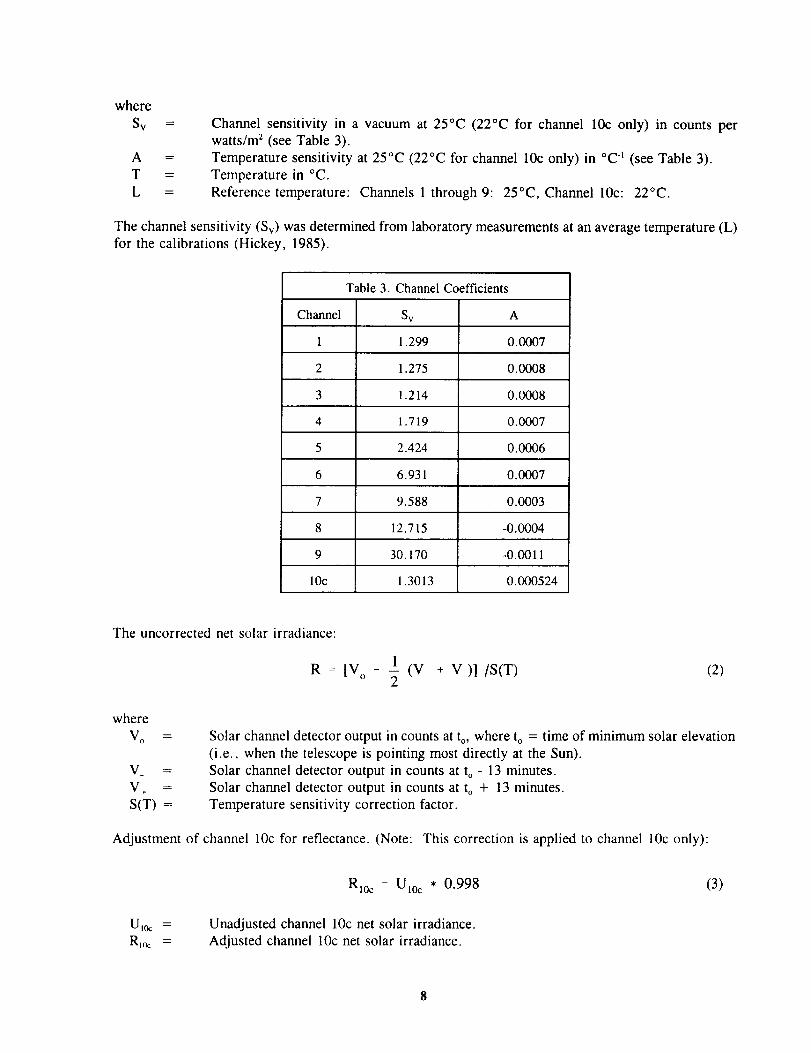
Shortly after launch, calibration coefficients were fixed for channels 1-9 and these have been used,unchanged ever since. The temperature sensitivity correction factors are given by
S(T) -- Sv[1 + A(T - L)] (1)
7
where
Sv
m
T =
L =
Channel sensitivity in a vacuum at 25°C (22°C for channel 10c only) in counts perwatts/m 2 (see Table 3).
Temperature sensitivity at 25°C (22°C for channel 10c only) in °C _ (see Table 3).
Temperature in °C.
Reference temperature: Channels 1 through 9: 25°C, Channel 10c: 22°C.
The channel sensitivity (Sv) was determined from laboratory measurements at an average temperature (L)for the calibrations (Hickey, 1985).
Table 3. Channel Coefficients
Channel Sv
1 1.299
2 1.275
3 1.214
A
0.0007
0.0008
0.0008
4 1.719 0.0007
5 2.424 0.0006
6 6.931 0.0007
7 9.588 0.0003
8 12.715 -0.0004
9 30.170 -0.0011
10c 1.3013 0.000524
The uncorrected net solar irradiance:
R _ [V o - 1 (V + V)] /S(T) (2)2
where
Wo =
V_
V+ =
S(T) =
Solar channel detector output in counts at to, where to = time of minimum solar elevation
(i.e., when the telescope is pointing most directly at the Sun).Solar channel detector output in counts at to - 13 minutes.
Solar channel detector output in counts at to + 13 minutes.
Temperature sensitivity correction factor.
Adjustment of channel 10c for reflectance. (Note: This correction is applied to channel 10c only):
Ulo c
Ri0 c =
Rio _ = Ulo c * 0.998
Unadjusted channel 10c net solar irradiance.
Adjusted channel 10c net solar irradiance.
(3)
8
All of the irradiances are then normalized to the mean Earth flux distances. The center time (to) of the
solar measurements is taken as the center of the local minimum in channel 5 (Figure 1). If this local
minimum cannot be found, to is set to the time when the southern terminator is crossed. When the channel
10c data were reprocessed, to was redetermined as the time of the maximum in the channel 10c counts.
The present irradiance values on the ERB SEFDT and SST were determined using these equations. The
final channel 10c irradiances were calculated using the information on the SEFDT (see Section 4).
Improvements in the irradiances for channels 1-9 should include the following steps:
1. Correction for off-axis observations (see Section 2.3)
2. Improved calculation of the Earth distance. This is a relatively small correction and may not beworth while in some cases (see Section 4).
. Detrending to correct for changes in the sensitivity. This assumes that the solar variations to bestudied are of shorter duration than the stretch of data that are detrended. This detrending partially
corrects for changes in the sensitivity, s, of a particular channel. Sensitivity changes are physicallydue to:
- Time dependent changes in the transmissivity of the optics (very important).
- Changes in S due to changes in the sensor chip or its cover paint (small).
- Any changes in the filter pass bands (minor).
- Changes in the electronics (negligible).
The electronic changes appear negligible while the other three items cannot be evaluated to the
required accuracy. Thus, detrending is recommended.
4. THE CHANNEL 10C SOLAR TAPES (CST)
This archive was designed for those wishing to study in detail the Nimbus-7 total solar irradiancemeasurements and their calibration. These data consist of four components. The raw irradiance counts
and housekeeping data are on the CST and are discussed in Sections 4.1 and 4.2. The electric calibration
is on a separate computer disk and is discussed in Section 4.3. Other PC computer disks contain the meanorbital counts and the Earth-Sun distances (Section 4.4) and the calibrated orbital radiances (Section 4.5).
4.1 The Counts Tapes
The old SEFDT calibration algorithm, for the channel 10c total solar irradiance, introduced so much
noise into the final product that the relatively small physical solar signals were frequently obscured. For
this reason, the present calibration equation starts with the raw counts and housekeeping data. The old
SEFDT calibrated orbital irradiances are ignored. The present channel 10c counts tape, therefore,
includes only the housekeeping data and the raw counts from the SEFDTs. In addition, fill values havebeen inserted where the Earth-Sun distance used to be. The Earth-Sun distance on the SEFDTs was an
approximation which degrades the final product. As described in Section 4.4, accurate Earth-Sundistances are provided with the new calibrated orbital irradiances. The format of the channel 10c solar
tape is detailed in Section 5.5.
4.2 Data Sorting and Calibration
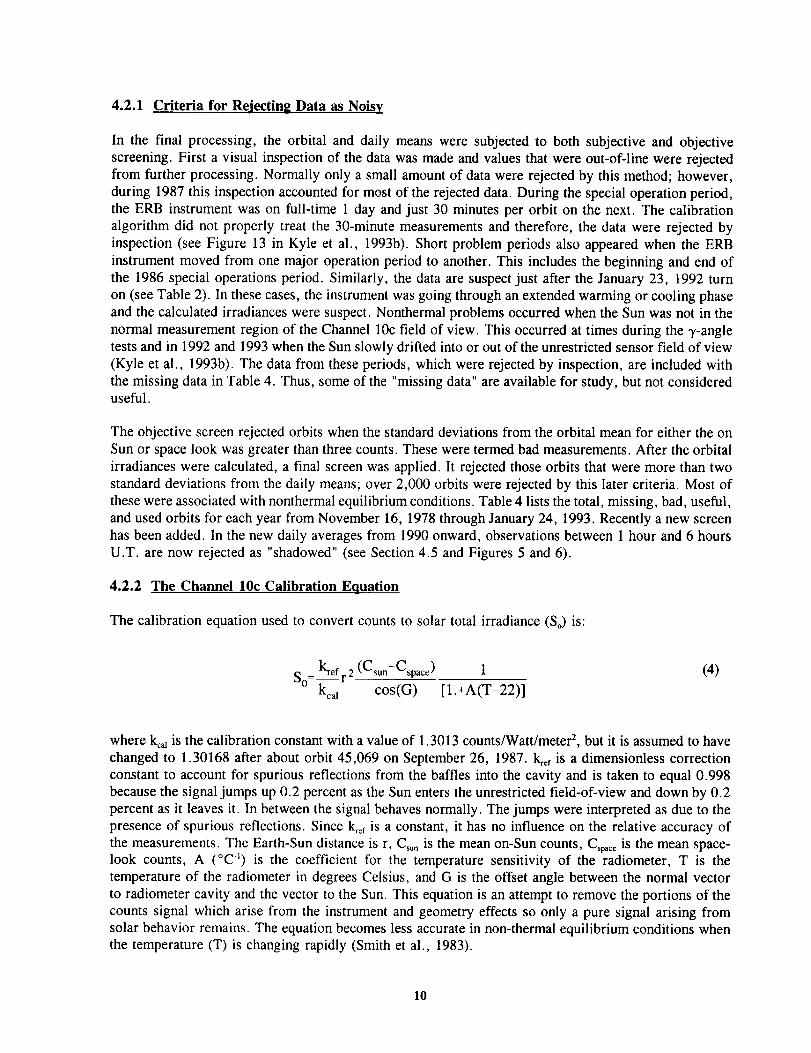
4.2.1 Criteria for Rejecting Data as Noisy
In the final processing, the orbital and daily means were subjected to both subjective and objective
screening. First a visual inspection of the data was made and values that were out-of-line were rejected
from further processing. Normally only a small amount of data were rejected by this method; however,
during 1987 this inspection accounted for most of the rejected data. During the special operation period,
the ERB instrument was on full-time 1 day and just 30 minutes per orbit on the next. The calibration
algorithm did not properly treat the 30-minute measurements and therefore, the data were rejected by
inspection (see Figure 13 in Kyle et al., 1993b). Short problem periods also appeared when the ERB
instrument moved from one major operation period to another. This includes the beginning and end ofthe 1986 special operations period. Similarly, the data are suspect just after the January 23, 1992 turn
on (see Table 2). In these cases, the instrument was going through an extended warming or cooling phaseand the calculated irradiances were suspect. Nonthermal problems occurred when the Sun was not in the
normal measurement region of the Channel 10c field of view. This occurred at times during the 3,-angle
tests and in 1992 and 1993 when the Sun slowly drifted into or out of the unrestricted sensor field of view
(Kyle et al., 1993b). The data from these periods, which were rejected by inspection, are included with
the missing data in Table 4. Thus, some of the "missing data" are available for study, but not considereduseful.
The objective screen rejected orbits when the standard deviations from the orbital mean for either the on
Sun or space look was greater than three counts. These were termed bad measurements. After the orbital
irradiances were calculated, a final screen was applied. It rejected those orbits that were more than two
standard deviations from the daily means; over 2,000 orbits were rejected by this later criteria. Most of
these were associated with nonthermal equilibrium conditions. Table 4 lists the total, missing, bad, useful,
and used orbits for each year from November 16, 1978 through January 24, 1993. Recently a new screen
has been added. In the new daily averages from 1990 onward, observations between 1 hour and 6 hours
U.T. are now rejected as "shadowed" (see Section 4.5 and Figures 5 and 6).
4.2.2 The Channel 10c Calibration Equation
The calibration equation used to convert counts to solar total irradiance (So) is:
S : k_e_fr2 (Csun-Cspace) 1
0 kcat cos(G) [1.+A(T-22)]
(4)
where kc_,is the calibration constant with a value of 1.3013 counts/Watt/meter 2, but it is assumed to have
changed to 1.30168 after about orbit 45,069 on September 26, 1987. kr_f is a dimensionless correction
constant to account for spurious reflections from the baffles into the cavity and is taken to equal 0.998
because the signal jumps up 0.2 percent as the Sun enters the unrestricted field-of-view and down by 0.2
percent as it leaves it. In between the signal behaves normally. The jumps were interpreted as due to the
presence of spurious reflections. Since kr_f is a constant, it has no influence on the relative accuracy of
the measurements. The Earth-Sun distance is r, Csu, is the mean on-Sun counts, Csp_c¢is the mean space-look counts, A (°C -z) is the coefficient for the temperature sensitivity of the radiometer, T is the
temperature of the radiometer in degrees Celsius, and G is the offset angle between the normal vector
to radiometer cavity and the vector to the Sun. This equation is an attempt to remove the portions of the
counts signal which arise from the instrument and geometry effects so only a pure signal arising fromsolar behavior remains. The equation becomes less accurate in non-thermal equilibrium conditions whenthe temperature (T) is changing rapidly (Smith et al., 1983).
10
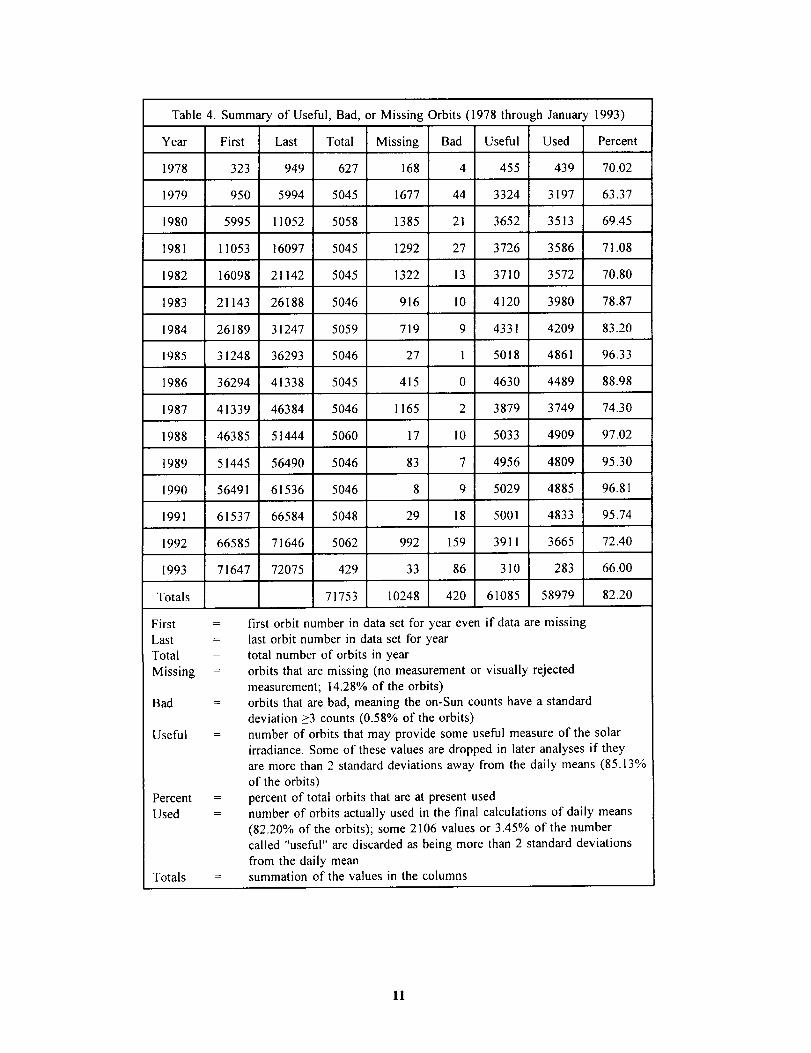
Table 4. Summary of Useful, Bad, or Missing Orbits (1978 through January 1993)
Year First Last Total Missing Bad Useful Used Percent
1978 323 949 627 168 4 455 439 70.02
1979 950 5994 5045 1677 44 3324 3197 63.37
1980 5995 11052 5058 1385 21 3652 3513 69.45
1981 11053 16097 5045 1292 27 3726 3586 71.08
1982 16098 21142 5045 1322 13 3710 3572 70.80
1983 21143 26188 5046 916 10 4120 3980 78.87
1984 26189 31247 5059 719 9 4331 4209 83.20
1985 31248 36293 5046 27 1 5018 4861 96.33
1986 36294 41338 5045 415 0 4630 4489 88.98
1987 41339 46384 5046 1165 2 3879 3749 74.30
1988 46385 51444 5060 17 10 5033 4909 97.02
1989 51445 56490 5046 83 7 4956 4809 95.30
1990 56491 61536 5046 8 9 5029 4885 96.81
1991 61537 66584 5048 29 18 5001 4833 95.74
1992 66585 71646 5062 992 159 3911 3665 72.40
1993 71647 72075 429 33 86 310 283 66.00
Totals 71753 10248 420 61085 58979 82.20
FirstLast
Total
Missing
Bad
Useful
Percent
Used
Totals
first orbit number in data set for year even if data are missing
last orbit number in data set for year
total number of orbits in year
orbits that are missing (no measurement or visually rejectedmeasurement; 14.28% of the orbits)
orbits that are bad, meaning the on-Sun counts have a standarddeviation >_3 counts (0.58% of the orbits)
number of orbits that may provide some useful measure of the solar
irradiance. Some of these values are dropped in later analyses if they
are more than 2 standard deviations away from the daily means (85.13%
of the orbits)
percent of total orbits that are at present used
number of orbits actually used in the final calculations of daily means
(82.20% of the orbits); some 2106 values or 3.45% of the numbercalled "useful" are discarded as being more than 2 standard deviations
from the daily meansummation of the values in the columns
11
The calibration equation is discussed in detail in Kyle et al., 1993b. The temperature coefficient A is
assigned a constant value of 0.0003. The offset (Csp,,) is normally redetermined each year, but it is donemore frequently if a major change occurs in the ERB operation mode. The offset values are given in
Table 5. Finally, the offset angle G in Eq.(4) has some peculiarities. It was originally assumed that
G-- g-- T -/_- S (5)
where g is the geometrical off-axis angle,/3 is the angle of the Sun relative to the Nimbus-7 orbital plane,3, is the measured angle between the axis of the solar telescope and the orbital plane, and S is a correction
for any error in 3'. For many years, Eq.(5) was used with S=0. Then it was discovered that the maximum
response of channel 10c in the 3'-plane was 2.4 ° off center and that the 3'-angle slipped in 1980 and againin 1986. Thus, the correct value for G is
G = g + 2.4 °= (T -fl - S) + 2.4 ° (6)
The values for S are given in Table 6. To add to the confusion, Nimbus Operations changed the sign ofthe "r-angle. Thus, the user should change the sign of the 3'-angle on the tape before inserting it in Eq.(6).
In the fall of 1993, Nimbus Operations kept 3'=-19 ° (their value) at all times. Further, they monitored the
incoming data stream and verified that a value of-19 ° was returned. Somehow, on the final product tapes
(MATs, SEFDT, SST, and CST) the value was entered as +20 °. This error was discovered during the final
calibration of the channel 10c irradiances. It was corrected for this calculation, but the main production
program had then been terminated so this error remains on the main product tapes.
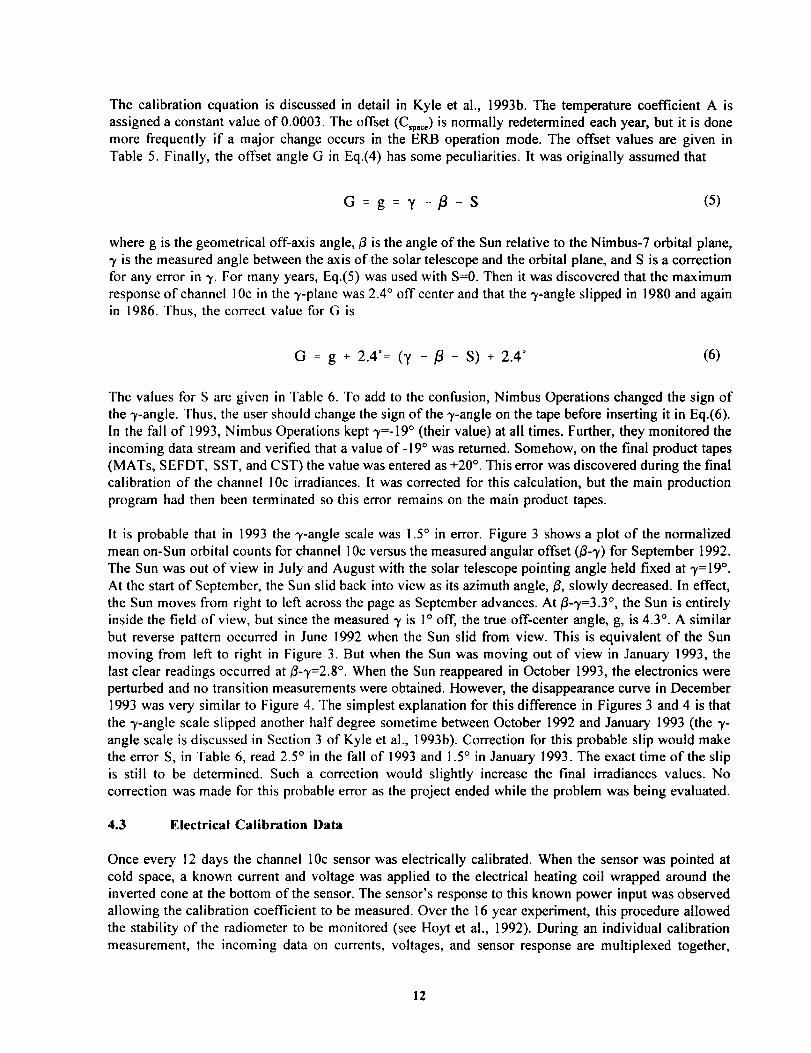
It is probable that in 1993 the 3,-angle scale was 1.5 ° in error. Figure 3 shows a plot of the normalized
mean on-Sun orbital counts for channel 10c versus the measured angular offset (_-3') for September 1992.
The Sun was out of view in July and August with the solar telescope pointing angle held fixed at 3,=19 °.At the start of September, the Sun slid back into view as its azimuth angle,/3, slowly decreased. In effect,
the Sun moves from right to left across the page as September advances. At/3-3"=3.3 °, the Sun is entirely
inside the field of view, but since the measured 3' is 1° off, the true off-center angle, g, is 4.3 °. A similar
but reverse pattern occurred in June 1992 when the Sun slid from view. This is equivalent of the Sun
moving from left to right in Figure 3. But when the Sun was moving out of view in January 1993, the
last clear readings occurred at _-3,=2.8 °. When the Sun reappeared in October 1993, the electronics were
perturbed and no transition measurements were obtained. However, the disappearance curve in December1993 was very similar to Figure 4. The simplest explanation for this difference in Figures 3 and 4 is that
the 3,-angle scale slipped another half degree sometime between October 1992 and January 1993 (the 3'-
angle scale is discussed in Section 3 of Kyle et al., 1993b). Correction tbr this probable slip would make
the error S, in Table 6, read 2.5 ° in the fall of 1993 and 1.5° in January 1993. The exact time of the slip
is still to be determined. Such a correction would slightly increase the final irradiances values. No
correction was made for this probable error as the project ended while the problem was being evaluated.
4.3 Electrical Calibration Data
Once every 12 days the channel 10c sensor was electrically calibrated. When the sensor was pointed at
cold space, a known current and voltage was applied to the electrical heating coil wrapped around the
inverted cone at the bottom of the sensor. The sensor's response to this known power input was observed
allowing the calibration coefficient to be measured. Over the 16 year experiment, this procedure allowed
the stability of the radiometer to be monitored (see Hoyt et al., 1992). During an individual calibration
measurement, the incoming data on currents, voltages, and sensor response are multiplexed together,
12

because of limitations on the Nimbus-7 data system. This data is recorded on the MAT tapes. Careful
examination of this data indicates the calibration coefficient remained stable except for one small change
in September 1987. A representative sample of the calibration data was recovered from the MAT tapes
and are discussed in this section.
Table 5. Mean Radiometer Offset 13 Minutes Before a Solar Observation for
Each Year
Year Offset Year Offset
1978 -18.508 1986 -18.805
1979 -18.862 1986 -14.082 (special operations)
1980 -19.175 (days ! to 202) 1987 -18.961
1980 -18.331 (days 203 to 366) 1987 -18.699 (special operations)
1981 -18.462 1988 -18.877
1982 -18.447 1989 -18.819
1983 -18.562 1990 -19.033
1984 -18.609 1991 -19.018
1985 -18.742 1992 -19.192
Table 6. Time dependent errors in the 3,-angle.
Period
November 16, 1978 to July 19, 1980
July 20, 1980 to June 22, 1986
June 23, 1986 to January 1993 1.0
2.0November and December 1993 (do not change sign)
Error S (o)
0.0
0.5
There are three ASCII files available on computer disk which contain information on the electrical
calibration of channel 10c. These are the summary calibration file, the summary calibration data file, and
the raw calibration data files. Each file is described, in turn, below.
The Summary Calibration Coefficients File
The summary calibration file is "calcoefs". It provides a listing of many of the electrical calibration values
along with their uncertainties and supplemental data. Data from the file "caldata", described in the next
subsection, are used in the derivation of the calibration file.
13

ON-SUN COUNTS VS. OFF-AXIS ANGLE
FOR SEPT. 1992
1800
1780
1760
1740
00 1720Z
1700-0
1680
1660
1640
...... i:+i...................................._.............'ii...................i..........._ ........!I.......................................+..................................+......................+.................+............+++............i ....................
......... i.......................... ' .................................................................. i +
I _ I
2.4 2.6 2.8 3.0 3.2 3.4 3.6 3.8 4.0
BETA MINUS GAMMA
Figure 3. The Sun is shown drifting into channel IOc's clear fieM of view (right to left) in September 1992.
The Sun was out of range in August. On the right-hand side, the Sun is partially obscured by the door of
the telescope. The solar signal is given in digitized counts normalized by the square of the Earth to Sun
distance. The abscissa gives the measured (not corrected) off-center angle (_-_t).
The file "calcoefs" has ten columns of data. These are:
1. The year in which the calibration was made.
2. The day of the year on which the calibration was made.3. The orbit number for the calibration.
4. The temperature (multiplied by 10) of the radiometer baseplate in degrees Celsius during theelectrical calibration.
5. The calibration coefficient in units of counts/W/m 2. This coefficient is not corrected for
temperature effects in this file.6. The one standard deviation on the calibration coefficient.
7. The current applied to the heater during the calibration, expressed in amperes.
8. The voltage applied to the heater in volts.9. The resistance of the heater in ohms.
10. The power in milliwatts applied to the heater.
14
ON-SUN COUNTS VS. OFF-AXIS ANGLEFOR JAN. 1993
1800
1780
1760
O3
z 1740
00 1720Z
1700ZO
1680
1660
16402.4 2.6 2.8 3.0 3.2 3.4 3.6 3.8 4.0
BETA MINUS GAMMA
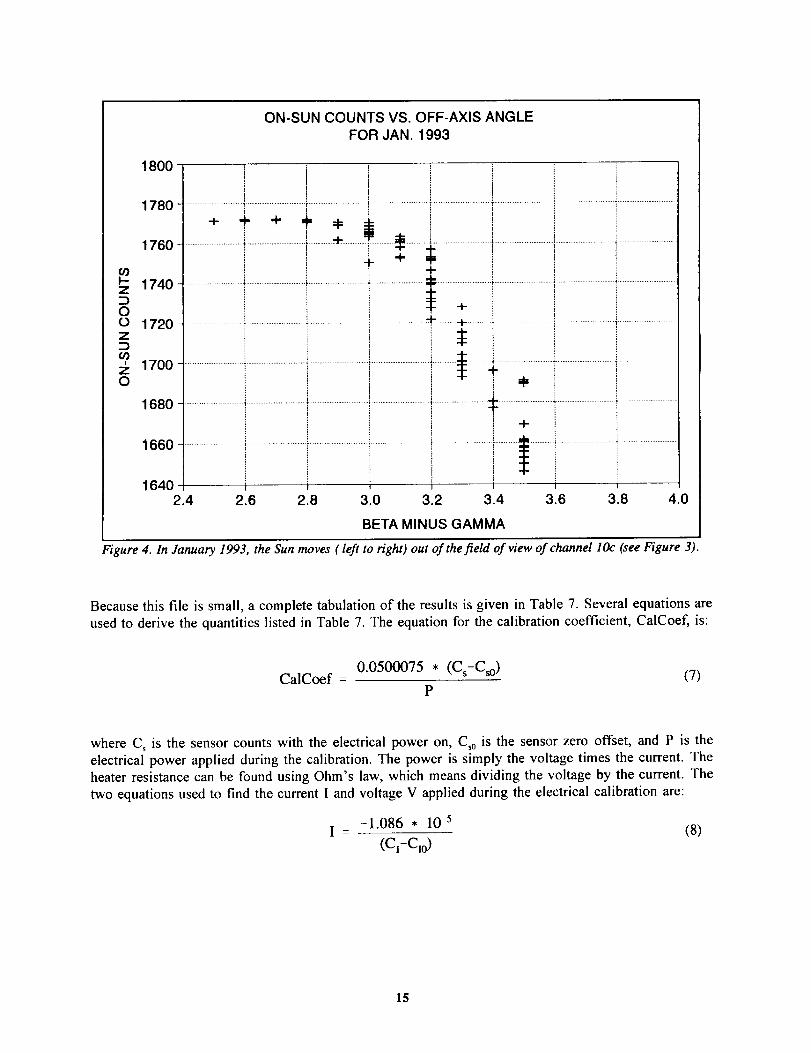
Figure 4. In January 1993, the Sun moves (left to right) out of the field of view of channel lOc (see Figure 3).
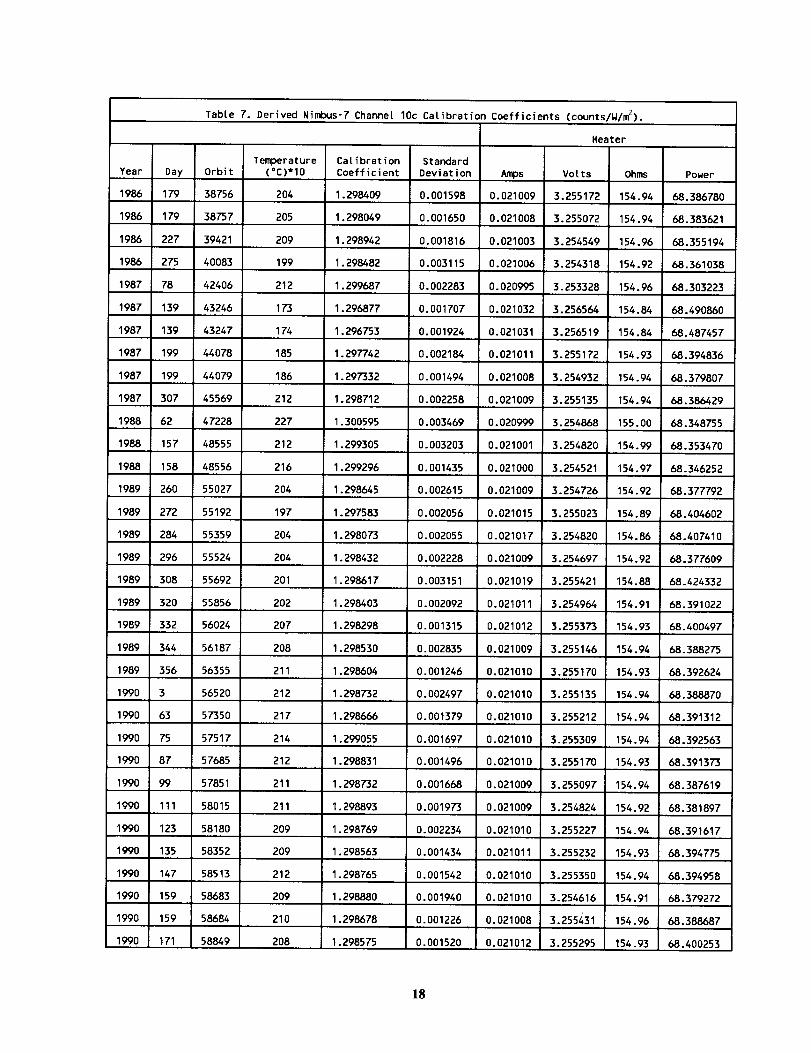
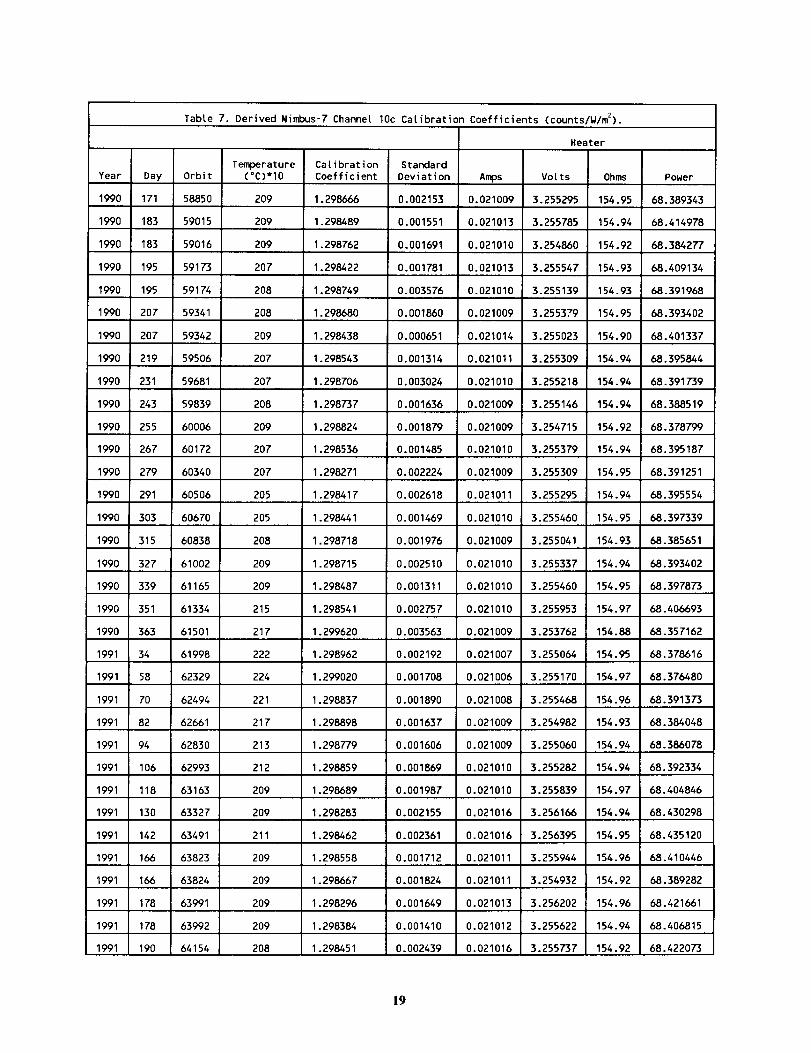
Because this file is small, a complete tabulation of the results is given in Table 7. Several equations are
used to derive the quantities listed in Table 7. The equation for the calibration coefficient, CalCoef, is:
0.0500075 * (Cs-Cs0)CalCoef = (7)
P
where Cs is the sensor counts with the electrical power on, C,0 is the sensor zero offset, and P is theelectrical power applied during the calibration. The power is simply the voltage times the current. Theheater resistance can be found using Ohm's law, which means dividing the voltage by the current. The
two equations used to find the current I and voltage V applied during the electrical calibration are:
-1.086 * 10 -5I -- (8)
(Cl-Cl0)
15
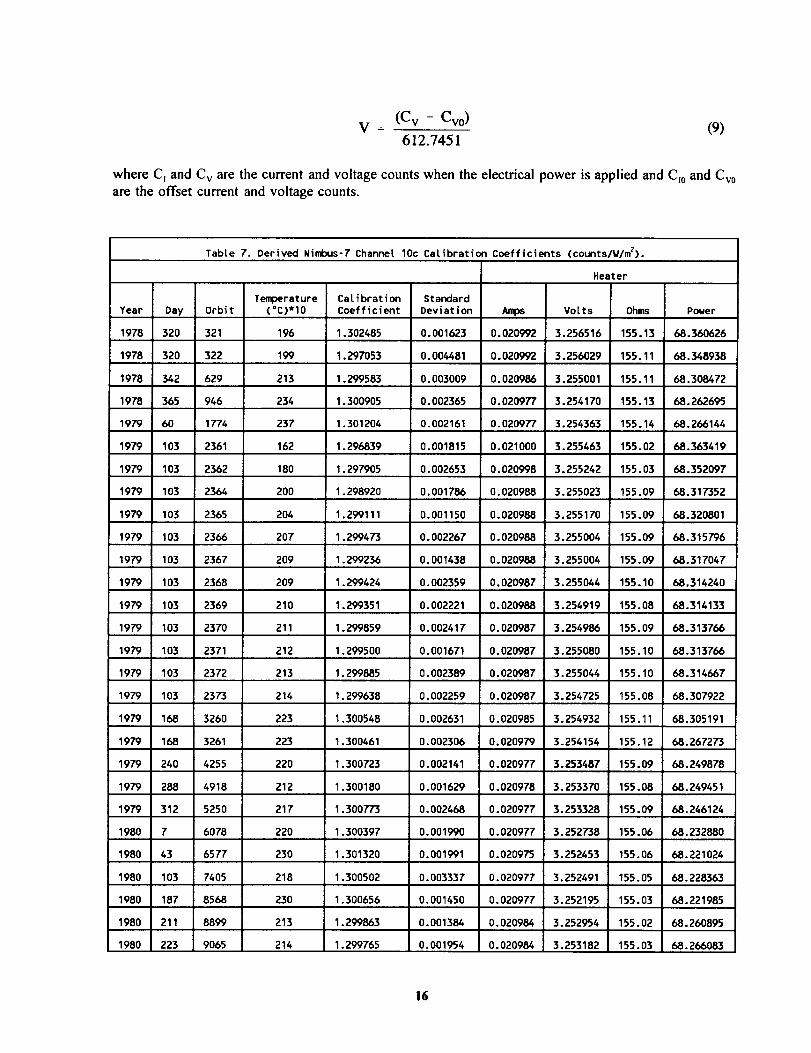
V -- (Cv - Cv°) (9)612.7451
where CI and C v are the current and voltage counts when the electrical power is applied and Cxoand Cv0are the offset current and voltage counts.
Tabte 7. Derived Nimbus-7 Channet 10c Catibration Coefficients (counts/w/mZ).
Year Day Orbit
1978 320 321
1978 320 322
1978 342 629
1978 365 946
1979 60 1774
1979 103 2361
1979 103 2362
1979 103 2364
1979 103 2365
1979 103 2366
1979 103 2367
1979 103 2368
1979 103 2369
1979 103 2370
1979 103 2371
1979 103 2372
1979 103 2373
1979 168 3260
1979 168 3261
1979 240 4255
1979 288 4918
1979 312 5250
1980 7 6078
1980 43 6577
1980 103 7405
1980 187 8568
1980 211 8899
1980 223 9065
Heater
Temperature(°0)-10
CatibrationCoefficient
Standard
Deviation Amps Volts
196 1.302485 0.001623 0.020992 3.256516
199 1.297053 0.004481 0.020992 3.256029
213 1.299583 0.003009 0.020986 3.255001
234 1.300905 0.002365 0.020977 3.254170
237 1.301204 0.002161 0.020977 3.254363
162 1.296839 0.001815 0.021000 3.255463
I.297905
1.298920
180
200
0.002653
0.001786
O. 020998
0.020988
3.255242
3.255023
204 1.299111 0.001150 0.020988 3.255170
207 1.299473 0.002267 0.020988 3.255004
209 1.299236 0.001438 0.020988 3.255004
209 1.299424 0.002359 0.020987 3.255044
210 1.299351 0.002221 0.020988 3.254919
211 1.299859 0.002417 0.020987 3.254986
212 1.299500 0.001671 0.020987 3.255080
0.002389213
214
I.299885 0.020987
0.020987I.299638 0.002259
3.255044
3.254725
223 1.300548 0.002631 0.020985 3.254932
223 1.300461 0.002306 0.020979 3.254154
1.300723220
212
217
220
230
218
230
213
214
0.002141
0.001629
0.002468
0.001990
0.001991
0.003337
0.001450
0.001384
0.001954
1.300180
1.300773
1.300397
1.301320
0.020977
0.020978
0.020977
0.020977
0.0209_
0.020977
0.020977
0.020984
0.020984
1.300502
1.300656
1.299863
I.299765
3.253487
3.253370
3.253328
3.252738
3.252453
3.252491
3.252195
3.252954
3.253182
Ohms
155.13
155.11
155.11
155.13
155.14
155.02
155.03
155.09
155.09
155.09
155.09
155.10
155.08
155.09
155.10
155.10
155.08
155.11
155.12
155.09
155.08
155.09
155.06
155.06
155.05
155.03
155.02
155.03
Power
68.360626
68.348938
68.308472
68.262695
68. 266144
68.363419
68.352097
68.317352
68.320801
68.315796
68.317047
68.314240
68.314133
68.313766
68.313766
68.314667
68.307922
68.305191
68.267273
68.249878
68.249451
68.246124
68.232880
68.221024
68.228363
68.221985
68.260895
68.266083
16

Year
1980
1980
1981
1981
1981
1981
1981
1981
1981
1982
1982
1982
1982
1982
1982
1983
1983
1983
1983
1983
1984
1984
1984
1984
1984
1984
1985
1985
1985
1985
1985
1985
1986
1986
Day
283
319
I
37
109
193
193
253
325
8
44
104
188
248
320
3
39
111
183
327
10
46
118
190
190
298
4
52
112
232
280
328
23
83
Table 7. Derived Nimbus-7 Channel 10c Calibration Coefficients (counts/W/m2).
Orbit
9894
10390
11054
11551
12547
13707
13708
14537
15534
16196
16692
17523
18682
19513
20508
21172
21668
22663
23658
25650
26313
26822
27807
28803
28804
30294
31290
31963
32787
34447
35106
35771
36599
37430
Heater
Temperature
(°C)'10
Catibration
Coefficient
Standard
Deviation Amps Volts
205 1.299300 0.002238 0.020987 3.252925
200 1.299034 0.002979 0.020987 3.253144
204
211
209
212
209
204
215
217
209
215
205
209
208
212
212
208
1.299312
1.299778
1.299701
I. 299806
1.299652
1.299155
I.299654
1.299705
1.299351
1.299890
0.001657
0.002593
0.001867
0.001284
0.002501
203
0.001510
0.001902
0.002446
0.001657
0.001920
0.020986
0.020986
0.020987
0.020990
0.020989
0.020989
0.020986
0.020986
0.020991
0.020991
3.252533
3.252324
3.252724
3.253391
3.253029
3.253496
3.252461
3.252952
3.253487
3.253579
1.299168 0.001925 0.020991 3.253286
1.298701 0.001930 0.020998 3.254022
1.299062 0.001959 0.020998 3.253466
O. 020993
O. 020998
0.020991
1.299101
0.020998
1.299124
0.001989
0.002286
0.002074
0.001862
1.299232
1.298779
3.253371
0.001718
3.253714
3.253242
0.020997
3.253980
225 1.299811 0.001534 0.020988 3.253144
202 1.299121 0.003516 0.020996 3.253328
237 1.300676 0.001760 0.020987 3.252651
3.253391
0.002269 0.020998 3.253361
0.001256 0.020999 3.253508
0.021002
205 1.299113
204 1.298903
205 1.298199
1.298231194 0.001755 3.254283
210 1.299504 0.002634 0.020995 3.253286
234 1.300558 0.002514 0.020987 3.252946
217 1.299961 0.002308 0.020989 3.253354
218 1.299289 0.001419 0.020995 3.253503
0.0209981.298540
1.299374
196
211
0.001738
0.003526
0.001783
0.003382
209
217
1.299292
1.299509
0.020997
O. 020997
0.020994
3.253576
3.253508
3.253212
3.253317
Ohms
155.00
155.01
154.98
154.98
154.98
154.99
154.99
155.01
154.98
155.01
154.99
155.00
154.98
154.97
154.94
154.97
154.95
154.98
154.97
155.00
154.95
154.99
154.95
154.94
154.94
154.95
154.96
155.00
155.00
154.96
154.94
154.95
154.94
154.96
Power
68.269730
68.273956
68.258453
68.252136
68.266327
68.289627
68.276993
68.286469
68.257568
68.265961
68.295120
68.294876
68.290054
68.327301
68.314789
68.299225
68.322052
68.289154
68.326767
68.277237
68.305664
68.262390
68.310013
68.314606
68.320572
68.347275
68.301544
68.270615
68.284088
68.307755
68.319962
68.315262
68.306198
68.300537
17
Tabte 7. Derived Nimbus-7 Channe[ 10c Calibration Coefficients (counts/W/m2).
Heater
Year Day Orbit
1986 179 38756
1986 179 38757
1986 227 39421
1986 275 40083
1987 78 42406
1987 139 43246
1987 139 43247
1987 199 44078
1987 199 44079
1987 307 45569
1988 62 47228
1988 157 48555
1988 158 48556
1989 260 55027
1989 272 55192
1989 284 55359
1989 296 55524
1989 308 55692
1989 320 55856
1989 332 56024
1989 344 56187
1989 356 56355
1990 3 56520
1990 63 57350
1990 75 57517
1990 87 57685
1990 99 57851
1990 111 58015
1990 123 58180
1990 135 58352
1990 147 58513
1990 159 58683
1990 159 58684
1990 171 58849
Temperature
(°C)'10
204
205
209
199
212
173
174
185
186
212
227
Catibration
Coefficient
1.298409
1.298049
1. 298942
I.298482
1.299687
1.296877
1.296753
1.297742
1.297332
1.298712
1.300595
Standard
Deviation Amps
0.001598 0.021009
0.001650
0.001816
0.003115
0.002283
0.001707
0.001924
0.002184
0.001494
0.002258
0.003469
0.021008
0.021003
0.021006
0.020995
0.021032
0.021031
0.021011
0.021008
0.021009
0.020999
212 1.299305 0.003203 0.021001
216 1.299296 0.001435 0.021000
204 1.298645 0.002615 0.021009
197 1.297583
204 1.298073
0.002056 0.021015
0.002055 0.021017
204 1.298432 0.002228 0.021009
201 1.298617 0.003151 0.021019
202 1.298403 0.002092 0.021011
207 1.298298 0.001315 0.021012
208 1.298530 0.002835 0.021009
211 1.298604 0.001246 0.021010
212 1.298732 0.002497 0.021010
217 1.298666 0.001379 0.021010
214 1.299055 0.001697 0.021010
212 1.298831 0.001496 0.021010
I.298732 0.001668211 0.021009
211 1.298893 0.001973 0.021009
209 1.298769 0.002234 0.021010
209 1.298563 0.001434 0.021011
212 1.298765 0.001542 0.021010
209 1.298880 0.001940 0.021010
0.001226 0.021008
0.001520 0.021012
210 1.298678
208 1.298575
Votts Ohms Power
3.255172 154.94 68.386780
3.255072 154.94 68.383621
3.254549 154.96 68.355194
3.254318 154.92 68.361038
3.253328 154.96 68.303223
3.256564 154.84 68.490860
3.256519 154.84 68.487457
3.255172 154.93 68.394836
3.254932 154.94 68.379807
3.255135 154.94 68.386429
3.254868 155.00 68.348755
3.254820 154.99 68.353470
3.254521 154.97 68.346252
3.254726 154.92 68.377792
3.255023 154.89 68.404602
3.254820 154.86 68.407410
3.254697 154.92 68.377609
3.255421 154.88 68.424332
3.254964 154.91 68.391022
3.255373 154.93 68.400497
3.255146 154.94 68.388275
3.255170 154.93 68.392624
3.255135 154.94 68.388870
3.255212 154.94 68.391312
3.255309 154.94 68.392563
3.255170 154.93 68.391373
3.255097 154.94 68.387619
3.254824 154.92 68.381897
3.255227 154.94 68.391617
3.255232 154.93 68.394775
3.255350 154.94 68.394958
3.254616 154.91 68.379272
3.255431 154.96 68.388687
3.255295 154.93 68.400253
18
Year
1990
1990
1990
1990
1990
1990
1990
1990
1990
1990
1990
1990
1990
1990
1990
1990
1990
1990
1990
1990
1991
1991
1991
1991
1991
1991
1991
1991
1991
1991
1991
1991
1991
1991
Day
171
183
183
195
195
207
207
219
231
243
255
267
279
291
303
315
327
339
351
363
34
58
70
82
94
106
118
130
142
166
166
178
178
190
Table 7. Derived Nimbus-7 Channet I0c Calibration Coefficients (counts/W/m_).
Orbit
58850
59015
59016
59173
59174
59341
59342
59506
59681
59839
60006
60172
60340
60506
60670
60838
61002
61165
61334
61501
61998
62329
62494
62661
62830
62993
63163
63327
63491
63823
63824
63991
63992
64154
Heater
Temperature
(°C)'I0
Calibration
Coefficient
Standard
Deviation Amps Volts
209 1.298666 0.002153 0.021009 3.255295
209 1.298489 0.001551 0.021013 3.255785
209 1.298762 0.001691 0.021010 3.254860
207 1.298422 0.001781 0.021013 3.255547
208 1.298749 0.003576 0.021010 3.255139
208 1.298680 0.001860 0.021009 3.255379
209 1.298438 0.000651 0.021014 3.255023
1.298543
1.298706
1.298737
1.298824
1.298536
1.298271
1.298417
1.298441
1.298718
1.298715
1.298487
1.298541
1.299620
1.298962
1.299020
1.298837
1.298898
1.298779
1.298859
1.298689
1.298283
1.298462
1.298558
1.298667
1.298296
207
207
208
209
207
207
205
205
208
209
209
215
217
222
224
221
217
213
212
209
209
211
209
209
209
209
208
0.001314
0.003024
0.001636
0.001879
0.001485
0.002224
0.002618
0.001469
0.001976
0.002510
0.001311
0.002757
0.003563
0.002192
0.001708
0.001890
0.001637
0.001606
0.001869
0.001987
0.002155
0.002361
0.001712
0.001824
0.001649
0.001410
0.002439
1.298384
0.021011
0.021010
0.021009
0.021009
0.021010
0.021009
0.021011
0.021010
0.021009
0.021010
0.021010
0.021010
0.021009
0.021007
0.021006
0.021008
0.021009
0.021009
0.021010
0.021010
0.021016
0.021016
0.021011
0.021011
0.021013
0.021012
0.0210161.298451
3.255309
3.255218
3.255146
3.254715
3.255379
3.255309
3.255295
3.255460
3.255041
3.255337
3.255460
3.255953
3.253762
3.255064
3.255170
3.255468
3.254982
3.255060
3.255282
3.255839
3.256166
3.256395
3.255944
3.254932
3.256202
3.255622
3.255737
Ohms
154.95
154.94
154.92
154.93
154.93
154.95
154.90
154.94
154.94
154.94
154.92
154.94
154.95
154.94
154.95
154.93
154.94
154.95
154.97
154.88
154.95
154.97
154.96
154.93
154.94
154.94
154.97
154.94
154.95
154.96
154.92
154.96
154.94
154.92
Power
68.389343
68.414978
68°384277
68.409134
68.391968
68.393402
68.401337
68.395844
68.391739
68.388519
68.378799
68.395187
68.391251
68.395554
68.397339
68.385651
68.393402
68.397873
68.406693
68.357162
68.378016
68. 376480
68.391373
68.384048
68.386078
68.392334
68.404846
68.430298
68.435120
68.410446
68.389282
68.421661
68.406815
68.422073
19

Table 7. Derived Nimbus-7 Channel 10c Calibration Coefficients (counts/W/m2).
Heater
Year
1991
1991
1991
1991
1991
1991
1991
1991
1991
1991
1991
1991
1991
1991
1992
1992
1992
1992
1992
1992
1992
1992
1992
1992
1992
1992
1993
1993
1993
Day
190
202
214
226
238
250
262
274
286
298
310
322
334
358
29
53
77
125
137
185
185
269
281
293
3O5
329
286
321
357
Orbit
64155
64320
64485
64655
64819
64986
65153
65317
65484
65649
65816
65982
66150
66481
66978
67310
67641
68305
68469
69137
69138
70301
70463
70629
70793
71126
75590
76077
76574
Temperature
(°C)'10
209
212
209
212
212
212
290
211
215
212
Catibration
Coefficient
1.298215
1.298594
1.298460
1.298569
I.298682
1.298554
1.298354
1.298584
1.298727
1.298459
Standard
Deviation
0.001810
0.002109
0.003588
0.002285
0.002193
0.002168
0.002850
0.001534
0.002203
0.001775
A_s
0.021015
0.021012
0.021013
0.021012
0.021013
0.021012
0.021016
0.021009
0.021014
0.021013
214 1.298676 0.002100 0.021010
215 1.298860 0.001875 0.021010
219 1.299208 0.002027 0.021010
222 1.299035 0.002027 0.021009
228 1.299580 0.002791 0.021010
224 1.299410 0.001384 0.021010
223 1.299368 0.001646 0.021011
214 1.298582 0.001819 0.021018
214 1.298761 0.003292 0.021017
212 1.298730 0.001433 0.021016
213 1.298656 0.001925 0.021013
216 1.298806 0.001849 0.021016
219 1.298784 0.001989 0.021016
222 1.298728 0.001490 0.021015
220 1.298755 0.001693 0.021014
225 1.298984 0.002222 0.021013
222 1.297641 0.002955 0.021029
231 1.297957 0.001653 0.021031
237 1.299481 0.001779 0.021010
Volts Ohms
3.255658 154.92
3.255797 154.95
3.255561 154.93
3.255881 154.95
3.255549 154.93
3.255763 154.95
3.256132 154.93
3.255379 154.95
3.255512 154.92
3.255839 154.94
3.255588 154.96
3.255282 154.94
3.255157 154.94
3.254986 154.93
3.255431 154.95
3.255463 154.95
3.255460 154.94
3.256132 154.92
3.256084 154.93
3.256111 154.93
3.255268 154.91
3.255839 154.92
3.255920 154.92
3.256258 154.95
3.256090 154.95
3.255880 154.94
3.257848 154.92
3.257583 154.90
3.255991 154.97
Power
68.418610
68.410324
68.407822
68.413910
68.409973
68.408661
68.431198
68.393646
68.410812
68.416046
68.399063
68.394714
68.390182
68.384109
68.396744
68.395782
68.399002
68.436432
68.431854
68.430588
68.404541
68.425583
68.427734
68.430710
68.422913
68.416763
68.508743
68.509399
68.409607
ZO

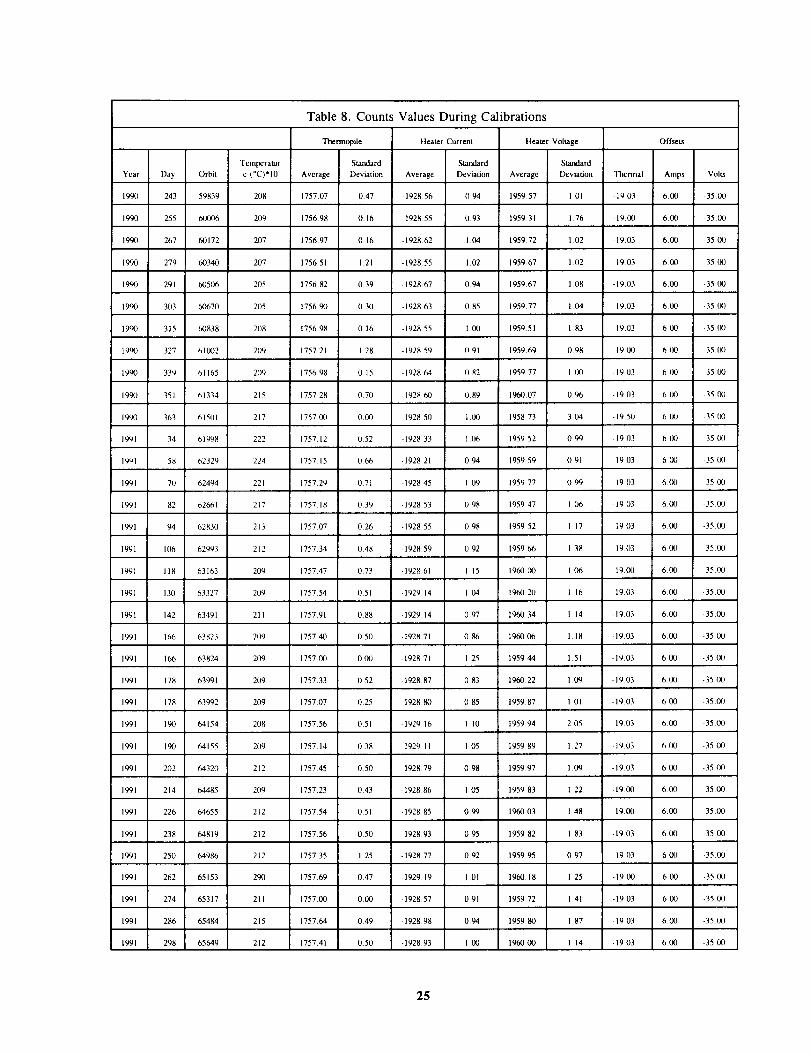
The Summary Calibration Counts Data File
The summary calibration data file, "caldata", gives the mean raw count values used to derive the values
in "calcoefs". This file is a summary of the raw calibration data file. It consists of thirteen columns of
data. They are:
1. The year in which the calibration was made.
2. The day of the year on which the calibration was made.3. The orbit number for the calibration.
4. The temperature (multiplied by 10) of the radiometer baseplate in degrees Celsius during theelectrical calibration.
The average thermopile counts..
6. The one standard deviation uncertainty of the average thermopile counts.
7. The average heater current counts.8. The one standard deviation uncertainty of the average heater current counts.
9. The average heater voltage counts.10. The one standard deviation uncertainty of the average heater voltage counts.
11. The thermopile count offset.12. The heater current count offset.
13. The heater voltage count offset.
Because this file is small, a complete tabulation of the results is given in Table 8.
The Raw Calibration Data Files
The raw calibration data files consist of individual files for each year and are labelled year78.cal,
year79.cal, and so forth to year93.cal. Each file has eleven columns of data. They are:
1. The year in which the calibration was made.
2. The day of the year on which the calibration was made.3. The orbit number for the calibration.
4. The temperature (multiplied by 10) of the radiometer baseplate in degrees Celsius during theelectrical calibration.
5. The average thermopile counts.
6. The average heater current counts.
7. The average heater voltage counts.
8. The thermopile count offset.9. The heater current count offset.
10. The heater voltage count offset.11. The status switch. Values greater than 2000 indicate an electrical calibration is being performed.
Each line of data represent one sample made during the electrical calibration. The incoming data, listed
on the MAT, is multiplexed together. Here, the data are separated in such a way that one count value
(i.e., voltage, current, or thermopile response or offset) is placed on each line of data and the other data
is set to zero since they are not sampled at that moment. This procedure simply makes subsequent
programming easier. Since these data are summarized in Table 8, no additional sample is given here.
21

Table 8. Counts Values During Calibrations
Thermopile Heater Current Heater Voltage Offsets
Temperatur Standard Standard Standard
Year Day Orbit e (*C)"I0 Average Deviation Average Deviation Average Deviation Thermal Amps Volts
1978 320 321 196 1762.00 0.C0 -1926.96 1.10 1960.41 1.35 -18.51 6.00 -35.00
1978 320 322 199 1754.27 1.31 -1926.92 1.12 1960.12 1.70 -18.51 6.00 -35.00
1978 342 629 213 1756.19 0,71 -1926.39 1.11 1959.49 1.37 -19.C0 6.00 -35.00
1978 365 946 234 1756.80 0.66 -1925.58 0.91 1958.98 1,21 -19.00 6.00 -35.00
1979 60 1774 237 1757.44 1.02 -1925.57 0.95 1959.10 1.19 -18.86 6.00 -35.00
1979 103 2361 162 1754.00 0.00 -1927.67 0.90 1959.77 1.16 -18.86 6.00 -35.(:0
1979 103 2362 180 1755,03 0.16 -1927,48 1.09 1959.63 1.04 -19.00 6.00 -35.00
1979 103 2364 200 1755.65 0.48 -1926.62 1.15 1959.50 1,01 -18.86 6.00 -35.00
1979 103 2365 204 1756.00 0.00 -192663 0.83 1959,59 0.91 -18.86 6.00 -35.00
1979 103 2366 207 1756,22 1.27 -1926.59 0.92 1959.49 1,10 -19.00 6.00 -35.00
1979 103 2367 209 1756.07 0.26 -1926.63 0.87 1959.49 101 -18.86 6.00 -35.00
1979 103 2368 209 1756.26 1.29 -1926,52 1.06 1959.51 1.07 -18.86 600 -3500
1979 103 2369 210 1756.15 0,37 -1926.60 0.89 1959.44 1.10 -18.86 6.00 -35.00
1979 103 2370 211 175670 1.44 -1926.55 098 1959.48 1.09 -19.00 6,00 -35.00
1979 103 2371 212 1756.35 0.48 -1926.49 1,05 1959.53 0.93 -18.86 6.00 -35.00
1979 103 2372 213 1756.90 1,41 -1926.54 0.98 1959.51 1.07 -18.86 6.00 -35.00
1979 103 2373 214 1756.38 0.49 -1926.53 0.96 1959.32 1.19 -18.86 6.00 -35.00
1979 168 3260 223 1757.56 1.67 -1926.33 1.00 1959.44 1.13 -1886 6.00 -35.00
1979 168 3261 223 1756.45 0,51 -1925.72 1.03 1958.97 1,20 -18.86 6.00 -35.00
1979 240 4255 220 1756.36 1.27 -1925.63 0.87 195856 0.96 -18.86 6,00 -35.C0
1979 288 4918 212 1755.61 0.50 -1925,68 0.84 1958.49 1.07 -18,86 6.00 -35.00
1979 312 5250 217 1756.19 1.51 -192562 0.96 1958.46 1.10 -19.00 6.00 -35.00
1980 7 6078 220 175600 0.23 -1925.59 0.97 1958.10 1.28 -18.33 6.00 -35.00
1980 43 6577 230 175628 0.72 -1925.42 1.13 1957.92 1,07 -19.00 6.00 -35.00
1980 103 7405 218 1756.03 0.16 -1925.61 1.02 1957.95 1.23 -1833 6.00 -35.00
1980 187 8568 230 1756.07 0.26 -1925.60 090 1957,77 1.00 -18.33 6.00 -35.00
1980 211 8899 213 1756.00 0,00 -1926.26 1.03 1958.23 1.07 -18.33 6,00 -35.00
1980 223 9065 214 1756.00 0.00 -1926,27 1.01 195837 1.11 -1833 600 -35,00
1980 283 9894 205 1755.46 0.51 -192652 1,00 195821 1.33 -18.33 6.00 -35.00
1980 319 10390 200 1755.08 0.48 -1926.51 0.98 1958.35 1.11 -18.46 600 -35.C0
1981 I 11054 204 1755.05 0.23 -1926.44 1.10 1957.97 1,16 -18.46 6.00 -35.00
1981 37 11551 211 1755.52 0.64 -1926.38 1.13 1957.85 1.06 -18.46 6.00 -35.00
1981 109 12547 209 1755.25 0.59 -1926.55 0.98 1958.09 1.20 -19.0_) 6.00 -35.00
1981 193 13707 212 1756,00 0,00 -1926.81 0.93 1958.50 1.01 -19.00 6.00 -35.00
1981 193 13708 209 1756.00 0,00 -1926.67 0.91 195828 1.32 -18.46 600 -35,00
22

Temperatur
Year Day Orbit e (*C)*I0
1981 253 14537 204
1981 325 15534 215
1982 8 16196 217
1982 44 16692 209
1982 104 17523 215
1982 188 18682 205
1982 248 19513 209
1982 320 20508 208
1983 3 21172 212
1983 39 21668 212
1983 Ill 22663 208
1983 183 23658 203
1983 327 25650 225
1984 10 26313 202
1984 46 26822 237
1984 118 27807 205
1984 190 28803 204
1984 190 28804 205
1984 298 30294 194
1985 4 31290 210
1985 52 31963 234
1985 112 32787 217
1985 232 34447 218
1985 280 35106 196
1985 328 35771 211
1986 23 36599 209
1986 83 37430 217
1986 179 38756 204
1986 179 38757 205
1986 227 39421 209
1986 275 40083 199
1987 78 42406 212
1987 139 43246 173
1987 139 43247 174
1987 199 44078 185
Table 8. Counts Values During Calibrations
Tl_rmopile Heart Current
Standard Standard
Average Deviation Average Deviation
1755.57 0.50 -1926.66 0.81
175551 0.51 -1926,45 IH
1755,80 0.82 -1926.40 1.15
1756.07 0.47 -1926.91 1.02
175625 0.44 -1926.85 0.93
1755.69 047 -1926.88 1,00
1756.02 0.15 -1927.50 0,95
1756.07 0.83 -1927,48 1.02
1755.72 0.85 -192709 1.06
175635 0,48 -1927.53 0,96
175564 0.48 -1926.88 1,05
1756.00 0,00 -1927.51 1,04
1756.08 0.27 -192660 0,85
1755,87 095 -1927.30 1.11
175687 0.34 -1926.48 1,09
1755.97 0.16 -1927,39 1.08
1755.81 0.40 -1927.53 0.94
1755.00 0.(_) -1927.62 0.96
175560 0,49 -1927.91 1.02
1755,90 031 -1927.21 1.01
1756.79 041 -1926.53 0.96
1756.07 0,45 -1926.67 0.97
1756.02 015 -192726 1.05
1755.32 0.61 -192756 0,96
1756.07 0.47 -1927.47 0.98
175592 027 -1927.38 0,99
1756,07 0,47 1927.16 0.95
1756,81 0,40 -t928.50 1.01
1756.24 0.44 1928.47 1.07
1756.72 046 -1927.98 1.00
1756.05 0.21 -192828 0,98
1756.23 1.29 -1927,23 0.93
175726 044 -1930.62 1.04
175700 000 193055 1.04
1755.95 1.28 -1928.73 0,94
tteater Voltage Offsets
Standard
Average Deviation Thermal Amps Volts
1958.56 0.91 -1846 6.00 -35.00
1957.93 1.20 -1845 6.00 -35.00
1958,23 1.06 -18.45 6,00 -35.00
1958.56 0.96 -18.45 6.00 -35.00
1958.62 0.99 -19.00 6.00 -35.00
1958.44 1.39 -18,45 6.00 -3500
1958.89 1.10 -1845 6.00 -35.00
1958.55 1,02 -18.56 6.00 -35.00
1958.49 1.00 -18.56 6.00 -35.00
1958.70 0.94 -1856 6.00 -35.00
195841 1.1 I -1856 6.00 35.00
195886 1.08 -1856 600 -35.00
1958.35 1.17 -18.61 6.00 -35.00
1958.46 1.10 -18.61 6.00 -35.00
1958.05 1.19 -1861 6.00 -35.00
1958.50 1,34 -1861 6.00 -35.00
1958.48 2.06 -18.61 6.00 -35.00
195857 0.94 -18.61 6.(X) -35.00
1959.05 1.09 -1874 6.00 -35.00
1958.44 135 -19.00 6.00 -35.00
1958.23 151 -18.74 6.00 -35.(30
1958.48 1.11 -19.00 600 -3500
1958.57 0.93 -18.74 600 -35.00
1958.61 0.99 -1874 600 35,00
1958.57 0.99 -1900 6.00 -3500
1958,39 1.41 -18,80 6.00 -3500
1958.45 I. I I - 18,80 6 00 -35.00
1959.59 0.96 -18.80 6.00 -3500
1959.53 0.94 -18,80 6.00 -35.00
1959.21 1.25 -1880 6.(20 -35.00
1959,O7 1,23 19,00 6,00 35f_
1958.46 1.10 -18,96 600 -3500
1960.44 1.05 - 18.96 6.130 -35.00
1960 42 1.16 -18.96 600 -35 00
1959.59 0,96 -18.96 6.00 -35.00
23
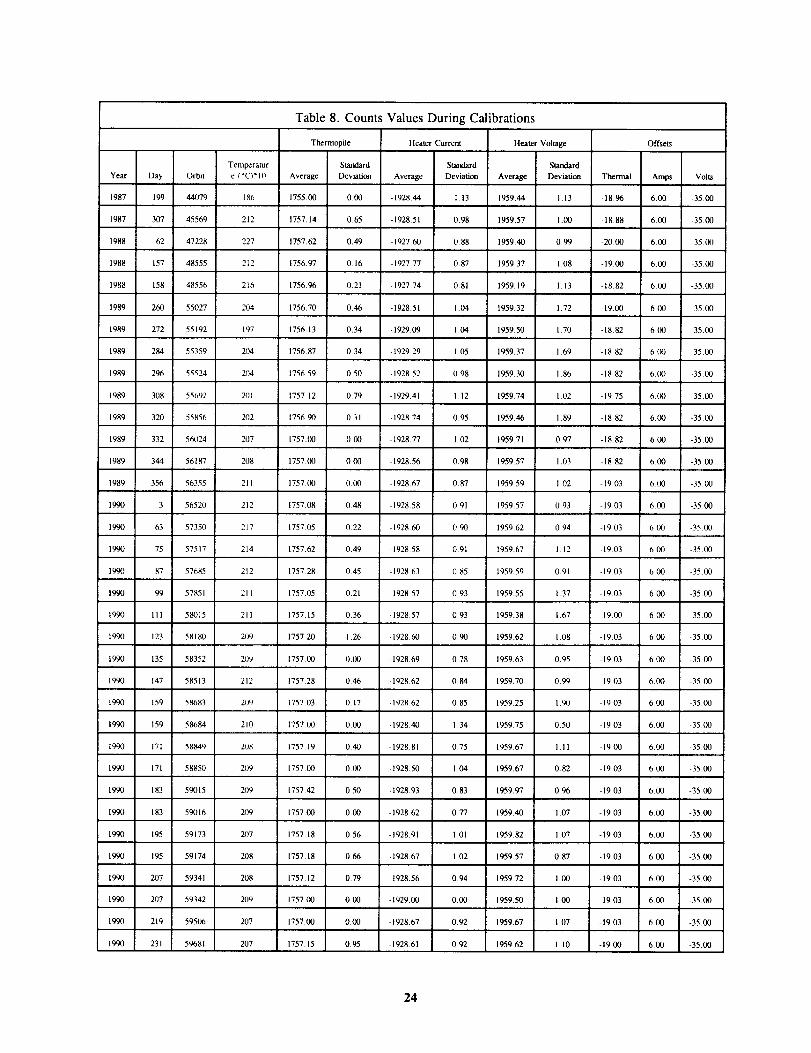
Table8.CountsValuesDuringCalibrations
Thermopile Hearer Current Heart Volage Offse_
Temperatur Standard Standard Standard
Year Day Orbit e (°C)'I0 Average Deviauon Average Deviation Average Deviation Thermal Amps Vol_
1987 199 44079 186 1755.00 0.00 -1928,44 1.13 1959.44 1.13 -18.96 6.(_) -35.00
1987 307 45569 212 1757.14 065 -1928.51 0.98 1959.57 1.00 -18,88 6.00 -35.00
1988 62 47228 227 1757.62 0,49 -192760 0.88 1959.40 0.99 -_100 6.00 35.00
1988 157 48555 212 1756.97 016 -1927.77 0.87 1959.37 1.08 -1900 6.00 35.00
1988 158 48556 216 1756.96 0.21 -1927.74 081 1959.19 1.13 18.82 600 -35.00
1989 260 55027 204 1756,70 0,46 -1928.51 1.04 1959.32 1.72 -19.00 6.00 35.00
1989 272 55192 197 1756.13 0,34 1929.09 1.04 1959.50 170 -1882 6.(_ -35.(X)
1989 284 55359 204 1756.87 0.34 -1929.29 1.05 1959.37 169 1882 600 35_00
1989 296 55524 2(_ 1756.59 0.50 -1928.52 098 1959.30 186 -18,82 6.01.) -3500
1989 308 55692 2(11 1757,12 0.79 -1929.41 1.12 1959.74 102 -1975 600 -35.00
1989 320 55856 202 1756,90 031 -1928.74 095 1959,46 1.89 -18,82 600 -35.00
t989 332 5_124 207 1757.00 0,00 -1928.77 102 195971 097 -1882 600 -35.00
1989 344 56187 208 175700 000 -1928.56 0,98 1959.57 1.03 1882 600 -3500
1989 356 56355 211 175700 0.00 -192867 0.87 195959 102 1903 6.(10 -3500
1990 3 56520 212 1757,08 048 -1928.58 091 1959.57 093 -1903 6.00 -3500
1990 63 57350 217 1757.05 0.22 -1928.60 090 1959.62 094 1903 6.(_ -35.(:0
1990 75 57517 214 1757.62 0,49 -1928.58 0,91 1959.67 112 -19.03 6.00 -35.00
1990 87 57685 212 1757.28 0.45 -192863 085 1959.59 0.91 -19.03 600 35.(10
1990 99 57851 211 1757.05 0.21 -192857 093 1959.55 137 -19.03 600 -35.00
1990 111 58015 211 1757.15 0.36 -192857 093 1959.38 1.67 19.00 600 -35.00
1990 123 58180 209 1757.20 1.26 -1928.60 0.90 1959.62 1,08 -19.03 6.00 -35.00
1990 135 58352 209 1757.00 0.00 -1928.69 0.78 1959.63 0.95 -19.03 600 -3500
1990 147 58513 212 1757.28 0,46 -192862 084 1959.70 0.99 1903 6.00 -3500
t990 t59 58683 2(N 1757.03 0.17 -1928.62 0.85 1959.25 190 1903 6130 -35.00
19912 159 58684 210 175700 0.00 -1928.40 134 195975 050 -1903 6.00 -35 (_
1990 171 58849 208 175719 0.40 1928.81 075 195967 I.I1 19.00 6.00 -35.00
1990 171 58850 209 1757.00 000 -1928.50 1.04 195967 082 19 03 600 -35.00
1990 183 59015 209 1757.42 050 -1e/28.93 083 195997 096 -19.03 6.00 -3500
19CA} 183 59016 _N 1757.00 0.00 -1928.62 077 1959.40 1.07 1903 6.00 -3500
1990 195 59173 _17 1757.18 0.56 -1928.91 101 195982 107 -1903 6.00 -3500
1990 195 59174 208 1757.18 0.66 -1928.67 102 195957 087 -1903 600 -3500
1990 207 59341 208 1757.12 0.79 -1928.56 094 195972 100 -1903 6.00 -35,00
1990 207 59342 209 1757130 0.00 -1929.00 0.(K) 1959.50 100 1903 600 -3500
1990 219 59506 207 1757.00 0.00 -192867 0.92 1959.67 1,07 -1903 600 -35.00
1990 231 59681 207 175715 0,95 -192861 0.92 1959.62 1.10 -1900 600 -3500
24
Ten11-_ral_r
Year Day Orbit e (°C)*I0
199(I 243 59839 208
1990 255 60006 209
199(/ 267 60172 207
1990 279 60340 207
1990 291 00506 205
1990 303 60670 205
1990 315 60838 2(18
1990 327 610(12 209
1990 339 61165 209
1990 351 61334 215
1990 363 61501 217
1991 34 61998 222
1991 58 62329 224
1991 70 62494 22 I
1991 82 62661 217
1991 94 62830 213
1991 1116 62993 212
1991 118 63163 209
1991 130 63327 209
1991 142 63491 211
1991 166 63823 209
1991 166 63824 209
1991 178 63991 209
1991 178 63992 209
1991 190 64154 208
1991 190 64155 209
1091 202 64320 212
1991 214 64485 209
1991 226 64655 212
1991 238 64819 212
1991 250 64986 212
1991 262 65153 290
1991 274 65317 211
1991 286 65484 215
1991 298 65649 212
Table 8. Counts Values During Calibrations
Thermopile ttea_r Current
S_ndard Standard
Average Deviation Average Deviauon
175707 0 47 -192856 0 94
175698 0.16 192855 0 93
175697 016 -192862 I 04
1756.51 121 -192855 102
175682 039 -1928.67 094
175690 030 -1928 63 085
175698 016 -192855 I00
175721 I 28 -192859 091
1756 98 0 15 192864 (182
1757 28 070 -192860 0 89
1757 DO 0(_ 192850 100
175712 052 -192833 1 06
175715 066 -192821 0.94
175729 071 -1928 45 109
175718 039 -192853 098
175707 026 -192855 098
175734 048 1928 59 092
1757,47 0 73 -1928 61 115
175754 051 -192914 104
1757 91 0 88 -192914 097
175740 050 -192871 086
175700 0.00 -192871 I 25
1757.33 0 52 -192887 083
1757 07 025 192880 085
175756 051 1929 16 I10
175714 038 192911 I 05
175745 0 50 192879 098
175723 043 192886 105
1757.54 051 -192885 099
175756 050 192893 095
175735 125 -192877 092
175769 047 -192919 101
175700 0,(_ -1928 57 091
175764 0 49 -192898 094
175741 050 -1928.93 IDO
Heart Vol_ge Offse_
Standard
Average Deviation Thermal Amps Volu
195957 101 19 03 600 3500
1959 31 176 -1900 600 3500
1959 72 I 02 -1903 600 3500
195957 1.02 1903 6(20 -3500
195967 108 -19 03 600 -35 DO
195977 104 19 03 6 00 -35 (K)
195951 183 19 03 6 DO -35 DO
195969 098 19 (_ 6 DO 350(}
195977 I 1X1 -19 03 600 35 (;0
196007 0 96 -19 (13 600 35 DO
1958 73 304 -19 50 600 3500
195952 099 -1903 600 35 0(I
195959 091 19 03 600 35 (XI
195977 099 19 03 600 -3500
195947 1 06 -1903 600 3500
195952 1 17 19 03 600 -35 (_
195966 138 -1903 600 3500
19601,'O 106 -19DO 600 35 (X)
196020 1 16 -1903 600 -3500
196034 1 14 -1903 600 -3500
196006 118 -1903 600 35(;0
195944 1 51 -1903 6C0 -350()
196022 109 19 03 600 -3500
1959 87 101 1903 600 -351;0
195994 2 05 1903 6(;0 -35DO
195989 1 27 1903 6(;0 -3500
195997 1 09 -1903 6(;0 -3500
195983 1 22 -1900 600 3500
196003 148 -1900 600 3500
195982 183 -1903 600 -35DO
1959 95 097 -1903 600 -35{_
196018 125 -19.DO 600 -35DO
195972 141 -19.03 600 -3500
195980 187 19 03 600 -3500
196000 114 -1903 600 -3500
25
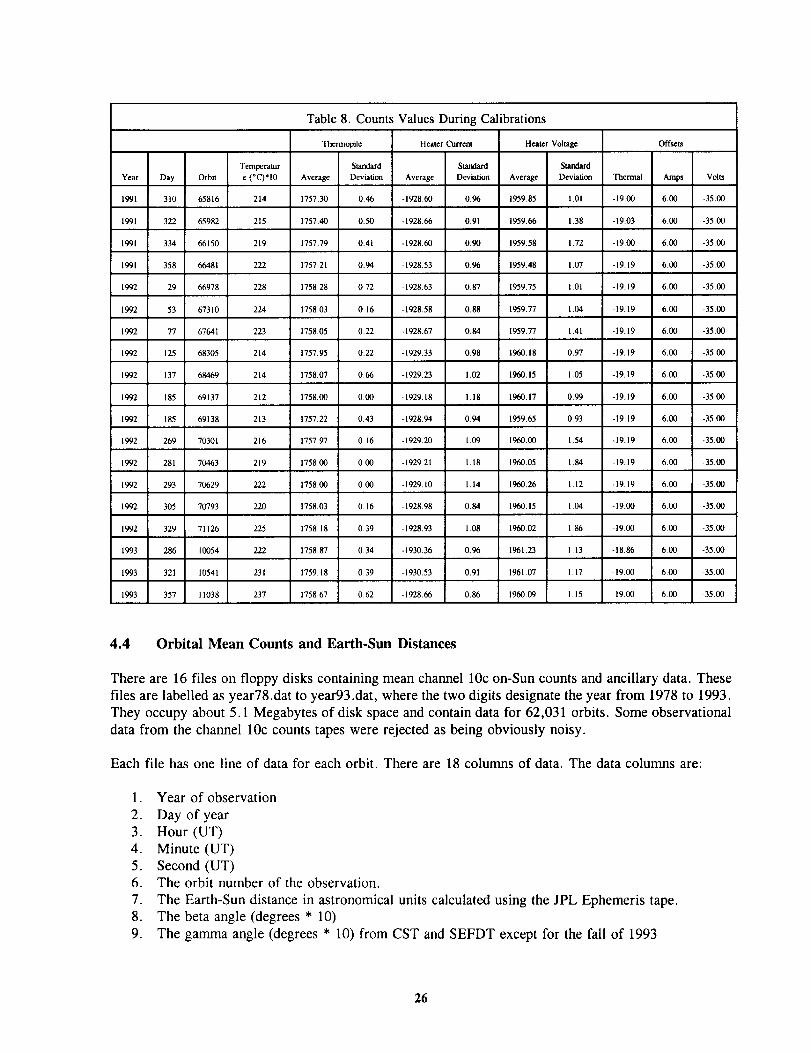
Table 8. Counts Values During Calibrations
Thermopile Heater Current Heater Voltage Offsets
Temperatur Standard Standard Standard
Year Day Orbit e (*C)*I0 Average Deviation Average Deviation Average Deviation Thermal /maps Volts
1991 310 65816 214 1757.30 0.46 -1928.60 0.96 1959.85 1.01 -19.00 6.00 -35.00
1991 322 65982 215 1757.40 0.50 -1928.66 0.91 1959.66 1.38 -19.03 6.00 -35.00
1991 334 66150 219 1757.79 0.41 -1928.60 0.90 1959.58 1.72 -19.00 6.00 -35.00
1991 358 66481 222 1757.21 0.94 -1928.53 0.96 1959.48 1.07 -19.19 6.00 -35.00
1992 29 66978 228 1758,28 072 -1928.63 0.87 t959.75 1.01 -19.19 6.00 -35.00
1992 53 67310 224 1758.03 0.16 -1928.58 0.88 1959.77 1.04 -19.19 6.00 -35.00
1992 77 67641 223 1758.05 0.22 -1928.67 0.84 1959.77 1.41 -19.19 6.00 -35.00
1992 125 68305 214 1757.95 0.22 -1929.33 0.98 t960.18 0.97 -19.19 6.00 -35,00
1992 137 68469 214 1758.07 0.66 -1929.23 1.02 1960.15 1.05 -19.19 6.00 -35.00
1992 185 69137 212 1758.00 0,00 -1929.18 1.18 1960.17 0.99 -19.19 6.00 -35.00
1992 185 69138 213 1757.22 0.43 -1928.94 0.94 1959.65 0.93 -19.19 6.00 -35.C0
1992 269 70301 216 1757.97 0,16 -1929.20 1.09 1960.00 1.54 -19.19 6.00 -35.00
1992 281 70463 219 1758.00 0.00 -1929.21 1.18 1960.05 1.84 -19.19 6.00 -35.00
1992 293 70629 222 1758.00 0,00 -1929.10 1.14 1960.26 1.12 -19.19 6.00 -35.00
1992 305 70793 220 1758.03 0.16 -1928.98 0.84 1960.15 1.04 -19.00 6.00 -35.00
1992 329 71126 225 1758.18 0,39 -1928.93 1.08 1960.02 1.86 -19.00 600 -35.00
1993 286 10054 222 1758.87 0.34 -1930.36 0.96 1961.23 1.13 -18.86 6.00 -35.00
1993 321 10541 231 1759,18 0.39 -1930.53 0.91 1961.07 1.17 -19.00 6.00 -35.00
1993 357 11038 237 1758.67 0.62 -1928.66 0.86 1960.09 1.15 -19.00 6.00 -35.00
4.4 Orbital Mean Counts and Earth-Sun Distances
There are 16 files on floppy disks containing mean channel 10c on-Sun counts and ancillary data. These
files are labelled as year78.dat to year93.dat, where the two digits designate the year from 1978 to 1993.
They occupy about 5.1 Megabytes of disk space and contain data for 62,031 orbits. Some observational
data from the channel 10c counts tapes were rejected as being obviously noisy.
Each file has one line of data for each orbit. There are 18 colunms of data. The data columns are:
1. Year of observation
2. Day of year3. Hour (UT)
4. Minute (UT)
5. Second (UT)6. The orbit number of the observation.
7. The Earth-Sun distance in astronomical units calculated using the JPL Ephemeris tape.8. The beta angle (degrees * 10)
9. The gamma angle (degrees * 10) from CST and SEFDT except for the fall of 1993
26

10.Thespacelookcountstimes100taken13minutesbeforethesunentersthefield of viewof theradiometer.32onesecondobservationsareusedto calculatethisvalue.It is abbreviatedasaT-13observation.
11.Themaximumon-Suncountstimes100,calculatedfromthemeanof 42onesecondobservations.It is abbreviatedasa T observation.
12.Thespacelookcountstimes100taken13minutesafterthesunhasenteredthefield of viewoftheradiometer.32onesecondobservationsareusedto calculatethisvalue.It is abbreviatedasa T+ 13observation.
13.Thestandarddeviationtimes100of theT-13observation.
14.Thestandarddeviationtimes100of theT observation.
15.Thestandarddeviationtimes100of theT+ 13observation.
16.Thetemperatureof theradiometerbaseplateduringtheT-13observation.It is anaverageof twomeasurements.
17.Thetemperatureof theradiometerbaseplateduringtheT observation.It is anaverageof twomeasurements.
18.Thetemperatureof theradiometerbaseplateduringtheT+ 13observation.It isanaverageof twomeasurements.
A sampleof atypicaldatafile is listedin Table9.
Table9.Sampleoftheformatintheyear**.datfileusingyear90.dat.
Counts x 10 Stand_d Deviation Tp (°C)*I0
Year Day tttfMMSS Orbit AU _ _ T-13 T T_I3 -13 0 +13 -13 0 _13
1990 I 14956 56492 ,9833348 74 -70 -1900 183100 -1600 0 22 0 206 207 216
1990 1 33427 56493 .9833336 71 -70 -1900 183069 -1600 0 46 0 206 207 217
1990 1 51811 56494 .9833324 73 -70 -1900 183104 -1600 0 22 0 206 207 217
1990 1 70243 56495 .9833312 73 -70 -1900 183087 -1600 0 33 0 207 209 217
1990 1 84627 56496 ,9833301 74 -70 -1900 183152 -1600 0 50 0 207 209 218
1990 I 103043 56497 .9833290 74 -70 -1900 183147 -1600 0 50 0 209 210 220
1990 I 121459 56498 .9833279 72 -70 -1900 183147 -1600 0 50 0 209 210 220
1990 I 135859 56499 9833268 74 -70 -1903 183150 -1600 17 50 0 209 209 2t9
1990 I 154315 56500 9833257 73 -70 -1900 183154 -1600 0 50 0 208 209 219
1990 I 172715 56501 9833247 73 -70 -1900 183162 -1600 0 49 0 208 209 219
1990 1 191131 56502 9833237 75 -70 -1900 183192 -1600 0 26 0 207 209 218
1990 I 205531 56503 9833227 73 -70 -1900 183175 -1600 0 43 0 207 207 217
27
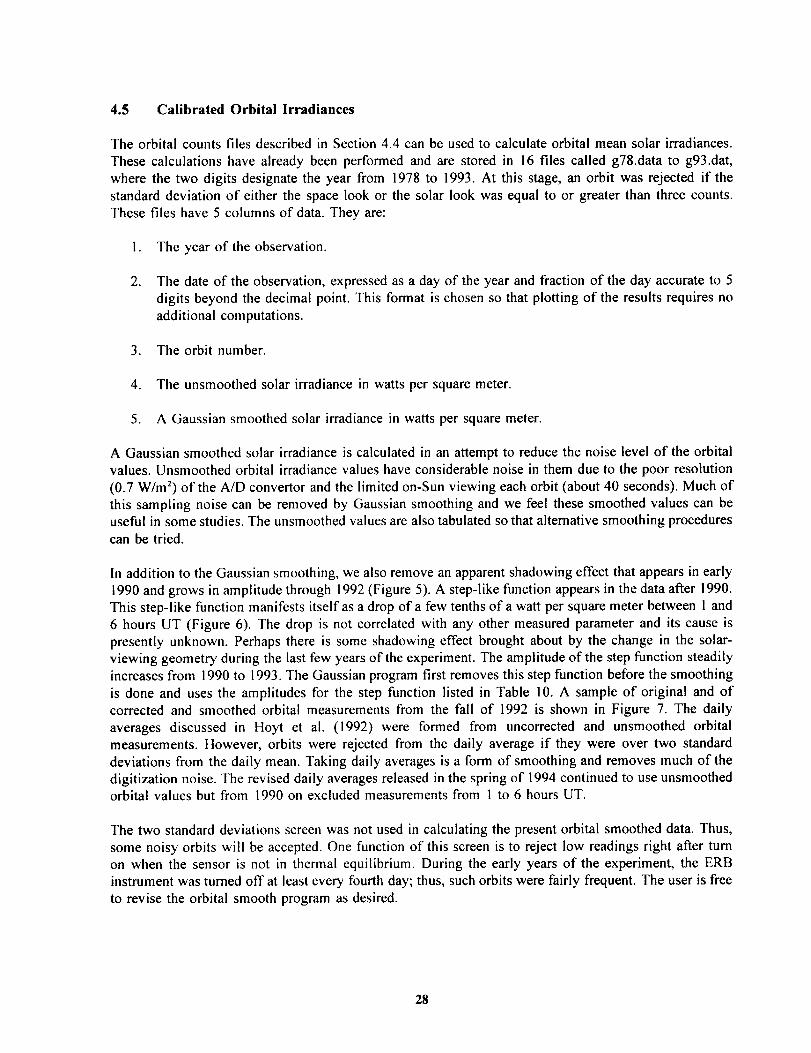
4.5 CalibratedOrbital Irradiances
The orbital counts files described in Section 4.4 can be used to calculate orbital mean solar irradiances.
These calculations have already been performed and are stored in 16 files called g78.data to g93.dat,
where the two digits designate the year from 1978 to 1993. At this stage, an orbit was rejected if the
standard deviation of either the space look or the solar look was equal to or greater than three counts.
These files have 5 columns of data. They are:
i. The year of the observation.
. The date of the observation, expressed as a day of the year and fraction of the day accurate to 5
digits beyond the decimal point. This format is chosen so that plotting of the results requires no
additional computations.
3. The orbit number.
4. The unsmoothed solar irradiance in watts per square meter.
5. A Gaussian smoothed solar irradiance in watts per square meter.
A Gaussian smoothed solar irradiance is calculated in an attempt to reduce the noise level of the orbitalvalues. Unsmoothed orbital irradiance values have considerable noise in them due to the poor resolution
(0.7 W/m 2) of the A/D convertor and the limited on-Sun viewing each orbit (about 40 seconds). Much of
this sampling noise can be removed by Gaussian smoothing and we feel these smoothed values can beuseful in some studies. The unsmoothed values are also tabulated so that alternative smoothing procedures
can be tried.
In addition to the Gaussian smoothing, we also remove an apparent shadowing effect that appears in early
1990 and grows in amplitude through 1992 (Figure 5). A step-like function appears in the data after 1990.
This step-like function manifests itself as a drop of a few tenths of a watt per square meter between 1 and
6 hours UT (Figure 6). The drop is not correlated with any other measured parameter and its cause is
presently unknown. Perhaps there is some shadowing effect brought about by the change in the solar-
viewing geometry during the last few years of the experiment. The amplitude of the step function steadily
increases from 1990 to 1993. The Gaussian program first removes this step function before the smoothing
is done and uses the amplitudes for the step function listed in Table 10. A sample of original and ofcorrected and smoothed orbital measurements from the fall of 1992 is shown in Figure 7. The daily
averages discussed in Hoyt et al. (1992) were formed from uncorrected and unsmoothed orbitalmeasurements. However, orbits were rejected from the daily average if they were over two standard
deviations from the daily mean. Taking daily averages is a form of smoothing and removes much of the
digitization noise. The revised daily averages released in the spring of 1994 continued to use unsmoothedorbital values but from 1990 on excluded measurements from 1 to 6 hours UT.
The two standard deviations screen was not used in calculating the present orbital smoothed data. Thus,
some noisy orbits will be accepted. One function of this screen is to reject low readings right after turnon when the sensor is not in thermal equilibrium. During the early years of the experiment, the ERB
instrument was turned off at least every fourth day; thus, such orbits were fairly frequent. The user is free
to revise the orbital smooth program as desired.
28

Thefollowingequationis usedto performtheGaussiansmoothing:
SsmoothX S. exp(-(S.= o - Sn)2/'/"2
E exp(-(S,= 0 - Sn)2/'r 2)(10)
where S is the orbital solar irradiance, tau is a time constant equal to 5 orbits, and the summation isperformed from n = -25 to n -- +25.
"Shadowing" Effect on Daily Meansfor Nimbus-7 Solar Irradiances
0.03
0.02
•$ o.oo
-0.01
-0.02-
_" -0.03-
,.', _0.04 _
"_ -0.05-
-0.06-
-0.07-
-0'08_'8 80 8'2 8'4 1 8_8 9'0 9'286 9,4
Year
Figure 5. The onset and development of the low morning signal problem is illustrated here. The graph shows
the difference (daily average minus abbreviated daily average). The abbreviated daily average is formed byomitting orbits for the period (1 to 6 hours) UT.
29

Smoothed Deviations from Mean, 1992before & after removal of daily cycle
0.4
L-
,= 0.2-
t__
tl:30" 0.0-
L_
Q.
-0.4o.o o'.1 6.2 6.3 6.4 o'.s o'._ o17 o'.8 o'.9 1.0
Fraction of Day
Figure 6. From 1990 onward, the mean measured signal is slightly smaller early in the observing day than it is later
on. The decrease occurs from 1 to 6 hours UT or from O. 04 to 0.25 day fractions. The mean deviations from the
daily mean during 1992 are shown here. Assuming that this problem is caused by some unidentified morning shadow,the measurements can be corrected as shown.
Table 10. Co_ectionfor shadowing effect between 1 and 6 hours UT.
Year Co_ection (W/m 2)
<1990 0.00
1990
1991
_!992
0.08
0.25
0.35
30
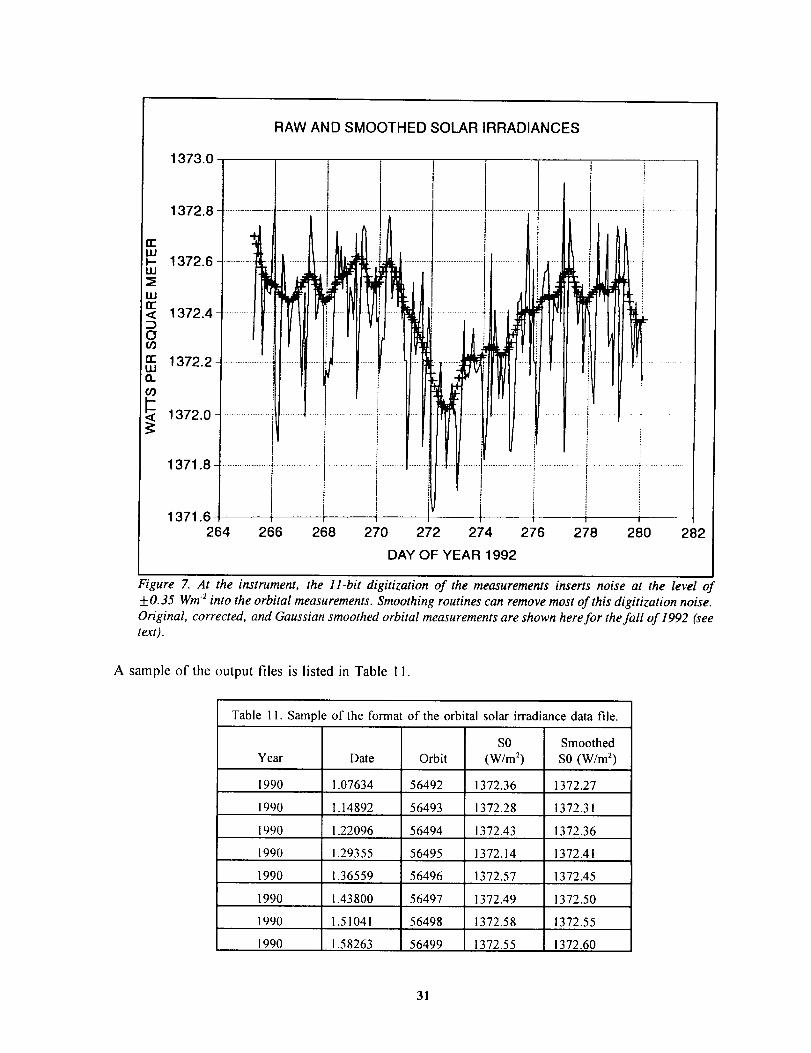
tr"
!.1.1
tl.!
DOo9
F.O..
09
1373.0
1372.8 ................
1372.6 .............
1372.4 .........
1372.2 ..............
1372.0 .........
1371.8 ............................
1371.6264
RAW AND SMOOTHED SOLAR IRRADIANCES
I !
266 268 270 272 274 276 278 280 282
DAY OF YEAR 1992
Figure 7. At the instrument, the 11-bit digitization of the measurements inserts noise at the level of
+0. 35 Wm: into the orbital measurements. Smoothing routines can remove most of this digitization noise.
Original, corrected, and Gaussian smoothed orbital measurements are shown here for the fall of 1992 (seetext).
A sample of the output files is listed in Table 11.
Table 11. Sample of the format of the orbital solar i_adiance data file.
SO Smoothed
Year D_e Orbit (W/m 2) SO (W/m 2)
1990 1.07634 56492 1372.36 1372.27
1990 1.14892 56493 1372.28 1372.31
1990 1.22096 56494 1372.43 1372.36
1990 1.29355 56495 1372.14 1372.41
1990 1.36559 56496 1372.57 1372.45
1990 1.43800 56497 1372.49 1372.50
1990 1.51041 56498 1372.58 1372.55
1990 1.58263 56499 1372.55 1372.60
31

Table I I. Sample of the format of the orbital solar irradiance data file.
SO Smoothed
Year Date Orbit (W/m 2) SO (W/m E)
1990 1.65503 56500 1372.62 1372.64
1990 !.72726 56501 1372.68 1372.69
1990 1.79966 56502 1372.81 1372.73
1990 1.87189 56503 1372.85 1372.77
1990 1.94429 56504 1372.75 1372.80
The program to perform the Gaussian smoothing and to provide the irradiance values in column five islisted below.
program gaussc
c apply Gaussian filter to orbital solar irradiances for Nimbus-7c using c:\counts\orbitsO.dat
c also remove daily cycle in data for 1990-1993
c all ideas for program are by Douglas Hoyt, who wrote the program as well
c
integer array1(51),tmp1(51),tmp4(51),idoy(51),tmp5(51),iyr(51)
real*4 array2(51),rnum(51),rden(51),tmp2(51),tmp3(51)
real*4 smooth,tau,sum1,sum2,sfrac(51)
tau = 5.0
icnt = 0
c orbitsO.dat contains raw orbital solar irradiances
open(5,file=,c:\counts\orbitsO.dat',status='old',1 form='formatted')
open(18,fite='c:\counts\g78.dat'
open(19,fite='c:\counts\g79.dat'
open(20,file='c:\counts\gSO.dat'
open(21,file='c
open(22,file='c
open(23,fite='c
open(24,fite='c
open(25,file='c
open(26,fi[e='c
open(27, file='c
open(28,fite='c
open(29, fite='c
open(30,file='c
open(31,file='c
do 1 i = 1, 51
:\counts\g81.dat'
:\counts\g82.dat
:\counts\g83.dat
:\counts\g84.dat
:\counts\g85.dat
:\counts\g86.dat
:\counts\g87.dat
:\counts\g88.dat
:\counts\g89.dat
:\counts\g90.dat
:\counts\g91.dat
status='new'
status=tnewl
status='new'
status='new'
status=,new '
status='new'
status=,new '
status='new'
status=_new ,
status=mew ,
status='new'
status='new'
status=_newr
status=,new t
form=,formatted _)
form='formatted')
form='formatted')
form='formatted')
form='formatted')
form='formatted')
form='formatted')
form='formatted')
form='formatted')
form='formatted')
form='formatted')
form='formatted')
form='formatted')
form='formatted')
read(5,100) iyr(i),idoy(i),sfrac(i),arrayl(i),array2(i)
if(i.te.15) write(18,101) iyr(i),idoy(i),sfrac(i),arrayl(i),
1 array2(i),array2(i)
if(i.le.15) write(6,101) iyr(i),idoy(i),sfrac(i),arrayl(i),
1 array2(i),array2(i)
100 format(i2, i4,f6.5,iT, fS.2)
I continue
200 continue
do 6 j = 1, 51
tmpl(j) = arrayl(j)
tmp2(j) = array2(j)
tmp3(j) = sfrac(j)
tmp4(j) = idoy(j)
tmpS(j) = iyr(j)6 continue
c cat[ stddev(51,array2,ave,sig)
c thigh = ave + 1.4*sigc ttow= ave - 1.4*sig
c
c remove daily cycle in 1990-1993 data
c
32

do 2 j = 1, 51
if(iyr(j).eq.90.and.sfrac(j).ge.O.O4.and.sfrac(j).te.O.2500)
1 array2(j) = array2(j) + 0.08
if(iyr(j).eq.91.and.sfrac(j).ge.O.O4.and.sfrac(j).te.O.2500)
1 array2(j) = array2(j) + 0.25
if(iyr(j).eq.92.and.sfrac(j).ge.O.O4.and.sfrac(j).le.O.2500)
1 array2(j) = array2(j) + 0.35
if(iyr(j).eq.93.and.sfrac(j).ge.O.O4.and.sfrac(j).le.O.2500)
1 array2(j) = array2(j) + 0.352 continue
do3 j = 1, 51
rnum(j) = 0.0
rden(j )= 0.03 cont inue
do4j=1,51
jj = j - 26
c i f(array2(26+j j) .ne.O.O) then
rnum( j ) =at ray2(26+ j j )*exp( - ( ( ar ray1 (26) - ar ray1 ( 26+j j ) )1 /tau)**2)
rden( j ) =exp( - ( ( ar ray1 (26) - ar ray1 (26+j j ) )/t au)**2)c end i f
4 cont inue
sum1 = 0.0
sum2 = 0.0
doS j=1,51sum1 = sum1 + rnum(j)
sum2 = sum2 + rden(j)
5 cont i hue
smooth = suml/sum2
nunit = iyr(26) - 60
write(nunit, I01) iyr(26), idoy(26), sf rac(26), tmp1(26), ar ray2( 26),
I smooth
wri te(6,101 ) iyr(26), idoy(26), sf rac(26), t_1 (26) ,array2(26), smooth
101 format(Ix0i2,i4,f6.5,i7,2fS.2)
do7j = I0 50
array1(j) = tmp1(j+1)
array2(j) = tmp2(j+1)
sfrac(j) = tmp3(j+1)
idoy(j) = tmp4(j+1)
iyr(j) = tmp5(j+1)
7 continue
read(5a100,end=9999) iyr(51),idoy(51),sfrac(51),array1(51),
I array2(51)
if (iyr(51) .eq.80. and. idoy(51) .eq.2.and. sf rac(51). It.O.02) then
close(18)
open(32, f i t e= ' c : \count s\g92, dat ', status= ' new', form= ' format ted' )endif
if(iyr(51).eq.81.and, idoy(51).eq.1.and.sfrac(51).lt-0.1) then
ctose(19)
open(33, f i t e= ' c : \count s\g93, dat ', status= _new', form= ' format ted' )endi f
i f( iyr(51 ) .eq.93. and. idoy(51 ).eq.348) stop
go to 200
9999 stopend
subrout i ne s tddev( k, s, ave rag, s i gma)c catculates mean and standard deviation of vector s with
c length of kreal*4 s(k) 0averag,sigma
sum=O.O
do 10 i=l,k
sum=sum+s (i )
10 continue
averag=sum/f [oat (k)
sum=O.O
do 20 i=1,k
sum=sum+ (s( i )-averag)**2
20 continue
if(k.eq.1) sigma=0.0
If(k.ge.2) s igma=sqr t(sum/f loat (k- I))
return
end
33
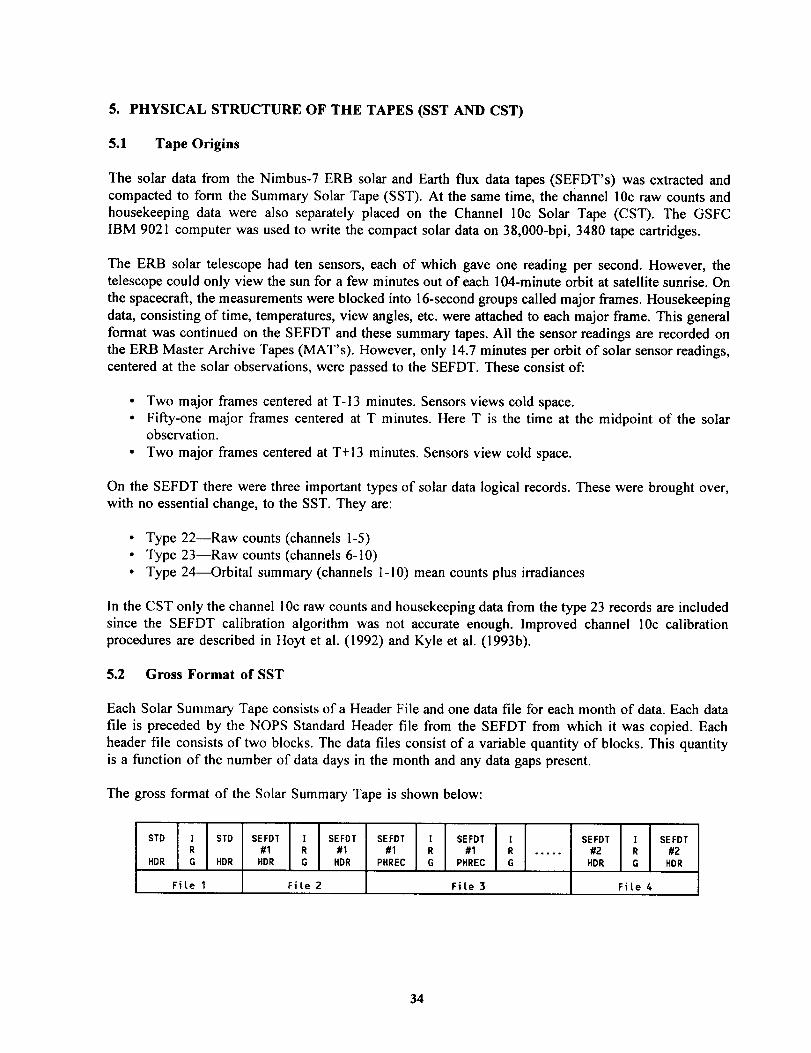
5. PHYSICAL STRUCTURE OF THE TAPES (SST AND CST)
5.1 Tape Origins
The solar data from the Nimbus-7 ERB solar and Earth flux data tapes (SEFDT's) was extracted andcompacted to form the Summary Solar Tape (SST). At the same time, the channel 10c raw counts and
housekeeping data were also separately placed on the Channel 10c Solar Tape (CST). The GSFC
IBM 9021 computer was used to write the compact solar data on 38,000-bpi, 3480 tape cartridges.
The ERB solar telescope had ten sensors, each of which gave one reading per second. However, thetelescope could only view the sun for a few minutes out of each 104-minute orbit at satellite sunrise. On
the spacecraft, the measurements were blocked into 16-second groups called major frames. Housekeeping
data, consisting of time, temperatures, view angles, etc. were attached to each major frame. This general
format was continued on the SEFDT and these summary tapes. All the sensor readings are recorded on
the ERB Master Archive Tapes (MAT's). However, only 14.7 minutes per orbit of solar sensor readings,centered at the solar observations, were passed to the SEFDT. These consist of:
• Two major frames centered at T-13 minutes. Sensors views cold space.
• Fifty-one major frames centered at T minutes. Here T is the time at the midpoint of the solarobservation.
• Two major frames centered at T+13 minutes. Sensors view cold space.
On the SEFDT there were three important types of solar data logical records. These were brought over,with no essential change, to the SST. They are:
• Type 22--Raw counts (channels 1-5)
• Type 23--Raw counts (channels 6-10)
• Type 24---Orbital summary (channels 1-10) mean counts plus irradiances
In the CST only the channel 10c raw counts and housekeeping data from the type 23 records are included
since the SEFDT calibration algorithm was not accurate enough. Improved channel 10c calibration
procedures are described in Hoyt et al. (1992) and Kyle et al. (1993b).
5.2 Gross Format of SST
Each Solar Summary Tape consists of a Header File and one data file for each month of data. Each data
file is preceded by the NOPS Standard Header file from the SEFDT from which it was copied. Each
header file consists of two blocks. The data files consist of a variable quantity of blocks. This quantity
is a function of the number of data days in the month and any data gaps present.
The gross format of the Solar Summary Tape is shown below:
STD I
R
HDR G
File 1
STD SEFDT#1
HDR HDR
I SEFDTR #1
G HDR
FiLe 2
SEFDT I SEFDT l SEFDT I SEFDT
#1 R #1 R ..... #2 R #2
PHREC G PHREC G HDR G HDR
FiLe 3 File 4
34

SEFDT I SEFDT I#2 R #2 R
PHREC G PHREC G
File 5
SEFDT ! SEFDTlast R lastHDR G hdr
File N-1
SEFDT | SEFDT !last R last R
PHREC G PHREC G
File N
Where "N" is equal to twice the number of months of data on the tape plus one.
5,3 Standard Header Record Format
All computer tapes that are generated by NOPS require some form of identification. The purpose of the
NOPS Standard Header is to uniquely define the tape product and to provide version control. The formatof the NOPS standard header is shown in Table 12.
Table 12. Nimbus-7 Standard Header Record Format
Character Item Description
1 An Asterisk Present if TDF exists. Found to always be
present. (NOTE 1)
2-23 Nimbus-7 NOPS SPEC NO T characters always
present
24-30 NOPS Specification Numbering Code
24 T Indicates "tape"
25 1 ERB data
26-27 34 3 = SACC, 4 = IPD (NOTE 2)
28-29 02 Tape number in sequence for subsystem
30 6 Tape Description: 6 = 6250 9-track; 7 =3480 cartridge tape
32-38 SQ NO Text always present
38-39
40-44
40
41-43
44
45
46
47-52
53-56
PDFC Code
NOPS Sequence Number
123
ERB
SACC
AD for SEFDT; AT for Solar Data; AS forchannel 10c data
Last digit of the year in which the data were
acquired
Day of the year in which the data were
acquired
Sequence number for this product: always 1for SEFDT
A hyphen unless there is a remake of the tape.If a remake, see Record 4 of the header.
Copy Number: 1 or 2
Subsystem ID. For SEFDT, "ERB"
Subsystem ID of source facility (NOTE 2)
57-60 TO Always "TO"
61-64 IPD Subsystem ID of destination facility (NOTE 2)
65-70 START Flag for Start Date
35

71-87 19XX ddd hhmmss Start year, day, and time
88-91 TO Flag for End Date
92-105 19XX ddd hhmmss End year, day, and time
106-110 GEN Flag for tape generation date
111-126 19XX ddd hhmmss Start year, day, and time
127-138 SFDTMERG Software name and version
139-144 VERH04A Program documentation number
145-630 Comments on the data
NOTES:
(1) TDF, Trailer Documentation File. This was present on the SEFDT's, but was not copied onto the SST.(2) The initials of old Goddard Space Flight Center computer centers.
It should be noted that the SST and CST header files do not comply exactly with the NOPS Standard Header
format. The major difference lies in the Julian date present in the sequence number. Conventional NOPS
header files contain the julian day of the first data day present on the tape. On the SST and CST, the sequence
number contains the julian day of the first day of the final month of data present on the tape.
Here is a sample Nimbus ERB SEFDT NOPS Standard Header:
*NIMBUS-7 NOPS SPEC NO T134021 SQ NO AD83201C1 ERB SACC TO IPD START 1978 305
000000 TO 1978 334 235959 GEN 1988 258 131804 SFDTMERG VERH04A 06/22/88 VERSION
3 . 0 ALGORITHM ID: 5364CAL SET NO: 1290 SEFDTFIX 69002 SUN BLIP CLIPPING
CORRECTIONS ARE APPLIED TO EARTH FLUX DATA WHEN SOLAR ZENITH ANGLE IS
99 TO 122 DEG
Here is a sample Nimbus Solar Summary Tape Label:
*NIMBUS-7 NOPS SPEC NO T132027 SQ NO AT90311C1 ERB SACC TO IPD START 1978 305
000000 TO 1979 059 235959 GEN 1992 246 155310 ESF SOLAR DATAH04A 06/22/88 VERSION
3 . 0 ALGORITHM ID: 5364CAL SET NO: 1290 SEFDTFIX 69002 SUN BLIP CLIPPING
CORRECTIONS ARE APPLIED TO EARTH FLUX DATA WHEN SOLAR ZENITH ANGLE IS
99 TO 122 DEG.
Here is a sample Nimbus Channel 10c Data Tape Label:
*NIMBUS-7 NOPS SPEC NO T132027 SQ NO AS20912-2 ERB SACC TO IPD START 1978 305
000000 TO 1992 121 235959 GEN 1992 246 130443 ESF SOLAR 10C COUNTS/19/90 VERSION
3 . 0 ALGORITHM ID: 353CAL SET NO: 1290
36

5.4 Format of the SST Data Fries
Data Format on SEFDT Tapes
Although the format of the Nimbus ERB SEFDT tapes has been adequately described in the Requirements
Document 1, the following should clarify and in some cases correct this information. This information only
refers to the first two files on the tape, and concentrates on Solar Data in Records with Record IDs of
22, 23, and 24.
Nimbus ERB data has a block length of 15876 characters, which encompasses 66 240-character logical
records per block, followed by 36 characters used as checksums and locators for the Solar Orbital
Summary records. These checksums were not used or copied.
The output solar data from record types 22, 23, and 24 were written 130 240-character records per
31200-character block. This allows more than 1 year of data to be stored on each 3480 cartridge tape.
The data are stored on 14 tapes as follows:
AT93351C1 contains Solar Data for Nov. 1978 - Dec. 1979 in 30 files.
AT03361C1 contains Solar Data for Jan. - Dec. 1980 in 26 files.
AT13361B2 contains Solar Data for Jan. - Dec. 1981 in 26 files.
AT23351C2 contains Solar Data for Jan. - Dec. 1982 in 26 files.
AT33351A2 contains Solar Data for Jan. - Dec. 1983 in 26 files.
AT43361A2 contains Solar Data for Jan. - Dec. 1984 in 26 files.
AT53351AI contains Solar Data for Jan. - Dec. 1985 in 26 files.
AT63351A1 contains Solar Data for Jan. - Dec. 1986 in 26 files.
AT73331-2 contains Solar Data for Jan. - Dec. 1987 in 26 files.
AT83342-2 contains Solar Data for Jan. - Dec. 1988 in 26 files.
AT93342-2 contains Solar Data for Jan. - Dec. 1989 in 26 files.
AT03352-2 contains Solar Data for Jan. - Dec. 1990 in 26 files.
AT13332-2 contains Solar Data for Jan. - Dec. 1991 in 26 files.
AT30032-2 contains Solar Data for Jan. 1992 - Jan. 1993 in 28 files.
Of the five types of Nimbus ERB SEFDT logical records, data from Types 22, 23, and 24 were copied
to Solar Data tapes with minor changes in format, as shown in Tables 13 and 14.. The 10c counts and
related data from the type 23 solar records were copied to the Solar 10c-count tape files in a specialformat shown in Table 15.
1Nimbus-7 NOPS Requirements Document #NG-15, ERB SEFDT Tape Specification No. T 134021, Version I, April1985.
37

Table13.Formatof the Solar Summary Tapes (SST) Data Files
(The format of the first 40 characters of each logical record is identical for all types of solar data records.)
Characters Format Variable Description
1-4 Octal Physical Record No., Spares, File Cont, Record ID and Logical Record No. in a
format not easily usable on IBM equipment
5-6 1"2 Physical Record No. within the file
7-8 1"2 SEFDT Record 22: Channels 1-5 solar data
Type 23: Channels 6-10 solar data
24: Solar Summary data
9-10 1"2 Logical Record No. within the Physical Record, 1-66. Meaningless in output data
11-12 1"2 Algorithm ID. Not used by us
13-14 1"2 Calibration Set no. in input data, obliterated by 1"4 Orbit Number in output data
15-16 1"2 Orbit Number on input tapes
13-16 1"4 Orbit number on output tapes
17-18 1"2 Year, last 2 digits
19-20 1"2 Day of year
21-22 1"2 GMT hours/minutes: hours * 100 + minutes
23-24 1"2 GMT seconds
25-26 1"2 Solar azimuth * 10
27-28 1"2 Solar elevation * I0
29-30 1"2 Solar right ascension * 100
31-32 1"2 Solar declination * 100
33-34 1"2 Instrument status word
35-36 1"2 Gamma angle (recalculate this; see Sections 2.3 and 4.2.2)
37-40 1"4 Sun-Earth distance in A.U. * I00,000. An approximate value
The format of the data groups for Types 22 and 23 solar data records:
41-60 101"2 Thermopile Base Temperatures in centigrade for channels 1 through 10, * 10
61-220 10(16I 16 digital counts for each of 5 channels, depending on type*2)
Type 22 Channel Type 23Channel
61-92 161"2 1 6
93-126 161"2 2 7
127-156 161"2 3 8
157-188 161"2 4 9
189-220 161"2 5 10
221-220 161"2 Miscellaneous Solar Assembly Temperatures
221-222 1"2 Channel 1S Module Temperature
223-224 1"2 Channel 2S Module Temperature
225-226 1"2 Channel 3S Module Temperature
227-228 1"2 Channel 6S Module Temperature
38
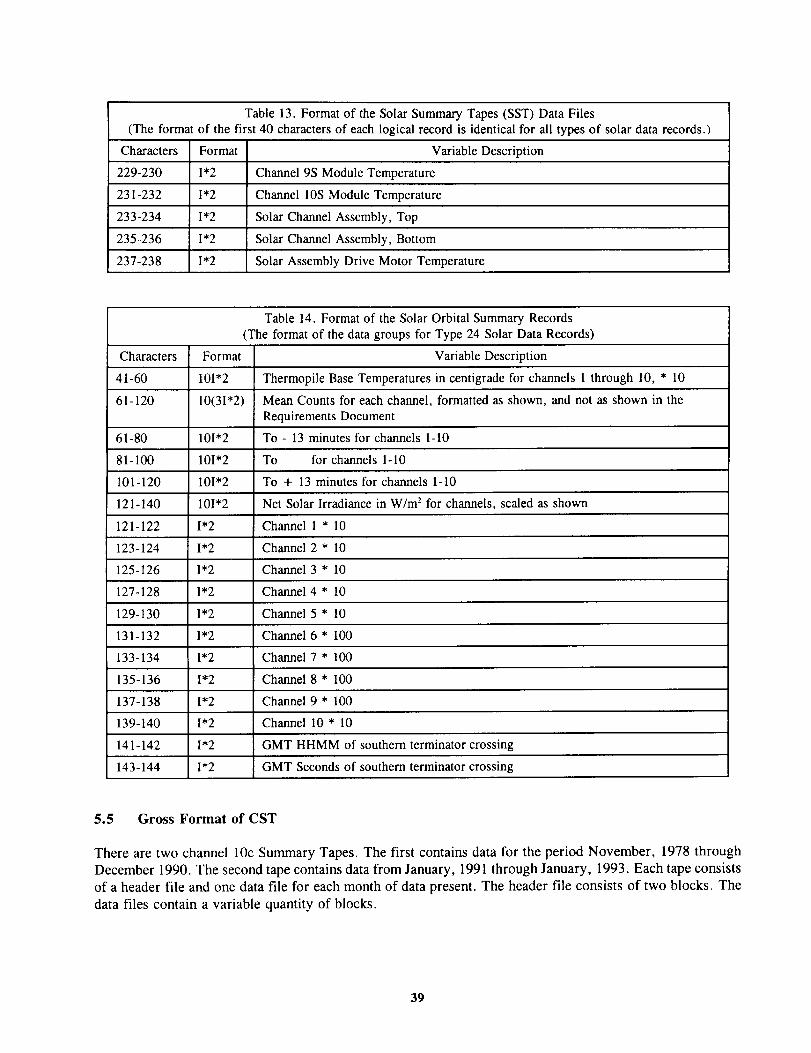
Table13.Formatof theSolarSummaryTapes(SST)DataFiles(Theformatof thefirst40charactersof eachlogicalrecordis identicalfor alltypesof solardatarecords.)
Characters229-230231-232233-234235-236237-238
Format1"21"21"21"21"2
VariableDescriptionChannel9SModuleTemperatureChannel10SModuleTemperature
Solar Channel Assembly, Top
Solar Channel Assembly, Bottom
Solar Assembly Drive Motor Temperature
Table 14. Format of the Solar Orbital Summary Records
(The format of the data groups for Type 24 Solar Data Records)
Characters
41-60
61-120
61-80
81-100
101-120
121-140
Format
101"2
10(31"2)
101"2
101"2
101"2
101"2
Variable Description
Thermopile Base Temperatures in centigrade for channels 1 through 10, * 10
Mean Counts for each channel, formatted as shown, and not as shown in the
Requirements Document
To - 13 minutes for channels 1-10
To for channels 1-10
To + 13 minutes for channels 1-10
Net Solar Irradiance in W/m 2 for channels, scaled as shown
121-122 1"2 Channel 1 * 10
123-124 1"2 Channel 2 * 10
125-126 1"2 Channel 3 * 10
127-128 1"2 Channel 4 * 10
129-130 1"2 Channel 5 * 10
131-132 1"2 Channel 6 * 100
133-134 1"2 Channel 7 * 100
135-136 1"2 Channel 8 * 100
137-138 1"2 Channel 9 * 100
139-140 1"2 Channel 10 * 10
141-142 1"2 GMT HHMM of southern terminator crossing
143-144 1"2 GMT Seconds of southern terminator crossing
5.5 Gross Format of CST
There are two channel 10c Summary Tapes. The first contains data for the period November, 1978 through
December 1990. The second tape contains data from January, 1991 through January, 1993. Each tape consists
of a header file and one data file for each month of data present. The header file consists of two blocks. The
data files contain a variable quantity of blocks.
39
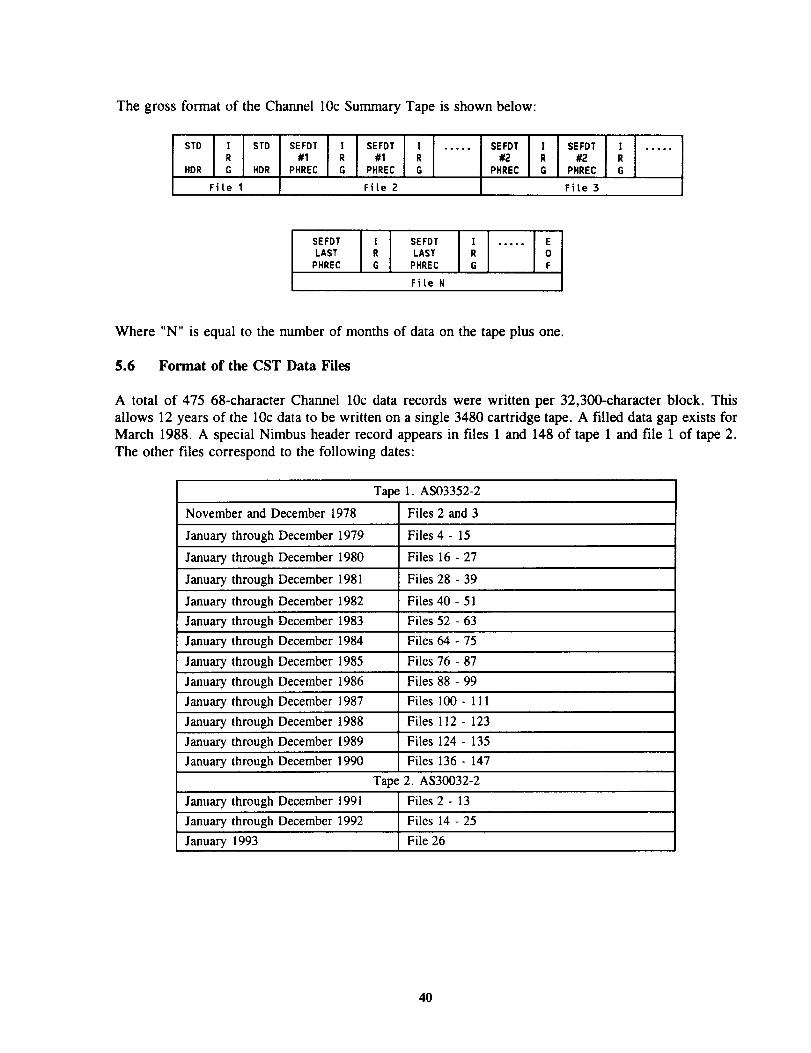
Thegrossformatof theChannellOcSummaryTapeis shownbelow:
STD i
R
HDR G
Fite 1
STD SEFDT
#1HDR PHREC
I SEFDT I .....
R #1 R
G PHREC G
FiLe 2
SEFDT
#2PHREC
I SEFDT
R #2
G PHREC
FiLe ]
| .....
R
G
SEFDT 1 SEFDT I ..... ELAST R LAST R 0
PHREC G PHREC G F
FiLe N
Where "N" is equal to the number of months of data on the tape plus one.
5.6 Format of the CST Data Files
A total of 475 68-character Channel 10c data records were written per 32,300-character block. This
allows 12 years of the 10c data to be written on a single 3480 cartridge tape. A filled data gap exists for
March 1988. A special Nimbus header record appears in files 1 and 148 of tape 1 and file 1 of tape 2.
The other files correspond to the following dates:
Tape 1. AS03352-2
November and December 1978 Files 2 and 3
January through December 1979 Files 4 - 15
January through December 1980 Files 16 - 27
January through December 1981 Files 28 - 39
January through December 1982 Files 40 - 51
January through December 1983 Files 52 - 63
January through December 1984 Files 64 - 75
January through December 1985 Files 76 - 87
January through December 1986 Files 88 - 99
January through December 1987 Files 100 - 111
January through December 1988 Files 112 - 123
January through December 1989 Files 124 - 135
January through December 1990 Files 136 - 147
Tape 2. AS30032-2
January through December 1991 Files 2 - 13
January through December 1992 Files 14 - 25
January 1993 File 26
4O
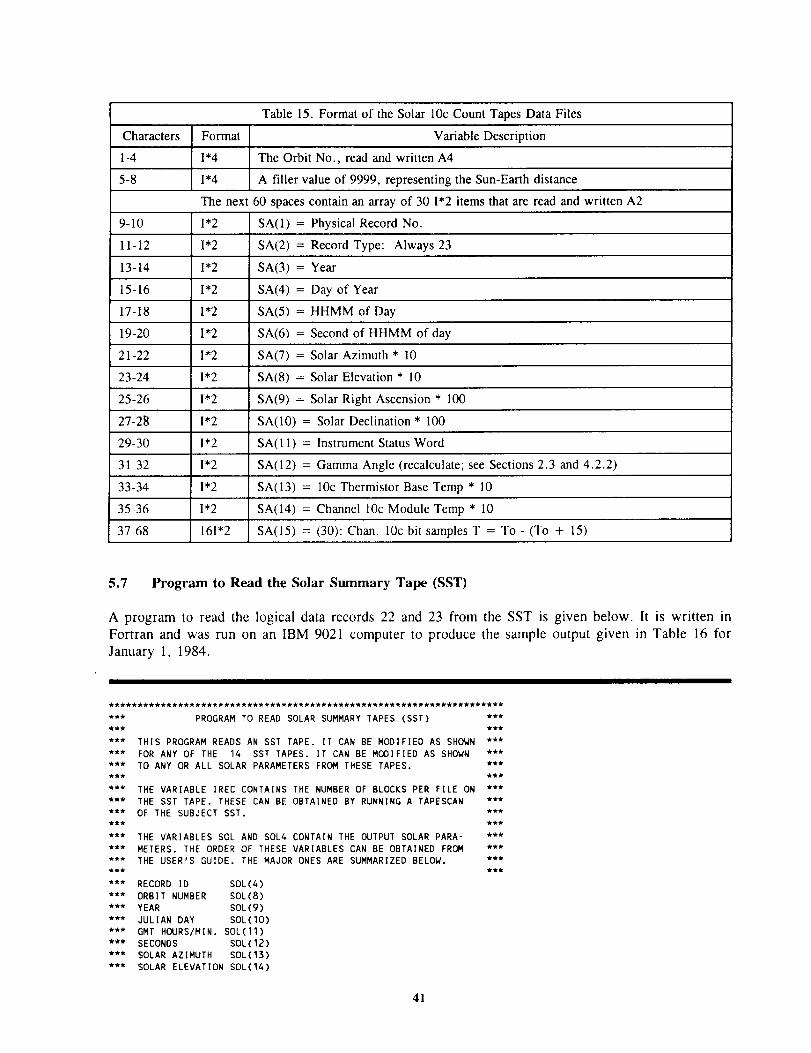
Table15.Formatof theSolar10cCountTapesDataFilesCharactersFormat VariableDescription1-4 1"4 TheOrbitNo.,readandwrittenA45-8 1"4 A fillervalueof9999,representingtheSun-Earthdistance
Thenext60spacescontainanarrayof 301"2itemsthatarereadandwrittenA29-10 1"2 SA(1)= PhysicalRecordNo.11-12 1"2 SA(2)= RecordType:Always2313-14 1"2 SA(3)= Year
15-16 1"2 SA(4)= Dayof Year17-18 1"2 SA(5)= HHMMof Day19-20 1"2 SA(6)-- Secondof HHMMof day21-22 1"2 SA(7)= SolarAzimuth* 1023-24 !'2 SA(8)= SolarElevation* 1025-26 1"2 SA(9)= SolarRightAscension* 10027-28 1"2 SA(10)= SolarDeclination* 10029-30 1"2 SA(11)= InstrumentStatusWord31-32 1"2 SA(12)= GammaAngle(recalculate;seeSections2.3and4.2.2)33-34 1"2 SA(13)= 10cThermistorBaseTemp* 1035-36 1"2 SA(14)= Channel10cModuleTemp* 1037-68 161"2 SA(15)= (30):Chan.10cbitsamplesT = To- (To + 15)
5.7 Program to Read the Solar Summary Tape (SST)
A program to read the logical data records 22 and 23 from the SST is given below. It is written in
Fortran and was run on an IBM 9021 computer to produce the sample output given in Table 16 for
January 1, 1984.
*** PROGRAM TO READ SOLAR SUMMARY TAPES (SST) ***
*** THIS PROGRAM READS AN SST TAPE. IT CAN BE MODIFIED AS SHOWN ***
*** FOR ANY OF THE 14 SST TAPES. IT CAN BE MODIFIED AS SHOWN ***
*** TO ANY OR ALL SOLAR PARAMETERS FROM THESE TAPES. ***
*** THE VARIABLE IREC CONTAINS THE NUMBER OF BLOCKS PER FILE ON ***
*** THE SST TAPE. THESE CAN BE OBTAINED BY RUNNING A TAPESCAN ***
*** OF THE SUBJECT SST. ***
*** THE VARIABLES SOL AND SOL4 CONTAIN THE OUTPUT SOLAR PARA- ***
*** METERS. THE ORDER OF THESE VARIABLES CAN BE OBTAINED FROM ***
*** THE USER'S GUIDE. THE MAJOR ONES ARE SUMMARIZED BELOW. ***
*** RECORD ID SOL(4)
*** ORBIT NUMBER SOL(8)
*** YEAR SOL(9)
*** JULIAN DAY SOL(tO)
*** GMT HOURS/MIN. SOL(11)
*** SECONDS SOL(12)
*** SOLAR AZIMUTH SOL(13)
*** SOLAR ELEVATION SOL(14)
41

t_t
SOLAR RA SOL(15)
SOLAR DECLIN. SOL(16)
GAMMA ANGLE SOL(18)
EARTH/SUN DIST. SOL(19)
FOR DATA RECORDS 22
CHANNEL I-5 DIGITAL COUNTS
FOR DATA RECORDS 23
CHANNEL 6-I0 DIGITAL COUNTS
SOL(31) THROUGH SOL(110)
SOL(31) THROUGH SOL(110)
W_WWW_WWWW_WWWWW_WWWWWWWWW_W_W_W_WWWW_tt_WWWW_
CHARACTER*I LOGREC(240,130)
INTEGER*2 SOL(120,130)
INTEGER*4 SOL4(60,130)
INTEGER M(10,2), BOLl4CHARACTER*I HEADER(630)
INTEGER IREC(12)/360,331,366,355,366,355,367,367,
* 355,355,355,357/
EQUIVALENCE (SOL,LOGREC), (SOL4,LOGREC)
***** MOUNT SST TAPE
CALL POSN(I,IO,I)
***** READ AND WRITE SST TAPE HEADERS
CALL FREAD(HEADER,IO,N,*98,*99)
WRITE(6,1001) HEADER
1001 FORMAT(8OAI)
CALL FREAD(HEADER,10,N_*98,*99)
WRITE(6,1001) HEADER
ITEST=I
***** LOOP OVER 12 MONTHS OF DATA
DO 999 IMON=I,I
IFILE=IMON*2
***** POSITION TO FILE FOR DESIRED MONTH
CALL POSN(I,ID,IFILE)
***** READ SEFDT HEADERS FOR DESIRED MONTH
CALL FREAD(HEADER,IO,N,*98,*99)
WRITE(6,1001) HEADER
CALL FREAD(HEADER,IO,N,*98,*99)
WRITE(6,1O01) HEADER
JFILE=IFILE+I
***** POSITION FOR DATA FOR DESIRED MONTH
CALL POSN(I,IO,JFILE)
***** LOOP OVER THE NUMBER OF RECORDS FOR THIS MONTH
DO 10 I=I,IREC(IMON)
1003 FORMAT(/16/)
CALL FREAD(LOGREC,10,N,*98,*99)
1005 FORMAT('BYTES READ=',IIO)
***** LOOP OVER THE 130 RECORDS PER BLOCK
DO 20 K=1,130
IF(SOL(IO,K).GT.2) GO TO 999
IF(K.EQ.I) WRITE(6,1006)
IF(K.EQ.47) WRITE(6,1006)
IF(K.EQ.95) WRITE(6,1006)
1006 FORMAT('I',' YR DAY HMN SEC REC SOLAZ SOLELV GAM',
42
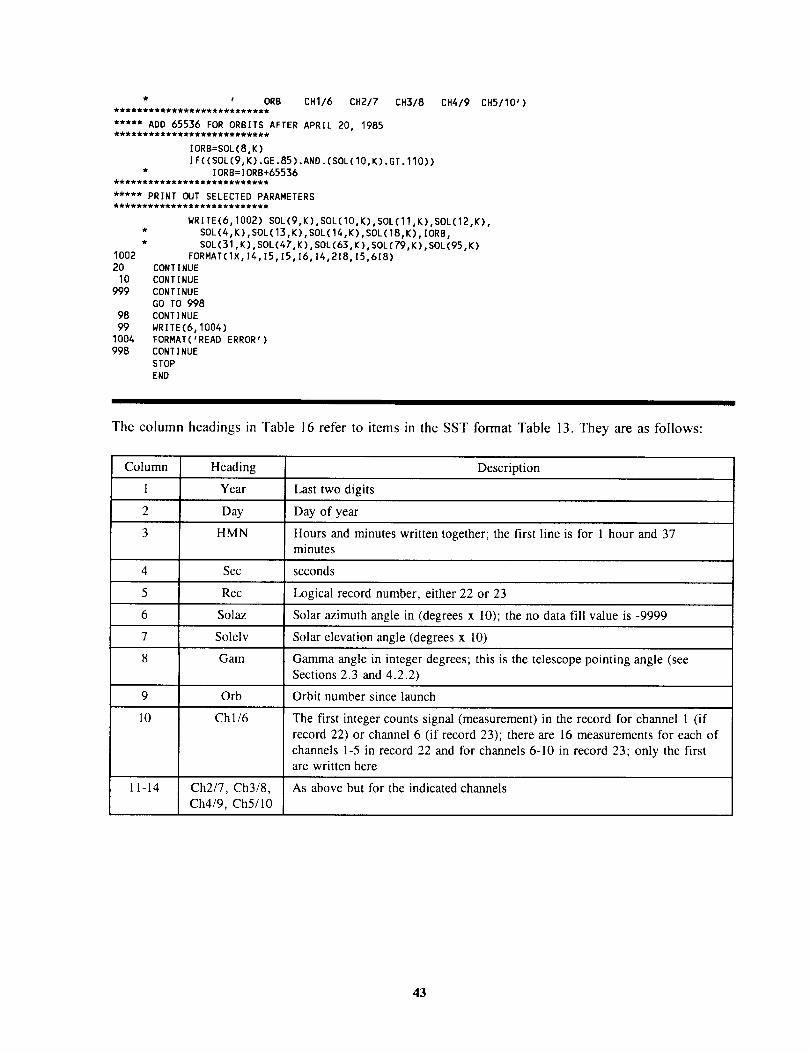
* ' ORB CHI/6 CH2/7 CH3/8
***** ADD 65536 FOR ORBITS AFTER APRIL 20, 1985
IORB=SOL(8,K)
lF((SOL(9,K).GE.85).AND.(SOL(10,K).GT.110))* IORB=IORB+65536
***** PRINT OUT SELECTED PARAMETERS
1002
2O
I0
999
98
99
1004
998
CH4/9 CH5/I0')
WRITE(6,1002) SOL(9,K),SOL(10,K),SOL(I1,K),SOL(12,K),
SOL(4,K),SOL(13,K),SOL(14,K),SOL(18,K),[ORB,
SOL(31,K),SOL(47, K),SOL(63,K),SOL(T9,K),SOL(95,K)
FORMAT(IX,14,15,15,16,14,2]8,[5,6[8)
CONTINUE
CONTINUE
CONTINUE
GO TO 998
CONTINUE
WRITE(6,1004)
FORMAT('READ ERROR')
CONTINUE
STOP
END
The column headings in Table 16 refer to items in the SST format Table 13. They are as follows:
Column Heading Description
1 Year Last two digits
2 Day Day of year
3 HMN Hours and minutes written together; the first line is for 1 hour and 37minutes
4 Sec seconds
5 Rec Logical record number, either 22 or 23
6 Solaz Solar azimuth angle in (degrees x 10); the no data fill value is -9999
7 Solelv Solar elevation angle (degrees x 10)
8 Gam Gamma angle in integer degrees; this is the telescope pointing angle (see
Sections 2.3 and 4.2.2)
9 Orb Orbit number since launch
10 Chl/6 The first integer counts signal (measurement) in the record for channel 1 (if
record 22) or channel 6 (if record 23); there are 16 measurements for each of
channels 1-5 in record 22 and for channels 6-10 in record 23; only the firstare written here
11-14 Ch2/7, Ch3/8, As above but for the indicated channels
Ch4/9, Ch5/10
43

Year Day HMN Sec Rec
1984 1 137 0 22
1984 1 137 0 23
1984 1 137 16 22
1984 1 137 16 23
1984 1 143 40 22
1984 1 143 40 23
1984 1 143 56 22
1984 1 143 56 23
1984 1 144 12 22
1984 1 144 12 23
1984 1 144 28 22
1984 1 144 28 23
1984 1 144 44 22
1984 1 144 44 23
1984 1 145 0 22
1984 1 145 0 23
1984 1 145 16 22
1984 1 145 16 23
1984 1 145 32 22
1984 1 145 32 23
1984 1 145 48 22
1984 1 145 48 23
1984 1 146 4 22
1984 1 146 4 23
1984 1 146 20 22
1984 1 146 20 23
1984 1 146 36 22
1984 1 146 36 23
1984 1 146 52 22
1984 I 146 52 23
1984 1 147 8 22
1984 t 147 8 23
1984 1 147 24 22
1984 1 147 24 23
Table 16. Sample Output From SST Tape
Solaz Solely Gam Orb Chl/6 Ch2/7 Ch3/8 Ch4/9 Ch5/10
-9999 -9999 0 26189 -3 -1 -16 -1 -3
-9999 -9999 0 26189 -11 -22 -38 -43 -19
-9999 -9999 0 26189 -3 -1 -16 -1 -3
-9999 -9999 0 26189 -10 -21 -38 -42 -19
2 224 0 26189 -3 11 -13 12 11
2 224 0 26189 14 -2 -16 -9 -17
2 214 0 26189 -3 12 -13 16 17
2 214 0 26189 18 4 -13 -4 -18
2 205 0 26189 -3 13 -13 21 22
2 205 0 26189 27 11 -6 12 -17
2 196 0 26189 -3 15 -12 25 28
2 t96 0 26189 34 17 -2 28 -18
2 188 0 26189 -3 15 -11 30 34
2 188 0 26189 40 23 3 43 -17
2 179 0 26189 -3 16 -11 36 40
2 179 0 26189 48 29 8 58 -17
2 170 0 26189 -3 18 -7 43 48
2 170 0 26189 57 37 13 72 -17
2 161 0 26189 -3 20 -4 52 57
2 161 0 26189 65 44 17 84 -17
2 152 0 26189 -3 23 -1 61 66
2 152 0 26189 73 51 21 93 -17
2 143 0 26189 -3 26 2 70 76
2 143 0 26189 79 57 25 106 -16
2 134 0 26189 -3 28 3 95 I00
2 134 0 26189 128 95 39 219 -16
2 124 0 26189 -3 60 7 255 258
2 124 0 26189 281 217 121 395 -15
2 115 0 26189 -3 210 135 444 441
2 115 0 26189 442 351 220 584 -14
2 106 0 26189 -3 376 324 636 629
2 106 0 26189 602 490 326 775 50
2 97 0 26189 -3 547 522 821 820
2 97 0 26189 767 633 434 972 251
44
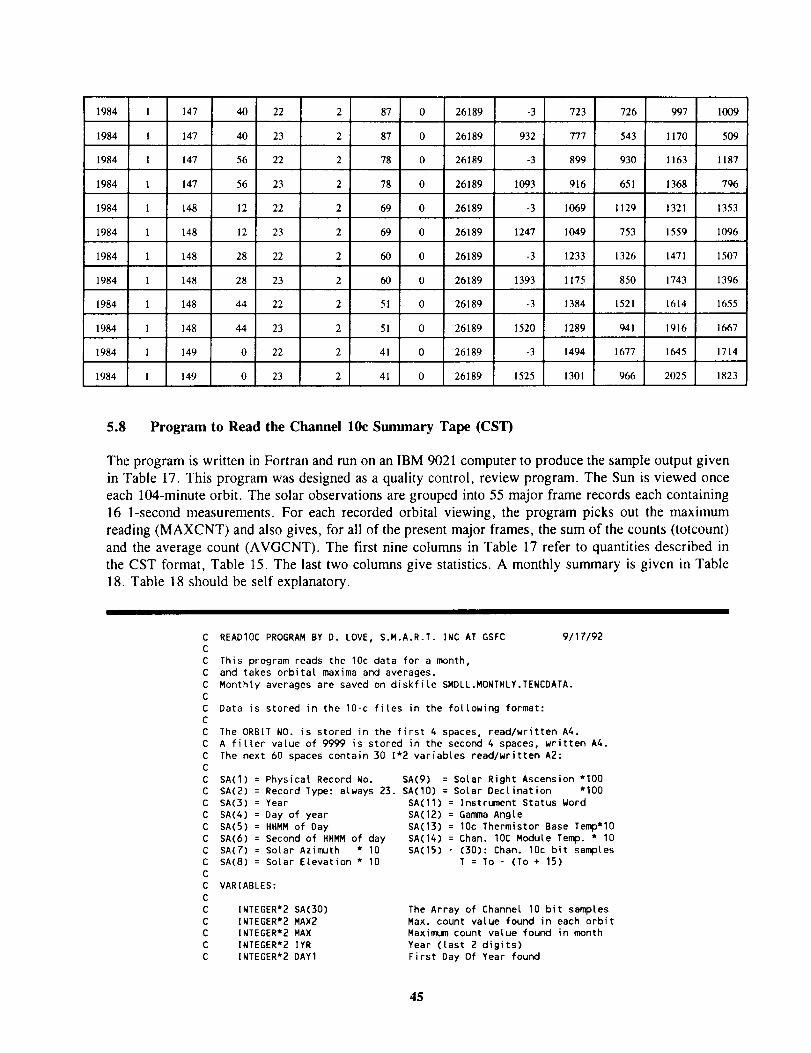
1984 1 147 40 22 2 87 0 26189 -3 723 726 997 1009
1984 1 147 40 23 2 87 0 26189 932 777 543 1170 509
1984 1 147 56 22 2 78 0 26189 -3 899 930 1163 1187
1984 1 147 56 23 2 78 0 26189 1093 916 651 1368 796
1984 1 148 12 22 2 69 0 26189 -3 1069 1129 1321 1353
1984 1 148 12 23 2 69 0 26189 1247 1049 753 1559 1096
1984 1 148 28 22 2 60 0 26189 -3 1233 1326 1471 1507
1984 1 t48 28 23 2 60 0 26189 1393 !175 850 1743 1396
1984 1 148 44 22 2 51 0 26189 -3 1384 1521 1614 1655
1984 I 148 44 23 2 51 0 26189 1520 1289 941 1916 1667
1984 1 149 0 22 2 41 0 26189 -3 1494 1677 1645 1714
1984 1 149 0 23 2 41 0 26189 1525 1301 966 2025 1823
5.8 Program to Read the Channel 10c Summary Tape (CST)
The program is written in Fortran and run on an IBM 9021 computer to produce the sample output given
in Table 17. This program was designed as a quality control, review program. The Sun is viewed once
each 104-minute orbit. The solar observations are grouped into 55 major frame records each containing
16 1-second measurements. For each recorded orbital viewing, the program picks out the maximum
reading (MAXCNT) and also gives, for all of the present major frames, the sum of the counts (totcount)
and the average count (AVGCNT). The first nine columns in Table 17 refer to quantities described in
the CST format, Table 15. The last two columns give statistics. A monthly summary is given in Table
18. Table 18 should be self explanatory.
READIOC PROGRAM BY D. LOVE, S.M.A.R.T. INC AT GSFC 9/17/92
This program reads the I0c data for a month,
and takes orbital maxima and averages.
Monthly averages are saved on diskfile SMDLL.MONTHLY.TENCDATA.
Data is stored in the 10-c fires in the fottowing format:
The ORBIT NO. is stored in the first 4 spaces, read/written A4.
A fitter value of 9999 is stored in the second 4 spaces, written A4.
The next 60 spaces contain 30 1"2 variables read/written A2:
SA(1)
SA(2)
SA(3)
SA(4)
SA(5)
SA(6)
SA(7)
SA(8)
= Physical Record No. SA(9) = Solar Right Ascension "100
= Record Type: always 23. SA(IO) = Solar Declination "100
= Year SA(11) = Instrument Status Word
= Day of year SA(12) = Gamma Angle
= HHMM of Day SA(13) = 10c Thermistor Base Temp*10
= Second of HHMM of day SA(14) = Chan. 10C Module Temp. * 10
= Solar Azimuth * 10 SA(15) - (30): Chan. 10c bit samples
= Solar Elevation " 10 T = To - (To + 15)
VARIABLES:
INTEGER*2 SA(30)
INTEGER*2 MAX2
INTEGER*2 MAX
INTEGER*2 IYR
INTEGER*2 DAYI
The Array of Channel 10 bit samples
Max. count value found in each orbit
Maximum count value found in month
Year (last 2 digits)
First Day Of Year found
45
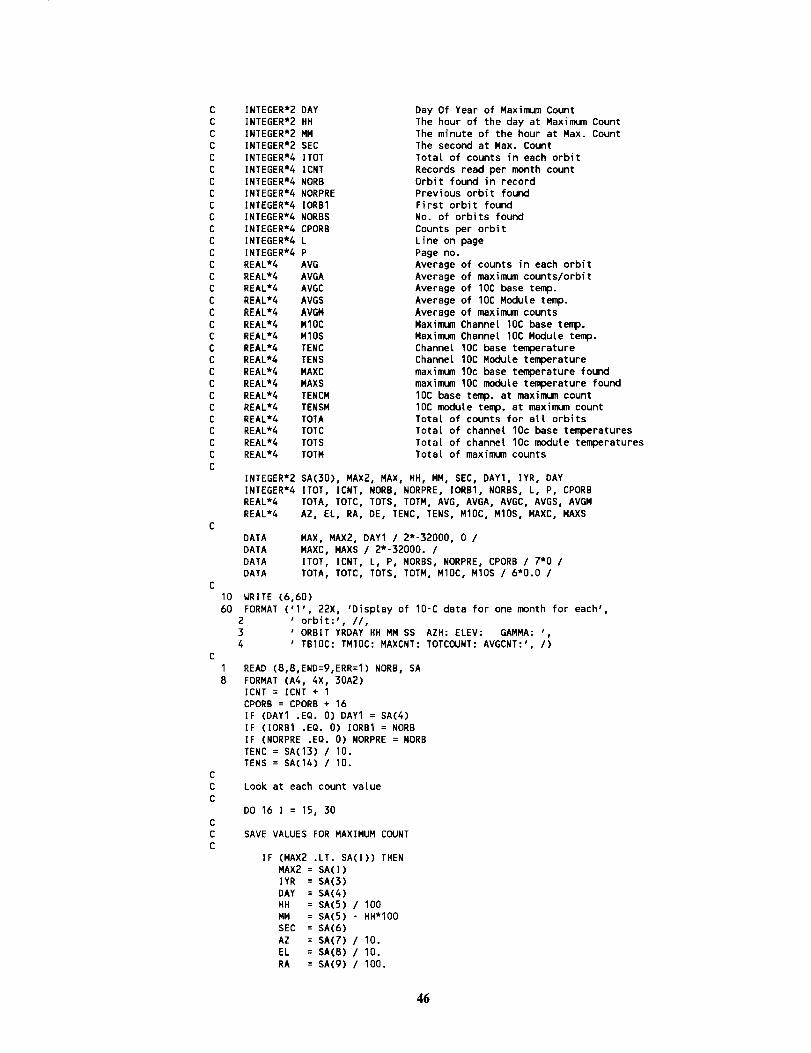
10
60
INTEGER*2
INTEGER*2
INTEGER*2
INTEGER*2
INTEGER*4
INTEGER*4
INTEGER*4
INTEGER*4
INTEGER*4
INTEGER*4
INTEGER*4
INTEGER*4
INTEGER*4
REAL*4
REAL*4
REAL*4
REAL*4
REAL*4
REAL*4
REAL*4
REAL*4
REAL*4
REAL*4
REAL*4
REAL*4
REAL*4
REAL*4
REAL*4
REAL*4
REAL*4
DAY
HH
MM
SEC
ITOT
ICNT
NORB
NORPRE
IORBI
NORBS
CPORB
L
P
AVG
AVGA
AVGC
AVGS
AVGM
MIOC
MIOS
TENC
TENS
MAXC
MAXS
TENCM
TENSM
TOTA
TOTC
TOTS
TOTM
Day Of Year of Maximum Count
The hour of the day at Maximum CountThe minute of the hour at Max. Count
The second at Max. Count
Totat of counts in each orbit
Records read per month countOrbit found in record
Previous orbit found
First orbit found
No. of orbits found
Counts per orbit
Line on page
Page no.
Average of counts in each orbit
Average of maximum counts/orbit
Average of I0C base temp.
Average of I0C Modute temp.
Average of maximum counts
Maximum Channet I0C base temp.
Maximum Channet I0C Module temp.
Channel I0C base temperature
Channel I0C Module temperature
maximum I0c base temperature found
maximum I0C module temperature found
I0C base temp. at maximum count
I0C nx)dute temp. at maximum count
Total of counts for all orbits
Total of channet I0c base te_)eratures
Total of channet I0c n_)dute temperaturesTotal of maximum counts
INTEGER*2
INTEGER*4
REAL*4
REAL*4
SA(30), MAX2, MAX, HH, MM, SEC, DAYI, IYR, DAY
ITOT, ICNT, NORB, NORPRE, IORBI, NORBS, L, P, CPORB
TOTA, TOTC, TOTS, TOTM, AVG, AVGA, AVGC, AVGS, AVGM
AZ, EL, RA, DE, TENC, TENS, MIOC, MIOS, MAXC, MAXS
DATADATA
DATA
DATA
MAX, MAX2, DAYI / 2*-32000, 0 /
MAXC, MAXS / 2*-32000. /
ITOT, ICNT, L, P, NORBS, NORPRE, CPORB / 7*0 /
TOTA, TOTC, TOTS, TOTM, M10C, MIOS / 6*0.0 /
WRITE (6,60)
FORMAT ('I', 22X, 'Display of 10-C data for one month for each',
2 ' orbit:', //,
3 ' ORBIT YRDAY HH MM SS AZH: ELEV: GAMMA: '
4 ' TBIOC: TMIOC: MAXCNT: TOTCOUNT: AVGCNT:', /)
READ (8,8,END=9,ERR=I) NORB, SA
FORMAT (A4, 4X, 30A2)ICNT = ICNT + I
CPORB = CPORB + 16
IF (DAYI .EQ. O) DAYI = SA(4)
IF (IORBI .EQ. O) IORBI = NORB
IF (NORPRE .EQ. 0) NORPRE = NORB
TENC = SA(13) / 10.
TENS = SA(14) / 10.
Look at each count vatue
DO 16 I = 15, 30
SAVE VALUES FOR MAXIMUM COUNT
IF (MAX2 .LT. SA(1)) THEN
MAX2 = SA(1)
IYR = SA(3)
DAY = SA(4)
HH = SA(5) / 100
MM = SA(5) - HH*IO0
SEC = SA(6)
AZ = SA(7) / 10.
EL = SA(8) / 10.
RA = SA(9) / 100.
46

DE = SA(IO)/ 100.
GAM = SA(12)/I.
MIOC = TENC
MIOS = TENS
END [F
C
C Eliminate bad counts (< -99)
C
IF (SA([) .LT. -99) THEN
CPORB = CPORB - I
ELSE
ITOT = ITOT + SA([)END IF
16 CONTINUE
C
C SAVE TOTALS FOR FINAL AVERAGING
C
TOTC = TOTC + TENC
TOTS = TOTS + TENS
IF (MAXC .LT. TENC) MAXC = TENC
IF (MAXS .LT. TENS) MAXS = TENS
C
IF (NORPRE .NE. NORB) THEN
C
C WRITE VALUES FOR MAXIMUM COUNT
C
AVG = [TOT / CPORB
TOTA = TOTA + ]TOT
TOTM = TOTM + MAX2
IF (MAX2 .GT. MAX) MAX = MAX2
CPORB = 0
NORPRE = NORB
NORBS = NORBS + I
C
WRITE (6,6) NORPRE, IYR, DAY, HH, MM, SEC, AZ, EL, GAM,
2 MIOC, MIOs, MAX2, ITOT, AVG
6 FORMAT (16, 13, [3.3, 13, 2(':', [2.2), 2F6.1, F8.2,
2 2F7.1, ]8, 110, F8.2)
ITOT = 0
MAX2 = -32000
C
L=L+I
IF (L .GE. 50) THEN
P=P+I
L=O
WRITE (6,69) P
69 FORMAT (//, 40X, ' -', 13, ' -')GO TO 10
END IF
END IF
C
GO TO I
C
9 DO 911 = L, 50
WRITE (6,61)
61 FORMAT (IX)
91 CONTINUE
C
P=P+I
WRITE (6,69) P
C
AVGA = TOTA / NORBS
AVGM = TOTM / NORBS
AVGC = TOTC / ICNT
AVGS = TOTS / ICNT
C
WRITE (6,66) ICNT, SA(3), DAYI, SA(3), SA(4), IORBI, NORB, NORBS,
2 MAX, AVGM, AVGA, MAXC, AVGC, MAXS, AVGS
66 FORMAT ('I', 30X, 'SUMMARY OF RESULTS FOR MONTH:', //,
2 ' A total of', I6, ' records for ', 13, 13.3, ' - ',
3 I3, 13.3, /, ' covering orbits ', [6, ' -', 16, ' = ',
4 16, ' orbits. ', //, IOX,
5 ' Maximum value count in month: ', 17, /, IOX,
47
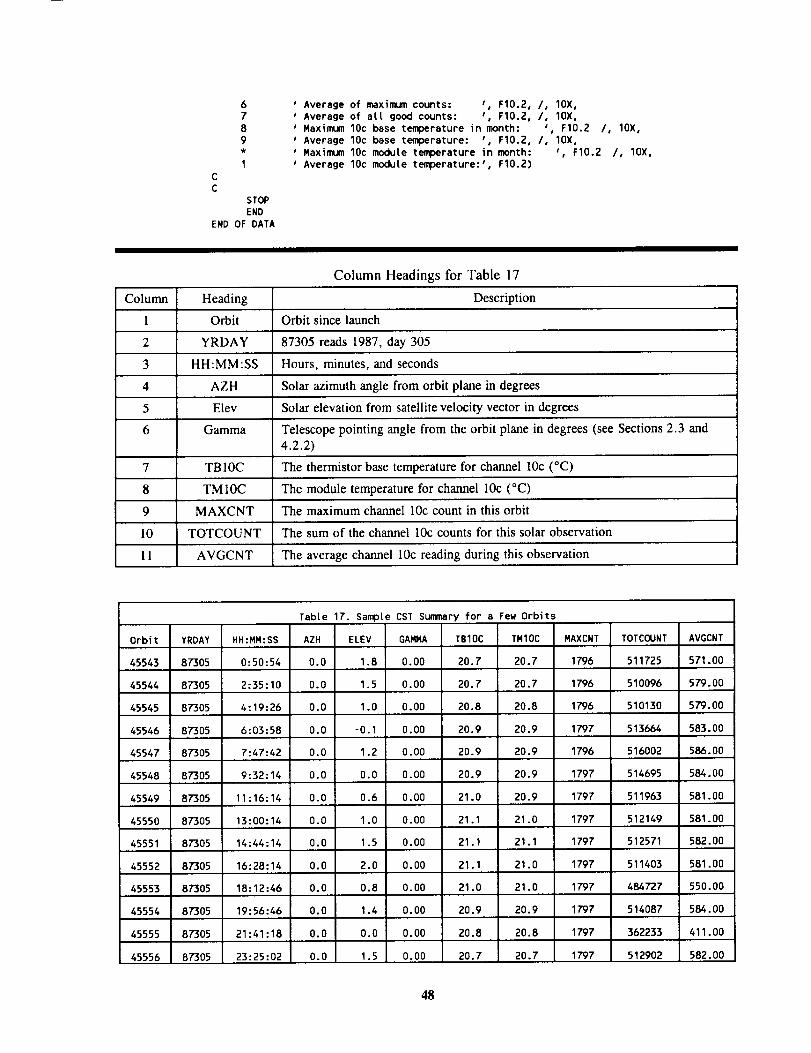
6789t
1cc
STOPEND
END OF DATA
Average of maximum counts: ', F10.2, /, 10X,Average of aLL good counts: ,, F10.2, /, 10X,Maximum 10c base temperature in month: ', F10.2 /, 10X,Average 10c base temperature: ', F10.2, /, 10X,Maximum 10c module temperature in month: ', F10.2 /, 10X,Average 10c module temperature:', F10.2)
Column Headings for Table 17
Column Heading Description
1 Orbit Orbit since launch
2 YRDAY 87305 reads 1987, day 305
3 HH:MM:SS Hours, minutes, and seconds
4 AZH Solar azimuth angle from orbit plane in degrees
5 Elev Solar elevation from satellite velocity vector in degrees
6 Gamma Telescope pointing angle from the orbit plane in degrees (see Sections 2.3 and
4.2.2)
7 TB10C The thermistor base temperature for channel 10c (°C)
8 TM 10C The module temperature for channel 10c (°C)
9 MAXCNT The maximum channel 10c count in this orbit
10 TOTCOUNT The sum of the channel 10c counts for this solar observation
11 AVGCNT The average channel 10c reading during this observation
TabLe 17. SampLe CST Summary for a Few Orbits
Orbit YRDAY HH:MM:SS AZH ELEV GAMMA TBIOC TMIOC MAXCNT TOTCOUNT AVGCNT
45543 87305 0:50:54 0.0 1.8 0.00 20.7 20.7 1796 511725 571.00
45544 87305 2:35:10 0.0 1.5 0.00 20.7 20.7 1796 510096 579.00
45545 87305 4:19:26 0.0 1.0 0.00 20.8 20.8 1796 510130 579.00
45546 87305 6:03:58 0.0 -0.I 0.00 20.9 20.9 1797 513664 583.00
45547 87305 7:47:42 0.0 1.2 0_00 20.9 20.9 1796 516002 586.00
45548 87305 9:32:14 0.0 0.0 0.00 20.9 20.9 1797 514695 584.00
45549 87305 11:16:14 0.0 0.6 0.00 21.0 20.9 1797 511963 581.00
45550 87305 13:00:14 0.0 1.0 0.00 21.1 21.0 1797 512149 581.00
45551 87305 14:44:14 0.0 1.5 0.00 21.1 21.1 1797 512571 582.00
45552 87305 16:28:14 0.0 2.0 0.00 21.1 21.0 1797 511403 581.00
45553 87305 18:12:46 0.0 0.8 0.00 21.0 21.0 1797 484727 550.00
45554 87305 19:56:46 0.0 1.4 0.00 20.9 20.9 1797 514087 584.00
45555 87305 21:41:18 0.0 0.0 0.00 20.8 20.8 1797 362233 411.00
45556 87305 23:25:02 0.0 1.5 0.00 20.7 20.7 1797 512902 582.00
48
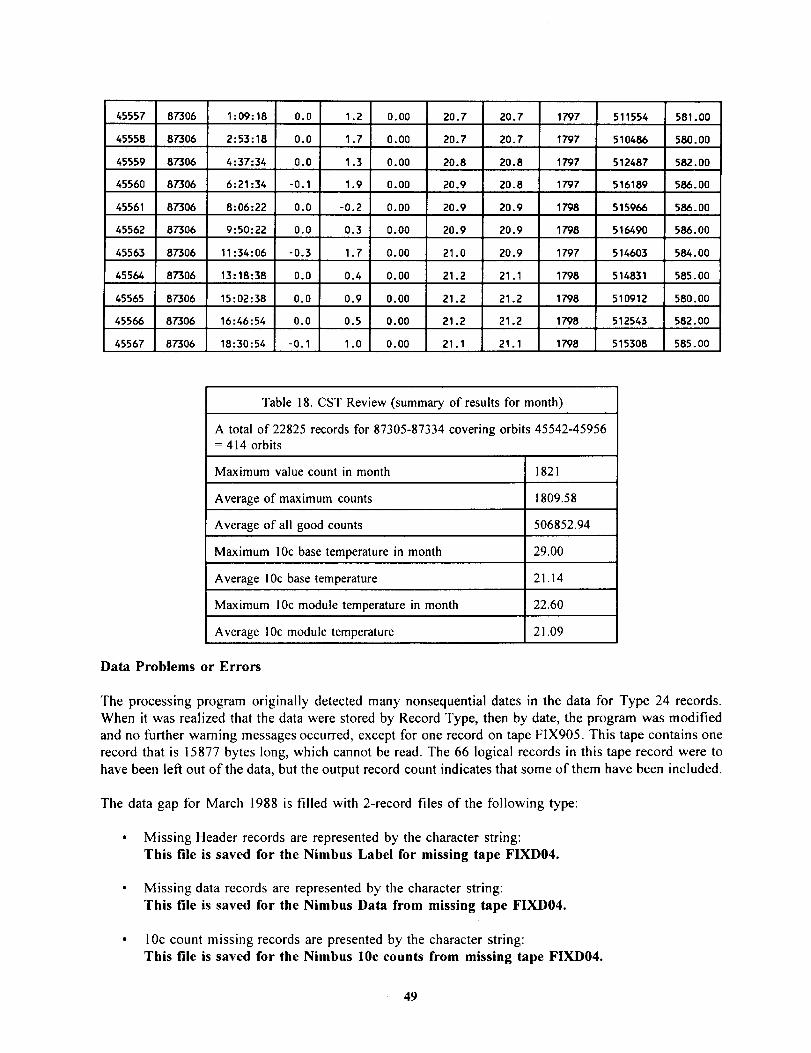
45557
45558
45559
45560
45561
45562
45563
45564
45565
45566
45567
87306
87306
87306
87306
87306
87306
87306
87306
87306
87306
8T306
1:09:18 0.0 1.2
2:53:18 0.0 1.7
4:37:34 0.0 1.3
6:21:34 -0.1 1.9 0.00
8:06:22 0.0 -0.2 0.00
9:50:22 0.0 0.3 0.00
11:34:06 -0.3 1.7 0.00
13:18:38 0.0 0.4 0.00
15:02:38 0.0 0.9 0.00
16:46:54 0.0 0.5 0.00
18:30:54 -0.1 1.0 0.00
0.00 20.7 20.7 17'97 511554 581.00
0.00 20.7 20.7 1797 510486 580.00
0.00 20.8 20.8 1797 512487 582.00
20.9 20.8 1797 516189 586.00
20.9 20.9 1798 515966 586.00
20.9 1798 516490 586.00
20.9 1797 514603 584.00
20.9
21.0
21.2
21.2
21.2
21.1
21.I
21.2
21.2
21 .I
1798 514831 585.00
1798 510912 580.00
1798 512543 582.00
1798 515308 585.00
Table 18. CST Review (summary of results for month)
A total of 22825 records for 87305-87334 covering orbits 45542-45956= 414 orbits
Maximum value count in month 1821
Average of maximum counts 1809.58
Average of all good counts 506852.94
Maximum 10c base temperature in month 29.00
Average 10c base temperature 21.14
Maximum 10c module temperature in month 22.60
Average 10c module temperature 21.09
Data Problems or Errors
The processing program originally detected many nonsequential dates in the data for Type 24 records.
When it was realized that the data were stored by Record Type, then by date, the program was modified
and no further warning messages occurred, except for one record on tape FIX905. This tape contains one
record that is 15877 bytes long, which cannot be read. The 66 logical records in this tape record were tohave been left out of the data, but the output record count indicates that some of them have been included.
The data gap for March 1988 is filled with 2-record files of the following type:
• Missing Header records are represented by the character string:
This file is saved for the Nimbus Label for missing tape FIXD04.
• Missing data records are represented by the character string:
This file is saved for the Nimbus Data from missing tape FIXD04.
• 10c count missing records are presented by the character string:
This file is saved for the Nimbus 10c counts from missing tape FIXD04.
49
REFERENCES
Hickey, J. R., B. M. Alton, F. J. Griffin, H. Jacobowitz, P. Pellegrino, and R. H. Maschhoff, 1982:
Indications of Solar Variability in the Near UV From the Nimbus-7 ERB Experiment, InternationalAssociation of Meteorology and Atmospheric Physics (IAMAP), Third Scientific Assembly, Hamburg,
FRG, August 17-28, 1981. (The Symposium on the Solar Constant and the Spectral Distribution of Solar
Irradiance; Extended abstracts edited by J. London and C. Frohlich; Boulder, Colorado, 1982), pp.103-109.
Hickey, J. R., 1985: Analysis of Calibration of Nimbus-7 Radiometry, in Advances in Absolute
Radiometry," ed. by P. Foukal, pp. 30-33, Cambridge Research and Instrumentation, Inc., Cambridge, MA.
Hoyt, D. V., H. L. Kyle, J. R. Hickey, and R. H. Maschhoff, 1992: The Nimbus-7 Total Solar Irradiance:
A New Algorithm for its Derivation, J. Geophys. Res., 97, No. A1, 51-63.
Jacobowitz, H., H. V. Soule, H. L. Kyle, F. B. House, and the ERB Nimbus-7 Experiment Team, 1984:
The Earth Radiation Budget (ERB) Experiment: An Overview, J. Geophys. Res., 89(4), pp. 5021-5038.
Kyle, H. L., P. E. Ardanuy, and E. J. Hurley, 1985: The Status of the Nimbus-7 ERB Earth Radiation
Budget Data Set, Bull. Amer. Meteor. Soc., 66, 1378-1388.
Kyle, H. L., J. R. Hickey, P. E. Ardanuy, H. Jacobowitz, A. Arking, G. G. Campbell, F. B. House, R.Maschhoff, G. L. Smith, L. L. Stowe, and T. Vonder Haar, 1993a: The Nimbus Earth Radiation Budget
(ERB) Experiment: 1975-1992, Bull. Amer. Meteor. Soc., 74, 815-830.
Kyle, H. L., D. V. Hoyt, J. R. Hickey, R. H. Maschhoff, and B. J. Vallette, 1993b: Nimbus-7 Earth
Radiation Budget Calibration History--Part I: The Solar Channels, NASA RP-1316, 80 pages.
Kyle, H. L., R. R. Hucek, P. E. Ardanuy, J. R. Hickey, R. M. Maschhoff, L. M. Penn, B. S. Groveman,
and B. J. Vallette, 1994:Nimbus-7 Earth Radiation Budget Calibration History--Part II: The Earth Flux
Channels, NASA RP-1335, 120 pp.
Predmore, R. E., H. Jacobowitz, and J. R. Hickey, 1982: Exospheric Cleaning of the Earth Radiation
Budget Solar Radiometer During Solar Maximum, Paper Presented at Proceedings of Society of Photo-
Optical Inst. Eng. (SPIE), (Tech. Symp. East, Arlington, VA, May 3-7, 1982), 338, pp. 104-113.
Smith, E. A., T. H. Vonder Haar, and J. R. Hickey, 1983: The Nature of the Short Period Fluctuations
in Solar Irradiance Received by the Earth, Climate Change, 5, pp. 211-235.
50


REPORT DOCUMENTATION PAGE Form ApprovedOMB No. 0704-0188
Public reportingburden for fhis collection of information is estimated to average 1 hourper response, includingthe time 1orreviewing instructions,searchingexistingdata sources.gathering and maintaining the data needed, and completingand reviewingthe collectionof information. Send comments regarding thisburden estimateor any other aspect of thiscollection of information,including suggestionsfor reducingthis burden, to WashingtonHeadquartersServices. Directorate for InformationOperations and Reports. 1215 JeffersonDavis Highway, Suite 1204, Artington,VA 22202-4302. and to the Office of Management and Budget,Paperwork ReductionPro_lct (0704-0188), Washington. DC 20503.
1. AGENCY USE ONLY (Leave blank) 2. REPORT DATE 3. REPORT TYPE AND DATES COVERED
August 1994 Reference Publication4. TITLE AND SUBTITLE S. FUNDING NUMBERS
Nimbus-7 Earth Radiation Budget Compact Solar Data Set User's Guide
6. AUTHOR(S)H. Lee Kyle, Lanning M. Penn, Douglas Hoyt, Douglas Love,
Sastri Vemury, and Brenda J. Vallette
7. PERFORMING ORGANIZATION NAME(S) AND ADDRESS (ES)
Goddard Space Flight Center
Greenbelt, Maryland 20771
9. SPONSORING/ MONITORINGADGENCYNAME(S)ANDADDRESS(ES)
National Aeronautics and Space Administration
Washington, DC 20546-0001
665-10-70
NAS5-31331
8. PEFORMING ORGANIZATIONREPORT NUMBER
94B00108
Code 902
10. SPONSORING / MONITORING
ADGENCY REPORT NUMBER
NASA RP- 1346
11. SUPPLEMENTARY NOTES
Kyle: Goddard Space Flight Center, Greenbelt, MD; Penn, Hoyt, and Vallette: Research and DataSystems Corp., Greenbelt, MD; Love and Vemury: Scientific Management and Applied ResearchTechnologies, Inc., Silver Spring, MD.
12a.DISTRIBUTION/ AVAILABILITYSTATMENTUnclassified - Unlimited
Subject Category 92This publication is available from the NASA Center for AeroSpaceInformation, 800 Elkridge Landing Road, Linthicum Heights, MD
21090-2934, (301)621-0390.
12b. DISTRIBUTION CODE
13. ABSTRACT (Maximum 200 words)
Nimbus-7 Earth Radiation Budget (ERB) solar measurements extend from November 16, 1978, to December 13,
1993, but with data gaps in 1992 and 1993. The measurements include the total solar irradiance plus six broadband
spectral components. The Channel 10c total irradiance data appears very stable, and the calibration, well done. A
number of characterization problems remain in the spectral measurements. In the original program, the solar and
Earth flux measurements were intermixed and spread over about 170 computer tapes. For easier access, the solar
data have been collected into two compact data sets. All of the data are collected into 14 Summary Solar Tapes
(SSTs). In addition, two Channel 10c Solar Tapes (CSTs) give a separate listing of the stable total solar irradiance
measurements. Channel 10c calibration and orbital irradiance values are given on separate PC disks. This docu-
ment gives data descriptions and formats, together with quality control and calibration procedures.
14. SUBJECT TERMS
Solar constant measurements; solar spectral measurements; sensor characterization;
calibration
17. SECURITY CLASSIRCATION
OF REPORT
Unclassified
18. SECURITY CLASSIRCATIONOF THIS PAGE
Unclassified
19. SECURITY CLASSIRCATIONOF ABSTRACT
Unclassified
15. NUMBER OF PAGES
6016. PRICE CODE
20. LIMITATION OF ABSTRACT
UL
NSN 7540-01-280-5500 Standard Form 298 (Rev. 2-89)Prescribed by ANSI Std, Z39,18