Nigerian Telecommunications (Services) Sector Report
24
Nigerian Telecommunications (Services) Sector Report Q1 2016 01 JUNE 2016
Transcript of Nigerian Telecommunications (Services) Sector Report

Nigerian
Telecommunications
(Services) Sector Report
Q1 2016
01 JUNE 2016

Telecommunications in GDP and growth
In real terms, the telecommunications sector contributed 1,411.74 billion to
GDP in the first quarter of 2016, or 8.83%, an increase of 0.5% points relative to
the same quarter of the previous year. In contrast with previous years, this
percentage contribution is only marginally smaller than in the previous
quarter when the percentage was 8.83%; given seasonal patterns the fall
between the fourth quarter and first quarter of the following year has
averaged 0.56% points over the past five years, compared to 0.05% points in
the current quarter.
In contrast with the economy as a whole which recorded a real growth rate
of -0.36% in the first quarter, growth in the telecommunications sector
increased to 5.00% in the first quarter, from 3.49% in the final quarter of 2015.
The share of telecommunications in total real GDP had declined throughout
2010 to 2014, but for the last five quarters growth in telecommunications has
been higher, meaning the trend has reversed.
Telecommunications Data
The telecommunications data used in this report were obtained from the
National Bureau of Statistics (NBS) and the Nigerian Communication
Commission (NCC). Variables obtained from NBS include Gross Domestic
Product contribution and growth, whilst NCC indicators include those on
subscribers to mobile and internet services by provider, porting activities and
information on tariffs. All data are subject to amendments by NCC and should
be treated as preliminary.

Figure 1: Percentage Contribution of telecommunication to constant price
GDP, and annual growth
Subscribers as of March 2016
The total number of subscribers has increased rapidly over the past decade;
at the end of 2005 there were 19,519,154 subscribers, but by the end of 2015
there were 151,017,244, which is equivalent to an increase of 13,149,809 every
year. However, growth has been declining more recently, possibly as a result
of high market penetration leaving less room for large expansion. In March
2016, there were 148,745,464 subscribers compared with 143,934,208 in March
2015, which represents an increase of 4,811,256 or 3.34%. Notably, this
represents a decrease of 1.50% relative to the end of the previous quarter;
this is the first quarterly decrease on record.
Global System for Mobile Communications (GSM) subscriptions were the only
type to increase between over the year to March 2016 (explored further
below), although at 4.06%, the growth rate was lower than in previous
months. Figure 2 gives a breakdown of subscriptions by type over the period,
and reveals that GSM is the most popular subscription type, and that only a
small fraction of subscriptions are for fixed lines (wireless or wired).
-8
-6
-4
-2
0
2
4
6
8
10
12
Q1 Q2 Q3 Q4 Q1 Q2 Q3 Q4 Q1 Q2 Q3 Q4 Q1 Q2 Q3 Q4 Q1 Q2 Q3 Q4 Q1
2011 2012 2013 2014 2015 2016
%
Percentage contr. to real GDP Year on year real growth in telecomms.

Figure 2: Total number of subscribers each month, Mar 2015 – Mar 2016
Source: NBS, NCC
Subscribers by State of Registration
Lagos State accounted for the largest share of active voice subscribers with
19.04 million or 12.8% of the total, followed by Ogun State with 8.53 million
subscribers or 5.7%, Kano State with 7.81 million or 5.25%, Oyo State with 7.53
million subscribers or 5.06% of the total, then FCT and Rivers State with 6.03
million (4.05%) and 5.84 million (3.93%) respectively. On the other hand,
Bayelsa (1.11 million), Yobe (1.40 million), Ekiti (1.42 million) and Ebonyi (1.43
million) had the smallest number of active subscriber as of q1 2016.
Lagos State was the dominant market for all of the active voice telecom
companies accounting for 10.05% of MTN total voice subscribers (followed by
Ogun, Kaduna and Rivers in that order); 10.03% for Glo (followed by Oyo,
Niger, Ogun and FCT in that order); 16.0% for Airtel (followed by Ogun, Kano
and Oyo); and 19.1% of Etisalat voice subscribers (followed by Ogun, Kaduna
and Rivers in that order)
136
138
140
142
144
146
148
150
152
154
Mar Apr May Jun Jul Aug Sep Oct Nov Dec Jan Feb Mar
2015 2016
millions
GSM CDMA Fixed (wired and wireless)

Subscribers by Technology Type
Subscriber data is broken into four sections according to the technology type
used. The first two are for mobile technology; Global System for Mobile
Communications (GSM) and Core Division Multiple Access (CDMA), whilst the
latter two are fixed lines, either wireless or wired. Mobile subscribers using GSM
dominate, and accounted for 99.09% of the total in December 2015,
followed by CDMA with 0.79% of the total, whist fixed wired and wireless
make up 0.08% and 0.03% respectively. The dominance of GSM users has
increased slightly since March 2015, when 98.41% of subscribers used this
technology type, and also since the end of the 2015 when the percentage
was 98.45%. The share of all other technology types has decreased between
March 2015 and March 2016, but the largest decrease was for CDMA, whose
share fell from 1.46% in March 2015.
The dominance of GSM over CDMA in the mobile technology is characteristic
worldwide; GSM accounted for over 80% of the global market in 2009 Q2
according to industry estimates1. With GSM technology, it is cited as being
easier to switch networks, and it is regarded as being more accessible for
international use, especially given that some markets (such as in Europe)
have mandated the technology by law. However, CDMA is more prevalent
in the United States.
Mobile Subscribers (GSM)
In March 2016, the total number of GSM subscribers was 147,398,854, an
increase of 5,756,018, or 4.06% relative to March 2015. This was less than half
the size of the year on year increase in December 2015 of 8.78%. In addition,
the number is 1.09% smaller than at the beginning of the quarter in January,
when there were 149,022,919, although in February there were the fewest
GSM subscribers, at 146,288,370.
The difference in trends that began in August 2015, between MTN and Etisalat
on the one hand and Globacom and Airtel on the other, continued into the
first quarter of 2016. Despite a slight recovery for both providers in March,
Etisalat and MTN nevertheless saw their subscriber numbers fall, from
22,161,290 in December to 21,877,542 in March for Etisalat (a drop of 1.28%)
and from 61,252,387 in December to 57,045,721 in March for MTN (a drop of
1 GSM World Statistics page, latest publicly available estimates

6.87%). Each provider also recorded a year on year decline, of 1.61% and
6.71% respectively. This is demonstrated in figure 3, which shows subscriber
numbers for each company indexed to March 2015.
Figure 3: GSM subscribers relative to July 2015 by provider, Mar 2015 – Mar
2016
By contrast, Airtel and Globacom continued their uninterrupted upward
trend in subscriber numbers; Airtel recorded monthly increases of 2.75%, 1.33%
and 0.81% in January, February and March 2016, and Globacom recorded
increases of 0.59%, 2.75% and 1.78%. As a result, Airtel had 33,866,798
subscribers in March 2016, which is an increase of 18.08% relative to March
2015. Globacom had 34,608,793 subscribers, which is an increase of 17.01%
over the same period. Airtel’s and Globacom’s respective shares of the total
number of GSM subscribers in March 2016 were 22.98% and 23.48%, higher
than in any previous month over the last two years but nevertheless still
significantly lower than MTN’s share of 38.70%. Etisalat accounted for the
smallest share as in previous quarters, with 14.84% of subscribers.
80
85
90
95
100
105
110
115
120
Mar Apr May Jun Jul Aug Sep Oct Nov Dec Jan Feb Mar
2015 2016
Mar 2015 = 100
Airtel Etisalat Globacom MTN
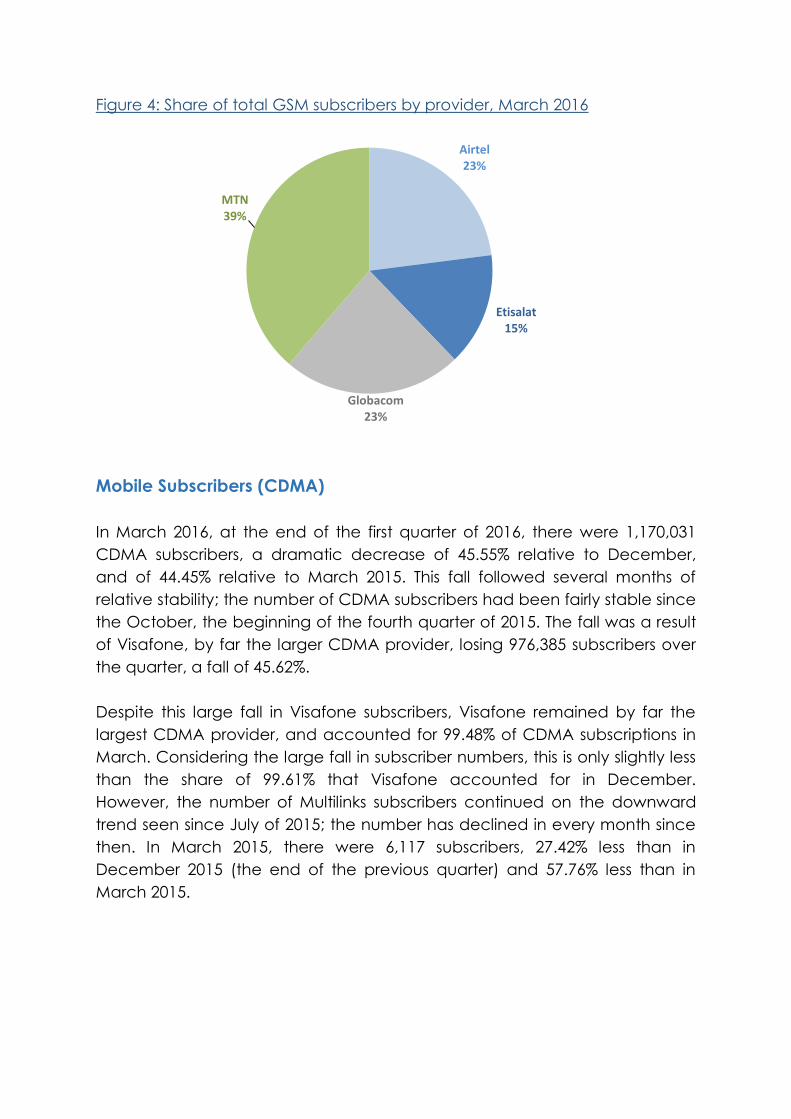
Figure 4: Share of total GSM subscribers by provider, March 2016
Mobile Subscribers (CDMA)
In March 2016, at the end of the first quarter of 2016, there were 1,170,031
CDMA subscribers, a dramatic decrease of 45.55% relative to December,
and of 44.45% relative to March 2015. This fall followed several months of
relative stability; the number of CDMA subscribers had been fairly stable since
the October, the beginning of the fourth quarter of 2015. The fall was a result
of Visafone, by far the larger CDMA provider, losing 976,385 subscribers over
the quarter, a fall of 45.62%.
Despite this large fall in Visafone subscribers, Visafone remained by far the
largest CDMA provider, and accounted for 99.48% of CDMA subscriptions in
March. Considering the large fall in subscriber numbers, this is only slightly less
than the share of 99.61% that Visafone accounted for in December.
However, the number of Multilinks subscribers continued on the downward
trend seen since July of 2015; the number has declined in every month since
then. In March 2015, there were 6,117 subscribers, 27.42% less than in
December 2015 (the end of the previous quarter) and 57.76% less than in
March 2015.
Airtel23%
Etisalat15%
Globacom23%
MTN39%

Fixed Wireless Line
As with CDMA subscribers, the number of fixed wireless line subscriptions
dropped sharply in March 2016, after having remained fairly stable for over a
year. However the decline was less sharp than for CDMA subscriptions. In
March 2016 there were 51,383 subscriptions, compared with 59,745 in
December 2015 and 59,843 in March 2015, which imply declines of 14.00%
and 14.12% respectively. Both Visafone and Multilinks contributed to the
decline, but given Visafone’s larger share of the market for fixed wireless line
subscriptions it accounted for more of the fall in absolute terms. The number
of Visafone subscriptions was 49,565 in March 2016, down 13.53% from
December 2015, and down 10.03% relative to March 2015. In percentage
terms the decline in Multilinks subscribers was more significant: in March 2016
there were 1,787 subscribers, down by 25.14% relative to December 2015 and
down by 62.07% relative to March 2015.
Accordingly, Visafone continued to increase the share of fixed wireless line
subscriptions it accounted for. In March 2016 Visafone accounted for 96.52%
of subscriptions to this technology type, compared with 96.00% in December
2015 and 92.13% in March 2015.
Figure 5: Share of Fixed Wireless line subscribers, by provider, Mar 2015 – Mar
2016
96.52
3.48
80
82
84
86
88
90
92
94
96
98
100
Mar Apr May Jun Jul Aug Sep Oct Nov Dec Jan Feb Mar
2015 2016
%
Visafone Multilinks

Fixed Wired Line
The total number of fixed wired line subscriptions in March 2016 was 125,196,
compared to 127,410 in December 2015 and 125,253 in March 2015. The
number therefore fell both relative to the previous quarter, by 1.74%, and
relative to the previous year, by 0.05%. Although the number fell each month
from January through to March, the biggest fall was in February, when the
number fell to 125,232, from 127,253 in January, a fall of 1.59%.
Although the number of both MTN Fixed and IpNX subscriptions fell, the fall
was largely a result of a decline in MTN Fixed subscriptions, which fell by
23.09% relative to December 2015 and by 31.81% relative to March 2015. By
contrast, IpNX subscriptions fell by 2.09% and 1.14% over the same periods. As
a result the share of each of these providers fell. MTN Fixed accounted for
5.98% of subscribers in March 2016, compared to 8.77% the previous year.
IpNS accounted for 2.21%, marginally lower than the 2.23% accounted for the
previous year. Interestingly, in previous quarters IpNX had exhibited a
seasonal pattern in subscription numbers – the only provider to do so – but this
was broken in the first quarter of 2016. For example in January and February
in 2015 IpNX subscribers fell by 5.74% and 9.21%, before rebounding by 15.82%
in March, a pattern characteristic of each quarter prior to 2016 Q1. In
January and February 2016 however, IpNX subscriptions fell by only 0.25% and
1.10% respectively, and fell by a further 0.75% in March.
21st Century recorded increases in the number of subscriptions over both
periods; the number of 21st Century subscribers increased marginally by 0.06%
relative to December 2015 and by 3.53% relative to March 2015. Glo Fixed
subscriptions changed very little over either period, recording growth rates of
0.34% relative to December 2015 and -0.38% relative to March 2015. 21st
century continued to be by far the largest provider of fixed wired line
subscriptions, and at 82.42% the share it accounted for was higher than the
March of the previous year of 79.58%. The share of Glo Fixed declined slightly
over the same period, from 9.42% to 9.39%, although it remained the second
largest provider.

Figure 6: Share of total Fixed Wired Line subscriptions, by provider, March 2016
Internet Subscriptions
GSM internet subscriptions
Of all GSM users, a total of 92,285,052 had an internet subscription with one of
the four carriers of Airtel, Etisalat, Globacom and MTN in March 2016. This
means that of all the active GSM lines, 62.61% had an internet subscription.
Throughout most of 2014 and 2015 this proportion had been following an
upward trend, but this was reversed in the first quarter of 2016 after stalling in
the fourth quarter of 2015; the proportion was 65.26% in December 2015.
However, the proportion is still higher than in the previous March, when it was
60.23%.
MTN Fixed6%
Glo Fixed9%
ipNX2%
21st Century83%

Figure 7: GSM Subscribers and internet subscriptions, Mar 2015 – Mar 2016
This fall in the proportion of GSM users with internet subscriptions was caused
by a decline of4.89% in the number of internet subscriptions since December
2015. The number fell in each month of the first quarter: by 1.28%, 2.29% and
1.41% in January, February and March respectively. As a result there were
4,747,491 fewer GSM internet subscriptions in March 2016 than in December
2015. This fall was caused entirely by MTN, who had 6,568,142 fewer internet
subscribers in March 2016 than in December 2015, a decline of 16.45%. This
was also a decline since March 2015 of 16.41%. As a result, MTN’s share of
GSM internet subscriptions declined over this period from 39.90% to 33.36%,
although this still makes it the largest provider.
All other providers recorded increases both relative to the previous year and
to December 2015, the end of the previous quarter, although these increases
were not large enough to outweigh the reduction in MTN’s subscriptions.
Over the quarter, Globacom recorded the largest increase of 5.77%,
compared with 1.90% for Airtel and 0.35% for Etisalat. By Contrast, Etisalat
recorded the highest increase relative to March of the previous year of
49.59%, compared to 42.50% for Globacom and 3.32% for Airtel. As a result,
Globacom and Etisalat have both increased their share of total internet
subscription numbers between March 2015 and March 2016, from 18.62% to
26.53% for Globacom and from 10.19% to 15.24% for Etisalat. Airtel’s share was
comparatively stable, and increased from 16.60% to 17.16%
0
10
20
30
40
50
60
70
80
90
100
0
20
40
60
80
100
120
140
160
Mar Apr May Jun Jul Aug Sep Oct Nov Dec Jan Feb Mar
2015 2016
%millions
GSM subscriptions GSM internet subscriptions Ratio (rh axis)

Figure 8: Internet subscribers with GSM technology, by company, Mar 2015 –
Mar 2016
CDMA internet subscriptions
Although the ratio of internet to mobile subscriptions amongst CDMA
providers is low relative to GSM subscribers, it increased markedly in the first
quarter of 2016, to 10.68% in March 2016 from 6.80% in December 2015. This
increase happened mainly in March, as a result of the large decline in the
number of Visafone subscribers in this month. The ratio of internet subscribers
to all subscribers with Visafone was 7.01% in December 2015, and remained
constant until March when it increased to 10.72%, despite a decrease in
internet subscriptions of 16.80% between December and March.
Internet subscriptions are less common among Multilinks subscribers; in March
2016 there were only 142, compared with 6,117 subscriptions overall implying
a ratio of 2.32%. This is also less than in December 2015, as although the
number of subscription with Multilinks declined by 27.42%, the number of
internet subscriptions declined by 45.17%, from 259 to 142.
Given that Visafone dominates the CDMA internet subscriptions to a greater
extent than the mobile subscriptions (accounting for 99.89% in March 2016) it
is the main driver of total CDMA internet subscriptions. After remaining stable
from July 2015 through to February 2016, the was a sharp decline in March
-
20
40
60
80
100
120
Mar Apr May Jun Jul Aug Sep Oct Nov Dec Jan Feb Mar
2015 2016
millions
MTN Airtel Etisalat Globacom

2016, which led to a decrease of 18.09% relative to the previous March and
of 16.80% relative to December 2015.
The total number of CDMA subscriptions declined by 14.57% overall over the
first quarter, compared with a decline of 4.89% for GSM subscriptions, which
means that the latter continues to entrench its position as the most popular
form of internet subscriptions.
Internet Subscriptions by State of Registration
Lagos State accounted for the largest share of active internet subscribers
with 12.62 million or 13.65% of the total, followed by Ogun State with 5.62
million subscribers or 6.09%, Oyo State with 4.90 million subscribers or 5.31% of
the total, then Kaduna and Kano State with 4.23 million (4.57%) and 4.13
million (4.47%) internet subscribers respectively. On the other hand, Yobe
(0.69 milliom), Bayelsa (0.73 million) and Ebonyi (0.79 million) had the smallest
number of active internet subscriber as of q1 2016.
Lagos was the dominant market for all of the active internet telecom
companies accounting for 11.34% of MTN total internet subscribers (followed
by Ogun, Kano and Rivers in that order); 10.36% for Glo (followed by Oyo,
Niger, Ogun in that order); 16.95% for Airtel (followed by Kano. Kaduna and
Rivers); and 20.27% of Etisalat voice subscribers (followed by Ogun, FCT and
Kaduna in that order).
Porting Activities
Porting activities refer to the transferal of subscribers to different network
carriers. Therefore, incoming porting activities refer to those subscribers that
have joined a network, whilst outgoing porting activities refer to those whom
have left. The first quarter of 2016 recorded an increase in the number of
porters relative to the first quarter of 2015. However both incoming and
outgoing porting activity fell from peaks in the third quarter of 2015.
There was a total of 51,301 incoming porters in the first quarter of 2016,
compared to42,843 in the same quarter of 2015, an increase of 19.74%. This
was largely as a result of an increase of 159.97% in the number of subscribers
switching to Airtel, although Globacom also saw an increase of 42.55%.
Compared to the final quarter of 2015 when there were 52,335 porters, there
was a slight decline of 1.98%.

Outgoing activity increased by 20.81% between the first quarters of 2015 and
2016, from 43,849 to 52,973. As in previous quarters, this change was driven to
a large extent by MTN, who saw an increase in outgoing porting activity of
48.07% over this period. In contrast to incoming porting activity, there was an
increase of 0.72% between the last quarter of 2015 and the first of 2016.
Comparing the incoming porting activities with the outgoing, emphasises the
extent to which Etisalat benefits, and MTN loses out from such activities. Figure
9 makes this comparison for the fourth quarter of 2015, with outgoing porting
activities represented by the negative bars. It also reveals that a gap has
emerged between Globacom and Airtel, which previously recorded similar
levels of outgoing and incoming activity.
Figure 9: Summary of Porting Activities, Q1 2016
Incoming
As with the total number of GSM subscriptions, there was a clear divergence
between Globacom and Airtel on the one hand, and Etisalat and MTN oni
the other. The first two providers recorded strong increases in incoming
activity, both year on year (of 42.55% and 159.97% for Globacom and Airtel
respectively) and quarter on quarter (of 104.26% and 23.41% respectively).
This compares to decreases in incoming activity for MTN and Etisalat, both
year on year (67.96% and 8.27% respectively) and quarter on quarter (39.57%
and 30.79%).
-40,000
-30,000
-20,000
-10,000
0
10,000
20,000
30,000
Etisalat Airtel Globacom MTN
Incoming Outgoing Net
Outgoing
Incoming

However, Etisalat remained the largest beneficiary of incoming porting
activity, and accounted for 48.49% in the first quarter of 2016, just short of half
of all incoming activity. In addition, the decline recorded by Etisalat was a
result of less activity in January and February, when the provider recorded
6,329 and 7,411 incoming porters respectively. By March the number had
recovered to 11,136. Nevertheless its share for the whole quarter was
significantly less than in the same quarter of the previous year, when the
share was 63.30%. Airtel remained the second largest beneficiary, and
recorded increases in incoming porters each month. As a result, Airtel’s share
increased from 17.97% to 37.44% between the final quarter of 2015 and first
quarter of 2016.
Despite recording a decline in the number of incoming porters, Globacom
increased their share of the total, from 9.08% in the final quarter of 2015 to
11.43% in the first quarter of 2016. This is because MTN recorded a much
sharper fall in the number of incoming porters, and correspondingly, their
share fell from 4.28% to 2.64% over the same period.
Outgoing
The first quarter of 2016 recorded 52,973 outgoing porters, 0.72% less than in
the last quarter of 2015 when there were 52,595. Each provider recorded
increases between these periods apart from MTN, which recorded a
decrease of 3.69%. However the largest increase recorded by Globacom,
who lost 16.82% more subscribers to outgoing porting activities than in the
previous quarter. The total number of outgoing porters fell in January, before
recording strong increases in each subsequent month.
As with incoming activity, there was a reduction in the number of outgoing
porters between the third and fourth quarter, the number fell by 23.26% from
68,534 to 52,595. November was the month in which there was the most
outgoing activity, when there were 18,258 people to leave their network,
compared to 17,758 in December and 16,579 in October.
The share of outgoing porting activity accounted for by each provider was
more stable than the share of incoming porting activity. Despite being the
only provider to record a quarterly decrease MTN still accounted for the
largest share of 58.59%, although this is slightly lower than the share of 61.27%
recorded in the previous quarter. All other providers increased their share.
Airtel accounted for the second largest number of outgoing porters; their
share increased from 18.70% to 18.85% between the last quarter of 2015 and
the first quarter of 2016. Globacom’s share increased from 11.64% to 13.50%
over the same period, and Etisalat’s increased from 8.39% to 9.06%.

Net Porting Activities
In the first quarter of 2016 Etisalat remained the largest beneficiary of porting
activities, despite recording a quarterly decline in incoming activities and an
increase in outgoing activities. However their net gain was reduced to 20,076
from 31,530 in the previous quarter. Following the large increase in incoming
activity, Airtel recorded the largest net gain since 2013, of 9224. This
compares with a net loss of 432 in the previous quarter.
By contrast both Globacom and MTN continued to record net losses from
porting activity. Globacom’s net loss declined slightly, they recorded a net
loss of 1,289 compared a net loss of 1,371 in the previous quarter. MTN also
reduced their net loss in the first quarter of 2016, from 29,987 in the previous
quarter to 29,683. However, it remains the provider to lose by far the most
porters in net terms.
Figure 10: Net Porting Activities by provider, Mar 2015 – Mar 2016
Tariff Details
Across all providers, there are numerous options for tariff plans, each differing
according to the overall cost and the services provided. This reflects the fact
that there are many facets to the services telecommunications companies
provide, such as SMS messaging, local and international call and data
bundles. The variety of options may reflect the telecommunications
-20,000
-15,000
-10,000
-5,000
0
5,000
10,000
15,000
Mar Apr May Jun Jul Aug Sep Oct Nov Dec Jan Feb Mar
2015 2016
Airtel Etisalat Globacom MTN

companies attempting to attract customers with more tailored packages,
catering to a wide range of different user needs.
Tariffs tend to differ according to whether they are on-peak or off-peak,
whether the service is to someone on the same network (on-net) or a
different one (off-net), and whether they are pre- or post-paid. However not
all networks offer different prices according to these characteristics; for its
pre-paid plans, Etisalat offers the same prices for on-net and off-net calls
regardless of what bundle is purchased, and Airtel do not distinguish
between on-peak of off-peak calls.
As a result of the different options available, whether or not prices are higher
or lower than in 2014 largely depends on usage. For example, Airtel 2Good
Classic (a particular package offered by Airtel) offers cheaper rates than
Airtel Connect (an alternative package), but charges a daily fee of 5 naira.
Therefore which is cheaper will depend on usage; the more the line is used,
the more it would be worth paying the 5 naira daily fee.


Appendix - Tables
Table 1: Contribution to Basic Price GDP of Telecommunications Sector, %
2014
2015
2016
Q1 Q2 Q3 Q4 Q1 Q2 Q3 Q4 Q1
Constant
prices 8.27 9.25 7.57 8.76 8.38 9.46 7.71 8.88 8.83
Current
prices 7.95 10.53 7.41 7.57 8.55 10.96 7.58 7.72 8.70
Table 2: Annual Growth in Telecommunications Sector, %
2014 2015 2016
Q1 Q2 Q3 Q4 Q1 Q2 Q3 Q4 Q1
Constant
prices 4.48 6.15 6.25 2.48 5.36 4.66 4.69 3.49 5.00
Current
prices 9.53 8.68 15.67 15.81 12.14 9.42 8.43 9.24 7.63

Table 3: Mobile Subscribers by Carrier
2015
2016
Mar Apr May Jun Jul Aug Sep Oct Nov Dec Jan Feb Mar
GSM Airtel 28,680,757 29,291,114 29,539,739 29,564,766 30,075,643 30,569,278 31,134,625 31,273,483 31,936,152 32,268,301 33,155,339 33,595,561 33,866,798
Etisalat 22,235,557 22,444,198 22,597,264 22,852,232 23,029,329 23,307,025 23,492,214 23,180,651 22,783,861 22,161,290 22,035,107 21,840,452 21,877,542
Globacom 29,577,125 30,040,119 30,482,435 31,256,677 31,256,677 31,445,115 31,306,472 31,994,298 32,469,350 32,999,384 33,193,174 34,003,841 34,608,793
MTN 61,149,397 61,281,803 61,767,403 62,813,111 64,133,556 63,381,742 62,493,732 63,234,827 62,597,757 61,252,387 60,639,299 56,848,516 57,045,721
Total 141,642,836 143,057,234 144,386,841 146,486,786 148,495,205 148,703,160 148,427,043 149,683,259 149,787,120 148,681,362 149,022,919 146,288,370 147,398,854
CDMA
Visafone 2,091,804 2,220,069 1,983,699 2,095,193 2,046,678 2,115,124 2,031,802 2,120,880 2,140,299 2,140,299 2,140,299 2,140,299 1,163,914
Multilinks 14,481 14,233 9,579 10,788 10,841 10,817 10,213 9,463 8,976 8,428 7,683 7,024 6,117
Total 2,106,285 2,234,302 1,993,278 2,105,981 2,057,519 2,125,941 2,042,015 2,130,343 2,149,275 2,148,727 2,147,982 2,147,323 1,170,031
Fixed Wireless
Visafone 55,123 55,244 55,210 55,548 60,218 62,247 63,396 59,863 57,358 57,358 57,358 57,358 49,596
Multilinks 4,711 4,637 2,896 3,387 3,379 3,164 2,923 2,592 2,502 2,387 2,257 2,076 1,787
Total 59,834 59,881 58,106 58,935 63,597 65,411 66,319 62,455 59,860 59,745 59,615 59,434 51,383
Fixed Wired
MTN Fixed 10,986 10,995 9,740 9,687 9,693 9,719 9,731 9,732 9,746 9,753 9,759 7,470 7,491
Glo Fixed 11,795 11,834 11,850 11,834 11,834 11,646 11,658 11,657 11,701 11,710 11,505 11,786 11,750
ipNX 2,796 2,596 2,430 2,839 2,680 2,466 2,879 2,717 2,451 2,823 2,816 2,785 2,764
21st
Century 99,676 99,484 99,499 99,348 100,477 100,281 100,986 102,959 103,019 103,124 103,173 103,191 103,191
Total 125,253 124,909 123,519 123,708 124,684 124,112 125,254 127,065 126,917 127,410 127,253 125,232 125,196

Table 4: Internet Subscriptions by Carrier
2015
2016
Mar Apr May Jun Jul Aug Sep Oct Nov Dec Jan Feb Mar
GSM
Airtel 16,603,147 17,272,665 17,634,885 17,598,626 17,605,852 17,495,014 17,730,955 17,800,917 16,837,282 16,835,952 16,855,609 17,079,646 17,155,181
Etisalat 10,189,568 10,421,229 10,330,559 15,285,079 15,393,860 15,541,009 15,598,070 15,407,008 15,161,307 15,189,788 15,283,903 15,231,652 15,242,856
Globacom 18,617,607 19,690,526 19,340,990 19,330,549 19,330,549 20,765,379 21,896,229 23,285,454 24,952,559 25,082,066 25,436,244 25,684,837 26,530,420
MTN 39,904,772 39,520,285 40,830,146 40,485,670 41,101,886 41,411,846 41,835,294 41,025,019 40,872,869 39,924,737 38,218,859 35,604,370 33,356,595
Total 85,315,094 86,904,705 88,136,580 92,699,924 93,403,147 95,213,248 97,060,548 97,518,398 97,824,017 97,032,543 95,794,615 93,600,505 92,285,052
CDMA
Multilinks 649 551 527 126 167 203 260 286 289 259 224 172 142
Visafone 152,315 150,252 147,487 115,481 148,461 151,923 151,530 149,781 145,953 149,953 149,953 149,953 124,768
Total 153,434 152,866 150,779 147,613 115,648 148,664 152,183 151,816 150,070 146,212 149,471 146,177 124,910
Table 5: Porting Activities by Carrier
2015
2016
Mar Apr May Jun Jul Aug Sep Oct Nov Dec Jan Feb Mar
Incoming
Airtel 2,289 2,933 4,161 6,290 6,613 5,596 5,347 3,074 3,445 2,885 5,280 5,752 8,177
Etisalat 10,111 9,875 12,252 13,382 14,125 11,875 12,898 11,211 12,346 12,384 6,329 7,411 11,136
Globacom 1,435 1,717 1,065 850 850 1,413 1,505 979 1,735 2,037 2,589 1,828 1,446
MTN 1,559 994 657 536 951 737 599 1,068 735 436 450 542 361
Total 15,394 15,519 18,135 21,060 22,539 19,621 20,349 16,332 18,261 17,742 14,648 15,533 21,120
Outgoing
Airtel 3,197 3,381 3,316 3,768 4,047 3,362 3,635 3,562 3,086 3,188 4,396 2,095 3,494
Etisalat 1,431 1,777 1,984 2,177 2,161 2,077 1,264 1,241 1,431 1,739 976 1,671 2,153
Globacom 2,651 2,038 3,253 3,290 3,290 2,795 3,212 1,703 2,327 2,092 1,065 2,517 3,570
MTN 7,439 8,161 9,558 11,918 19,214 11,218 12,259 10,073 11,414 10,739 8,430 10,562 12,044
Total 14,718 15,357 18,071 21,153 28,712 19,452 20,370 16,579 18,258 17,758 14,867 16,845 21,261

SN STATES
Sub Total
MTN GLO AIRTEL EMTS
MULTIL
INKS
V ISAFONE IPNX MTN FIXED 21ST CENT GLO- FIXED
1 ABIA 1,345,196 568,920 664,418 599,329 - - 2 - . 3, 177,965
2 ADAMAWA 1,029,856 511,678 896,934 285,487 - - - - . . 2,723,955
3 AKWA IBOM 1,133,073 391,651 1,157,711 433,323 - - . . . 3, 116,758
4 ANAMBRA 2,140,384 526,615 879,158 703,634 1 - - . . 4,249,792
5 BAUCHI 1,169,665 514,885 716,158 346,617 1 - - - . . 2,747,326
6 BAYELSA 457,130 259,933 284,459 108,562 - - - . 1,110,084
7 BENUE 1,111,979 1,241,842 787,687 670,825 1 - - - . - 3,812,334
8 BORNO 748,134 351,414 1,007,889 298,714 - - - - . . 2,406,151
9 CROSS RIVER 795,289 407,804 589,469 406,353 - . 27 - 2,198,942
10 DELTA 2,067,655 1,298,166 1,167,728 400,988 14 . - . 4,934,551
11 EBONYI 628,826 203,585 382,401 222,133 - - - - . . 1,436,945
12 EDO 1,642,122 1,75,365 863,150 500,541 2 . . - 2,930 4,744,110
13 EKITI 847,619 304,859 223,569 49,898 - - - - - 1,425,945
14 ENUGU 1,375,844 629,300 679,853 411,069 5 - - - 3,096,071
15 FCT 1,949,187 1,765,833 1,037,564 1,278,105 106 224 1,987 393 1,508 6,034,907
16 GOMBE 708,478 392,014 527,902 186,772 - - - - 1,815,166
17 IMO 1,735,784 442,468 682,475 454,481 - - - . 3,315,208
18 JIGAWA 892,073 205,699 502,354 220,123 - - - - . . 1,820,249
19 KADUNA 2,558,828 1,485,191 1,582,787 1,160,306 5 - . . 6,787,117
20 KANO 3,742,861 1,205,526 1,894,599 967,741 6 8 4 . 545 7,811,290
21 KATSINA 1,712,512 812,996 567 356,601 1 - . 3,449, 189
22 KEBBI 809,267 593,289 399,448 248,085 . - - . . . 2,050,089
23 KOGI 907,726 1,383,128 347,551 365,918 1 - - - - . 3,004,325
24 KWARA 1,410,527 850,803 638,323 434,885 5 . . - . 3,334,543
25 LAGOS 5,736,067 3,588,424 5,421,268 4,187,760 7,704 2,344 4,744 92,486 5,860 19,046,657
26 NASSARAWA 913,917 1,136,053 583,672 628,322 - 3,261,964
27 NIGER 1,436,482 2,067,621 853 780,364 1 - - . . 5,137,400
28 OGUN 3,124,465 1,987,975 1,940,214 1,483,227 12 - - ‘ . - 8,535,893
29 ONDO 1,584,279 1,105,123 565,942 218,082 11 . . . 3,473,437
30 OSUN 1,888,178 1,060,536 548,397 211,692 6 - - - . 3,708,809
31 OYO 2,488,711 1,625,482 1,531,467 891,947 11 22 39 - 907 7,538,586
32 PLATEAU 1,256,899 727,713 540,199 501,592 6 - - . 3,026,409
33 RIVERS 2,492,877 1,081,261 1,199,863 1,064,363 5 166 688 10,312 - 5,849,535
34 SOKOTO 1,009,761 507,432 402,890 328,223 . . . . 2,248,306
35 TARABA 756,140 290,799 760,812 213,361 - . - . . 2,021,112
36 YOBE 649,296 41,600 618,125 93,336 - . - - . . 1,402,357
37 ZAMFARA 788,534 304,809 420,350 164,783 - - - . - 1,678,476
38 OTHERS (Undefined) 1 1,213,510 - 1,213,511
TOTAL 57,045,711 34,608,793 33,866,798 21,377,542 7,904 1,213,510 2,764 7,491 103,191 11,750 148,745,464
ACTIV E V OICE SUBSCRIPTIONS PER STATE AS AT MARCH 2016
Total Number of Active V oice Subscriptions Per State
Mobile (GSM) Fixed / Fixed Wireless

S/N States Sub-Total
MTN GLO AIRTEL EMTS MULTILINKS VISAFONE IPNX MTN FIXED 21ST CENT
1 ABIA 799,667 436,123 348,194 424,961 - 1,606 - . - 2,010,551
2 ADAMAWA 619,072 392,242 421,984 188,210 . . • . 1,621,508
3 AKWA IBOM 665,976 300,998 592,166 299,950 . 2,240 - . 1,861,330
4 ANAMBRA 1,257,484 403,693 466,199 479,680 . 1,749 - • . 2,608,805
5 BAUCHI 600,130 394,701 335,474 229,206 - - 98 - 1,559,609
6 BAYELSA 303,280 199,259 155,776 74,340 . 122 . 732,777
7 BENUE 641,011 951,971 367,712 463,288 - . . 109 - 2,424,091
8 BORNO 410,030 269,387 475,770 192,168 . . _ 1,347,355
9 CROSS RIVER 481,121 312,615 291,951 289,150 - 414 . . . 1,375,251
10 DELTA 1,289,739 995,148 655,145 281,005 2 3,799 . 527 . 3,225,365
11 EBONYI 323,395 156,064 170,769 146,291 - - . 796,519
12 EDO 1,017,364 1,330,297 438,898 352,890 . 5,473 - . 3,144,922
13 EKITI 499,355 233,699 112,683 33,955 . 10 527 . 879,702
14 ENUGU 776,674 482,409 336,889 276,678 1 816 . . . 1,873,467
15 FCT 1,284,271 1,353,653 565,326 912,060 1 15,203 466 1,094 98 4,132,172
16 GOMBE 392,777 300,511 243,555 126,679 . - 1,063,522
17 IMO 1,006,399 339,187 364,448 312,236 - 1,597 . . 2,023,867
18 JIGAWA 379,356 157,685 220,839 140,519 - . . . 898,399
19 KADUNA 1,489,512 1,138,518 801,083 802,206 - 117 - 274 . 4,231,710
20 KANO 1,737,833 924,132 848,015 623,078 1 974 233 . 4,134,266
21 KATSINA 785,463 623,227 255,459 222,997 1 47 . . 1,887,194
22 KEBBI 394,017 454,804 162,777 150,945 . - . . 1,162,543
23 KOGI 546,805 1,060,279 182,017 250,980 1 . . • . 2,040,082
24 KWARA 836,708 652,209 313,018 312,336 2 640 - 286 . 2,115,199
25 LAGOS 3,785,843 2,750,815 2,909,807 3,090,355 121 73,992 3,382 3,515 2,832 12,620,662
26 NASSARAWA 580,632 870,876 290,290 433,596 - 2,175,394
27 NIGER 785,044 1,584,998 414,105 517,574 . - . . 3,301,721
28 OGUN 2,116,671 1,523,943 891,132 1,095,660 3 2,015 - . 5,629,424
29 ONDO 969,920 847,165 274,154 '49,709 1 . • . 2,240,949
30 OSUN 1,080,161 812,986 245,132 145,146 2 540 - 238 2,284,205
31 OYO 1,545,571 2,012,643 711,295 632,519 4 5,919 80 61 4,908,092
32 PLATEAU 754,086 557,851 266,423 343,223 2 272 . . . 1,921,857
33 RIVERS 1,588,524 828,873 670,586 756,809 - 7,233 400 779 96 3,853,300
34 SOKOTO 510,453 388,987 171,963 193,194 - . 196 1,264,793
35 TARABA 435,080 222,921 358,386 138,333 - . - . 1,154,720
36 YOBE 324,022 31,890 283,534 55,185 . . . . 694,631
37 ZAMFARA 343,149 233,661 169,114 105,745 . . - . . 851,669
38 OTHERS (Undefined) 373,113 373,113
TOTAL 33,356,595 26,530,420 17,155,181 15,242,856 142 124,768 4,571 7,177 3,026 92,424,736
ACTIV E INTERNET SUBSCRIPTIONS PER STATE AS AT MARCH 2016
Total Number of Active Internet Subscriptions Per State