Nigerian Journal of Rural Sociology Vol. 15, No. 2, March 2015
120
Transcript of Nigerian Journal of Rural Sociology Vol. 15, No. 2, March 2015

Nigerian Journal of Rural Sociology Vol. 15, No. 2, March 2015
2
ISSN 0189 - 7543
NIGERIAN
JOURNAL OF
RURAL SOCIOLOGY
Vol. 16 No. 2 JUNE, 2015
Published by:
The Rural Sociological Association of Nigeria

THE EDITORIAL BOARD
Editor-in-Chief
Ademola Kuponiyi Dept. of Agricultural Extension and Rural Development, LAUTECH, Ogbomoso, Nigeria Associate Editors
O. A. Adeokun Olabisi Onabanjo University, College of Agricultural Sciences (Yewa Campus), Ayetoro, Ogun State, Nigeria Grace Adebo Dept. of Agricultural Economics and Extension, University of Ado-Ekiti, Nigeria A. J. Farinde Dept. of Agricultural Extension and Rural Sociology, Obafemi Awolowo University, Jle-lfe, Nigeria L. A. Akinbile Dept. of Agricultural Extension and Rural Development, University of Ibadan, Ibadan, Nigeria Editorial Advisers
Barnabas M. Dlamini Faculty of Agriculture, University of Swaziland, Luyengo Campus, Swaziland
A.A.Jibowo Department of Agriculture Education, University of Swaziland, Luyengo, Swaziland Janice E. Olawoye Dept. of Agricultural Extension and Rural Development, University of Ibadan, Ibadan, Nigeria J. A. Kwarteng Faculty of Agriculture, University of Cape Coast, Cape Coast, Ghana Managing Editor
O. T. Yekinni Department of Agricultural Extension and Rural Development, University of Ibadan, Ibadan, Nigeria
Editorial Policy
The purpose of the Journal is to provide an avenue for fostering creativity, scholarship and scientific information in Rural Sociology, Agricultural Extension, Agricultural Economics, Human Ecology and other related disciplines. Attention is focused on agricultural and rural development. Priority will therefore be given to articles on rural society. The Journal will also accept methodological, theoretical, research or applied contributions in these areas. Opportunity is open to scientists and development experts within and outside the country to submit relevant papers for publication. The journal basically follows a peer reviewed process in its assessment of manuscripts.

Nigerian Journal of Rural Sociology Vol. 15, No. 2, March 2015
4
INSTRUCTIONS TO CONTRIBUTORS
Manuscripts
Manuscripts submitted are not supposed to have been published or being considered for publication elsewhere. Papers should be between 3,000 and 5,000 words. Only electronic copy should be submitted; with 12 font size and Times New Roman font type and double line spaced. The TITLE of the paper should be followed by the names, initials and address(es) of the author(s). An ABSTRACT of about 150 words which reports the research problem, purpose, method, results and conclusion should be provided. Keywords consisting of four to five words should be provided after the abstract. Articles should be written in English only. Research papers, review articles, case studies, postgraduate projects are welcome. Submit to the Editor-in-Chief through the journal’s website http://www.journal.nrsa.org.ng.
TABLES, FIGURES and Other illustrations should be numbered consecutively and located appropriately within texts after the point of first mention. However, authors should ensure that table does not spill over to the next page. REFERENCE AND LEGENDS TO ILLUSTRATIONS should be placed appropriately within the body of the paper and authors should ensure that they are in camera ready form. Guidelines on illustrations should follow the American Psychological Association [APA] Publication Style Manual. FOOTNOTES should be avoided as much as possible. Acknowledgements should appear after Conclusion before the reference list. REFERENCES should be cited within the text as follows: Abiodun (2009) found that ................... On the other hand, after stating the findings, the author's name and year of publication can be inserted; for example, income was positively correlated with educational attainment (Abiodun, 2009). The references should then appear in alphabetical order of the names of first authors in the list of references. For the reference list, the APA Publication Style Manual should be adopted. E.g. Abiodun, J. R. (2009) for single authored paper and Abiodun J. R. and Alabi, O. E. (2009) for double authored. Reprints: These will be provided on request from authors.

Contents
SN Paper title Author(s) Pages
1 Beneficiaries’ perception of the effect of IFAD-Community Based Natural Resource Management programme (CBNRMP) on their livelihood in Edo state, Nigeria
Alufohai, G. O., Ugolor, D., Edemhanria, I. I.
7 – 12
2 Gender analysis of perceived effectiveness of electronics wallet in fertiliser distribution among vegetable farmers in Ekiti state, Nigeria
Ogunjimi S. I., Ajala, A. O. and Alabi, O. O.
13 – 20
3 Effectiveness of video as a pathway for extension agents in disseminating rice cultivation practices in Ogun state
Sadiq, M. M., Oyelere, G. O. and Oladoyinbo, O. B.
21 – 25
4 Factors affecting tilapia fish farming in Ondo and Ekiti states, south west Nigeria
Odefadehan, O. O., Alfred, S. D. Y., Onasanya, O. O. and Ogunwande, I. O.
26 – 33
5 Influence of advisory services activities on adoption of selected livestock technologies among Fadama III sheep and goat farmer groups in Akinyele and Lagelu local government area of Oyo state Nigeria
Oyewole, M. F. 34 – 39
6 Influence of socioeconomic characteristics on participation in Fadama II project in Ekiti local government area, Kwara state in Nigeria
Adewumi, I. I. and Okunade, E. O.
40 – 44
7 Modern building technology and livelihood adaptation among masons in rural Ibadan
Liadi, O. F. 45 – 53
8 Motivational needs of early career agriculture lecturers in Southeast Nigeria
Ifeanyi-obi, C. C. and Enyindah, F.
54 – 60
9 Perceived nutritional and medicinal values of date palm (Phoenix Dactylifera) among rural dwellers of Katsina state, Nigeria
Ikwuakam, O. T. and Olutegbe, N. S.
61 – 68
10 Readers’ perception of the development inclination of Oriwu Sun community newspaper in Ikorodu area of Lagos state
Badiru, I. O. and Ajao, S. T.
69 – 74
11 Roles of credit institutions in the improvement of rural livelihood and poverty alleviation in Mangu local government area, Plateau state
Ejembi, S. A., Attah, A. J. and Damulak, J. S.
75 – 79
12 Rural households perception of solar energy as an alternative source of household electrical energy in Oyo state
Ajao, I. E. and Oyesola, O. B.
80 – 86
13 Social factors affecting livelihood strategies of rural households in southeast Nigeria: Implication for rural development
Nwaogwugwu, O. N. and Matthews-Njoku, E. C.
87 – 94
Nigerian Journal of Rural Sociology Vol. 15, No. 2, March 2015
6
SN Paper title Author(s) Pages
14 Socioeconomic status of households in university of Ibadan social laboratory in Igbo-Ora, Oyo state
Ayinde Y. O. and Oyesola O. B.
95 – 101
15 Effect of vegetable profitability on the living standards of urban farmers in Lagos state
Edeoghon, C. O. and Anozie, O.
102 – 109
16 Use of endogenous knowledge in treating pests and diseases of small ruminants in Obokun local government area of Osun state
Omotara, O. A. and Olutegbe, N. S.
110 – 115
17 Utilisation of access to Global Online Research in Agriculture (AGORA) by final year undergraduate students of the faculty of agriculture and forestry, University of Ibadan. Nigeria
Badiru, I. O., Fawole, O. P. and Nkwocha, C. A.
116 – 120

Nigerian Journal of Rural Sociology Vol. 15, No. 2, March 2015
7
BENEFICIARIES’ PERCEPTION OF THE EFFECT OF IFAD-COMMUNITY BASED NATURAL
RESOURCE MANAGEMENT PROGRAMME ON THEIR LIVELIHOOD IN EDO STATE, NIGERIA 1Alufohai, G. O., 2Ugolor, D., 2Edemhanria, I. I.
1Department of Agricultural Economics and Extension Services, University of Benin, Benin City 2Africa Network for Environment and Economic Justice (ANEEJ), Benin City
E-mail: [email protected] ABSTRACT The study examined the beneficiaries’ perception of the effect of IFAD-Community-Based Natural Resource
Management Programme (CBNRMP) on their livelihood in Edo State. CBNRMP is one of many effort aimed at
improving the livelihood of rural dwellers, it is important to examine how far this has been achieved from the
beneficiaries’ perspective. The main objective was to ascertain project beneficiaries’ perception of the
effectiveness of the programme on their standard of living and assess their satisfaction. Data were collected
from 82 CBNRMP beneficiaries randomly sampled from the three agro-ecological zones in the State. Structured
questionnaire and interview schedule were employed as instruments of data collection. Data collected were
analyzed using frequency counts, means, percentages and satisfaction indices. Perception was rated using the
scores from a Likert- type scale. The study found that most beneficiaries in the CBNRM programme were males
(80.5%), small scale operators (average = 2.9ha) with their average age being 49 years (46.3%). About 50% of
beneficiaries felt they benefited more regularly from the agricultural credit than other activities undertaken (X = 3.27). Respondents claimed that many of the trainings given and inputs provided were not regular. Most
programme beneficiaries agreed that their participation in the programme positively enhanced their living
standards in areas such as farm expansion (X =3.49), improved household feeding (3.44) among others. A
grand mean satisfaction index of 3.05 indicated general satisfaction. It was recommended that the programmes
be adopted to transform agriculture in Edo State in line with the Agricultural Transformation Agenda because
of its effect on the livelihood of beneficiaries
Keywords: Perception, beneficiaries, community-based, natural resource, management,
INTRODUCTION According to Child (2004), natural resources are land, soil, water, air, plants and animals. These things are the natural wealth of the community. The community's livelihood depends on protecting these natural resources and using them wisely otherwise there will be nothing left for future generations. Thakadu (2005) noted that Natural resource management refers to the management of natural resources such as land, water, soil, plants and animals, with a particular focus on how their management affects the quality of life for both present and future generations. Management on the other hand in the context of this study, refers to how local people use an existing Community Based Organization (CBO) or form new ones to develop plans to protect their natural resources and to use them wisely. The organization works to earn the trust of the community while the community recognizes the organization as the legitimate body that represents their interests and that they can partner with. According to Bond, Davis, Nott, and Stuart-Hill (2006), Community Based Natural Resources Management (CBNRM) is an approach to the management of land and other natural resources that are relevant to, and have the potential to provide solutions to some of the problems found within the community. CBNRM is based on the rationale that “community empowerment, which manifests itself through providing communities with legal rights to the sustainable use of wildlife on communal lands, would gradually lead to
community "ownership" in conservation management” (Schuerholz and Baldus, 2007). CBNRM approaches may be used to summarize a wide range of participatory development methods in which the active involvement of the people is sought in activities that affect their well-being (Aslin and Brown, 2004). The author notes further that CBNRM has 3 major goals namely, to: improve the livelihoods and quality of life of local people, and help reduce rural poverty; wisely use and conserve natural resources and ecosystems; and empower rural communities to make their own decisions about the wise use of their natural resources. These goals of CBNRM will encourage the use of land and other natural for local food production which is one of the things Agricultural Transformation Agenda seeks to achieve. Community Based Natural Resource Management (CBNRM) is the local management of natural resources to achieve local and national economic development and long-term conservation of those resources. CBNRM was developed in the early 1970s as a response to evidence that “command-and-control” methodologies for natural resource conservation were politically, socially, economically, and environmentally unsustainable. Many governments were resource poor in financial and human terms to tackle the natural resource degradation (Johnson, and Erdmann, 2006). Empowering local people to manage their natural resources emerged as a superior approach. In Africa, wildlife and forest management involving

Nigerian Journal of Rural Sociology Vol. 15, No. 2, March 2015
8
communities has long been practised. In Latin America, fragmented protected areas were consolidated into landscape-level corridors including inhabited lands (IFAD, 2006). By the 1980s, the more generic term CBNRM began to be applied to these trends. Bilateral development agencies supported CBNRM field programs, as did multilateral finance institutions (especially the World Bank) and private foundations such as Ford Foundation. USAID remains by far the largest supporter of CBNRM, with nearly US$500 million invested (Murphree, 2000, IFAD, 2006). Edo State has benefited from the IFAD supported CBNRMP but the question is whether this programme has by any means affected the beneficiaries positively. In this new era of the Nigerian Agricultural Transformation Agenda (ATA), has this community-based programme satisfied the beneficiaries for such an approach to be used as a means of achieving the desired transformation in agriculture? The specific objectives of the study were to: 1. describe the socio-economic characteristics of
beneficiaries in Edo State; 2. identify enterprises/economic activities
supported by the CBNRM programme; 3. ascertain the beneficiaries’ observation on the
effect of the programme on their livelihood; 4. determine beneficiaries’ satisfaction with the
benefits from the programme. METHODOLOGY The study was carried out in Edo State. The State lies on 05 44 N and 07 34 N latitudes, 05 4 E and 06 45 E longitudes of the Greenwich meridian. It is bounded in the East by River Niger, in the West by Ondo State, in the South by Delta State and in the North by Ekiti and Kogi States. It occupies an area of 19,283.9 square kilometers with a population of 3,218,332 made up of 1,640,461 males and 1,577,871 females by the 2006 population census (National Population Commission , 2006). The State is divided into three (3) agro-ecological zones namely Edo north, Edo central and Edo south by Edo ADP delineation and 18 local government areas (Edo State government, 2013; Erie, 2007). The climate of the State is tropical marked by two distinct seasons; the dry and rainy seasons. The vegetation in the State is characterized by swamps along the coast to evergreen forests and savannah in the north. Common food crops grown in the State are cassava, yam, maize, rice and plantain, and rubber and oil palm are the major tree crops in the State. This study focused on beneficiaries of the IFAD-CBNRM programme. It encompassed the enterprises supported by the programme as well as the beneficiaries’ perception of the effect of CBNRMP on their livelihood. The study was
limited to communities in Edo State where the CBNRM Programme is being implemented. Sampling procedure and sample size - Multistage sampling procedure which incorporated the purposive and the simple random sampling techniques was used in this study. CBNRMP programme operates in the three agro-ecological zones delineated by Edo ADP, which explains the selection of the three zones: namely Edo South, Edo Central and Edo North zones. The first stage was to purposively select two Local Government Areas from each of the three agro-ecological zones based on the concentration of CBNRM programme activities in the local government areas. The selected LGAs were Esan West, Esan South East, Uhunmwode, Orhionmwon, Etsako Central and Akoko-Edo. The second stage involved the random selection of two communities from each LGA and the selected communities included Ebute-Ujiogba, Urohi, Okhuesan, Emu-Nekhua, Okhour, Idudolor, Emuhun, Evbohuan, Udochi, Ugbatto, Uneme-Erhunrun and Ikiran-ile. Thirdly, two of the most dominant CBNRMP farmer groups, as defined by their enterprise/activities and membership size, were purposively selected from the list of activities for each community. A total of 24 farmer groups were thus sampled. At the last stage, proportional random sampling was used to select 35% of members of each group from the total number of beneficiaries. The list of beneficiaries was obtained from the CBNRM Programme office. A total of 111 CBNRM members were sampled. However, only 82 responses were used for final data analysis due to non-response and incomplete responses. Data collection methods - Structured questionnaire and interview systems were used to collect the primary data. The instrument consisted of open and close-ended questions. The closed ended questions provided limited options for the respondents to fill while the open-ended questions allowed respondents to give their response to questions they may be asked by the researcher. The researcher personally administered the structured questionnaire and interview respondents alongside trained enumerators. Perception of CBNRMP project scheme - Respondent’s perception of CBNRM programme was measured on a 5-point Likert scale. The following range applied: Strongly Agree (5); Agree (coded 4); undecided (3); Disagree (coded 2); and Strongly Disagree (coded 1). This was done by asking respondents to indicate the level of agreement with the question items as contained in the questionnaire. Decision on respondents’ perception was based on an average score of 3.00 computed as follows: [5+4+3+2+1]/5. Similar approach has been used by Owusu (2012), in computing the weighted mean of Likert scale items.
Nigerian Journal of Rural Sociology Vol. 15, No. 2, March 2015
9
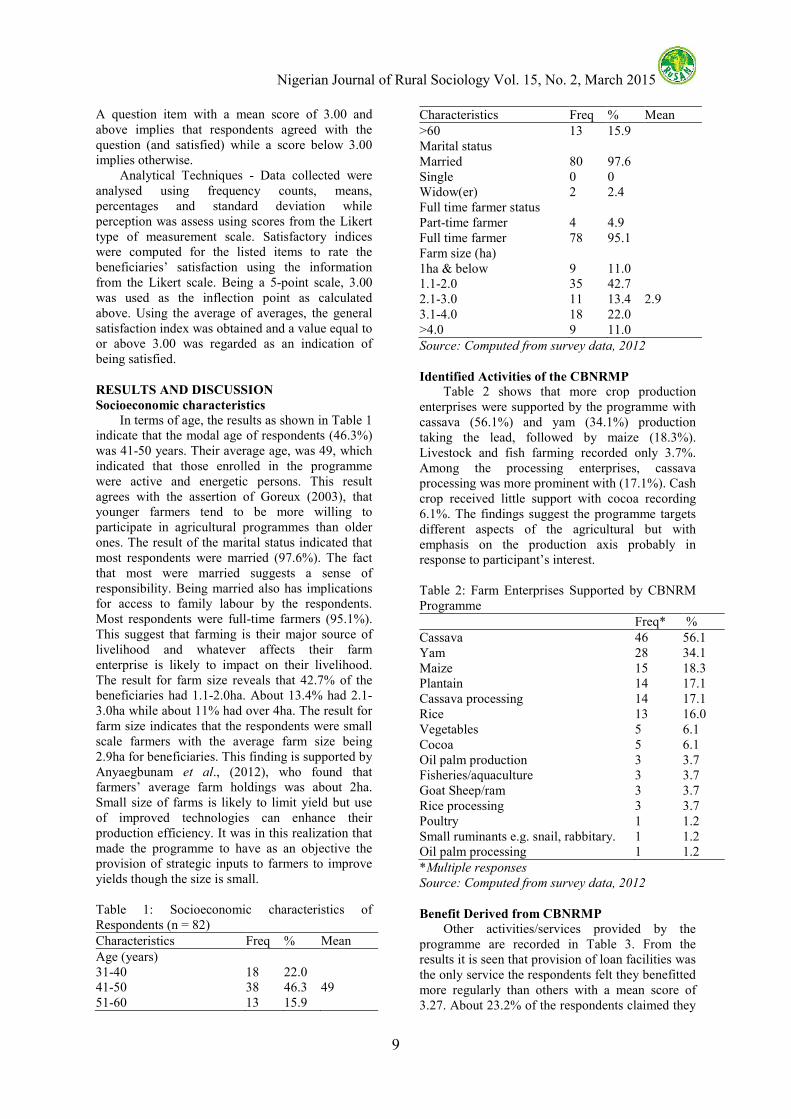
A question item with a mean score of 3.00 and above implies that respondents agreed with the question (and satisfied) while a score below 3.00 implies otherwise. Analytical Techniques - Data collected were analysed using frequency counts, means, percentages and standard deviation while perception was assess using scores from the Likert type of measurement scale. Satisfactory indices were computed for the listed items to rate the beneficiaries’ satisfaction using the information from the Likert scale. Being a 5-point scale, 3.00 was used as the inflection point as calculated above. Using the average of averages, the general satisfaction index was obtained and a value equal to or above 3.00 was regarded as an indication of being satisfied. RESULTS AND DISCUSSION
Socioeconomic characteristics
In terms of age, the results as shown in Table 1 indicate that the modal age of respondents (46.3%) was 41-50 years. Their average age, was 49, which indicated that those enrolled in the programme were active and energetic persons. This result agrees with the assertion of Goreux (2003), that younger farmers tend to be more willing to participate in agricultural programmes than older ones. The result of the marital status indicated that most respondents were married (97.6%). The fact that most were married suggests a sense of responsibility. Being married also has implications for access to family labour by the respondents. Most respondents were full-time farmers (95.1%). This suggest that farming is their major source of livelihood and whatever affects their farm enterprise is likely to impact on their livelihood. The result for farm size reveals that 42.7% of the beneficiaries had 1.1-2.0ha. About 13.4% had 2.1-3.0ha while about 11% had over 4ha. The result for farm size indicates that the respondents were small scale farmers with the average farm size being 2.9ha for beneficiaries. This finding is supported by Anyaegbunam et al., (2012), who found that farmers’ average farm holdings was about 2ha. Small size of farms is likely to limit yield but use of improved technologies can enhance their production efficiency. It was in this realization that made the programme to have as an objective the provision of strategic inputs to farmers to improve yields though the size is small. Table 1: Socioeconomic characteristics of Respondents (n = 82) Characteristics Freq % Mean Age (years) 31-40 18 22.0 41-50 38 46.3 49 51-60 13 15.9
Characteristics Freq % Mean >60 13 15.9 Marital status Married 80 97.6 Single 0 0 Widow(er) 2 2.4 Full time farmer status Part-time farmer 4 4.9 Full time farmer 78 95.1 Farm size (ha) 1ha & below 9 11.0 1.1-2.0 35 42.7 2.1-3.0 11 13.4 2.9 3.1-4.0 18 22.0 >4.0 9 11.0 Source: Computed from survey data, 2012
Identified Activities of the CBNRMP
Table 2 shows that more crop production enterprises were supported by the programme with cassava (56.1%) and yam (34.1%) production taking the lead, followed by maize (18.3%). Livestock and fish farming recorded only 3.7%. Among the processing enterprises, cassava processing was more prominent with (17.1%). Cash crop received little support with cocoa recording 6.1%. The findings suggest the programme targets different aspects of the agricultural but with emphasis on the production axis probably in response to participant’s interest. Table 2: Farm Enterprises Supported by CBNRM Programme Freq* % Cassava 46 56.1 Yam 28 34.1 Maize 15 18.3 Plantain 14 17.1 Cassava processing 14 17.1 Rice 13 16.0 Vegetables 5 6.1 Cocoa 5 6.1 Oil palm production 3 3.7 Fisheries/aquaculture 3 3.7 Goat Sheep/ram 3 3.7 Rice processing 3 3.7 Poultry 1 1.2 Small ruminants e.g. snail, rabbitary. 1 1.2 Oil palm processing 1 1.2 *Multiple responses
Source: Computed from survey data, 2012
Benefit Derived from CBNRMP
Other activities/services provided by the programme are recorded in Table 3. From the results it is seen that provision of loan facilities was the only service the respondents felt they benefitted more regularly than others with a mean score of 3.27. About 23.2% of the respondents claimed they

Nigerian Journal of Rural Sociology Vol. 15, No. 2, March 2015
10
received regular training on seed (cassava) multiplication while 15.9% received regular training on cassava cropping technology. About 8% were trained regularly on agro-chemicals. Fewer received training on processing and mill operations/maintenance. Other services include input provision, vaccination of small ruminants and awareness campaign. In terms of input provision, 22% got farm implements (e.g. wheel barrows, sprayers), 11% benefitted from agro-chemicals (e.g. fertilizers and herbicides) while 9.8% got rice planting materials regularly. Very few respondents benefited from services such as establishment of processing mill (and farm input store as well as animal vaccination. An explanation for this could be because very few respondents engaged in this under the proramme as indicated in Table 2. The major facility enjoyed by the beneficiaries includes loan with a mean score of 3.27. About 22% received regular information on agricultural issues from the programme facilitators; 12.2% received some adult literacy training, 13.4% went on regular study/field tours, 12.2% claimed they were regularly linked to farm input suppliers while only 3.7% were regularly linked to potential markets by the programme facilitators. The general results show that the beneficiaries do not enjoy regular services from the programme. Although interview with respondents revealed that some of the services such as input provision and training services were one-off activities. Despite this the results suggest that some other activities were not regularly provided such as input supplies and market linkages including agricultural information supply. In general the results indicate that most of the activities were agriculture-based. Table 3: Benefit Derived from CBNRMP (n = 82) Activities/services Very
regular Regular Undecided Rarely Not at all Total
% % % % % Mean score
SD
A. Training Seed (cassava) multiplication 4.9 23.2 1.2 4.9 65.9 1.96 1.44 Cassava cropping technology 4.9 15.9 1.2 4.9 73.2 1.74 1.33 Seed yam multiplication (yam mini sett technique)
6.1 12.2 3.7 2.4 75.6 1.71 1.33
Agro-chemicals application 9.8 08.5 1.2 0.0 80.5 1.67 1.40 Plantain production 3.7 08.5 0.0 3.7 84.1 1.44 1.10 Operating and maintenance of processing mills
2.4 06.1 0.0 0.0 91.5 1.28 0.93
Bore-hole operation and maintenance 0.0 04.9 1.2 0.0 93.9 1.17 0.68 Fisheries/aquaculture 0.0 03.7 1.2 0.0 95.1 1.13 0.60 Vegetable production 0.0 02.4 0.0 1.2 96.3 1.09 0.48 B. Input Provision Implements e.g. Cutlass, hoes 1.2 22.0 2.4 0.0 74.4 1.76 1.31 Farm chemicals (fertilizers) 1.2 11.0 1.2 2.4 84.1 1.43 1.04 Planting materials for rice production 0.0 09.8 1.2 3.7 85.4 1.35 0.92 Planting materials for vegetable production 0.0 04.9 0.0 0.0 95.1 1.15 0.65 Fingerlins for aquaculture 1.2 02.4 1.2 0.0 95.1 1.15 0.67

Nigerian Journal of Rural Sociology Vol. 15, No. 2, March 2015
11
Activities/services Very regular
Regular Undecided Rarely Not at all Total
% % % % % Mean score
SD
Planting materials for poultry production 0.0 01.2 0.0 0.0 98.8 1.04 0.33 C. Services Establish farm input store 1.2 04.9 1.2 0.0 92.7 1.22 0.80 Vaccination of small ruminants 0 02.4 4.9 0.0 92.7 1.17 0.62 Establish cassava processing mill 1.2 01.2 1.2 1.2 95.1 1.12 0.60 D. Miscellaneous Loan facility 15.9 50.0 1.2 11.0 22.0 3.27* 1.44 Awareness creation 8.5 22.0 2.4 2.4 64.6 2.07 1.53 Adult literacy 6.1 12.2 1.2 4.9 75.6 1.68 1.31 Study tours 2.4 13.4 3.7 1.2 79.3 1.59 1.20 Linkages to farm input supplier 0.0 12.2 4.9 8.5 74.4 1.55 1.04 Market linkages for farmers 0.0 03.7 4.9 7.3 84.1 1.28 0.72
*Regular (mean > 3.00); Source: Computed from survey data, 2012
Beneficiaries’ Perception and Satisfaction
Table 4 shows respondents perception of the effect of the IFAD-CBNRM programme on their standard of living. The results revealed that the programme had affected them in several areas especially farm business expansion with a mean score of 3.49, improved household feeding (3.44), purchase of farm inputs (3.26) and educational training of children/dependants (3.20) as well as being able to afford better health care (3.02). others were better clothing, provision of better home
furniture, provision of transport facilities and provision of good electronics. This finding agrees with that of Rozwadowska (2011), who noted that CBNRM programme helps to improve livelihoods of rural households in the areas of living conditions and health as a direct result of enhanced productivity and income. The over-all satisfaction index was 3.05 which indicates that the beneficiaries were generally satisfied with the programme.
Table 4: Perceived Effect of IFAD-CBNRMP Intervention Programme on Standard of Living and satisfaction Indices (n = 82) Welfare indicators
Strongly agree Agree Undecided Disagreed Strongly Disagreed
Freq % Freq % Freq % Freq % Freq % Sat index SD Expansion of farm/business
26 31.7 27 32.9 08 9.8 3 3.7 18 22.0 3.49* 1.52
Improved household feeding
18 22.0 36 43.9 08 9.8 4 4.9 16 19.5 3.44* 1.41
Able to purchase farm inputs
15 18.3 34 41.5 11 13.4 1 1.2 21 25.6 3.26* 1.46
Educational training of Children
15 18.3 24 29.3 24 29.3 0 0.0 19 23.2 3.20* 1.39
Improved household health (i.e. able to afford medical bills)
11 13.4 25 30.5 18 22.0 11 13.4 17 20.7 3.02* 1.35
Able to afford better clothing for family
13 15.9 21 25.6 20 24.4 6 7.3 22 26.8 2.96* 1.44
Improvement in home furniture
08 09.8 20 24.4 19 23.2 14 17.1 21 25.6 2.76* 1.34
Purchase/maintenance of transportation facilities
07 08.5 20 24.4 21 25.6 8 9.8 26 31.7 2.68* 1.37
Purchase of electronics
05 06.1 23 28.0 20 24.4 9 11.0 25 30.5 2.68* 1.33
*Agreed (mean > 3.00) Grand mean score =3.05
Source: Computed from survey data, 2012
CONCLUSION AND RECOMMENDATIONS
Nigerian Journal of Rural Sociology Vol. 15, No. 2, March 2015
12
The result of the study showed that the Community-Based Natural Resource Management Programme (CBNRMP) had positive effect on small scale farmers in Edo State since it improved the standard of living of beneficiaries in the State. Based on the results of the study the following recommendations were made: • There may be need to expand the programme
to cover more farmers given the positive effect of the programme on their standard of living.
• There is need to review the regularity of other activities for the beneficiaries just like the loan facilities
• The programme should be made more gender sensitive by incorporating more females as the study showed few women beneficiaries.
• Having impacted so much on agriculture, it is recommended that Community-based programmes be used as one of the means to transform agriculture in Nigeria in line with the agricultural transformation agenda.
REFERENCES Anyaegbunam, H.N., P.O. Nto, B., C Okoye and
T.U. Madu (2012). Analysis of determinants of farm size productivity among small- holder cassava farmers in south east agro ecological zone, Nigeria.American Journal of Experimental
Agriculture 2(1). 74-80, 2012 Aslin, A.H. and V.A. Brown (2004).Towards whole
of community engagement: a practical
toolkit. Murray-Darling Basin Commission, Canberra. 79pp
Bond, I., A. Davis, C. Nott, K. Nott and G. Stuart-Hill (2006).Community–based Natural Resource Management manual.Wildlife Management Series.Funded by the Norwegian Agency for Development Cooperation (NORAD) through WWF. 77p
Child, B. (2004).Principles, practice, and results of CBNRM in Southern Africa. Natural resource as community assets: Lessons from two continents. A report of CBNRM in Botswana. 36pp
Edo State Government (2013).Edo State Geography.Official website of the Edo State Government. http://www.edostate.gov.ng/geography
Erie, A.P. (2007).Privatization and commercialization of agricultural extension services in Edo State, Nigeria.Ph.D thesis: Department of
Agricultural Economics and Extension, Ambrose Alli University, Ekpoma, Nigeria.
IFAD (2006).Community-based natural resource management.Agriculture, Water Management and Rural Infrastructure, Technical Advisory Division, Programme Management Department, Rome. 51pp
Goreux L. M. (2003).Cotton Producers in Africa
vis US and EU Subsidies. Prelude to the Cancun Negotiations. European Parliament: Brussels, pp. 4-10.
Johnson, T.R. and T.K. Erdmann (2006).CBNRM: Defining “4G” Success. Innovation in
action.DAI ideas.3(2). 1-4 Murphree, M.W. (2000). Community based
conservation: old ways, new myths and enduring challenges. “African Wildlife Management in the New Millennium conference. Mweka, Tanzania, December 2000.
Owusu, A. (2012). Effects of Motivation on Employee Performance: a case study of Ghana commercial bank, Kumasi Zone. A Thesis submitted to the Institute of Distance Learning, Kwame Nkrumah University of Science and Technology. Dept. of Business Administration, KNUST. Pp 99-203
Rozwadowska, A. (2011). Community-based natural resource management (CBNRM) affiliated with BC's Protected Area System: Costs and benefits of Conservancies to First Nations communities and PA governance. PAPR Working Paper No. 7. Retrieved from the Protected Areas and Poverty Reduction Canada-Africa Research and Learning Alliance: http://www.papr.co.ca/index.php?p=1_25_Papers. Accessed 28th of August 2012
Schuerholz, G., and Baldus, R.D. (2007). Community based wildlife management in support of transfrontier conservation: the Selous-Niassa and Kawango Upper Zambezi challenges. Parks, Peace and Partnerships Conference
Thakadu, O.T. (2005). Success factors in community based natural resources management in Northern Botswana: Lessons from practice. Natural Resources
Forum. 29(3).199 – 212

Nigerian Journal of Rural Sociology Vol. 15, No. 2, March 2015
13
GENDER ANALYSIS OF PERCEIVED EFFECTIVENESS OF ELECTRONICS WALLET IN
FERTILISER DISTRIBUTION AMONG VEGETABLE FARMERS IN EKITI STATE NIGERIA 1Ogunjimi, S. I., 2Ajala, A. O. and 1Alabi, O. O.
1Department of Agricultural Economics and Extension, Federal University Oye Ekiti, Ekiti state, Nigeria 2Department of Agricultural Economics and Extension, Landmark University, Omu-Aran, Kwara State, Nigeria
Email: [email protected], [email protected], ABSTRACT
This study was conducted to compare the effectiveness of e-wallet in fertiliser distribution on gender basis
among vegetable farmers in Ekiti State, Nigeria. Four Local Government Areas (LGAs) were selected for the
study because of the present of registered farmers. Three communities were randomly selected from each LGAs.
In all, 120 registered vegetable farmers were selected using multistage sampling procedure. Descriptive and
inferential statistics were used to analyze the data at p=0.05. Results show that 45.6% were Male Vegetable
Farmers (MVF), while 55.4% were Female Vegetable Farmers (FVF). Mean age of MVF was 50.6 ± 10.2 years
while that of MVF was 42.6 ± 9.5 years. Also, 63.3% of MVF had formal education compared to 55.8% of FVF.
Majority of registered FVF (73.4%) and MVF (82.4%) got the information about fertiliser procurement at
subsidised rate on their phone. However, only 42.0% of FVF procured fertilisers through lay down process of e-
wallet whereas, majority of the MVF (57.3%) claimed that e-wallet is moderately effective in procurement of
fertilisers. There was significant difference (p= 0.01, t=3.75) in the level of use of e-wallet between MVF and
FVF. Women should be given priorities in the design and implementation of electronic wallet introduced by the
Nigerian government. More so, the process of procurement should be made less cumbersome to allow easy
distribution of fertilisers to farmers which will allow the farmers to benefit from available subsidies and thereby
reducing corruption in Nigeria’s fertiliser distribution system.
Keywords: E-wallet, vegetable farmers, fertiliser distribution INTRODUCTION
Nigeria is endowed with a lot of agricultural potentials. Majority of Nigerian farmers are small holders that cultivate on a small hectare of land. These are the people that produce majority of the food consumed by the populace. Most of their farms are characterized by small size, low input and low output (Adebo, 2014). Adebo, 2014 stressed further that access to inputs by these farmers is grossly inadequate. Research has also showed that farmers in Nigeria apply less than 20kg fertiliser nutrients per hectare compared to the world average of 100kg. It was also established that farmers in Nigeria use less than 5% improved seeds (The Growth Enhancement Support Scheme (GESS) Monitoring Report, 2012). The agro-economy in Nigeria has huge potentials and fertiliser plays a significant role in harnessing this opportunity in crop production (GESS monitoring report, 2012). For many years, agro inputs supply and distribution in Nigeria has been limited by ambiguity in government policy regarding production, liberalization, regulation and subsidy provision. Subsidy administration has been fraught with so many inefficiencies with farmers claiming that the inputs do not get to them at the required time and at recommended rates. Although, Governments at the Federal and State levels are spending a lot of money on farm inputs which were not reaching the intended beneficiaries (small holder farmers) and thus, had no significant impact on the national food output. Adesina (2013) asserts that in the past four decades, despite ever increasing fertiliser subsidies by the government, no more than 11% of smallholder farmers received
subsidised fertiliser from the government. The corruption in the system was massive due to the government’s direct procurement and distribution of fertilisers. To address this, the Federal Government took a decisive action from the 2012 farming season by opting out of direct procurement and distribution of inputs and instead instituted the Growth Enhancement Support Scheme (GESS) designed as a component of the Agricultural Transformation Agenda of the Federal Government (ATA) aimed at delivering subsidised farm inputs to farmers through an electronic wallet. An e-wallet could be defined as an efficient and transparent electronic device system that makes use of vouchers for the purchase and distribution of agricultural inputs (Ezeh, 2013; Adesina, 2013). An electronic wallet system developed using mobile phones, to deliver seeds at no cost and 50% subsidy on fertilisers, for a maximum of two bags, to farmers. Electronic vouchers for seeds and subsidised fertilisers were sent to farmers on their mobile phones. The vouchers were then used as cash to redeem farm inputs from registered agro-dealers across the country. Under the Scheme, an accredited farmer would receive agro inputs allocation through an e-wallet that hosts unique voucher numbers sent to his or her phone and go to an accredited agro dealer to redeem his inputs. The criteria for farmer’s participation include: farmers being above 18 years old; have participated in a survey authorized by the government to capture farmers personal detailed information; must own a cell phone with a registered SIM card and have at least sixty naira

Nigerian Journal of Rural Sociology Vol. 15, No. 2, March 2015
14
credit in the cell phone (Fadairo et al., 2015). This had led to improvements in agro inputs distribution and as well as consequent improvement in crop and agricultural productivity; and profitability for the farmers. Ownership and use of mobile phones among the rural farmers has continued to increase thereby increasing the chances of farmers in obtaining information on the fertiliser distribution directly and successes recorded in the scheme. Mobile phone applications usage in the Sub-Sahara Africa has increased tremendously particularly in countries like Cote d’Ivoire, Ghana, Nigeria, Mali, Rwanda, Tanzania, Zambia, Kenya, Mozambique, Uganda, Malawi, Mozambique and Madagascar (Osadebamwen and Ideba, 2015) The e-wallet system is farmer friendly as it allows farmers to conduct transactions in their local languages. To date, approximately 23 million e-wallet transactions have been completed by farmers on their mobile phones with majority in local Nigerian languages. For example, 45% of transactions were in Hausa, 25% were in English, 17% were in Yoruba, 12% were in pidgin while 1% was in Igbo.(Federal Ministry of Agriculture, 2014). The farmers that benefited from fertiliser distribution are the farmers whose names are on the farmers register at redemption centres. Despite the successes recorded it might not be completely free from constraints such as network failure, gender issues, transportation and others. For more than two decades, gender issues on programme implementation have been of the vocal point of policy makers in agricultural development. Since the 1990s, policymakers and development practitioners have highlighted the critical importance of gender in the implementation, evaluation, and effectiveness of programs across a range of social and economic sectors (Amberet al; 2010). Hence, this study assessed gender analysis of effectiveness of electronics wallet in fertiliser distribution among vegetable farmers in Ekiti State Nigeria. Specific objectives of the study were to examine the usage of the E-wallet as an effective mechanism for administering inputs subsidy; assess the farmers’ knowledge level of operational mechanism of e-wallet; analyse the effectiveness of usage of e-wallet for procurement of fertiliser on gender basis; assess the perception of the farmers about the e-wallet usage; and identify the constraints associated with the use of e-wallet. The hypotheses of the study were stated as; there is no significant relationship between the socioeconomic characteristics such as age, education income, extension contract and perceived effectiveness of e-wallet usage in procurement fertilisers; there is no significant difference between MVF and FVF in the usage of e-wallet in procurement of fertiliser
METHODOLOGY
The study was carried out in Ekiti State, Nigeria. Ekiti State is one of the six states created on 1st October 1996 which has 16 Local Government areas. It is located between longitudes 40 51 and 50 451 East of the Greenwish meridian and latitudes 70 151 and 80 51 north of the Equator. It lies south of Kwara and Kogi State, East of Osun State and bounded by Ondo State in the East and in the south.. By 2011 estimated population of Ekiti State was 2,801,200. The State enjoys a tropical climate with two distinct seasons. These are the rainy season (April - October) and the dry season (November - March). Temperature ranges between 210 and 280C with high humidity. Tropical Forest exists in the south, while guinea savanna predominates in the northern peripheries Primary data were collected from four purposively selected Local Government Areas (LGAs) being the major vegetable producing areas in the State. Three communities were randomly selected from each LGA. Ten vegetable farmers were selected from each of the 12 communities using simple random sampling technique making a total of 120 respondents. Mean, standard deviation, frequencies, percentages correlation coefficient and t-test analysis were used for data analysis. In order to determine the effectiveness of e-wallet usage among vegetable farmers, four point likert scales was used. Farmers were asked to indicate if the usage of e-wallet is very effective, effective, rarely effective, not effective in fertiliser distribution and scores of 3, 2, 1 and 0 were assigned, respectively. Farmers were given a 5 item statements structured to determine the effectiveness of e-wallet in the distribution of fertiliser among vegetable farmers which include knowledge about identification of number, the activation of numbers, network, time required for the processing of the voucher for the purchase of the fertilisers, cost of procurement and availability of inputs. Effectiveness index was the sum of the scores on all the 5 statements per farmer. The maximum score was 15 while the minimum was 0. To know the level of effectiveness total score for each respondent was grouped into 3 categories viz: high, low and medium. The high was placed within mean + standard deviation range, the low within the mean minus standard deviation range, while the medium within mean ± standard deviation range. Usage of e-wallet was measured by asking the respondents to indicate whether they have purchased fertilisers through the use of e-wallet or not. Usage of e-wallet was measured using percentage score. The Perception of vegetable farmers to the e-wallet platform was measured using a 5-point likert scale of strongly agree (SA), agree (A), undecided (U), disagree (D) and strongly disagree (SD) in which scores of 5, 4, 3, 2, and 1 were awarded to positive statements and the reverse for negative statements. The maximum score was 45 while the minimum score was 9. The

Nigerian Journal of Rural Sociology Vol. 15, No. 2, March 2015
15
indices of measuring perception were the summation score of the scores per respondent. Mean score was computed from the farmers’ perceptual scores and mean ± standard deviation was used to categorise the farmers into having high, moderate and low perception.
RESULTS AND DISCUSSION
Respondents’ socioe-conomic characteristics
The results of socioeconomic characteristics of the respondents in Table 1 shows that mean age of both male and female vegetable farmers were 44.7 years. Mean age of FVF was 42.3 years ± 11.9 while that of MVF was 46.6 years ± 9.6 years. Majority of MVF (68.3%) and FVF (70.4%) were in the productive age within 30-60years in which they could participate actively in farming operation However, more females (53.2 %) than males (46.8%) were into vegetable production in the study area. Variations in the ratio of male to female vegetable farmers might be due to the fact that large numbers of males were into tree crop
production such as cocoa, oil palm and other arable crops such as maize and cassava. Majority 82.2% of MVF acquired the basic primary education compared to 68.8% of FVF. Male vegetable farmers were more educated than female vegetable farmers, which might be as a result of the preference the society gave to male education than female in the past. However, acquiring the primary education could assist the farmers on the techniques of mobile phone usage and knowledge of activation of numbers. Both male and female vegetable farmers had low extension contact on the e-wallet usage for the process of acquiring fertilisers and seedlings. Income available to a farmer determines his or her ability to purchase farm inputs. Majority of the MVF (71.4%) and FVF (81.3%) realised low income per annum from the sale of vegetable which might be as a result of high cost of production, inadequate technical know-how and drought, and smallholding.
Table 1 Distribution of vegetable farmers according to socio-economic characteristics Variables MVF (56) FVF (64) Frequency % Mean/std Frequency % Mean/std Age Less than 30 7 12.5 11 17.5 31-60 39 69.6 46.6/ 9.6 43 67.2 42.3/ 11.9 61 and above 10 17.9 10 15.6 Sex 56 53.3 64 46.7 Level of education Never 10 17.9 20 31.3 Primary school 16 28.6 22 34.4 Secondary school 24 42.9 18 28.1 Tertiary 6 10.7 4 6.3 Extension contact in the
last one year
Never 15 26.8 31 48.4 1-4 34 60.7 2.8/1.6 28 43.8 1.8/0.7 5-8 6 10.7 5 7.8 9 and above 1 1.8 0 0.0 Income/annum <50,000 40 71.4 52 81.3 51,000-100,000 16 28.6 64,342/
12,344 12 18.7 61,566/
10,100 Source: Field Survey, 2015
Knowledge of the operational mechanism of e-
wallet In order to get fertiliser or seeds under the scheme, farmers first have to activate their numbers. Farmers were asked to indicate their knowledge level about the activation of the voucher number that was sent to their phone numbers in order to access the procurement of fertiliser requested for. Result in Table 2 shows that majority (60.9%) of the FVFs interviewed had low knowledge on how to activate their numbers,
whereas above average (55.3%) of MVFs were moderately knowledgeable about activation of number. Furthermore, the specific type of fertiliser to be purchased by farmers has identification voucher number. For example farmers that want to buy NPK and Urea had to dial specific numbers, and then enter their voucher numbers. A similar procedure was required for redeeming seeds. Below average (42.9%) of MVFs did not know how to identify voucher numbers for various types of fertiliser needed, while as high as 56.3% of the

Nigerian Journal of Rural Sociology Vol. 15, No. 2, March 2015
16
FVFs did not know the numbers to dial for procurement of fertiliser. Furthermore, 55.3% of MVFs were knowledgeable about the cost of inputs while majority 62.5% of FVFs were moderately knowledgeable about the cost of inputs. Both MVFs (60.7%) and FVFs (50.0%) were moderately knowledgeable about time when the inputs are available. The disparity between male and female vegetable farmers knowledge level might be due to
disparity between male and female level of education. Generally, all farmers supposed to be knowledgeable about the activation of numbers which was not so from the results of the interview conducted. Farmers who said they did not know how to activate numbers, and the procedures for redeeming inputs sought the assistance of family members and other farmers.
Table 2: Distribution of vegetable farmers based on their knowledge level of usage of e-wallet N=120 Vegetable farmers knowledge level
MVF F
% FVF F
%
Knowledge level about the activation of the voucher number
Highly knowledgeable 3 5.4 2 3.1 Moderately knowledgeable 31 55.3 12 18.8 Low knowledge 17 30.4 39 60.9 Not Knowledgeable 5 9.0 11 17.2 Level of Knowledge of farmers about identification of voucher numbers for various types of fertiliser needed.
Highly knowledgeable 3 5.4 0 0.00 Moderately knowledgeable 15 26.8 12 18.8 Low knowledge 14 25.0 16 25.0 Not knowledgeable 24 42.9 36 56,3 Time required for the processing of the voucher for the purchase of the fertilisers.
Highly knowledgeable 6 11.1 2 3.1 Moderately knowledgeable 15 26.8 13 20.3 Low knowledge 27 48.2 15 23.4 Not knowledgeable 8 17.9 34 53.1 Cost of procurement of fertilisers Highly knowledgeable 31 55.3 3 4.7 Moderately knowledgeable 10 17.9 40 62.5 Low knowledge 9 16.1 12 18.8 Not knowledgeable 6 10.7 9 14.1 Availability of various types of fertiliser Highly knowledgeable 7 12.5 3 4.7 Moderately knowledgeable 34 60.7 32 50.0 Low knowledge 13 23.2 21 32.8 Not knowledgeable 2 3.6 8 12.5 Source: Field survey, 2015
Purchase of Fertiliser through the use of e-
wallet Results in Figure 1 indicate that only 40.0% of registered FVFs interviewed said they had purchased fertilisers through the scheme whereas 62.0% of MVFs had so far purchased fertiliser through the use of e-wallets. The main reason for low number of FVFs that purchased fertilisers through e-wallet were the constraints associated with usage of e-wallet such as inadequate knowledge about the activation of numbers, network problem, and inadequate electricity supply high cost of procurement and factor such as time required for the processing of the voucher for the purchase of the fertilisers and non-availability of inputs.
Figure 1: Pie chart showing percentage distribution of farmers that purchased fertiliser through e-wallet.
Gender analysis of the effectiveness of E-wallet
as a mechanism for administering inputs
subsidy
Result in Table 3 shows that above average (53.5%) of FVF adjudged e-wallet of having low

Nigerian Journal of Rural Sociology Vol. 15, No. 2, March 2015
17
level of effectiveness, whereas majority of MVF (57.3%) claimed that e-wallet usage for fertiliser distribution was moderately effective. The factors associated with ineffectiveness as mentioned by the females were the constraints associated with the use of e-wallet such as inadequate technical know-how, high cost of procurement and social factor like suspicions by spouses. Table 3: Distribution of vegetable farmers according to the level of effectiveness of e-wallet usage in Fertilisers distribution n=120 Level of effectiveness
Percentage (MFV)
Percentage (FVF)
High 26.1 15.2 Medium 57.3 31.3 Low 16.6 53.5
Source: Field survey, 2015 Perception of vegetable farmers on the usage of
e-wallet in procurement of fertiliser Table 4 revealed farmers perception of use of e-wallet in descending order with grand mean of 2.5. MVFs perceived e-wallet has been very suitable to access input for farmers (Mean=4.2). This was followed by e-wallet has instilled farmers’ interest in further agricultural programmes (Mean=4.2), e-wallet platform has reduced corruption in input supply (Mean=3.9), e-wallet will blossom more with more commitment from ADP staff and cellulants (mean=3.8) and number of fertilisers supplied are not enough to cater for production (mean=3.6). The study reveals that more farmers will be involved if farmers are been trained about the technicalities involved in e-wallet implementation (Mean=2.5). At the lower ladder of the statement of opinion were: the e-wallet platform has not really reduce racketeering of agro-inputs by different dealers (Mean=2.3), the scheme is only beneficial to selected group of farmers because they are influential(mean=2.3) and too many success noise about e-wallet is truly nothing but propaganda from Government (mean=2.0). The results on the statement of opinion among VVFs reveal that e-wallet has made it possible to access input for farmers (Mean=3.8). This was followed by e-wallet platform has reduced corruption in input supply (Mean=3.9), number of fertilisers supplied are not enough to cater for production (mean=3.8) and e-wallet will blossom more with more commitment from ADP staff and cellulants (mean=3.6). Furthermore VCFs perceived that more farmers will be involved if farmers are been trained about the technicalities involved in e-wallet implementation (Mean=3.4) and all services provided by e-wallet platform are beneficial to individual farmers (Mean=3.0). At the lower ladder of the statement of opinion were: the
e-wallet platform has not really reduce racketeering of agro-inputs by different dealers (Mean=2.1), the scheme is only beneficial to selected group of farmers because they are influential (mean=2.0) and too many success noise about e-wallet is truly nothing but propaganda from Government (mean=1.8).The findings indicated that almost average of the farmers highly perceived the programme in the study areas been effective because of their positive perception about the programme. This suggests that the scheme will fulfil the various promises and prospects accruable, when fully implemented. The findings is in line with Fadairo (2015) that crop farmers had favourable disposition to e-wallet usage and that e-wallet platform has been able to address the problems of corruption in the supply of agricultural inputs, and thereby achieving one of the main aims for which the scheme was launched. Furthermore, majority of the farmers were of the opinion that success would be achieved in the area of sustainable vegetable production if e-wallet is sustained which will have a lot of far reaching effects on food sustainability. Table 4: Statement of opinion on perception of vegetable farmers on the usage of e-wallet in procurement of fertiliser Statement of opinion
Mean MVF
Rank Mean FVF
Rank
E-wallet has been very suitable to access input for farmers
4.2 1st 3.8 2nd
E-wallet platform has reduced corruption in input supply
3.9 2nd 4.0 1st
E-wallet will blossom more with more commitment from ADP staff and Cellulants
3.8 3rd 3.6 4th
The number of fertilisers supply are not enough to cater for production
3.6 4th 3.8 3rd
More farmers will be involved if farmers are been training in technicalities involve in e-wallet implementation
3.5 5th 3.4 5th
All services provided by e-
3.3 6th 3.0 6th
Nigerian Journal of Rural Sociology Vol. 15, No. 2, March 2015
18
Statement of opinion
Mean MVF
Rank Mean FVF
Rank
wallet platform are beneficial to all individual farmers E-wallet platform has not really reduce racketeering of agro-inputs by different dealers
2.3 7th 2.1 7th
Scheme is only beneficial to selected group of farmers because they are influential
2.3 7th 2.0 8th
The too many success noise about e-wallet is truly nothing but propaganda from Government.
2.0 9th 1.8 9th
Source: Field survey, 2015
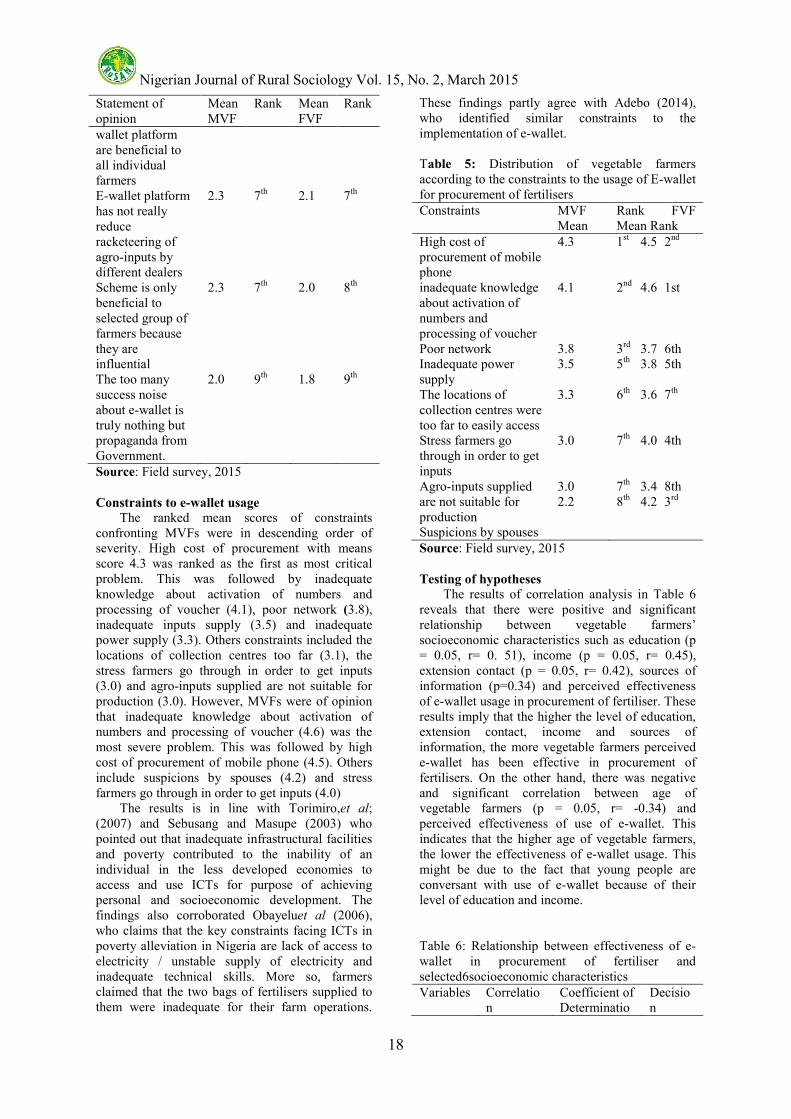
Constraints to e-wallet usage
The ranked mean scores of constraints confronting MVFs were in descending order of severity. High cost of procurement with means score 4.3 was ranked as the first as most critical problem. This was followed by inadequate knowledge about activation of numbers and processing of voucher (4.1), poor network (3.8), inadequate inputs supply (3.5) and inadequate power supply (3.3). Others constraints included the locations of collection centres too far (3.1), the stress farmers go through in order to get inputs (3.0) and agro-inputs supplied are not suitable for production (3.0). However, MVFs were of opinion that inadequate knowledge about activation of numbers and processing of voucher (4.6) was the most severe problem. This was followed by high cost of procurement of mobile phone (4.5). Others include suspicions by spouses (4.2) and stress farmers go through in order to get inputs (4.0) The results is in line with Torimiro,et al; (2007) and Sebusang and Masupe (2003) who pointed out that inadequate infrastructural facilities and poverty contributed to the inability of an individual in the less developed economies to access and use ICTs for purpose of achieving personal and socioeconomic development. The findings also corroborated Obayeluet al (2006), who claims that the key constraints facing ICTs in poverty alleviation in Nigeria are lack of access to electricity / unstable supply of electricity and inadequate technical skills. More so, farmers claimed that the two bags of fertilisers supplied to them were inadequate for their farm operations.
These findings partly agree with Adebo (2014), who identified similar constraints to the implementation of e-wallet. Table 5: Distribution of vegetable farmers according to the constraints to the usage of E-wallet for procurement of fertilisers Constraints MVF
Mean Rank FVF Mean Rank
High cost of procurement of mobile phone
4.3 1st 4.5 2nd
inadequate knowledge about activation of numbers and processing of voucher
4.1 2nd 4.6 1st
Poor network 3.8 3rd 3.7 6th Inadequate power supply
3.5 5th 3.8 5th
The locations of collection centres were too far to easily access
3.3 6th 3.6 7th
Stress farmers go through in order to get inputs
3.0 7th 4.0 4th
Agro-inputs supplied are not suitable for production Suspicions by spouses
3.0 2.2
7th 3.4 8th
8th 4.2 3rd
Source: Field survey, 2015 Testing of hypotheses
The results of correlation analysis in Table 6 reveals that there were positive and significant relationship between vegetable farmers’ socioeconomic characteristics such as education (p = 0.05, r= 0. 51), income (p = 0.05, r= 0.45), extension contact (p = 0.05, r= 0.42), sources of information (p=0.34) and perceived effectiveness of e-wallet usage in procurement of fertiliser. These results imply that the higher the level of education, extension contact, income and sources of information, the more vegetable farmers perceived e-wallet has been effective in procurement of fertilisers. On the other hand, there was negative and significant correlation between age of vegetable farmers (p = 0.05, r= -0.34) and perceived effectiveness of use of e-wallet. This indicates that the higher age of vegetable farmers, the lower the effectiveness of e-wallet usage. This might be due to the fact that young people are conversant with use of e-wallet because of their level of education and income. Table 6: Relationship between effectiveness of e-wallet in procurement of fertiliser and selected6socioeconomic characteristics Variables Correlatio
n Coefficient of Determinatio
Decision

Nigerian Journal of Rural Sociology Vol. 15, No. 2, March 2015
19
(r) n (r2) Age -0.34* 0.12 S Level of education
0.51* 0.26 S
Annual income
0.45* 0.20 S
Extension contact
0.42* 0.18 S
Source: Field Survey, 2015 P< 0.05; S=Significant Data in Table 7 were subjected to t-statistic test. The mean difference between male and female vegetable farmers was found as 3.8 with a t-test
value of 106.06. The results revealed that significant difference existed between male and female vegetable farmers’ on effectiveness of e-wallet in procurement of fertiliser. It implies that MVFs perceived e-wallet as been effective in distribution of fertiliser than FVFs. Comparing the procurement level of the fertiliser through this medium, males procured fertilisers through this medium than females which gave male higher opportunity to be able to measure assessed the effectiveness of e-wallet.
Table 7: Result of t- test for significant difference in selected variables among male and female vegetable farmers Gender No of cases Mean SD SE MD t-test P value
Male Female
56 64
16.4 10.7
4.45 2.01
0.262 0.092
3.8 106.06
0.002
Source: Field survey, 2015 SD = Standard deviation, SE = Standard error, MD = Mean difference CONCLUSION AND RECOMMENDATIONS
Generally both MVFs and MVFs perceived the system of fertiliser using e-wallet effective than the previous system of distributions adopted in the past. Constraints associated with the usage include inadequate knowledge about activation of numbers and processing of voucher, poor network, inadequate inputs supply and inadequate power supply, the locations of collection centres was too far and stress farmers go through in order to get inputs. There was significant different between the effectiveness of e-wallet between MVF and FVF. It is recommended that there should be sensitization programme of the importance and usage of voucher in procurement of fertilisers and other farm inputs. Voucher should be done in languages farmers can easily understand (e.g. pidgin and local languages). Moreso, there is need to develop numbers that will be easy for the farmers to remember and work with. Government should support this programme by recruiting more facilitators and reinforcing the existing ones so as to ensure adequate contact with the farmers. Gender issues need be considered in the designing and implementation of the programme so that they will be able to benefit tremendously in the programme. There is also the need to increase the number of fertilisers allocated to individual farmers. If these recommendations among others are duely followed, the dream of food sustainability will be achieved and the programme will be more effective. REFERENCES
Akinwumi A. (2014) Agricultural Transformation Agenda 2013 Report January 1, 2013 – December 31, 2013 Score Card Federal Ministry Of Agriculture And Rural Development, Nigeria
Adebo G. M. (2014) Effectiveness of e-wallet practice in grassroots agricultural services delivery in Nigeria-a case study of Kwara State Growth Enhancement Support Scheme. Journal of Experimental Biology and Agricultural Sciences, volume2(4):411-417. issn 2320-8694 http://www.jebas.org/wp-content/uploads/2014/09/grace-jebas.pdf. Accessed on 08/09/2015.
Adesina A. (2013) Honorable Minister of Agriculture and Rural Development, Federal Republic of Nigeria, Governor from Nigeria, at the 36th Session of the IFAD Governing Council
Ezeh A. N. (2013) Access and application of information and communication technology (ICT) among farming households of south east Nigeria.Agriculture and Biology Journal of North America. doi: 10.5251/abjna.2013.4.6.605.616
Fadairo O. S., Nathaniel S. O., Adewale M. T. (2015) Attitude of crop farmers towards e-wallet platform of the Growth Enhancement Support Scheme for input delivery in Oke-Ogun area of Oyo state. Journal of Agricultural Informatics 6(2):62-70, journal.magisz.org.
Torimiro, D.O., Eludire A.A., Subair S.K. and Akinjobi, J.A. (2013) Complementing Extension Roles Through Young Animators and ICT usage in sub-saharan Africa: Experiences from Nigeria and Botswana. Association of African University, Ghana pp 4-5
Subusang, S.E.M. and Masupe (2003) ICT development in Botswana: Connectivity

Nigerian Journal of Rural Sociology Vol. 15, No. 2, March 2015
20
for communities. Southern African Journal of information and communication (SAJIC. The Edge Institue/ Research ICT
Africa, Braamfontein, ZA (available:hhtp//link.wits.ac.za/journal/j040I-sebusang-botswana.pdf).

Nigerian Journal of Rural Sociology Vol. 15, No. 2, March 2015
21
EFFECTIVENESS OF VIDEO AS A PATHWAY FOR EXTENSION AGENTS IN DISSEMINATING
RICE CULTIVATION PRACTICES IN OGUN STATE
Sadiq, M. M., Oyelere, G. O. and Oladoyinbo, O. B. Oyo State College of Agriculture and Technology, Igboora.
E-mail: [email protected] ABSTRACT
A comparative analysis of video and extension agent training techniques in disseminating rice cultivation
practices in Ogun State was conducted during the growing season of 2014. Using a multi-stage sampling
procedure, two zones, seven blocks, 19 cells and 72 rice growers were selected. Also, a Quasi-experimental pre
and post test and control design was applied. Data were collected through interview schedule based on
structured questions on the knowledge gained, adequacy of training method and selected socioeconomic
characteristics which were analysed using frequency counts, percentage and t-test. The result showed that
farmers’ rate of adequacy of video and extension agent usage for training in terms of listenership effect had
94.9% and 61.1%; clarity of training message had 94.4% and 52.8%; retrieval of training information had
94.9% and 11.1% respectively. A significant difference exist in the knowledge gained after training between
video and agent taught groups (t= 1.95, P<0.05). The study recommended that video could be used to
disseminate agricultural information in order to alleviate the problems of low extension agents- farmers’ ratio
and promote beneficiary funding of extension services as farmers buy the video tapes.
Keywords: Effectiveness, pathway, extension agents, cultivation practices
INTRODUCTION
Omotayo and Isiaka (2006) reported that video as a medium of disseminating agricultural information for the purpose of training, entertaining, educating, situation analysis and advertising has been practiced in many developing countries in Latin America, Asia and Africa. In Nigeria, video has been used by some extension organisations to stimulate the adoption of technologies by farmers. The video self-training method is innovative and cost effective method of training many farmers quickly with minimal distortion of facts. This method involves packaging agricultural information in videocassette in a culture-specific, farmer-participatory and farmer friendly way video viewing centre. In the absence of the extension agent, the farmers (who have been trained) operate the video cassette player and television, and generate discussion about the subject matter they had watched. Feedback is received by the extension organisation via audio cassette or by personal contact when the extension agent pays his regular visit. The method is a form of distance learning technique. Polson (1991) noted that sixty-nine percent of the producers who borrowed the video specifically named one or more practice changes they adopted as a result of watching it. Several weeks after watching the video, three-fourths of the producers identified additional specific practices they were still considering adopting. Israel and Ingram (1991) reported that the use of videotapes and workbooks would be the available alternative in that farmers who own, or have access to, a video cassette recorder (VCR) would be more likely to participate in a self-study program than those who do not. Similarly, extension offices in metropolitan counties would provide better access because they have more resources (number of copies of tapes,
VCR to use or loan) than offices in non-metropolitan counties. Presently, in Nigeria the presidential initiative on rice seeks to improve rice production through information supply. This is based on the fact that rice production in Nigeria is dominated by small holder farmers with 0.5 – 1.5 hectare per farmer using manual labour for virtually all its operations. Presently over 52 rice varieties with yield potentials of between 2 and 8 tonnes of paddy per hectare and maturity periods of 95-140 days had been developed by both National and International Research Institutions. Agricultural Development Programme (ADP) constitutes the single largest agency charged with the responsibilities of agricultural extension in Nigeria. The programme had demonstrated a close and positive correlation between the development of infrastructure and rapid flow of agricultural inputs and farm output into and out of the farms. The World Bank, Federal Government and State Government tri-partitely funded the ADP. However in 1999 the final withdraw of the World Bank loan was made. Ehien et al. (2004) reported that the activities and job performance of ADP and extension agents respectively have decreased after the withdrawal. The extension agents, farmer ratio has gone back to the pre-ADP periods. A ratio 1 to 2000, 1 to 3000 and 1 to 3500 were reported for Oyo, Lagos and Ogun States, respectively, (Adebowale et al., 2001). Similarly, the economic reforms programme is attempting to cut public funds for extension services and the concept of beneficiary funding and privatization of extension is being considered. With the above scenario, there is need for alternative methods of information dissemination because farmers are still dependent on timely and appropriate agricultural information in order to

Nigerian Journal of Rural Sociology Vol. 15, No. 2, March 2015
22
increase their production. In view of the above, this study seeks to provide answers to the following research questions: 1. What are the socioeconomic characteristics of
rice farmers in Ogun State? 2. How do rice farmers rate adequacy of training
techniques/methods received from the video and extension agents?
3. What is the rice farmers’ knowledge of rice cultivation practices after training via the video and extension agents? The hypothesis of this study is stated in a null form as follows: There is no significant difference in the knowledge gained by rice farmers trained with video and by extension agents in the study area.
METHODOLOGY
The study was carried out in Ogun state Nigeria. This is because Ogun state is one of the leading rice producers in South Western Nigeria (PCU, FMARD 2001). Ogun State has a total land area of 17,084.3km2 extending between latitudes 60 30, and 70 95’ N and longitudes 20 80’ and 40 60’ E. It lies in the south western part of Nigeria with annual rainfall ranging from 1000mm to 2000mm. Multi-stage sampling procedure was used to select rice farmers. Ogun State is divided into 4 agricultural zones by the ADP, during the first stage, out of the four zones namely Abeokuta, Ikenne, Ilaro and Ijebu zones, Abeokuta and Ikenne zones were purposively selected due to their prominence in rice production in the state. At stage two, there are 10 blocks each in the selected zones, out of which 70% were sampled randomly giving 7 blocks each. At stage three, from the list of rice growers obtained from their association, two groups of 36 rice growers each were drawn separately from the population to give a total of 72 rice growers. The sample growers were exposed to a Quasi-experimental pre and post test and control design. Primary data were obtained using interview schedule administered to rice farmers. Frequency counts and percentage were used to describe the data while t-test was used to ascertain the differences in knowledge between video-taught and agent-taught farmers. RESULTS AND DISCUSSION
Selected socioeconomic characteristics of rice
farmers
Table 1 presents the socioeconomic characteristics of video-taught and agent-taught rice farmers in Ogun State. Majority (77 and 67 percent) of the farmers in the two groups are male. It implies that rice production is dominated by male farmers in the state. The age distribution shows that a greater proportion of the farmers (45 and 36 percent) in the two groups are between 40 and 50
years and this is also in relationship with the marital status of the farmers whereby majority (90.3 and 84.7 percent) are found to be married. Educationally, majority (55 and 64 percent) of the farmers in the group did not pass through any formal training or school. This may be an indicator of why many of them find it difficult to understand message from agents easily. The use of hired labour predominates among the video-taught farmers (39 percent) while family labour is commonly used among the agent-taught farmers (50 percent). In both cases, however, farmers in the two groups have income less than ₦50, 000:00. Above average (55.6%) of video-taught farmers had farming experience between 10 and 30 years while almost half (47.2%) of agent-taught farmers had farming experience between 10 and 30 years. Majority (86.1 and 63.9 percent) of video-taught and agent-taught respectively had less than 10 acres farm land for rice farming. Video player ownership is very prominent among the two categories of farmers; this may be due to the prevalence of the use of home video as a reflection of the expansion of the film industry that present different theatre performance on videotapes at low prices. Table 1: Selected socio-economic characteristics of rice farmers Characteristics Video taught
(n=36) Agent taught (n=36)
Sex
Female Male
22.2 77.8
33.3 66.7
Age
Less than 40 years 400.050 years Above 50 years Marital status
Single Married Widowed Separated Divorced
36.1 44.5 19.4 5.5 90.3 4.2 0.0 0.0
33.3 36.1 30.6 11.1 84.7 2.8 0.0 1.4
Educational level
No formal Secondary Tertiary
55.6 30.6 13.8
63.9 27.8 6.2
Labour sources
Family Hired Exchange
33.3 38.9 27.8
50.0 27.8 6.2
Farming
experience
Less than 10 years 100.030 years More than 30 years
13.9 55.6 30.5
47.2 47.2 5.6
Rice farm size
Less than 10 acres Above 10 acres
86.1 13.9
63.9 36.1
Income
Less than 69.4
69.4

Nigerian Journal of Rural Sociology Vol. 15, No. 2, March 2015
23
Characteristics Video taught (n=36)
Agent taught (n=36)
₦50,000.00 Above ₦50,000.00
30.6 30.6
Video player
ownership
Yes No
75.0 25.0
63.9 36.1
Rice farmers’ rating of adequacy of training
techniques/methods received from the video and
extension agents
In Table 2, out of all the indicators used to rate the adequacy of the two methods of message dissemination, only time for training (52 percent),
and relevance of training materials (52 percent) are accepted to be adequate by the extension agent-taught group. While some other indicators like clarity of message from training (13 percent), adequacy of training (33 percent), duration of training (36 percent), ease of retrieval of information from training (23 percent) and method of training delivery (44 percent) are rated to be inadequate while all these indicators are accepted adequate by greater percentage of farmers in the video-taught groups. The results in Table 2 show that the use of video to disseminate new technologies to farmers will be more effective and preferred by farmers to the use of extension agent.
Table 2: farmers’ rating of the adequacy of training methods
Video (n=36) Adequate Not adequate
Extension agent (n=36) Adequate Not Adequate
Duration of training 66.7 33.3 36.1 63.9 Access to training materials 91.7 8.3 8.3 91.7 Method of training delivery 97.2 2.8 44.4 55.6 Availability of time for training 66.7 33.3 52.8 47.2 Retrieval of training information 94.9 5.6 11.1 88.9 Listenership effect 94.9 2,8 61.1 38.9 Content of training materials 94.9 25.0 36.1 63.9 Relevance of training materials 75.0 25.0 52.8 47.2 Participatory funding in training 75.0 25.0 63.9 36.1 Adequacy of training 75.0 25.0 33.3 66.7 Feedback provision on training 2.8 97.2 38.9 61.1 Timeliness of training 75.0 25.0 38.9 61.1 Clarity of training message 94.4 5.6 52.8 47.2 Flexibility of training 90.6 18.4 13.9 86.1 Group influence on training 97.2 2.8 63.9 36.1
Knowledge gained by farmers
Table 3 shows that greater percentage of the farmers (71.0%) in the video-taught group got all the constructed items right while some farmers (45.0%) got the items right in the agent taught group. This is a general trend in land preparation, weed prevention and control and the use of herbicides sections. This might be due to the features of video as a medium of information dissemination that is being explored. One the item (recommended spacing for weed precaution) where only one farmer got it wrong under the video taught group, a little above average (52.8%) of farmers in the agent taught group got it wrong. The outcome of this can be traced to factors such as training at learner’s pace, adequacy of training and clarity message from training as characteristics of video tape medium message. From the result, it could be observed that the messaged transferred on the use of herbicide in rice farm was understood better by farmers in the video taught group than the farmers in the agent taught group. This could be seen glaringly from the table where greater percentage of the farmers in the video taught group got all the
constructed items for the herbicide knowledge test right. The questions on the types of rice farm herbicide, sources of herbicides, time to apply herbicide, mixing ratio were obtained right by the farmers in this group showing that the message was adequately sent across to the farmers.
Table 3: Farmers’ knowledge of rice cultivation practices after training
Cultivation practices Video-taught (n=36) score
Agent-taught (n=36) score
Land preparation Use of tractor 69 55 Manual clearing 57 53 Bush burning during land preparation
71 49
Weed prevention and
control
Flooding method for weed prevention
67 45
Recommended spacing for pre
71 53

Nigerian Journal of Rural Sociology Vol. 15, No. 2, March 2015
24
Cultivation practices Video-taught (n=36) score
Agent-taught (n=36) score
Rice varieties for prevention
71 54
Weed categories 59 62 Weeding methods 65 45 Control of weed to start from land prep.
53 53
No. of weeding period 58 48 Time of first weeding 57 47 Time of second weeding
57 52
Weeding benefits 64 47 Use of herbicides Types of rice farm herbicide
59 42
Sources of herbicides 71 52 Time to apply pre-emergence
71 52
Time to apply post-emergence
70 53
Usage of herbicide 71 52 Combination of herbicides
70 53
Use of ozadiazone singly
59 47
Use of butacol alone 71 52 What type of herbicide is Rota 25DC
59 52
Importance of sprayer nozzle
57 53
Time to spray 71 52 Herbicide mixing ratio 58 51
Hypothesis testing
Test of difference in the knowledge gained by
rice farmers trained with video and by extension
agents
Table 4 presents the results of t-test statistics on the pre and post test of knowledge among video and agent-taught farmers. A significant difference exist in farmers’ knowledge after training by extension agent (t=41.38, df35 p<0.05). The knowledge mean score after training (43.22) by extension agent was higher that before training (38.91). Similarly, farmers’ knowledge after training with video (54.63) was greater than knowledge before and after training with video (t=20.44, df35 P < 0.05). This is an indication that video tape if used adequately can be used to disseminate information or farming technologies to farmers. The comparison between farmers’ knowledge after training with video and extension agent shows that knowledge gained by video-taught group (54.63) is higher than the knowledge gained by the agent-taught group (43.22), thus a significant difference exist (t=1.95, df35 p < 0.05). The results imply that farmers are receptive to the use of video as a means of disseminating agricultural information. The mode of presentation, ease of retrieval of information from training, training at learners’ pace, and flexibility of training might as well be responsible for the trend of the results.
Table 4: Test of difference in the knowledge gained by rice farmers trained with video and by extension agents
Parameters Agent-taught Video-taught Agent and Video groups Knowledge
before training
Knowledge after training
Knowledge before training
Knowledge after training
Knowledge after training (video)
Knowledge after training (agent)
Mean 38.91 43.22 41.58 54.63 54.63 43.22 N 36 36 36 36 36 36 Std Dev 31.67 31.95 32.35 30.92 26.08 32.35 SEM 5.27 5.32 5.39 5.1 4.34 5.39 MD 4.30 13.05 13.35 T 41.38 20.44 1.95 Df 35 35 71 P 0.95 0.00 0.054
CONCLUSION AND RECOMMENDATIONS
The paper has clearly shown that the video can be used for dissemination of agricultural information in the face of dwindling funds for extension services in Nigeria, low extension agent- farmers ratio and the other advantages it has over the traditional face-to-face medium. It also shows that farmers rated video higher in terms of
adequacy for training than extension agent and thus their preference for video as means of information dissemination. Knowledge gain on the same subject of training was higher among the video-taught group than the agent-taught group. It further revealed that farmers had a thorough mastery of the subject after the third exposure to the training on video. The following recommendations are made

Nigerian Journal of Rural Sociology Vol. 15, No. 2, March 2015
25
based on the results of the study. Adult literacy campaign should be encouraged among the farmers by relevant stakeholders such as extension and education officers. This will assist farmers to grab very fast the information being conveyed by video. Also, it is recommended that video could be used to disseminate agricultural information in order to alleviate the problems of low extension agents- farmers’ ratio and promote beneficiary funding of extension services as farmers buy the video tapes.
REFERENCES
Adebowale, E. A., Ogunbodede, B. A., Adesehinwa, A. O. K. and Salawu, R. A. (2001): 2001 Technology Generation and Dissemination. Proceedings of the 14th Annual Southwest Zonal OFAR and Extension Workshop Farming System Research and Extension: Workshop I.A.R & T, Ibadan. 20-24 February, 2001.
Ehien, A. E., Oladele, O. I. and Ogunfiditimi, T. O. (2004): Effect of World Bank Loan withdrawals on job related variables of extension agents in South Western Nigeria: Bulgaria Journal of Agriculture Science 10 (2): 275-279.
Israel, G.D. and Ingram, D.L. (1991) Video for self study, journal of extension vol. 29 No. 4 http://www.joe.org/joe/1991spring/a6.html
Omotayo, A. and Isiaka B. T. (2005): Video self training methods: Its Effectiveness in disseminating agricultural information to rural farmers in southwest Nigeria. Agricultural Research and Extension Networks, Newsletter No. 52.p7.
Polson, J. G. (1991): Using Video of a Master farmer to Teach Others: Journal of Extension volume 37 No. 2 http://www.joe.org/joe/1999april/rbl.hmtl

Nigerian Journal of Rural Sociology Vol. 15, No. 2, March 2015
26
FACTORS AFFECTING TILAPIA FISH FARMING IN ONDO AND EKITI STATES, SOUTH WEST
NIGERIA 1Odefadehan, O.O., 1Alfred S.D.Y, 1Onasanya, O.O. and 2Ogunwande, I.O.
1Department of Agricultural Extension and Communication Technology, Federal University of Technology, Akure, Nigeria
2Department of Agricultural and Resource Economics, Federal University of Technology, Akure, Nigeria E-mail: [email protected]
ABSTRACT
Tilapia fish production is not as popular as catfish production. Therefore, in support of the drive of the Federal
Government to boost fish production, this study determined the factors affecting tilapia fish production in Ondo
and Ekiti States. Primary data were collected from 120 Tilapia fish farmers and researchers using random and
multi stage sampling techniques (seventy from Ondo State and fifty from Ekiti State). Most (70%) Tilapia
farmers are male, Ninety percent are married and majority (51.7%) has household size with 2-5 members.
Gross Margin analysis showed a profit of 11.79%. Regression result showed that cost of equipment, cost of
feed, farming experience, household size and pond size were factors affecting Tilapia fish production with 0.28,
0.42, 0.08, 0.02 and 0.00 as coefficients, respectively, and were all significant at 5% level of significance. The
p- value (0.742) of the Chi square test revealed that income of the Tilapia fish farmer has no significant
relationship with contact with extension agents. The study recommends that agricultural extension services
should be strengthened to ensure more farmers receive more visits from extension agents. Government of both
Ondo and Ekiti states should provide funds and inputs to boost the productive capacity of farmers.
Keywords: Tilapia, productive capacity, constraints, profitability, production and factors
INTRODUCTION
The rate of population growth in the world is alarming when compared with the rate at which food production is increasing especially in the developing nations like Nigeria. It is more worrisome that the poverty level in most Sub- Saharan African countries has made intake of balanced diet practically impossible for most household members. According to Fanzo (2012) Sub-Saharan Africa is home to some of the most nutritionally insecure people in the world. Mostly consumed foods are the cheap carbohydrates which the disposable income of most homes can accommodate. Protein intake for most individuals in this region is grossly inadequate. Fish is a cheap source of animal protein, which families can raise in their backyard in order to boost their protein input. Fish plays a vital role in feeding the world’s population and contributing significantly to the dietary protein intake of billions of the populace (Amao, Oluwatayo and Osuntope,
2006).Among several species of fishes that can be cultured is Tilapia which is not popularly raised when compared to other species like catfish. Fish farming is the raising of fish in ponds, tanks, net enclosures, cages, or any suitable enclosure (where the fish can be properly monitored) for personal use or profit. Usually the goal is to grow fish as fast and economically as possible to harvestable size. Regardless of whether the raising is for family consumption or commercial purpose, some factors can be manipulated to influence growth rate such as pond environment, type and density of fish, food, fertilizer, water quality, and growth period. According to Issa, Abdulazeez, Kezi, Dare, and Umar, (2014), the total aggregate domestic fish supply in Nigeria from all sources (captured and cultured fisheries) is less than 0.7 million metric
tonnes per annum. The requirement of fish to satisfy the dietary need of Nigerians is approximately 2.66 million metric tonnes per annum. In view of this supply gap; Nigeria imports about0.7 million metric tonnes of fish valued at $500 million annually to augment part of the shortfall. This massive importation of frozen fish in the country has made Nigeria ranked the largest importer of frozen fish in Africa. The total contribution of fisheries to the Nigerian economy is put at N126, 417 billion gross output with a capitalization of N78, 530 billion (Faturoti, 2010). Fishing and marketing of fish and fish products are very lucrative ventures that contribute to food security, poverty alleviation and Nigerian economic growth. Though not as popular as catfish farming, Tilapia has several advantages when cultured. Tilapia is easy to culture, has good disease and stress resistance ability, able to reproduce easily, short generation time, starts feeding early and with good tolerance to high stocking densities (Al-Sayed, 2006). It is good for hypertensive patient because of its nutritional value. It is rich in Omega-3 fatty acids which help to prevent atherosclerosis, heart attacks, and strokes; the potassium found in tilapia is also a vasodilator, and reduces blood pressure, which is an additional boost to heart health (organic facts, 2015) Tilapia production requires low cost of feed which minimize cost of production and enhance profit because Tilapias are able to eat many types of foods like aquatic algae and plant, insects and manufactured feed. It can be used to control weed and insect in rice paddies and for the control of aquatic saprophytes in large irrigation system (Fagbenro, Nwanna, Adeparusi, Adebayo and Fapohunda, 2005).

Nigerian Journal of Rural Sociology Vol. 15, No. 2, March 2015
27
In Nigeria, if Tilapia fish must be served at affordable prices; factors that affect its production must be understood. This is necessary so that these factors could be managed or improved as required to boost local production. In doing this the high dependence of Nigeria on fish importation would be addressed. The broad objective of this study is to determine factors affecting cultured Tilapia fish farming while the specific objectives are to: • describe the socio economic characteristics of
tilapia fish farmers, • determine the profitability of Tilapia
production in the study area, • determine the level of contact of the farmers
with extension services and • identify the major constraints affecting Tilapia
fish farmers in the study area.
METHODOLOGY
The study area is Ondo and Ekiti States located in the South-Western part of Nigeria; Ondo State have geographical co-ordinates of 5045′′ and 80 15′′ North of the equator and longitudes 40 30′′ and 60 00′′ East of the Greenwich meridian while Ekiti state have geographical co-ordinates of 7040′′ North of the equator and longitudes 50 15′′ East of the Greenwich meridian. Based on the projection of National Population Commission in 2012, Ondo state’s population was 6,882,048 and covers 15,500 km2 while Ekiti state’s estimated population was 4,364,507 and covers an area of 6,353km2. Random sampling technique was combined with multistage sampling to draw samples. In Stage I: Ekiti and Ondo states were randomly selected from the list of seven states in South West Nigeria. In stage II of the sampling, 70 Tilapia fish farmers out of 350 were randomly selected from the list of Tilapia fish farmers in Ondo state and 50 out of 150 from the list of Tilapia fish farmers in Ekiti state. This gives a total sample size of 120 respondents. The lists were obtained from the Agricultural Development Project of both states and the Fisheries Department of Federal University of Technology Akure and Ekiti State University, Ado-Ekiti. Primary data was used for this study. Data were collected through the use of well-structured questionnaire which was administered using interview method. Chie square was used to test the two hypotheses, Gross margin analysis was used to determine profitability while multiple regression analysis was used to estimate the contribution of certain independent variables to the output of cultured Tilapia fish in the Ondo and Ekiti states. The linear, semi-log, and Cobb-Douglass functional forms of the production function were fitted using Ordinary Least Square (OLS) method. The estimated functions were evaluated in terms of
the statistical significance of the coefficients of multiple determination (R2) as indicated by F-Value, the significance of the coefficients and magnitude of standard errors. The lead equation was chosen based on the following criteria: 1. Apriori-expectation 2. The magnitude of the coefficient of
Determinant (R2) 3. The significance of the explanatory variable. Based on the statistical and econometric criteria listed above, the linear functional form was selected as the lead equation for this study. The R2
for the estimated regression was 0.87. This implies that 87.7% variation in production capacity of farmers is explained by the entire explanatory variable considered in this study.
RESULTS AND DISCUSSION
Data procured from 120 respondents selected from Ondo and Ekiti states were collated and analysed. The result of the analysis are as follows; Socioeconomic characteristics
Socioeconomic characteristics of the respondents described in this study include: age, sex, educational level, marital status, household sizes and fish farming experience. The ages of farmers as shown in Table 1, reveal that very few (16.7%) of the farmers were below 36 years, but were between 26-35 years. None of them was below 26 years while few 35% of the respondents were in the age category of 46-55 years. This shows that young teens were not really engaged in the culturing of Tilapia but rather adults not below 26 years. A negligible 3.3% of the respondents are 66 years and above. Although most youth prefer white collar jobs compared to farming but it is noticeable that most respondents in this study are not the elderly which is an indication that young able bodied men are into Tilapia farming. As shown in Table 1, majority of the respondents (70%) are males, while only 30% of them are female. This confirms findings of Folayan, Omoniyi, and Bifarin (2014) that production activities in an agricultural enterprise are a male dominated enterprise. In their study of farm ownership by small scale farmers in Edo state, Nigeria; about 68% agricultural enterprises are owned by male. The Tilapia fish farming being dominated by males is similar to the finding of Adewuyi et al (2010) where over 80% of the fish farmers in Ogun state were males. Sex is an important factor in determining the choice of an agricultural enterprise to embark upon, for instance, women are found more in marketing and processing activities that require less tedious production activities than men. The distribution of the marital status of the respondents as shown in Table 1 shows that 8.3 % were Single, 90.0 % were married and 1.7% were
Nigerian Journal of Rural Sociology Vol. 15, No. 2, March 2015
28
widowed. This is similar to the findings of Nwosu and Onyeneke (2013) whose study of pond fish farmer in Owerri agricultural zone, Nigeria shows that majority (85%) were married. This may imply that majority of the respondents being married may be able to use family labour and have the opportunity to take decision s on matters. They can jointly be responsible in taking crucial decisions regarding Tilapia production. Majority being married could also be explained by African tradition which frowns at singlehood immediately a man or woman attains a particular age. In addition ruralites often get married quickly in order to have a helping hand from their mates in the farming enterprise. Table 1 revealed that, out of 120 respondents sampled, 80% had family size between 4-8, and only 4 of the respondents representing 3.4% has a family size of less than 3 members while 16.6 % have above 10 members as household size. This implies that majority have manageable family size, their consumption expenditure may be low and this may not adversely affect their profit margin. Besides, they have cheap family labour which gives extra helping hands in their production enterprise. Table 1 revealed that majority (95%) of the respondents had one form of education or another and 25.0% completed their secondary school education. From the study, average tilapia producer in the study area were moderately educated implying that they will take moderately better decisions as regards acceptance of innovations and apply better production practices since education is the tool to adoption of newly improve technology. Only 5 % had no formal education, this finding compares favourably with the finding of Aromolaran (2000). The level of education of farmers increases their farm production and also enhances the ability to understand, evaluate and adopt new technologies. From Table 1, majority of Tilapia farmers (76.7 %) have between 2 to 9 years of Tilapia production experience while only 5.0% of the respondents have production experience above 17 years. This implies that Tilapia farmers are experienced farmers and therefore may be able to handle production challenges.
Table 1: Distribution of Respondents based on Socio-economic Characteristics (n = 120) Socioeconomic Variables
Frequencies Percentages
Age in years
26-35 36-45 46-55 56-65 Above 65 Sex
Male
20 40 42 14 4 84
16.7 33.3 35.0 11.7 3.3
70
Female Marital status
Single Married Widowed Household size
< 3 4-8 9 and above
Educational level
No formal Education Completed primary Attempted secondary Completed secondary Attempted tertiary Completed tertiary Adult education Years of fish farming
experience
<1 2-9 10-17 >17
36 10 108 2 4 96 20 6 8 16 30 12 50 2 4 92 18 6
30 8.3 90.0 1.7 3.4 80.0 16.6 5.0 6.7 10.0 25.0 10.0 41.6 1.7 3.3 76.7 15.0 5.0
Source: Field Survey, 2013
Perceived factors affecting tilapia production
Table 2 shows the distribution of the level (High, moderate or low) of perceived effects of several factors on Tilapia fish production based on the opinion of the respondents. The factors considered in this category include feed availability, weather condition, labour, profitability of the enterprise, traits exhibited by the fish species, tax imposed by the government, infrastructural facilities, demand for the fish, water conditions, government agricultural policy and disease infestation. From the distribution in Table 2, majority (71.7%) attested that availability of feeds have high effect on Tilapia fish production while few (23.0%) opined that feeds availability has moderate effect on them. Almost 72% of the total respondents believed that weather condition has moderate effect on Tilapia production and they find it easy to adapt to changes in weather condition, though 28% believe that weather condition in the locale has high effect. The distribution further revealed that 55% said labour has low effect while 36.7% believed that labour exerts moderate effect on production. Based on the distribution, majority (62.0%) believed that the enterprise production is affected greatly by the profit level while 20.0% attested to moderate effect of profit on production. It is few (18.0%) who claimed that profitability has low effect on production. Furthermore, the traits of fish cultured was perceived as having high effect on production by 56.6% of the respondents while 28.3% said it has moderate effect. This shows that

Nigerian Journal of Rural Sociology Vol. 15, No. 2, March 2015
29
the farmers are aware of the relevance of selecting high quality breeds for stocking since it determines production. Tax effect on tilapia fish production was perceived by 61.6% of the respondents as being moderate in affecting production and 20.0% said it has relatively high effect. The effect of infrastructure on tilapia production was rated moderate by majority (63.3%) while 13.3% opined that infrastructure effect on production is low. The demand for the fish was rated as having high effect on their production as agreed to by half (50.0%) of the respondents while only 15% agreed that demand does not have high or moderate effect but rather low effect on their production. This may be because, if farmers produced in a fairly large quantity and it was not demanded for or bought off him/her such a farmer will be discouraged in the next cycle of production and may even stop or reduce the quantity he will produce. The perceived effect of water condition was attested to be high by half (50.0%) of the fish
farmers while in the opinion of 8.4% of the farmers water condition has low effect on the production of the fish. The distribution however showed the connection between government policies and its effect on tilapia production as most of the respondents (60.0%) attested that government policies have low effect on tilapia production, 38.3% attested to moderate impacts on tilapia production. This implies that there is little or no government policies regulating or promoting the production of tilapia in the study areas. The table further asked the farmers the effect of disease on tilapia production. From the data collected, it was revealed that 50.0 % approved that disease have low effects on tilapia production while 33.3% attested to moderate effects on production and 13.8% attested to high effects on production. This confirms that Tilapia fish is disease tolerant and are not highly susceptible to diseases infestation.
Table 2: Distribution of Perceived Effect of Selected Factors Affecting Tilapia Production. Perceived Variables Affecting Production Low Moderate high
Freq. Percent Freq. Percent Freq. Percent
Feed Availability
6 5.0 28 23.3 86 71.7
Weather Condition
4 3.3 86 71.6 30 25.0
Labour
66 55.0 44 36.7 10 8.3
Profitability
22 18.0 24 20.0 74 62.0
Fish Traits
18 15.0 34 28.3
68 56.6
Tax
22 18.3 74 61.6 24 20.0
Infrastructure
16 13.3 76 63.3 28 23.3
Demand
18 15.0 42 35.0 60 50.0
Water Condition
10 8.4 50 41.6 60 50.0
Government Policy
72 60.0 46 38.3 2 1.7
Disease
60 50.0 40 33.3 20 16.7
Source: Field Survey, 2013
Profitability of tilapia production
The costs, returns and profitability analysis are presented on Table 3. The following items were considered in estimating the costs and returns: Average feed cost, average quantity bought, average maintenance cost, average labour cost, average sundry costs, average equipment cost, average prevailing selling price and quantity sold.

Nigerian Journal of Rural Sociology Vol. 15, No. 2, March 2015
30
Table 3: Profitability Analysis Associated with Tilapia Production Expenditure Average Value (₦) 1. Cost of Feed 2. Sundry 3. Labour 4. Maintenance 5. Cost of Equipment TOTAL
Average output (kg) Average total Output price per kg Revenue Gross Revenue
56,807.5 21,041.67 11,217.9 3081.63 1775.00 93,923.7
500 210.0 105,000.00 11,076.3
Source: Computed from Field Data, 2013
Profit (%) =����������
��� �����× 100 =
��,���.�
��,���.�× 100
= 11.79% From the analysis above, it can be seen that the profitability level of tilapia fish production is not encouraging. The annual accruable profit on the average was ₦11, 076.3 per annum or a profit of 11.79%.This profit margin is low compared to the production of other cultured fish species based on literature. For example Egware and Orewa (2013) in a study conducted in Ughelli, Delta state, Nigeria, put the profit percentage of catfish reared in earthen and concrete tanks as 65.6% and 47.7%, respectively, Similarly, Adebayo and Adesoji (2008) in a study on profit margin of catfish in Ogun state Nigeria, gave a profit margin of 38.2%. These two examples show clearly that catfish has higher profit level than Tilapia. Farmers’ level of access to extension services
From Table 4, average (46.7%) of the respondents revealed no contacts with any extension agent whether governmental or non-governmental while most (53.3%) representing 64 respondents had contact with extension agents. From Table 4, 62.5% out of the 32 respondents who have contacts with extension agents claimed that their contacts with agricultural extension agents was on a quarterly basis while 28.1% affirmed that they only enjoy extension services twice in a year. According to the respondents, 6.3% received extension services on monthly basis and 3.1% on weekly basis. This confirms the inadequacy of agricultural extension service in the study area. Table 4: Distribution of Respondents by Access to Extension Services (n = 120)
Access to agricultural extension services
Frequency Percentage
No Yes Number of contacts with
Agricultural Extension
Agents
Weekly Monthly Quarterly Bi-annually Total
56 64
2 4 40 18 64
46.7 53.3
3.1 6.3 62.5 28.1
100.0
Production function analysis of tilapia fish
production
Multiple regression analysis was used to estimate the contribution of certain independent variables to the output of cultured Tilapia fish in Ondo state. Table 5: Regression Analysis Variables Linear Semi-log Cobb
Douglas Constant
-0.241 (4.207)
5439.725 (1.217)
1.501 (0.815)
X1 = Cost of Equipment (₦)
0.281 (-1.902)*
-1803.197 (-1.327)
0.112 (0.200)
X2 = Profit Realized (₦)
0.033 (0.515)
-1654.317 (-1.312)
0.227 (0.438)
X3 = Cost of Feed (₦)
0.420 (-2.178)*
-5214.009 (-4.854)*
-1.148 (-2.593)*
X4 = Farming experience (Years)
0.084 (-6.735)*
-3040.917 (-0.317)
-1.275 (-3.665)*
X5 = Cost of Labor (₦)
0.053 (-3.325)
-852.015 (-1.266)*
-0.441 (-1.591)
X6 = Household Size (Nos)
0.017 (6.085)*
663.35 (12.218)*
0.513 (4.167)*
X7 = Pond Size(m2)
0.001 (3.698)*
404.996 (0.916)
0.316 (1.737)*
R2 0.877 0.864 0.837 Adjusted R2 0.860 0.821 0.786 F- Value 51.006 20.147 16.365 Source: Field Survey, 2013. *Significant at 5%. Figures in parenthesis are t-values of the coefficients. As shown in Table 5, the linear functional form was chosen as the lead equation because it is the equation that satisfied the evaluating criteria. It gives the equation of best fit with the highest R2 (0.877), number of significant variable and the correct signs of variable based on apriori expectation. The lead equation is shown below. The 5 variables were significant determinants of production capacity of farmers at 5% level of significance.

Nigerian Journal of Rural Sociology Vol. 15, No. 2, March 2015
31
Y = a + bX1 + bX2 + bX3 + bX4 + bX5 + bX6 + bX7
+ µi
Where Y= Output, a= constant term and µi= error term Y = 0.241+0.281X1+0.033X2+0.420X3+0.084X4+0.053X5+0.017X6+0.001X7
(4.207) (1.902) (0.515) (-2.178) (-6.735)* (-3.325)*
(6.085)* (3.698)*
R2 = 0.877* Adjusted R2= 0.860 F value = 51.006 Standard Error = 0.385 From the equation, it could be seen that the explanatory variables accounted for 87.7% variation in the Production Capacity of Farmers (PCF).The significant variables are; cost of equipment, farming experience, cost of feed, household size and Pond Size. The error tem accounted for 12.3%. F-distribution table was used to test the significance of the coefficient of multiple regression (R2) while T- Value was used to test the significant of the coefficient of the explanatory variable. This result shows that cost of equipment, farming experience, cost of feed, household size and pond size are all determinant factors in Production Capacity of Farmers in the study area. The positive coefficient of pond size suggested that the sizes of pond used for production can be increased to their advantage. Hypotheses testing
Relationship between the output of Tilapia fish
farmers and their selected socioeconomic
characteristics
From table 6, theχ2calculated value for age of the respondents was 70.894 with degree of freedom of 80 and p value of 0.757 (2-tailed). This p value is greater than level of significance of 0.05 which means it is not significant, hence, acceptance of null hypothesis that there is no significant relationship between the output of Tilapia fish and the age of Tilapia fish farmers. The implication of this is that the age of Tilapia fish farmers does not affect the quantity of fish produced. The marital status of the farmers was not significant with the output of Tilapia fish produced as shown in Table 6 where the p- value of 0.108 is greater than 0.05 level of significance. The χ2 calculated was 106.889. Regardless of the marital status of the respondents whether single, married or divorced their production level of Tilapia fish is not affected. The table also shows theχ2 value for sex of the respondents was 41.943 with degree of freedom of 40. The p - value is 0.387 which is greater than 0.05 which means it is not significant, hence, acceptance of null hypothesis; there is no
significant relationship between the output of tilapia fish and the gender of tilapia fish farmers. The implication of this is that the whether Tilapia fish farmer is male or female does not determine the quantity of fish produced. Any gender can be involved in the Tilapia fish farming and still achieve reasonable level of output under good farming practices. Furthermore, the table revealed the χ2 value for educational level of the respondents is 1.1732 with degree of freedom of 40, it has p- value of 0.533 (2- tailed) this p-value is greater than level of significance of 0.05 which means it is not significant, hence, acceptance of null hypothesis that; there is no significant relationship between the output of Tilapia fish and level of education of farmers. This translates that the education attainment of tilapia fish farmer does not affect the quantity of fish produced. Tilapia farming does not require formal academic qualification to excel in its farming. Literate or non-literate can achieve same level of output given same production factors and operational environment ceteris paribus.
Table 6: Chi-Square analysis showing relationship between socio-economic characteristics and output of Tilapia Fish Farmers Variables Calculated
χ2 Values p-value
D.F Decision
Age Marital Status Sex Educational level
70.894 106.889 41.943 1.1732
0.757 0.108 0.387 0.553
80 90 40 110
NS NS NS NS
Source: Field Survey, 2013 Testing of significance at p=0.05 level NS= Not Significant S= Significant Relationship between the income of Tilapia fish
farmers and their contact with extension services
As can be seen from the Table 7, calculated Chi-Square is 21.000with degree of freedom 26and p-value of 0.742. This p- value is greater than level of significance of 0.05 which means it is not significant, hence, acceptance of null hypothesis which stated that there is no significant relationship between contact with extension services by farmers and their income. The extension services delivery does not influence the income of the respondents. This may be due to the low level of extension contact with the Tilapia farmers in the study area. In addition, those who claimed to have agricultural extension contact may not receive information that have impacted their income.

Nigerian Journal of Rural Sociology Vol. 15, No. 2, March 2015
32
Table 7: Chi-Square Analysis Showing the Relationship between the Income of Tilapia Fish Farmers and their Access to Extension Services Variable Calculated
χ2 Values p-value
D.F Decision
Income 21.00 0.742 26 NS Source: Field Survey, 2013 Test of significance at p=0.05 level NS= Not Significant S= Significant Constraints affecting tilapia production
Table 8 reveals the constraints affecting Tilapia production in the study area. Majority (57%) of the respondents attested to overcrowding as a constraint. This occur as a result of high spawning rate when male and female species of Tilapia are stocked together. Among the respondents, 23%attested to high mortality rate especially during harvesting because of the fragile and sensitive nature of the fish to change in environmental condition. It cannot breathe-in atmospheric oxygen due to the absence of gills unlike catfish. Lack of post harvest method in preservation was identified as a constraint by 15% of the respondents. The fish must be processed or preserved based on the fact that it deteriorates under two hours of harvesting. Among the Tilapia fish farmers 20 % of the respondents attested that they lack technical know-how on production. Table 8: Distribution of Respondents According to Constraints Affecting Tilapia Production Constraints Freq Perc High mortality rate Low post-production process Over-crowding Technical know-how Total
28 18 68 24 138
23 15 57 20
*Multiple responses Source: Field Survey, 2013 CONCLUSION
The result from this study shows that Tilapia farming is profitable but the profit margin is small. Tax is not a production inhibiting factor. For profitability to improve the factors that are crucial to the production are: cost of equipment, cost of feed, the farming experience, household size and pond size. Nigeria have huge potentials in the production of Tilapia fish if there is enabling environment with policies that will encourage local production and thus no avoidance from dumping of imported fish in the country. The Tilapia fish can be a source of financial empowerment and a way to increase protein intake of households in Nigeria. RECOMMENDATIONS 1. It is recommended, based on the findings of
this study, that production of Tilapia fish should be encouraged and government should
provide funds and other inputs (i.e land and credit) that can boost the productive capacity of the farmers.
2. Agricultural extension services should be improved so that farmers currently culturing Tilapia can be trained on better ways to culture the fish and thus improve revenue.
3. There should also be awareness drive on the advantages of culturing Tilapia over other species of fish through effective extension system.
REFERENCES Adebayo, I.A and Adesoji, S.A (2008):
Comparative assessment of the Profit Margin of Catfish
Reared in Concrete Tank and Earthen Pond. African Journal of Agricultural Research
Vol. 3(10), Pp 677-680. Adewuyi,S. A. Phillip, B. B. Ayinde, I. A.and
Akerele, D (2010): Analysis of Profitability of
Fish Farming in Ogun State, Nigeria Journal of
Human Ecology, 31(3): 179-184 Al-Sayed, A.F.M (2006): Nutrition and Feeding
in:Tilapia Culture. CABI Publishing, Oxford U.K 277 Pp.
Amao, J.O, Oluwatayo, I.B., Osuntope, F.K (2006): Economics of Fish Demands in Lagos State, Nigeria. Journal of Human Ecology.
19(1): 25-30 Aromolaran AB 2000. Analysis of Resource Use
Efficiency in Fish Farms: A case study of Abeokuta Zone of Ogun State. Aquafield,
1(1): 12-21. Egware, R.A. and Orewa, S.I. (2013): A
comparative Profit Analysis of Catfish (Clarias gariepinus) Production in Ughelli, Delta state, Nigeria. International
Journal of African and Asian Studies Vol.1
Pp1-3
Fagbenro, O.A., Nwanna, L.C., Adeparusi, E.O., Adebayo, O.T. and Fapohunda, O.O. (2005): An overview of the animal feed industry and dietary substitution of feedstuffs for farmed fish in Nigeria. In: Crops: Growth, Quality and Biotechnology (current status and future prospects) (Ramdane Dris, ed.). WFL Publisher, Helsinki, Finland. ISBN 952-91-8601-0, 3-1: pp.91-107.
Fagbenro, O.A., Jegede, T., and Fasasi, O.S. (2007): Tilapia Aquaculture in Nigeria. Applied Tropical Agriculture 15: Pp 49-55. Is this a journal? Place of publication
Fanzo, J. (2012): The Nutrition Challenge in Sub- Saharan Africa. United Nations Development Programme. Regional Bureau for Africa. Working Papers WP
2012-012: January 2012

Nigerian Journal of Rural Sociology Vol. 15, No. 2, March 2015
33
Faturoti, O. (2010). Fisheries contribute N126.4Billion to Nigerian economy. Press Release of
Federal Ministry of Agriculture and Rural Development (FMARD): Agricultural Transformation Agenda Document Pp. 92 place of publication
Folayan,. J. A, Omoniyi, L. O. and Bifarin, J. O. (2014): Gender Analysis of Farm Ownership by
Small Scale Farmers in Edo state, Nigeria. American Journal of Research
Communication. Vol 2(11). Pp 89-101 Accessed from http://www.usa-journals.com/wp-
content/uploads/2014/10/Folayan_Vol211.pdf
Issa F.O., Abdulazeez M.O., Kezi D.M., Dare J.S., and Umar, R (2014): Profitability Analysis of Small –scale Catfish farming in Kaduna State, Nigeria. Journal of Agricultural Extension and Rural Development. Vol. 6 (8). Pp 347-353
Nwosu, C.S. and Onyeneke, R.U (2013): Effect of Productive Inputs of Pond Fish Production on the Output of Fish in Owerri Agricultural Zone of ImoState, Nigeria. Global Advanced Research Journal of Agricultural Science Vol. 2(1) pp. 023-028http://garj.org/garjas/index.htm

Nigerian Journal of Rural Sociology Vol. 15, No. 2, March 2015
34
INFLUENCE OF ADVISORY SERVICES ON THE ADOPTION OF SELECTED LIVESTOCK
TECHNOLOGIES AMONG FADAMA III SHEEP AND GOAT FARMERS IN AKINYELE AND
LAGELU LGA OF OYO STATE NIGERIA
Oyewole, M. F. Department of Agricultural Extension and Rural Development, University of Ibadan, Ibadan
E-mail: [email protected]
ABSTRACT
The need to address lack of input supply, inadequate technical assistance to increase productivity by fadama
users necessitated the analysis of effectiveness of advisory service activities among Fadama III sheep and goat
farmers’ groups in Akinyele and Lagelu Local government Areas of Oyo state. Simple random sampling
technique was used in selecting 120 sheep and goat fadama farmers. The data collected using questionnaire and
were analysed with the aid of descriptive statistical tools which include frequencies, percentage distribution and
mean, standard deviation and inferential statistical tools such as Chi-square and Pearson Product Moment
Correlation (PPMC). Result of the analysis shows that the mean age was 59.9 ± 8.5 with one third (34.2%)
being between the ages of 58 and 66 years. The majority (71.7%) of the respondents were male, married
(85.8%) and have one form of formal (78.3%) education or the other. Respondents benefited from the ASAs,
with 55% of them deriving high level of benefits. They participated in all the ASAs and 47.5% had high level of
participation in the activities. The result also revealed that lack of financial support (88.3%) was ranked first in
order of severity in terms of constraints that limits the respondents in the adoption of transferred technology
and lack of reliable and continuous technical assistance (62.9%) ranked second. Most of the respondents
(55.8%) had high level of adoption while 44.2% had low level of adoption. Variables significantly related to the
rate of adoption were respondents’ sex (X2=13.43), educational status (X
2=24.92), marital status (X
2=25.03)
and age (r= -0.18). Lastly, participation in advisory service activities (r=0.010) and benefits derived by the
respondents from advisory service activities (r=0.00) influence adoption of transferred technologies. Hence,
government and other financial institutions should assist Fadama user group participants with loans to enable
them increase adoption of transferred technologies and expansion of their farm enterprise to meet the goals of
the Agricultural Transformation Agendas.
Keywords: Influence, Advisory Services, Fadama III, Sheep and Goat.
INTRODUCTION
Agriculture advisory service (extension) has long been recognized as an important factor in promoting agricultural development. The terms agricultural advisory services and agricultural extension refer to the entire set of organizations that support and facilitate people engaged in agricultural production to solve problems and to obtain information, skills and technologies to improve their livelihoods (Swanson, 2008). Agricultural extension (advisory services) approaches and performance in Nigeria have been changing over the past few decades. These changes have been driven by many factors, including the political and policy changes, donors, and recently by participation of Non-governmental Organizations (NGOs) in funding and providing agricultural extension services ( Ozor, 2007). Rural advisory services have been one of the oldest practices of extension which has been effective in disseminating innovation and techniques over the years. Rural advisory service is a practice developed and geared towards increasing food production and livelihood of rural or local farmers. Rural advisory service is the practicality of extension programmes (Davis et al., 2011). Advisory services in Nigeria is largely provided by the agricultural development program (ADP) that evolved from a project funded by the World Bank and the objective of this intervention
was to increase food production in order to attain food self-sufficiency . When the project ended in 1995 with significant success in increasing agricultural production, the Federal Government adopted its approach and incorporated it into Agricultural Development Programme (ADP). The ADP continued to use the traditional supply-driven approach and has also been characterized by poor funding and less effective advisory services (Ozor, 2007), as a result of this there has been a limited impacts of the ADP on agricultural productivity in the country and rural development. NGOs and projects have also been providing advisory services and other agriculture-related services (e.g credit services and agricultural input supply). However, the presence of the NGOs and intervention has created opportunities for introducing demand-driven advisory services. FadamaIII is one of the projects providing demand-driven advisory service. The desire to realize the full potential of FADAMA resources in Nigeria led to the National Fadama Development Project, mainly funded by the World Bank, with counterpart funding by the Federal and benefiting State Governments Fadama III Project is a comprehensive five-year action program developed by the Federal Ministry of Agriculture & Water Resources (FMAWR) in close collaboration with the Federal Ministry of Environment(FME) and other federal and state government ministries, local governments and key

Nigerian Journal of Rural Sociology Vol. 15, No. 2, March 2015
35
stakeholders (donors, private operators, NGOs). The first Fadama project (Fadama I) focused exclusively on irrigation farming while both Fadama II and Fadama III are more of agricultural diversification programs, providing financing for the diverse livelihood activities which the beneficiaries themselves identify and design, with appropriate facilitation support. This goal is to be achieved through demand-responsive advisory services provided by a wide range of private NGOs and public service providers. According to International Development Agency (Iwala, 2014), the project was designed to focus on increasing the incomes of rural poor, the project will help reduce rural poverty, increase food security and contribute to the achievement of a key Millennium Development Goal (MDG). The project will finance the cost of training and mentoring activities including contracting consultant services in areas in which the ADPs lack the necessary expertise and production and provision of training materials (Fadama III Appraisal, 2008). Yet access to adequate knowledge, improved technologies, financial services and other relevant social services remains a critical issue (IFPRI–World Bank 2010). In order to improve the welfare and livelihood of the rural population intensive advisory services will be required (Davis and Heemskerk, 2012). However, results of these studies are generally viewed from the national and state perspectives in spite of the fact that the data were generated from the community level. This leaves a gap to be filled in the understanding the influence of advisory services on adoption of livestock technologies on the sheep and goat farmer groups in Akinyele and Lagelu Local Government Areas of Oyo state. The study therefore examined the personal characteristics of livestock farmers in the study area, determine their level of participation in advisory services activities, and determine the benefit derived by respondents from advisory services activities, identified the constraints to the adoption of the transferred technologies and examined their level of adoption of transferred technologies.
METHODOLOGY
Study area - The study was carried out in Akinyele Local Government Area (LGA) and Lagelu Local Government Area in Oyo State, Nigeria. Akinyele Local Government is one of the eleven Local Government Areas that make up Ibadan metropolis and shares boundaries with Afijo LG to the North, Lagelu LGA to the East, Ido LG to the West and Ibadan North LG to the South. It occupies a land area of 464.892 square kilometres with estimated population of 239,745 (National Population, Commission, 2006).Lagelu is a Local
Government Area in Oyo State, Nigeria with its headquarter at Iyana-offa and has an area of 338 square kilometre and a population of 147,957 (NPC, 2006) . Simple random sampling technique was used to select respondents for this study. Four Fadama Community Association (FCAs) were selected purposively out of five FCAs in Akinyele local government and four FCAs was selected from Lagelu local government. Each FCA consists of one FUG of sheep and goat farmers that consists of 20 members each in a group. Simple random sampling technique was used to select 10% out of 1200 registered FUG members to give a total sample size of 120 respondents. Quantitative data for the study were obtained with well structure interview schedule and data were analysed using descriptive and inferential statistics.
RESULTS AND DISCUSSION
Personal characteristics of respondents -
The results in Table 1 show that about one-third (34.2%) of the respondents were between the ages of 58- 66 years, 27.5% of the respondents fell between the ages of 49- 57 years, 27.5% of respondents were between age of 67-77 years, while only 10.8% were below 49 years of age with the mean age at 59.9 ± 8.5. This implies that the farming populace constitutes of older people. This finding collaborates with the study of Muhammed (2011) who reported that high proportion of the elderly people benefited from the Fadama project. Result from the study revealed that males were 71.7% of the respondents and females were 28.3%. This suggests that more males than females participated in the Fadama advisory service activities. This is consistent with Chukwuji (2013) who reported more male involvement in Fadama development project in their various studies. The result also shows that 85.8% of the respondents were married, 5% and 8.4% of respondents were divorced and widowed respectively, while only 0.8% were single. Table 1 further reveals that 21.7% had no form of formal education, 44.2% of the respondents had adult education, (18.3%) had primary education, and 15.8% of the respondents had secondary education while none of the respondents had a tertiary education. Although a majority of the respondents had a form of formal education (78.3%) yet none had beyond secondary education. This implies that there is a low level of education among the respondents, which can bring about low awareness and participation in Fadama programmes. The result also shows that 43.3% of the respondents were Christians while, 56.7% were Muslims which implies that the respondents belong to either of the major religion predominant in Nigeria. This is in line with Mohammed et.al (2014), who reported that religion is not a barrier in

Nigerian Journal of Rural Sociology Vol. 15, No. 2, March 2015
36
participating or benefitting from Fadama programme Table 1 Personal characteristics of farmers n=120 Variable Frequency Percentage
(%) Age (years) 40-48 13 10.8 49-57 33 27.5 58-66 41 34.2 67-77 33 27.5 Sex Male 86 71.7 Female 34 28.3 Marital status Single 1 0.8 Married 103 85.8 Divorced 6 5 Widowed 10 8.4 Education No formal education 26 21.7 Adult education 53 44.2 Primary education 22 18.3 Secondary education 19 15.8 Religion Christianity 52 43.3 Islam 68 56.7
Source: Field survey, 2014
Benefits derived from the advisory service
activities
Table 2 shows that a large proportion (98.3%) of the respondents reported that the project has given them room to interact with stakeholder like traders, research specialist (98.3%) claimed that they benefited from animal health information provided by advisory service. Other benefits derived from the advisory service activities as indicated by the respondents include; acquisition of input support(97.5%), workshop/ field day or field demonstration (91.7%), training and mentoring in technical and managerial skills on assets acquisition (90.8%), training material, learning and information (88.3%). This implies that the advisory services components were implemented to detail as proposed in comparison to the input support components which seem not to pass through the implementation manual.
Table 2: Frequency distribution of respondent’s benefits derived from the advisory service activities Services No
F (%) Yes F (%)
Mean Rank
Advisory service agent visit 28 (23.3) 92 (76.7) 0.77 7 Exposure to field experiment and market trail 61 (50.8) 59 (49.2) 0.49 9 Training and mentoring in technical and managerial skills on assets acquisition.
11 (9.2) 109 (90.8) 0.91 4
Provision of animal health information 4 (3.3) 116 (96.7) 0.97 2 Exposure to outside stakeholder like traders, research specialist.
2 (1.7) 118 (98.3) 0.98 1
Training material, learning and information provided by the advisory service agent.
14 (11.7) 106 (88.3) 0.88 6
Advisory service on small scale providers of input or output service
37 (30.8) 83 (69.2) 0.69 8
Workshop/ field day or field demonstration organized by advisory service agents.
10 (8.3) 110 (91.7) 0.91 4
Acquisition of input support 3 (2.5) 117 (97.5) 0.96 3 Grand mean 0.84
Participation of respondents in advisory services
activities
Table 3 reveals that 60% and 54.2% of the respondents participated frequently, in workshop/ field day or field demonstration and training and mentoring in technical and managerial skills
acquisition respectively. More than half (64.2%) claimed that they occasionally visit stakeholder like research specialist This implies that respondents participated in all the ASAs and their participation in ASAs could be attributed to the benefit derived from the activities.
Table 3: Frequency distribution of respondent’s participation of respondents in advisory services activities, n=120 Activities Frequently
F (%) Occasionally F (%)
Rarely F (%)
Not at all F (%)
Mean rank
market trail and field experiment
46 (38.3) 23 (19.2) 43(35.8) 8 (6.7) 1.89 5

Nigerian Journal of Rural Sociology Vol. 15, No. 2, March 2015
37
Activities Frequently F (%)
Occasionally F (%)
Rarely F (%)
Not at all F (%)
Mean rank
Workshop/ field day or field demonstration
72 (60.0) 42 (35.0) 6 (5.0) 2.55 1
Training and mentoring in technical and managerial skills acquisition.
65 (54.2) 46 (38.3) 9 (7.5) 2.47 2
Visit to outside stakeholder like research specialist
50 (41.7) 65 (54.2) 5 (4.2) 2.37 3
Advise on small scale local providers of input or output like feed seller, vaccine.
43 (35.8) 48 (40) 24 (20.8)
4 (3.3) 2.08 4
Constraints to adoption of the transferred
technologies
Table 4 shows lack of financial support to be most severe constraints facing majority (88.3%) of the respondents. This could limit the adoption of transferred technologies by the farmers..This corroborates with the findings of Ouma et. al.
(2006), who asserted that financial constraints affects the use of improved agricultural technologies by farmers. Farmers who have access to credit are more likely to adopt improved technology compared with farmers who don’t. This is because adoption of improved technologies may require extra resource commitment that can only be
met through acquisition of credit facilities. Lack of reliable and continuous technical assistance (62.9%) was ranked second. This could have negative effect on the adoption of innovations. Lack of pure breed for practice or testing of the respondents reported (49.2%) and untimely provision of medicine and vaccine (40.8%) also constituted severe constraint among farmers. However, 89.2% and 87.5% of the respondents claimed that knowledge about proper feeding and knowledge on animal health care respectively were not a constraint.
Table 4: Respondent’s constraints to the adoption of the transferred technologies Constraints Not a
constraint F (%)
Mild constraint F (%)
Severe constraint F (%)
Mean Rank
High cost of concentrated feed 58 (48.3) 55(45.8) 7 (5.8) 0.57 8 High cost of supplement 41 (34.2) 68 (56.7) 52 (9.2) 0.75 6 Lack of pure breed for practice or testing 33 (27.5) 28 (23.3) 59 (49.2) 1.21 3 Lack of knowledge on improved technology through training
33 (27.5) 34 (28.3) 53 (44.2) 1.17 5
Untimely provision of medicine, vaccine 24 (20) 49 (40.8) 47 (39.2) 1.19 4 Lack of health care services 56 (46.7) 53 (44.2) 11 (9.2) 0.63 7 Little or no knowledge about proper feeding and balance diet
107 (89.2) 12 (10.0) 1 (0.8) 0.12 10
Little knowledge on animal health care 105 (87.5) 13 (10.8) 2 (1.7) 0.14 9 Lack of reliable and continuous technical assistance
5 (4.2) 32 (26.7) 83 (69.2) 1.65 2
Lack of financial support 2 (1.7) 12 (10.0) 106 (88.3) 1.87 1
Rate of adoption by respondents
Table 5 shows that 90.8% of the respondents reported the use of bitter leaf to treat dysentery, 90.8% , 89.2% and 81.7%reported the use of pawpaw seeds to de-worm their animals and the use of Shea-butter plus salt as a control against mange and the use of fresh tobacco leaf as a control
for lice infection respectively. About 72.5% of the respondents reported the use of vaccine to prevent infection, 50.8% make use of antibiotic. The result also revealed that 99.2% do not advertise their enterprise on local newspaper, 94.2% do not make use of artificial insemination.
Table 5: Respondent’s adoption rate of improved technologies

Nigerian Journal of Rural Sociology Vol. 15, No. 2, March 2015
38
Adoption Technology or practice Not adopted Adopted but
stopped using Still using
Mean Rank
Use of pawpaw seeds to de-worm for goats and sheep
5 (4.2) 6 (5.0) 109 (90.8) 1.86 2
Use of Shea-butter plus salt as a control against mange in goats
6 (5.0) 7 (5.8) 107 (89.2) 1.84 3
Use of fresh tobacco leaf as a control for lice infection.
10 (8.3) 12 (10.0) 98 (81.7) 1.73 4
Use of deworming schedule 102 (85.0) 11 (9.2) 7 (5.8) 0.21 11 Record keeping 103 (85.8) 15 (12.5) 2 (1.7) 0.16 13 Dipping of cattle in Gammatex solution to control external parasite
106 (88.3) 5 (4.2) 9 (7.5) 0.19 12
Advertisement in local newspaper 119 (99.2) 1 (0.8) 0.02 15 Consulting veterinary doctor 11 (9.2) 20 (16.7) 89 (74.2) 1.65 6 Use of supplement and concentrated feed 29 (24.2) 19 (15.8) 72 (60.0) 1.36 8 Use of exotic breed 76 (63.83 14 (11.7) 30 (25.0) 0.62 10 Use of artificial insemination 113 (94.2) 5 (4.2) 2 (1.7) 0.08 14 Use of antibiotic 21 (17.5) 38 (31.7) 61 (50.8) 1.33 9 Use of vaccine to prevent infection 19 (15.8) 14 (11.7) 87 (72.5) 1.57 7 Use of bitter leaf to treat dysentery 3 (2.5) 8 (6.7) 109 (90.8) 1.88 1 Use of ground alligator pepper to cure mouth disease
12 (10.0) 8 (6.7) 100 (83.3) 1.73 4
Hypotheses testing
Significant relationship between the personal
characteristics of the respondents and level of
adoption of transferred technologies.
Results on Table 6 reveals that respondents’ sex (ᵪ2= 13.43), educational status (ᵪ2=24.92), marital status (ᵪ2=25.03) and age of respondents (r=-0.18) were significantly related to the level of adoption of transferred technologies. However respondent’s religion (ᵪ2=0.147) was not
significantly related to adoption of transferred technologies. This implies that respondents’ sex, educational status and marital status of respondents influence their adoption of transferred technologies, while the religion of respondents did not influence their adoption of transferred technologies. This corroborates the findings of Zanu (2012) that respondents’ sex, educational status and marital status influences their adoption of technology.
Table 6: Relationship between respondents’’ sex, educational qualification, religion, marital status and adoption of transferred technologies Variables N χ2-
value r-values
df p-value
Decision
Sex 120 13.43 1 0.00 Significant Highest Educational qualification 120 24.92 3 0.00 Significant Religion 120 0.147 1 0.701 Not-
significant Marital status 120 25.03 3 0.00 Significant Level of Significance = 0.05. r = correlation coefficient, p = probability
Table 7: Relationship between respondents’ age and adoption of transferred technologies Variables r p Decision Age -0.18 0.049 Significant
Relationship between respondent’s participation
in advisory services activities and adoption of
transferred technologies
Information on Table 8 reveals that there is a significant relationship between participation in advisory services activities and adoption of transferred technologies (r=0.010). This implies that participation in advisory service activities
influenced their adoption of transferred technologies. Table 8: PPMC Analysis of respondent’s participation in training and adoption of technology
Variable N r-value p-value Decision Participation 120 0.601 0.00 Significant
Level of Significance = 0.05. CONCLUSION Based on the findings of this study, it can be concluded that most of the respondents were males, married and literate. Lack of financial support were the major constraints to adoption of improved technologies. Most of the respondents reported a

Nigerian Journal of Rural Sociology Vol. 15, No. 2, March 2015
39
high level of participation in advisory services being related to high level of adoption of transferred technologies. Respondents’ sex, educational status, marital status and age significantly influenced the level of adoption of transferred technologies. Notable constraints of respondents which are little or no knowledge about proper feeding and balance diet, little knowledge on animal health care, high cost of concentrated feed didn’t influence the adoption of transferred technologies as participation in advisory services activities and benefits derived from advisory services activities with determined adoption of the transferred technology.
RECOMMENDATIONS
Based on the conclusions of the study, the following recommendations are made: • Advisory services agents should encourage
these participants to form or join co-operative societies so that they can synergize resources together to meet their needs.
• There should be increase in awareness about the benefits of advisory services activities to farmers so as to encourage increased participation in advisory services activities in the state.
• Inputs should be made accessible and available to beneficiaries so that they can be encouraged to implement the advisory services they have benefited from.
REFERENCES Chukwuji. C. O.(2013). Increasing crop output
through Improved Technology Adoption: The Fadama III Approach in Delta State, Nigeria. Asianjournal of Agricultural and
Rural Development. 3(6) pp 400- 411 Davis, K et al. 2011. Impact of farmer field schools
on agricultural productivity and poverty in East Africa. World Development 40(2): 402–413.
Davis, K. and Heemskerk, W. (2012). Investment in Extension and Advisory Services as
part of Agricultural Innovation Systems. Module 3 of agricultural innovation systems: an Investment Sourcebook. Washington, DC: The World Bank. Fadama III (Third National Fadama Development Project) (2009): Advisory Services and Input Support Manual no. 5. p6.
Iwala, O.S. (2014). Economic impact, viability and sustainability of Fadama III small-scale community-owned infrastructure in Ondo State, Nigeria. American Journal of
Research Communication, 2014, 2(5): 60-70} www.usa-journals.com, ISSN: 2325-4076.
Mohammed, M.I. (2014). Impact of Second Fadama Development Project on Income and Wealth of Crop Farmers in Niger State, Nigeria. International journal of
Agricultural science, vol. 4(4):224- 234.
Ouma, J.O., De Groot, H. and Owour, O.(2006). Determinants of Improved MaizeSeed and Fertilizer Use in Kenya: Policy Implications. Paper presented at the International Association of Agricultural Economists’ Conference, Gold Coast, Australia.
Ozor, N., Agwu, A., Chukwuone, N., Madukwe, M. & Garforth C. (2007). Cos oft-sharing agricultural technology transfers in Nigeria: perceptions of farmers and extension
Swanson, B. 2008. Global Review of Good Agricultural Extension and Advisory Service Practices. Rome: FAO.
Third National Fadama Development Project (Fadama III), Volume 1: project implementation manual (PIM), 2009
Zanu, H.K, Antiwiwaa, A., and Agyemang C.T. (2012). Factors influencing technology adoption among pig farmers in Ashanti region of Ghana. Journal of Agricultural Technology.
Nigerian Journal of Rural Sociology Vol. 15, No. 2, March 2015
40
INFLUENCE OF SOCIO-ECONOMIC CHARACTERISTICS ON PARTICIPATION IN FADAMA II
PROJECT IN EKITI LOCAL GOVERNMENT AREA, KWARA STATE IN NIGERIA 1Adewumi I. I. and 2Okunade E. O
1Agricultural Education Department, College of Education, Oro Kwara State 2Agricultural Extension and Rural Development Department, Ladoke Akintola University of Technology,
Ogbomoso E--mail: [email protected], [email protected]
ABSTRACT
This study was carried out to determine the influence of socio – economic characteristics on farmers’ level of
participation in Fadama II. A multi-stage sampling procedure was adopted to select 244 respondents from all
the wards in Ekiti Local Government Area (L. G. A). Validated structured interview schedule was used to collect
relevant information from the respondents. Descriptive statistical tools such as frequency, percentage and mean
were used to analyze the data, while Pearson Product Moment correlation (PPMC) was used to test the
hypothesis. Results showed that about (71.0 %) of the respondents were between the age range of 41 and 50
years, male (71.0%), female (29%) and also the findings revealed that most of the farmers participated in
formation of Fadama User Group (FUG) and payment of charges in establishment of Fadama Community
Association (FCA) which ranked highest with (WMS =2.30). Majority of the respondents (72.5%) participated
in the project at moderate level. Payment of counterpart fund by the participants was found to be a major
constraint in participating in Fadama II project in the study area. A positive and significant relationship exists
between socio-economic characteristics such as age (r = 0.114, p- =0.076), Household size (r = 0.219** p=
0.001), years of schooling (r =- 0.205**), p=0.001) as well as farms size (r =0.018** p=0.779), and level of
participation in Fadama II project. Socio-economic characteristics influence participation in Fadama II
project. Rural farmers should be strengthened along with their significant variables in order to encourage more
participation to ensure continuity and sustainability of the project.
Key words: Socio-economic characteristics, Fadama, participation
INTRODUCTION
Nigeria is the largest most populous in Sub-Sahara Africa (SSA) with a population of about 160 million or about one-fifth of the total population of the region. Nigeria is also an oil exporter and the second largest economy in SSA with a Gross Domestic Product (GDP) of $55.56 billion in 2011 with its reserves of human and natural resources. Nigeria has the potential to build a prosperous economy and provide for the basic needs of all of the populace but today Nigeria story has not really changed since 1970, when she became an importer of food due largely to the neglect of the agricultural sector after the country experienced the first oil windfall in 1973/1974 and inconsistencies in government agricultural policies. Egbuna [2001] is of the view that apart from Nigeria being a food deficit nation, the country is characterized by escalating food prices due to food scarcity and post-harvest loses. Due to this, different agricultural policies have been operated by different administration like the Operation Feed the Nation (OFN), the Green Revolution programme (GR), Better Life for rural Development (BLD), Directorate of Food Roads and Rural Infrastructure (DFRRI) and Fadama project. In spite of all these efforts, the country is still battling with food crisis and millions who are most vulnerable face starvation and food shortages, while the prices of all varieties of items spiral upward every day (Oladimeji and Karim, 2009). Nigeria citizens are hungry and the cost of meeting
basic food needs is prohibitive “He opined that the problems of hunger and malnutrition in the country are more severe now than ever before. Okunade (2009) reported that about 65 percent of Nigerians are food insecure which makes her to be ranked 20th on the 2006 Global Hunger index. It means that majority of the citizens lack access to the amount and variety of food for a healthy and productive life. Lawal and Omotosho (2004) asserted that food security remains a cardinal goal of governments globally because only a food secure population can participate meaningfully in economic activity in both agrarian and industrial settings. An obvious way of achieving this is to enable poor farmers to increase their agricultural output so as not only to improve their income but to lift them above the subsistence level. He stressed that to guarantee national food security, there is need to have supplementary irrigation for the year round cropping season to ensure food production in the country. This was how the policy on Fadama project came to be and adopted (CDD) approach in implementing the project objectives. Hence, this study sought to assess the influence of socio-economic characteristics on participation in Fadama II project. The Specific objectives were to: i. identify the socio-economic characteristic of
Fadama II farmers in the study area; ii. assess the levels of farmers participation in
Fadama II project. The null hypothesis was set for the study:

Nigerian Journal of Rural Sociology Vol. 15, No. 2, March 2015
41
There is no significant relationship between socio-economic characteristics of Fadama farmers and their level of participation in Fadama II.
METHODOLOGY
The study was carried out in Ekiti Local Government Area in Kwara State, Nigeria. Four wards out of 8 wards were randomly selected for the study. In each of the selected wards, four villages were randomly selected and from each of the chosen village 61 respondents were selected to give a total sample size of 244 for the study. A well-structured and validated interview schedule was used to collect relevant information from respondents. Information was collected on the socio-economic status of the farmers and their levels of farmers’ participation in Fadama II project Analysis of the data was carried out using frequency counts, percentage and weighted mean score. While Pearson’s Product Moment Correlation (PPMC) was used to test the hypothesis.
RESULT AND DISCUSSION
Socio-economic characteristics
The results in Table 1 shows that about 49 percent of the Fadama II farmers were within the age range of 41-50 years, 36 percent of the respondent fell within the age of 51-60 years, 11 percent fell within age range of 31-40 years, while only 1.1 percent was above 60 years. The result shows that Fadama farmers that participated in Fadama II project in the study area were middle aged, still physically active and agile in the performance of the arduous task required for farming activities. In essence, they would be valuable with significant effect on their productivity. This conforms to Oladosu and Okunade (2004) that only participation of people who were energetic, creative, innovative, productive and committed brings about the expected development in agriculture. It was also revealed that 71.0 percent of the respondents were male while 29.0 percent were female. This is an indication that more male participated in Fadama II project than their female counterparts. The low percentage of female participation may be due to those factors limiting their large scale production in agricultural sector. It was indicated that about 55.8 percent of the respondents were Christians, 40 percent were Muslims while 4.2 percent were Traditional religion worshippers. This implies that all the respondents in the study area placed their beliefs in one religion or the other. The result shows that 40.9 percent of the respondents had 6- 9 years of farming experience; 32.4 percent had 1-3years farming experience; 26.2 percent had 4-5years farming experience while
only 0.5 percent of respondents had above 10years farming experience. The implication is that they had acquired much Knowledge, Skill and Attitude (KSA) to enhance their productivity and also to be able to make useful contribution in Fadama activities. It was indicated that about 52 percent of the respondents had household of 4-6 members, 37.8 percent had household size of 1-3 members, 8 percent had 7-10 members while, 2 percent of the respondents had nobody with them i.e. they are single. This implies that majority of the respondent’s maintained large household size probably to ensure adequate supply of family labour for agricultural production. This is in line with the report of Meludu and Emerole (2009) which stated that large families appeared to participate more in local livelihood activities in order to cater for their family needs. Large family size may serve as an incentive for engaging in livelihood diversification in order to meet the obligation of the family It was also revealed that about 53.4 percent of the respondents had 12 years and above years of schooling, 26.9 percent had 1-6years of schooling, 12.9 percent did not have formal education, 4.4 percent had 7-9 years of schooling while 2.4 percent had 10-12 years of schooling. This may be due to the introduction of youth empowerment program that made graduate to be actively involved in farming. This is confirmed by Nwachukwu et al. (2008) who stated that farmers with more years of schooling tends to participate more in Fadama project than those with no formal education at all. The implication of this is that, it would be easier for most of the respondents to understand the advisory services through capacity building acquired as well as the training on record keeping. The result further revealed that 57.0 percent of the respondents had about 2 hectares of farm size under cultivation, 30.9 percent of the respondents had farm size of 2.1- 4 hectares, and 10.0 percent had farm size of above 6 hectares, while 2.0 percent had farm size of 4.1 – 6 hectares for agricultural production. The difference in the size of the farmland may be due to the capital availability and the need to cultivate other crops. The result implies that most of the Fadama farmers are still producing on small scale which is an indication that farming practices is still under subsistence production level. This reaffirms Ogunwale (2000) assertion that majority of our farmers’ still practices subsistence farming hence low productivity. It was revealed that 71.3 percent of respondents were married, 23.7 percent of respondents were separated, 2.4 percent were single, and 1.2 percent was divorced, while only 0.4 percent of the respondents were widowed. This

Nigerian Journal of Rural Sociology Vol. 15, No. 2, March 2015
42
implies that majority of the respondents were married which is a symbol of high level of responsibility and a great capability for sound decision making among Fadama farmers. Hence they were saddled with the responsibility of catering for the family, which may influence their involvement in multiple income generating activities (IGAs) to diversify their sources of income It was indicated that 53.4 percent of the respondents engaged solely in farming activities, 24.1% engaged in trading, 18.5 percent were civil servants, 1.6 percent engaged in artisan activities such as tailoring, carpentry and brick-laying, while, 0.4 percent of respondents engaged in other activities. This implies that Fadama II project cut across different Economic Interest Groups (EIG’s). Table 1: Distribution of respondents by socio-
economic characteristics N= 244
Socioeconomic characteristics
Frequency Percentage
Age (years) Below 30 7 2.9 31-40 26 11.0 41-50 120 49.0 51-60 87 36.0 Above 61 4 1.1 Gender Male 173 71.0 Female 71 29.0 Religion Christianity 139 55.8 Islam 97 40.0 Traditional 8 4.2 Years of farming
experience(years)
1-3
4-5
79 64
32.4 26.2
6-9 100 40.9 10 above 1 0.5 Household size 0 5 2.0 1-3 19 8.0 4-6 120 52.2 7-10 100 37.8 Years in schooling
(years) 32 12.9
0 1-6 67 26.9 7-9 11 4.4 10-12 51 2.4
Socioeconomic characteristics
Frequency Percentage
12 above 83 53.4 Farm size (hectares) 137 57.0 < 2 2.1- 4 77 30.9 4.1 - 6 > 6
5 25
2.1 10.0
Marital status Married 175 71.3 Separated Single Divorced
59 6 3
23.7 2.4 1.2
Widowed 1 1.4 Primary occupation Fanning Trading Civil servant
133 60 46
53.4 24.1 18.5
Artisan 4 3.6 Other activities 1 0.4
Source: Field Survey, 2013
Participation of the respondents in Fadama II
project The data in Table 2 show the rank order in the respondents' level of participation in Fadama II project, The results revealed that most of the farmers participated in the formation of FUG and payment of charges in establishment of FCA which were ranked highest with weighted mean score of (WMS = 2.30) respectively. This is closely followed by participation in decision making processes with WMS of 2.14. Others are in the following ranking order of participation in situation analysis (WMS = 2.08), membership to planning committee (WMS = 2.00), involvement in project implementation (WMS 1.86), participation in supervision of project (WMS = 1.80), record keeping at FUG/FCA level (WMS = 1.75). Attending seminars (WMS = 1.70), attendance at FUG/FCA meetings (WMS =1.49), mobilization of members to participate in project execution (WMS = 1.46) while registration of new members ranked least with (WMS = 1.15). This result therefore implies that Fadama II project encourages farmers to be involved in decision making on the matter that concerns them, hence their massive involvement in the different projects at both FCAs and FUGs level enhance their level of participation.
Table 2: Distribution of respondents by their level of participation in Fadama II project
Activities Very often
Often Rarely Not at all
Scores WMS
Participation in decision making 96(3) 86 (2) 61(1) 0(0) 511 2.14 Formation of FUG 128(3) 76(2) 27(1) 13(0) 563 2.30 Payment of charges in establishment of FCA
124(3) 81(2) 29(1) 10(0) 563 2.30

Nigerian Journal of Rural Sociology Vol. 15, No. 2, March 2015
43
Activities Very often
Often Rarely Not at all
Scores WMS
Attending seminars 61(3) 67(2) 99(1) 17(0) 416 1.70 Recording keeping at FUG/FCA level 37(3) 133(2) 51(1) 23(0) 428 1.75 Membership of planning committee 100(3) 61(2) 66(1) 17(0) 488 2.0 Supervision of project 45(3) 121(2) 63(1) 15(0) 440 1.80 Dispute resolution 11(3) 82(2) 126(1) 25(0) 323 1.32 Mobilization of members to participate in project execution
17(3) 88(2) 129(1) 10(0) 356 1.46
Involvement in project implementation 50(3) 125(2) 54(1) 14(0) 454 1.86 Registration of new members 122(1) 64(2) 30(1) 28(0) 280 1.15 Attendance at FUG/FCA 46(3) 44(2) 138(1) 16(0) 364 1.49 Situation analysis 134(3) 39(2) 29(1) 41(0) 509 2.08
Source: Field Survey, 2013
*Multiple responses
Level of participation in Fadama II
The results in Table 2 show the distribution of respondents based on their level of participation in Fadama II. 72.5 percent of the respondents participated at moderate level, 15.6% at high level while only (11.9%) at low level. The result therefore implies that, those respondents that participated at low level could be due to poor awareness about the project or the inability to pay counterpart fund by the farmers.
Table 2: Categorization levels in Fadama II participation of the respondents
Level of participation
Frequency Percentage
High 38 15.6 Moderate 177 72.5 Low Total
29 244
11.9 100.0
Source: field survey, 2013 Mean ( X ) = 25.08 S.D=3.17
Test of Hypothesis
Test of relationship between selected socio-
economic characteristics of Fadama farmers and
their level of participation in Fadama II
Table 3 shows the relationship between the socio-economic characteristics and farmers’ level of participation in Fadama II. The result shows that there is a positive and significant relationship between socio-economic characteristic (r=0.219) and farmers participation in Fadama II. There is also a significant but negative relationship between years of schooling (r= -0.208) and level of participation. However, a positive but insignificant relationship exists between years in occupation (r=0.118), age (r=0.114), farm size (r=0.018) and farmers’ participation. And also a negative and not significant relationship also exist between year of participation (r=-0.066) and farmers’ participation. The result implied that increase in the household size would enhance more participation in terms of
family labour availability to the respondents, hereby reducing the cost of production. However, the negative relationship in years of schooling implies a downward trend in their participation. The elites among the farmers may seem to depend more on hired labour to carry out farming activities which will therefore increase cost of production, hence the profit margin of the respondents. This development will seem to force many of them to cultivate limited area of land for production leading to low participation. Table 3: Relationship between the respondents’ socioeconomic characteristic and farmers’ participation in Fadama II project Socioeconomic characteristics
r-values p-values Remarks
Age 0.114 0.076 Not significant Year of participation - 0.066 0.305 Not significant Year in primary occupation
0.118 0.067 Not significant
Household size 0.219 0.001 Significant Years of schooling -0.205 0.001 Significant Farm Size 0.018 0.779 Not significant Source: Field survey, 2013
CONCLUSION
Based on the findings of the study, the following conclusions were made: Majority of the farmers are still in their active age which enhance their participation in the formation of FUG and payment of charges in establishment of FCA which were ranked highest with weighted mean score (wms = 2.30). It’s also revealed that their participation still at moderate level (72.5%) with only a few percent in low category (11.9 %.). The findings showed that socio- economic characteristics influence participation in Fadama II project .Rural farmers should be encouraged for more participation in order to ensure continuity and sustainability of the project.

Nigerian Journal of Rural Sociology Vol. 15, No. 2, March 2015
44
RECOMMENDATION
Based on the findings of the study, it is therefore recommended that there is still the need to sensitize the rural farmers to participate more in Fadama project in other to ensure continuity and sustainability.
REFERENCES
Egbuna, S. A. (2011) A comparative study of Fadama and non -Fadama crop farmers in Osisioma Ngwa Local Government Area, Abia State, Nigeria Journal of sustainable and tropical Agricultural Research 11, 75-80
Ikeola, R. F. (2008): Participation of Artisanal fisher folks in the second National Fadama Development Project. An unpublished M.Tech Thesis 66-70.
Lawal and Omotosho (2003): Evaluating anti-poverty programs policy research, no
Meludu, N. T. and Emerole, E. N. (2009): Enhancing Sustainable Participation in livelihood Activities by the refugees in Nigeria stud. Tribal 7 [2,131- 136].
Nwachukwu, I. N., Agwu, N. M., Eze, C. L,, Mbanaso, J. A., Onyenweaku, C. O. and Kamulu, C. E. (2008): Evaluation of
second National Fadama development project in Nigeria, a rapid appraisal, PP 7-13
Ogunwale, A. B. and Kuponiyi F. A. and Ayanwuyi, E. (2000): Sources of information on Poverty alleviation programmes among small-scale farmers in Ogbomoso agricultural Zone of Oyo State, Nigeria. Journal of Rural Reconstruction Development. Vol. 33(2) pp 38-45.
Okunade E. O. (2009): Nigeria Nation and the Problem of Food Security in the 21st Century: Way Forward. A Keynote Address delivered at 8th Regional Round Table on Economic Community Empowerment and Development. Pan-African Inspirational Leadership Conference, LAUTECH Press, Ogbomoso.
Oladimeji, and Karim, (2009): Assessment of nutritional value to food security in Nigeria pp 10-15
Oladosu, I.O and Okunade E.O (2004): Attitude of Undergraduates Students Toward Agriculture as a Future Career: A case study of two universities,
International Journal of African Culture and Ideals Vol.4 No 1 pg. 82-89

Nigerian Journal of Rural Sociology Vol. 15, No. 2, March 2015
45
MODERN BUILDING TECHNOLOGY AND LIVELIHOOD ADAPTATION AMONG MASONS IN
RURAL IBADAN
Liadi, O. F. Department of Sociology, Fountain University, Osogbo, Nigeria
E-mail: [email protected], [email protected] ABSTRACT
There have been several studies on the phenomenon of livelihood disturbances of rural farming households by
scholars. However, few have emphasized the significance of livelihood disturbances to non-farm economic
activities as a result of changing technology. This article examines livelihood adaptation practices among rural
masons in the face of challenges thrown up by the emergence of modern construction technology in 3 selected
rural communities in Ibadan. The data for the study was sourced through 24 in-depth interviews and 3 focus
group discussion sessions conducted among traditional rural masons in the selected rural communities of
Moniya, Lalupon and Aba-Nla in Ibadan. The result suggests that the shift occasioned by modern building
technology is experienced by low skill patronage, livelihood disturbance and income volatility among
traditional masons. Adaptive responses by the masons took two dimensions. While some masons chose to cope
by reverting to farming to survive, others opted to upgrade their skills from traditional knowledge to modern
construction technique. In conclusion, livelihood disturbance is real among rural masons and government
cannot afford to neglect the implication of this on rural poverty.
Keywords: Livelihood adaption, rural communities, masonry, building technology
INTRODUCTION
This article examines livelihood adaptation practices among rural masons in the face of challenges thrown up by the emergence of modern construction technology in rural areas in Ibadan. The research was prompted by two rather contemporary housing problems in rural communities. One, is the changing homeownership aspirations of rural dwellers (Ugonabo and Emoh, 2013; Agbola, 2005) which appear in favour of modern construction techniques. Two and more importantly is the concern about the socio-economic conditions of rural masons (known locally as Olomo) who are trained with and trade in indigenous construction techniques. Going by the rate at which traditional houses are replaced by modern construction designs and technology in rural areas (Raheem, 2011, Adesina, 2008) traditional masons would appear economically vulnerable. The question then of the extent to which contemporary homeownership aspirations in the Nigerian rural areas conform to traditional building technology may not be a question that requires much empirical details, but its effects on rural builders’ livelihood are imperative to understand and appreciate its dynamics on rural poverty. Thus, the concern (of this article) is not restricted to the emergence of modern building technology on the rural scenes; any more than arguing in support of continual use of traditional/pre-colonial building practices and technology without any significant upgrade. Rather, the purpose of the article is to (1) explore how rural traditional masons socially construct the challenge of loss of their livelihood as a consequence of change in technology of construction and (2) understand how they (rural masons) adapt to this social condition and the coping strategies employed to survive.
Literature on housing study has confirmed the gradual changing landscape of rural housing towards patronage of modern building technology (Atolagbe, 2010; Liangyong, 2009; Nguyen, 2007, Aluko, 2004). However, little scholarly interest has been directed at understanding any latent implications arising from widespread neglect of traditional materiality of construction one of which is how rural masons experience loss of livelihood. Meanwhile, other studies have shown that emergence of modern building technology has not always been beneficial to everyone in society. For instance, Tipple (2005) and Salazar (1999) argued that wherever it is introduced modern concrete technology has the tendency to weaken traditional building skills. Miles (2006) confirmed this as he argued that while modern building technology offers new tools and methods for construction of modern buildings, it also imposes the intrusion of modern masonry skills that appear to have “eroded the vitality of traditional building technology”. In Tipple’s (2005: 151) words, “with the growth of modernity, the traditional building system and division of labour had begun to break down” as newer technology emerged on local building industries around the world. Consequently, the ‘encroachment’ of modern construction technology in areas where indigenous building designs used to flourish would make the practitioners (traditional rural masons) appear to now exist in an “environment of risk and uncertainty” (O’Laughlin, 2002: 514) and must adapt by seeking alternative means to survive or wallow in poverty (Groeneward and Bulte, 2013; Paavola, 2008; Selvaraju, Subbiah, Baas and Juergens, 2006, Francis, 2002). In the rural livelihood field, sociological studies incorporating adaptation dimension, for instance, have mainly examined how rural farm

Nigerian Journal of Rural Sociology Vol. 15, No. 2, March 2015
46
households relate with the consequence of socio-economic change (Yaro, 2006). Chandy, Keenan, Petheram and Shepherd (2012) have investigated how introduction of hydropower project in Sikkim, a village in India, caused changes in land economy of the village; causing the conversion of agricultural land into roads, tunnels, buildings and other components of the projects. Chandy et al
(2012) described how development of the hydropower project forced much of the farm household of Sikkim community to abandon expanse of agricultural lands; losing the primary source of livelihood. While the project brought about some menial employment to some of the villagers, the capital inclined change associated with the project play what Chandy et al described as “livelihood vulnerability” (p. 123) for the farming households who lost arable farmlands but forced to adapt to low paying menial jobs provided by the hydropower project. Although most rural poor households face survival challenges, the nature and extent of vulnerability may depend on intensity of difficulties faced by individuals or group. Berman, Quinn and Paavola (2013) argue that coping strategies of rural households facing livelihood difficulties depend on different hazardous climatic conditions. The authors found livelihood vulnerability among the inhabitant of rural Uganda to be hazard specific. They also suggested that majority survive by investing their efforts in non-farm income generating activities such as market-trading, fishing and employment outside the village. Similar analytic descriptions have been used to elucidate the link between “vulnerability and poverty” (Philips and Rayhan, 2004), and migration as an alternative to livelihood strategy and as an “ex-ante risk management strategy” for rural poor (Osawe, 2013). Thus, research examining rural livelihood vulnerability has often acknowledged the link between poverty in rural areas and individual and collective adaptive capacity. Nevertheless, in Nigeria as elsewhere, the concern about the increasing reality of poor rural livelihood can be viewed as a subset of wider stakeholders’ concern for the endemic poverty in much of the country’s rural sector, intense out-migration of young people and the seemingly unchanging socio-economic conditions of rural youths (IFAD, 2015, Adepoju and Obayelu, 2013; Akpan, 2013). This has made scholars’ attention to be firmly placed on rural farm household’s poverty level, livelihood and survival techniques (Aferia, 2015; Ogbeide and Agu, 2015; Hong and Yun, 2014; Bury, 2004; Cook, 1988; McSweeny, 2004). But, while there is extensive literature in livelihood field especially on farming, fishery and other agricultural activities in coastal (Agbeja and Jenyo-Oni, 2013) and non-coastal rural areas, the present article contributes to
existing literature on livelihood adaption by shifting focus from how smallholders survive as a result of socio-economic changes to exploring a livelihood adaption of a group (rural mason) whose livelihood is not mainly farming. This may extend the utility of livelihood adaption construction in understanding how vulnerable rural non-farming households respond to economic and livelihood disturbances.
METHOD
In this study, the subject of traditional rural masons’ livelihood and livelihood adaptation was explored using in-depth interviews and focus group discussions with active and retired rural masons skilled in construction of indigenous Yoruba housing style. The study was conducted in three purposively selected rural communities in Ibadan – Moniya (Akinyele LGA), Lalupon (Lagelu LGA) and Aba-Nla (Oluyole LGA). These communities were chosen based on availability of a number of respondents needed to satisfy the objective of the study. However, the author was unable to ascertain the total number of traditional masons in the selected communities due to a number of factors including; lack of organisation and official data of practitioners of indigenous rural masonry as well as the absence of membership of a registered association. In other words, unlike their modern counterpart, traditional masons seem to have no association at least in the study area where the research was carried out. The reason for this may not be farfetched. It is a fact that most of the practitioners of indigenous rural masonry are very old and few, if any, young person today is aspiring to acquire the skills and technology of the trade leading it towards gradual extinction. Hence, the interviewees and discussants were selected through snowballing technique. The fieldwork was carried out between August and October 2012. In all 24 in-depth interviews and 3 focus group discussions (this consist of 7 indigenous masons on the average) were conducted to gather data used for the study. The respondents were chosen based on certain criteria including, 1) Age, 2) knowledge of the object of study, 3) their current social and economic engagements, and 4) their ability to be confirmed by other masons in the areas as active or veteran traditional masons. The selected traditional rural masons were asked to describe; technology and skills required; the influence of modern building technology and construction on their own means of livelihood and how they adapt to threats to their source of livelihood. Data derived from the narrative of the masons were content analysed.
RESULT AND DISCUSSION

Nigerian Journal of Rural Sociology Vol. 15, No. 2, March 2015
47
Here, we first describe rural masons’ understanding of how widespread neglect of indigenous technology by many rural inhabitants affects their source of livelihood. In this way, the socio-economic conditions of the participants and the ways in which declining patronage of their skills combine to challenge masons’ primary source of livelihood are discussed. The significance of livelihood adaptation mechanism adopted to circumvent this challenge is then considered. Modern Building Technology and Traditional
Masons’ Livelihood in Rural Ibadan
In spite of the rural nature of the study areas, observation reveals an increasing number of buildings constructed with modern construction technology. Houses built in concrete and hollow blocks are present everywhere. These buildings – modern houses built with cement and blocks – in all the study areas – sharply diverge from the scholarship on rural housing. Some housing and urban and regional planning scholars (for example, Ifesanya, 2007; Wahab, 2007), have attempted to present rural housing as mainly a system of construction based on traditional earth materials. Current construction situation in the selected communities however point to the contrary. Apparently rural community construction landscape has changed from what Wahab (2007) and Ifesanya (2007) reported with the existence of numerous completed and incomplete houses built with modern materials in these rural areas. The emergence of these buildings suggests a trend in construction activities that has largely moved away from the indigenous construction methods. As a matter of fact, all masons interviewed described building constructed with modern construction technology as the first choice of many inhabitants of their communities. Their views show sufficient understanding of the consequence of this situation in that they recognised the significance of this shift, although many of them expressed sadness at how this is affecting their livelihood: We are in modern times. Things are changing
and few people want to remember the past.
Personally, I feel the change in building mainly
from the point that I hardly get called to build
anymore. In the past, here (in Lalupon) I helped
built many houses and people requested for my
service as far as Ile-Igbon and Ejioku (communities
outside Lalupon). But because people now prefer to
build with cement blocks, hardly do people call for
my service these days.
Traditional Mason IDI/Lalupon, Lagelu LGA
(October 18, 2012) Available Federal Government statistics in Nigeria show that of the total population of housing units built with any kind of building materials, 38.46% are constructed with traditional/mud/reed
materials (FGN, 2007). The state wide data show lower figures especially in parts of Southwest, Nigeria. In Oyo state, for example, the total number of housing units recorded by the 2006 National Population and Housing Survey is 1,248,105 out of which only 26.8% is constructed with traditional materials. Naturally, and as scholars (see for example Wahab, 2007) are accustomed to show, the rural axis of the state are expected to house more dwellings constructed of what is commonly referred to as traditional materials. However, it appears that the tide of modern building technology has overtaken traditional material even in the rural areas. In the three local government areas where this study was carried out, the FGN (2007) figures for materials used for wall finishing are: Akinyele (Mud 25.7%; cement 70.95%), Lagelu (mud 29.7%, cement 65.57%) and Oluyole (mud 17.10%, cement 79.19%). Other housing materials such as the one adopted for flooring and roofing appear to have met with similar fate. The implication of the above scenario is that while modern masons are experiencing higher rates of demands for their skills, the older (traditional) masons are experiencing sharp decline in patronage. Majority of traditional builders confirmed this and view this circumstance as having adversely affected their livelihood and economic conditions. For example, a traditional mason explained that: Introduction of modern methods and tools of
building has greatly affected those of us who have
no other means of livelihood order than building
work. In this community, for example, the people
used to call on me to build new (traditional) houses
or amend the old ones for them. But now even if the
old ones (traditional houses) collapsed the owners
will rather call upon a bricklayer to help them
rebuild than call upon my skill. I only get called to
do some little repairs especially during the rainy
season from those who could not afford to build
modern type of houses. Traditional Mason IDI/Aba-Nla, Oluyole LGA
(August 15, 2012) Furthermore, in a focus group, pattern of discussion among discussants appear similar to the one offered by individual interviewees. More importantly, what they seem to be suggesting is the view that traditional rural masons’ main source of livelihood has been slowly eroded: Modernity has brought new method of
building. Bricklayers are those who have acquired
the new skills and knowledge that come with
modern method of building. For those of us who
could not have the modern skills of building, people
do not tend to call us any more for jobs. Except for
minor amendment, we hardly obtain any building
job throughout the year. Traditional Mason

Nigerian Journal of Rural Sociology Vol. 15, No. 2, March 2015
48
FGD/Moniya,Akinyele LGA (September 15,
2012). Osbahr, Twyman, Adger and Thomas (2008) assertions that both the onset of rapid and slow livelihood disturbance contribute to enduring poverty seems the case with the group of participants engaged in this study. The rural masons’ concerns about low patronage and the experience of income loss in turn underpin their view that the emergence of modern building technology and its widespread adoption by rural inhabitants was mainly responsible for the poor state of economic condition experienced by them. The rural masons are convinced about the fact that modern building technology is skill-biased since, according to them, completely different set of skills or techniques which they do not possess would be required to construct modern building. Consequently, the masons are worried about what literature has referred to as skill-biased technical change (Anagnostopoulos, Atesagaoglu and Carceles-Poveda, 2011; Ismail, 2009; Violante, 2008). The New Palgrave Dictionary of Economics (2015: 2) describes skill biased technical change as “a shift in the production technology that favours skilled labour over unskilled labour by increasing its...relative demand”. As far as modern house-building is concerned many of the traditional rural masons felt that they have been turned to ‘unskilled’ labour as they can no longer participate in its construction. This of course reflect the fact that when a technology becomes skill-biased it culminates in abandonment of older skills with dire consequences for labour who find it difficult to adapt to new set of skills that are required to function properly within same industry (Marouani and Nilsson, 2014; Fadinger and Mayr, 2012; Shi, 1999). Low Skill Patronage and Livelihood Adaptation
Mechanism by Rural Mason
The question to ask is what livelihood adaptation strategy (ies) are traditional rural masons affected by the shift in construction technology and low skill patronage employing to ensure continued survival? Traditional rural masons’ views suggest two unrelated patterns of actions. The first pattern of responses shows that faced with declining skill patronage and dwindling economic earnings, some of the traditional rural masons opted to augment their skill levels by consciously accepting to acquire modern construction skills through apprenticeship: Well what can I do? I only have few options in front of me. I either look for another means of livelihood or try to learn the new method of building. Although it was not easy, I decided to opt for the latter option. I went for retraining to become a modern bricklayer because people already know me as a builder. Traditional Mason IDI/Moniya,
Akinyele LGA (September 08, 2012).
Traditional rural masons also described in specific terms the kind of skills they have to acquire, suggestive of the tools and construction materials they need to learn to handle for them to be able to continue to be relevant among their peers in the industry. For many of this group of masons survival by readapting to their environment is the paramount concern: To survive, I had to go and learn how to build
with blocks. I learnt the use of trowel, plum and
range to be able to set and plaster blocks.
Traditional Mason IDI/Lalupon, Lagelu LGA
(October 18, 2012). To traditional rural masons declining preference for traditional building skills only left them with the option of flowing with the tide of modernity. But they also recognise that the root cause of their problem is outdated building skill/knowledge. All the livelihood disturbances they face are caused by the type of houses, construction materials and the attendant skill requirements. Thus, they appreciate the fact that their continuing relevance, if not survival, depends on understanding how to build houses using modern construction technology. When the traditional rural masons begin to speak about this it was clear that they seem not to mind the fact that this would require them to acquire ‘new’ skill, process and technical capability of building distinct from the ones hitherto possessed by them. When I discovered that within my community
my skills and building knowledge was no longer
relevant to what the people want I decided to
become a bricklayer.
Traditional Mason IDI/Lalupon, Lagelu LGA
(October 18, 2012). In accepting to acquire modern knowledge of construction, the traditional masons have sharply aligned with the conventional wisdom of the Yoruba people who say: bi esin badani a tungu ni
(one only needs to remount a horse following a fall from its back). The action of the masons is also a rational action, because scholars have also stressed the fact that human survives, in the face of mundane and spiritual challenges, by self-reinvention (Berker, 2011). For the rural masons, their reinventions (adaptation mechanism) take the shape of skill upgrade. The decision to opt for retraining and skill upgrade to the more conventional construction skills is to provide the masons with a widened job horizons and economic scope. This adaptive mechanism appears to offer the traditional rural masons a somewhat extended opportunity to obtain construction jobs within both traditional and modern built environments. However, the questions are, how did they acquire this new skill? From where/whom did they learn? Did they earn any other type of income during retraining? Or how did they take care of their

Nigerian Journal of Rural Sociology Vol. 15, No. 2, March 2015
49
family? The following quotes help clarify these questions: I was already a matured man (aged 34) with a
large responsibility when I decided to go and learn
bricklaying method of building. I just decided to
learn the trade by myself to escape from becoming
a social miscreant. Even when I told my mother she
scornfully said it was too late. But then I contacted
my friend who was a bricklayer and told him that I
was coming to learn the trade and he agreed. So he
took me under him as his apprentice but I was
always going back to my family in the evening after
the day’s work has ended.
In-depth interview/Moniya, Akinyele LGA
(September 08, 2012) When probed if he was earning anything while the training lasted, he says: Well yes. In fact I was not really treated the way a
new apprentice is always treated in the job. This
may be because I already have knowledge of
building and have been building and earning
before I decided to go for retraining. At the end of
the day’s job I was always given some reasonable
amount of money to take home.
In-depth Interview/Moniya, Akinyele LGA
(September 08, 2012) There are questions to be asked about the picture the interviewee attempts to paint about his retraining experiences. This is because his views suggest that the process and social relation of retraining between those who already had prior experiences in building (even when such knowledge and skills are in traditional type of building) and the modern master (from whom they now have to learn the rudiments of modern masonry techniques) are always smooth. So the question is: was the seemingly ‘smooth experience’ that this interviewee holds a result of the facts that he had prior “knowledge of building and have been building” before opting for retraining? Or was his cordiality with his master a function of his familiarity/friendship with his supposed ‘master’? This question is asked because although prior knowledge may be an important asset that such trainee brings into the new social relations, it may not be enough condition to guarantee smooth or hectic free and non exploitative relations between him and his master. In fact, if there was no prior friendship bond between the two, it is possible that the nature of social relations between these social actors may only be a little less than the ones entered into between young and inexperienced apprentices and master masons. This is because as one interviewee explains, it was a challenge for a master mason to revert to becoming an apprentice: At the time of my converting to bricklaying,
there was nobody in this (Lalupon) community who
had the capacity to build with modern bricklaying
knowledge. So there was little option left for me but
to go to Ibadan since I have decided to learn the work. My uncle who lived in Ibadan was a
carpenter; it was through him that I met my master
who then was living at Beere area. But there were
many challenges. It was not easy because to
change from someone who is a master (oga) to
someone who has become an apprentice is not
easy. It took courage and perseverance.
In-depth Interview/Lalupon, Lagelu LGA
(October 10, 2012) When I asked this interviewee to describe specific challenges he faced, he offered this: To start with, until after six months since I became
an apprentice under my oga (master) did he decide
to start giving me some little amount of money.
Prior to this time, he never ventured to offer me
anything at the end of a day’s work. Though he was
aware that I was married and that I had been
building in the traditional ways, he decided to treat
me like any other apprentice. This was initially
hard for me to take particularly because I have a
family to which I have the responsibilities to take
care. So this (lack of regular income) affected me
and my family a lot. The saving grace at this time
was that we all lived on my wife’s earnings as she
was a trader in kola nut.
In-depth Interview/Lalupon, Lagelu LGA
(October 10, 2012 The above information suggests that the decision to stick with building was essentially economic survival in nature. This conclusion becomes obvious with the fact that everyone of the masons was already married; with family responsibilities at the time they decided to go for retraining. Also, they all faced the same question on their future. They had concerns on the future prospects of their occupation as well as how to financially care for their family. Perhaps, this concern played a pivotal role in their decision to stick with what they knew how to do even if they had to shift focus to the modern aspect of housing construction. Nevertheless, the above descriptions further show that traditional rural masons that took the option of going for retraining encountered different experiences. While the general pattern of responses tells a story of challenges and difficulties, others seem to have soothing experiences. In other words, although they all had prior building experiences in traditional building system, their retraining experiences (in terms of social and economic relations with their masters) differ. Consequently, pattern of social relations during the process of retraining between the master and apprentice appears to be based on how respondents became an ‘apprentice’. In this case, the network of kin or familiar relation is an important factor to be considered. Those who had prior kin/friendly relations with those they learnt from expressed less

Nigerian Journal of Rural Sociology Vol. 15, No. 2, March 2015
50
stressful experiences. Cordial social and economic relations, with their masters, were reported. The case (experience) however appears different with those who encountered their master on a more neutral ground. The second pattern of action taken by traditional rural masons whose skills are in less demand – and who could not avoid the option of skill upgrade – suggests a return to farming or other vocations to earn a living. According to an interviewee: Since I have no capacity to build modern type
of houses, there has been a little work for me in
construction. And this is not just me, many of us
(traditional builders) who could not go for
retraining have returned to the village. Many of us
have family responsibilities; we have to provide for
our wives and children, so it is difficult to go and
start some kind of training now. Therefore, many of
us have to go back to farming in the village.
Traditional Mason IDI/Lalupon, Lagelu LGA
(October 14, 2012) Another interviewee supports this statement by equally saying that: Look at me will it be normal for me to go and start
learning how to build with modern equipments at
this age? Where will I start from? Well to answer
your question, I go to my farm every morning; that
is what I do now to cater for me and members of
my family. Traditional Mason IDI/Aba-Nla, Oluyole LGA
(August 14, 2012 Yet another said: Well, personally I do not see why people should not
go for retraining if they still have the strength to
continue with house building work. You can only
sell your wares if that is what the people want to
buy. You cannot force them to buy what you sell
especially if that is not what they desire. So I think
for those who still have the power to retrain I will
say good for them. But for me, I am too old for
building work. So the issue of retraining is not for
me. What I do now is farming. Traditional Mason IDI/Moniya, Akinyele LGA
(September 5, 2012 The above statements show the second coping option adopted by traditional masons (those who could not upgrade their skills) to cope with dwindling economic position as a result of decreasing demand for their skills. In this case, masons’ opinions show that they had to return to farming to cope with the problem of declining demand for their services and that of dwindling financial wherewithal. This category of masons appears to have totally abandoned construction work for other means of survival. An important factor which aids this action is age. Many of those who opined that they moved on to farming are relatively older and more aged than those who took the option of skills upgrade. In their opinions, it
seems unwise or ‘abnormal’ for them to go for any kind of modern training considering their age. Hence, returning to farming appears a rational choice for them since the combination of lack of strength for the job and declining demand for traditional building lead to erosion of good financial standing. Therefore, beyond economic survival – as a decisional factor – other factors such as old age and weak strengths are prime motives and deciding factors which shape this course of action among this category of masons.
CONCLUSION
The article analysed livelihood adaptation among traditional masons in selected rural communities in Ibadan, Nigeria. Using a qualitative approach by which we explored the adaptive responses of traditional rural masons to threat posed by low skill patronage, we are able to demonstrate that livelihood adaptation is a reality in the context of traditional rural masons in Ibadan. Adaptive responses by the masons took two dimensions. While some masons chose to cope by reverting to farming to ensure continuous survival, others opted to upgrade their skills from traditional knowledge to modern construction technique. For the first group, factors of age and strength are major setbacks even if they desire to upgrade and continue in the building profession. The second group however who happened to be relatively younger in age mostly reported that they opted to acquire the skills to participate in modern construction system. This result leads to the conclusion that: 1. Traditional rural masons experience livelihood
disturbances (as a result of low skill patronage) because of lack of capacity to engage in modern construction system which is becoming widespread in the selected rural areas.
2. Younger rural masons with the capacity to construct traditional housing but who are still interested in building practice are rather opting to upgrade their construction skills than reverting to farming as source of livelihood.
3. Finally, whatever livelihood adaptation adopted by traditional rural masons to ride out of the storm of modern construction technology on their livelihood, it is clear that the society cannot afford the luxury of having to neglect non-farming craftsmen such as traditional masons to their fate.
It is thus not too wide off mark to suggest that traditional rural masons will benefit a great deal from conscious attempt to embrace modern construction technology, enhance their current skill level and old construction methods to suit or conform to current housing aspirations/realities in their communities. This of course is not to suggest a complete abandonment of traditional construction

Nigerian Journal of Rural Sociology Vol. 15, No. 2, March 2015
51
methods and uncritical acceptance of modern techniques and technology of building, but that a conscious effort to acquire conventional construction skills in addition to old methods will, to a large extent, improve patronage and economic wellbeing since they will have wider market horizons and capacity in more than traditional form of construction. But this cannot be easy without some assistance to augment any financial difficulties that masons willing to acquire new skills may initially have to face. To promote skill upgrade through retraining among traditional rural masons, the Federal Government of Nigeria may need to: 1. Widen the scope of its current social safety net
programmes to capture traditional rural masons willing to undertake retraining. Since retraining may involve becoming an apprentice again to acquire necessary/modern skill of construction (this may be discouraging because of the financial implications that may accompany such action). It is therefore imperative for the Nigerian government to encourage or induce the interest of traditional rural masons by offering support (financially and technically) during retraining period. Such incentive will go a long way in solving some of the financial concerns of traditional masons wishing to migrate from traditional masonry to modern construction system.
2. Establish modern vocational schools equipped with necessary tools and experts in rural communities to aid easy access to modern technical masonry knowledge. One of the challenges that may be faced by masons willing to upgrade their skill is where to acquire the knowledge. Presently few, if any, rural communities have any established vocational training centre within the shortest distance. It may not be convenient or easy to move back and forth (that is from town where they learn and back to the village where they live). It is important to note that establishing rural vocational schools could form an integral part of integrated rural development. Finally this has the benefit of stemming rural-urban migration of manpower required for rural development.
REFERENCE
Adepoju, A.O. and Obayelu, O.A. (2013). Livelihood Diversification and Welfare of Rural Households in Ondo State, Nigeria. Journal of Development and Agricultural
Economics, 5(12): 482-489 Adesina, K. A. 2008. Indigenous Building
Artisans’ Roles in Pro-Poor Housing Development in Peri-Urban Communities in Ibadan. M.Sc. Project. Department of
Urban and Regional Planning, University of Ibadan. xvii+95pp.
Aferia, N. (2015). Determinants of Poverty in Rural Tigray: Ethiopia Evidence from Rural Households of Gulomekeda Wereda. Journal of Poverty, Investments and
Development, 10: 95-103. Agbeja, Y.E. and Jenyo-Oni, A. (2013) Enhancing
Sustainable Livelihood in the Management of Nigerian Coastal Fisheries. Nigerian Journal of Rural
Sociology, 13(3): 44-55. Agbola,S.B. 2005. Housing Debacle, Inaugural
Lecture Delivered at the University of Ibadan.
Akpan, N. (2013) Perspective on Changing Rural Social Organisation, Structures and Institutions and Implications for Agricultural Development Strategies in Sub-Sahara Africa. Proceedings of the 22nd Annual National Congress of the Nigerian held at University of Uyo between 1st-4th October, 2013, pp. 15-24.
Aluko, O. 2004. Housing and Urban Development
in Nigeria. Ibadan: Kins Publication Series.
Anagnostopoulos, A., Atesagaoglu, O.E. and Carceles-Poveda, E. 2013. Skill Biased Technological Change and Home Ownership. Elsevier 37.12: 3012-3033.
Atolagbe, A.M.O., 2010. The Third World Option in a Globalized Building Materials Market: The Nigeria Case Study, Ethiopian Journal of Environmental
Studies and Management 2.2:84-91. Berker, T. 2011. Domesticating Space:
Sociotechnical Studies and the Built Environment, Space and Culture, 14: 259-268.
Berman, R., Quinn C. and Paavola, J. (2013) Indentifying Drivers of Household Coping Strategies to Multiple Climatic Hazards in Western Uganda: Implication for Adapting to Future Climate Change. Center for Climate Change Economics
and Policy Working. Paper No. 4. Online: www.see.leeds.ac.uk/sri 30/12/2015
Chandy, T. Keenan, R.J. Petheram, R.J. and Shepherd, P. (2012). Impacts of Hydropower Development on Rural Livelihood Sustainability in Sikkim, India: Community Perceptions. Mountain
Research and Development, 32(2): 117-125.
Fadinger, H. and Mayr, K. (2012). Skill-Biased Technological Change, Unemployment and Brain Drain. Online: www.afd.fr/webdav/share/PORTAL/...2012.
Nigerian Journal of Rural Sociology Vol. 15, No. 2, March 2015
52
Federal Government of Nigeria (FGN). Official Gazette 4(94), January 2007. Available online: hhtp://www.population.gov.ng/pop_figure.pdf Accessed on 20/12/2012.
Francis, E. (2002). Rural Livelihoods, Institutions and Vulnerability in North West Province, South Africa. Journal of Southern African
Society, 28(3): 531-550. Groeneward, S.F. and Bulte, E. (2013). Trust and
Livelihood Adaption: Evidence from Rural Mexico. Agriculture and Human
Values, 30: 41-55. Hong, Y. and Yun, Y. (2014). Study on Status on
Rural Poverty Relief Development in Western China and Counter Measures in New Period: Taking Yibin, in Sichuan Providence as an Example. Canadian
Social Science, 10(2), 164-170. Ifesanya, A.O. 2007. Building Material Production
and Use. Agbola, T., Egunjobi, L. and Olatubara, L.O. Eds. Housing
Development and Management: A Book of
Readings: Ibadan: Malijoe Softprint. Chapter 10: 310-349.
IFAD (2015). Investing in Rural People of Nigeria. Online: www.ifad.ord/operations/.../pa/.../ng.pdf 25/12/2015
Ismail, R. 2009. Technical Efficiency, Technical Change and Demand for Skills in Malaysian Food-Based Industry. European Journal of Social Sciences. 9.3: 504-515.
Liangyong, W. 2009. Look Forward to the Architecture of the New Millennium. Proceedings of the 4th International Conference of the international Forum of Urbanism. Amsterdam
Marouani, M.A. and Nilsson, B. (2014). The Labour Market Effect of Skill-Biased Technological Change in Malaysia. Online: www.iza.org/conference_files/wordb2014/marouani_m6002.pdf 03/11/2015
Miles M. 2006. Utopias of Mud? Hassan Fathy and Alternative Modernisms. Space and
Culture 9:115-139 New Palgrave Dictionary of Economics (second
edition). Palgrave. Available online: www.dictionaryofeconomics.com/article 25/12/2015.
Nguyen, H.M. 2007. Cultural Sustainability in the Architectural Development of Viet Nam. Proceeding of International Conference on Sustainable Architectural Design and Urban Planning, Hanoi Architectural University, May 15-16, 2007, Hanoi, Vietnam.
Ogbeide, E.N.O. and Agu, D.O. (2015). Poverty and Income Inequality in Nigeria: Any Causality? Asian Economic and Financial
Review, 5(3): 439-452. O’Laughlin, B. (2002). Prolitarialisation, Agency
and Changing Rural Livelihoods: Forced Labour and Resistance in Colonial Mozambique. Journal of Southern African
Society, 28(3): 511-530. Osawe, O.W. (2013). Livelihood Vulnerabiltiyand
Migration Decision-Making Nexus: Case Study from Rural Households in Nigeria. Journal of Humanities and Social
Sciences, 16(5): 22-34. Osbahr, H., Twyman, C., Adger, W.N. and
Thomas, D.S.G. (2008). Effective Livelihood Adaptation to Climate Change Disturbance: Scale Dimensions of Practice in Mozambique. Geoforum, 39 (6): 1951-1964.
Paavola, J. (2008). Livelihoods, Vulnerability and Adaption to Climate Change in Morogoro, Tanzania. Environmental Science and
Policy, 11(7): 642-654. Philips, B. and Rayhan, I. (2004). Vulnerability and
Poverty: What are the Causes and How are they Related? Unpublished Paper. Center for Development Research Paper, University of Bonn. Online: www.zef.de/fileadmin/downloads/forum/.../2004_3a_Philips_Rayan.pdf 10/11/2015
Raheem, H.O. 2011. Indigenous Knowledge and Rural Housing Development in Ona-Ara Local Government Area of Oyo State, Nigeria. M.Sc. Project. Department of Urban and Regional Planning, University of Ibadan.
Ugonabo, C.U. and Emoh, F. I. (2013). The Major Challenges to Housing Delivery in Anambra State of Nigeria. Civil and
Environmental Research,3(4): 1-20. Salazar, A. 1999.Disaster, the World Bank and
Participation: Relocation Housing after the 1993 earthquake in Maharashtra, India. Third World Planning Review 21.1:83-108.
Selvaraju, R. Subbiah, A.R. Baas, S. and Juergens, I. (2006). Livelihood Adaption to Climate
Vulnerability and Change in Drought-
Prone Areas of Bangladesh: Developing
Institutions and Options. Rome: FAO. Shi, S. (1999). Unskilled workers in an Economy
with Skill Biased Technology. Position Paper. Published by Centre for Research on Economic Flunctuations and Employment, University of Quebec, Montreal, Canada. Online: www.homes.chass.utoronto.ca/~shouyong/shi1/wskill4.pdf

Nigerian Journal of Rural Sociology Vol. 15, No. 2, March 2015
53
Tipple, G. 2005. The role of concrete in low-cost housing in Africa: a cautionary note. Keynote Paper. Proceedings of the 1st African concrete code symposium, Tripoli, Libya. 28-29, November. 145-155.
Violante, G. L. 2008. Skill-Biased Technical
Change. The New Palgrave Dictionary of
Economics. 2nd edn. New York. Palgrave Macmillian
Wahab, B., 2007. Elements of Rural Housing, in Agbola, T., Egunjobi, L. and Olatubara, L.O. (eds) Housing Development and
Management: A Book of Readings: Ibadan: Malijoe Softprint. Chapter 13: 419-498.

Nigerian Journal of Rural Sociology Vol. 15, No. 2, March 2015
54
MOTIVATIONAL NEEDS OF EARLY CAREER AGRICULTURE LECTURERS IN RIVERS AND
IMO STATE OF NIGERIA
Ifeanyi-obi, C. C. and Enyindah, F. Department of Agricultural Economics and Extension, University of Port Harcourt
E-mail: [email protected], [email protected] ABSTRACT
The study identified the motivational needs of early career agriculture lecturers in Rivers and Imo States of
Nigeria. Specifically, it determined the socio-economic characteristics of early career agriculture lecturers,
identified their motivational needs and determined the relationship between their motivational needs and their
socio-economic characteristics. Fifty-two respondents were selected for the study using Multi-stage sampling
procedure. Data were collected using structured questionnaire and analysed using both descriptive (mean,
frequency, percentages) and inferential statistical tools (Ordinary Least Square regression analysis). Results
showed that majority (67.3%) of early career agriculture lecturers were male, 55.8% fell between the ages of
31-40 years, 54.4% had B.SC and M.SC as their highest educational qualification while 30.8% had teaching
experience of 3 to 4 years. Happiness in their personal life (M=3.60), good performance of students in courses
taught (M=3.40), promotion and opportunity for growth in the organisation (M=3.35) and effective mentorship
by senior colleagues (M=3.25) were found to be the major motivational needs of the agriculture lecturers in the
study area. The result of the Ordinary Least Square regression analysis showed that relationship exist between
the motivational needs of early career agriculture lecturers and their socio- economic characteristics. Based on
the findings of the study, it was recommended that Federal government in conjunction with other stakeholders
in the educational sector should factor out ways of instituting effective incentives that will motivate the lecturers
into better performance of their job. Also, the university management should put in place structures that will
boost good mentorship system in the universities.
Key words: Motivational needs, lecturers, early career, Agriculture
INTRODUCTION
Motivation has been defined in diverse ways by many authors. Kreitner (1995) defines motivation as the psychological process that gives behavior purpose and direction. Similarly, Buford et al., (1995) define it as a predisposition to behave in purposive manner to achieve specific unmet needs while Higgins (1994) simply defines it as internal drive to satisfy an unsatisfied need and Bedeian (1993) called it the will to achieve. Precisely motivation in the context of this study can be defined as psychological feature that arouses an organism (individual or group) to act towards a desired goal and elicits, control, and sustains certain needs or goal. That is, it is the inner force that drives an individual to accomplish personal and organisational goal, for example, hunger or thirst is a motivation that elicit a desire to eat or drink. Employees need to be motivated for a better result to be achieved in their organisations. Lecturers in Nigerian universities are not an exception to this. A lecturer in the broadest sense is a person who gives lectures or teaches in higher institutions of learning. The early career lecturers are newly qualified or newly certified lecturers who have completed their required pre-service training and are in their first to fifth year of service. Steffy and Walfe (2001) describe the beginning stage of the lecturing profession as the novice stage which is characterized by instability. At this stage, the lecturers are not very certain of what to do, how to do them and the expected result. They therefore need to be properly directed and motivated in other to achieve good result in the long run.
Motivating employees in a work place has always been one of the major concerns of many organisations/sectors of our economy, especially our educational system. In our rapidly degenerating educational system, motivated lecturers are needed to rescue the system. It is only when lecturers are properly motivated that they can willingly, help the educational system to be productive and effective thereby turning out high quality graduates into the labour market. Lecturers in their early stage of their career need to be properly motivated in order to arouse that sense of commitment to their jobs. Through this, they will have a positive orientation about their jobs and are more likely to put in more effort in their jobs, and in the long run build the educational system into an effective and productive system. Of all the functions performed by employers, motivating employees is arguably the most complex. This may be partly as a result of the fact that what motivates employees’ changes constantly. For example, research suggests that as employees’ income increases money becomes less of a motivator (Kovach, 1987). This is to say that employee’s motivational needs is dynamic. It changes with time and event. The factors that motivate an employee into better performance at an early stage of his/her career may not be same at a later stage. It is therefore important to identify those factors/ needs that stimulate early career lecturers into better job performance. It is only through the knowledge of these motivational needs that better and effective motivational package can be planned and put in place for these lecturers thereby obtaining a better work performance and at

Nigerian Journal of Rural Sociology Vol. 15, No. 2, March 2015
55
the long run revive our educational system. In addition, the contributions of the agricultural sector toward the nation’s economy cannot be overemphasized. The agricultural sector employs about sixty percent of the nation’s population thereby contributes greatly to the Gross National Product (GNP) of the country. Despite the contributions of the agricultural sector to the nation’s economy, it is still faced with myriads of problems. Agbamu (2005) stated that one of the outstanding factors militating against the agricultural system is the use of poorly trained personnel at the local level. This he explained is as a result of poor quality of pre-service training that the extension agent had prior to joining the extension service. The agriculture lecturers are the major players in the training of these extension agents in the higher institution. The level of dedication and commitment of these lecturers to teaching and training of the agriculture students (would be extension personnel) depend to a good extent on the ability of their employee to motivate them. It is against this background that this study identified the motivational needs of early career agriculture lecturers in selected states of Nigeria. Objectives of the study The general objective of the study was to identify the motivational needs of early career agriculture lecturers in universities in Rivers and Imo state of Nigeria. The specific objectives were to; 1. determine the socio-economic characteristics
of early career agriculture lecturers in the study area.
2. identify the motivational needs of the respondents.
3. determine the relationship between the motivational needs of the respondents and their socio-economic characteristics.
Hypothesis of the study Motivational needs of agricultural lecturers are not influenced by their socio-economic characteristics in tertiary institution in Rivers and Imo State Nigeria.
METHODOLOGY
Study area - The study was conducted in Rivers and Imo States. The population of the study comprises all early career lecturers (Lecturers between the periods of 1-5 years in service) in the faculty of agriculture in all Universities in Rivers and Imo State that have faculty or school of agriculture, namely University of Port Harcourt (UNIPORT), Rivers State University of Science and Technology (RSUST), Federal University of Technology, Owerri (FUTO) and Imo state University (IMSU). The sample for this study was selected using multi-stage sampling procedure. In the first stage, three institutions were randomly
selected from the total of four universities namely FUTO, IMSU AND UNIPORT. The second stage comprises random selection of three departments from the faculty/school of agriculture in each selected university giving a total of nine departments for the study. Lastly fifty-two early career agriculture lecturers were proportionately selected from the selected departments in the three universities selected for the study. Information for the study was procured through primary and secondary sources. Primary sources of information were the administration of structured questionnaire and in-depth interview (IDI) while the secondary sources comprised use of existing documents such as existing text books, journals, etc. Descriptive statistical tools namely: mean, percentages and frequency counts were employed to analyse data obtained in this study. Objectives one and two were analysed using mean score, percentages and frequency counts. Tables were used to present the results. The null hypothesis was tested using Ordinary Least Square multiple regression analysis. The Model specification is implicitly stated as follows: Y =f (X1, X2, X3, X4, X5, X6, X7, e)
Where Y= pooled index of motivational needs measured with a four-point Likert type scale of highly motivational = 4, moderately motivational = 3, motivates = 2 and not motivational = 1 X1 = Gender (Male=1, Female=0) X2 = Age (measured in years) X3 = marital status (single = 0, married = 1) X4 = Educational qualification (No of years in
school) X5 = Teaching experience (measured in years) X6 = Household size (no of persons per
household) X7 = Monthly Income e = error term
The relationship between the dependent and each of the independent variables were examined using four functional forms namely linear, semi-log, exponential and double-log. A lead equation was chosen based on the magnitude of multiple determination (R2) and statistical significance of variables. Linear: Y=B0+B1X1+B2X2+B3X3+B4X4+B5X5+B6X6+ B7X7+ e Semi-Log: Y=B0+B1logX1+B2logX2+B3logX3+B4IogX4+ B5logX5+B6logX6+B7logX7+e Exponential: log Y= B0 + B1X1 + B2X2 + B3X3 + B4X4 + B5X5 + B6X6 + B7X7 + e

Nigerian Journal of Rural Sociology Vol. 15, No. 2, March 2015
56
Double Log: log Y = B0 + B1 logX1 + B2 logX2 + B3 logX3 + B4 logX4 + B5 logX5 + B6 logX6 + B7logX7 + e Bo = intercept B1, B2…B7 =estimated coefficients
RESULTS AND DISCUSSION
Socioeconomic characteristics of early career
Agricultural lecturers
Table 1 showed socio-economic characteristics of respondents (early career agriculture lecturers). It showed that majority (67.3%) of the respondents were male and 55% were between the ages of 31-40 years indicating that many of them were still in their productive age. It further showed that 71.2% of early career agriculture lecturers were married, 46.2% had B.Sc. and M.Sc. as their highest educational qualification while 30.8% had teaching/lecturing experience of 3-4years. This indicates that many of these lecturers already have family responsibilities to cater for and at the same time are still in the course of acquiring their doctorate degree and as such needs to maintain a balance between their career and family responsibilities. Their monthly income is mostly (61.5%) between ₦101,000 to ₦150,000 which may be barely enough to cater for their families bearing in mind the cost of living in the two states studied.
Table 1: Percentage distribution of agriculture lecturers according to their socio-economic characteristics Variable Frequency Percentage Gender
Male Female
35 17
67.3 32.7
Age
≤ 30 31-40 41-50 Above 51
10 29 12 1
19.2 55.8 23.1 1.9
Marital status
Married Single
37 15
71.2 28.8
Highest
educational
qualification
HND B.SC M.SC PHD
Nil 24 24 4
Nil 46.2 46.2 7.6
Teaching
experience
≤1 1-2years 3-4years 5years
9 13 16 14
17.3 25.0 30.8 26.9
Monthly income
51,000-#100,000 2
3.8
101,000-#150,000 50 96.2 Area of
specialisation
Animal science Forestry/wildlife Agric economics Agric extension Crop science Soil science Fishery
7 3 9 12 10 8 3
13.5 5.8 17.3 23.1 19.2 15.4 5.8
Source: Field survey, 2014
Motivational needs of early career agriculture
lecturers in Rivers and Imo states of Nigeria.
Table 2 showed that all the thirty items used to capture the motivational needs of early career agriculture lecturers in selected universities motivate the lecturers. It was shown that conducive physical environment (mean = 3.15) motivates early career agricultural lecturers. According to theory Y by McGregor (1960) average human being work and learn under proper conditions not only to accept but seek responsibility. Unfortunately, the conditions of infrastructure in these universities were very poor. From personal observation made during the data collection, most of these lecturers stay in poorly furnished offices with little or no facilities to aid them in their work. Some of them do not even have an office; they are placed in a hall which they use as their office. Such condition is detrimental to their development as they face a lot of distractions from colleagues and can hardly concentrate to do any meaningful work during their stay in the offices. On further enquiry, some said its one of the reasons why they absent themselves from the office when they have a very important task to achieve. Salaries and increment plans (mean = 3.21) were found to be a motivator to the early career lecturers, This is in line with the Expectancy theory of motivation which states that an employee is motivated to work if he/she believes his effort will be rewarded (Vroom, 1966). The result further indicates that sponsorship to professional meetings such as conferences, workshop (mean = 3.29) motivate the respondents. Adesope, et al. (2014), stated that professional meetings are one of the important ways of building human capacity in any organisation. According to them, professional meetings help to connect lecturers to relevant networking teams, expose them to new areas of research and better research methodologies. It also helps them to develop their profile for promotion purposes. Provision/ availability of information and communication technology (mean = 3.10) and internet facilities (mean = 3.25) were also found to motivate the respondents. The role of ICT and internet based research tools in the contemporary research community cannot be over emphasized. Most of these tools facilitate collaboration and networking

Nigerian Journal of Rural Sociology Vol. 15, No. 2, March 2015
57
through making information sharing easy and more accessible. Ofoegbu (2004) noted that a teacher needs different resources such as technological equipments (computers, projectors, multimedia and internet etc.) for effective classroom management and institution’s improvement. Functional collaborative research team (mean = 3.25) and effective mentorship by senior colleagues (mean = 3.25) was also found to motivate the early career agriculture lecturers. It is important for management to encourage harmony and develop conducive environment for collaboration and mentoring among employees. Further discussion with the early career lecturers revealed that most of them are of the opinion that universities should develop a formal mentorship structure in the school. According to them, this will help to guide and direct the newly employed properly in the chosen career as some of them lack direction and proper way to develop themselves at the early stage of their career. Also, assurance of regular payment of pension (mean = 3.13), opportunity to apply ones initiative in the job (mean = 3.33), appreciation or recognition for a job well done (mean = 3.29), promotions and growth in the organisation/institution (mean = 3.35), interesting work (the nature of job itself)(mean = 3.13), sponsorship to further education (mean = 3.13), good student and lecturers relationship (mean = 3.37), good performance of student in courses taught (mean = 3.40) and challenging assignment (mean = 3.08) were found to motivate early career agriculture lecturers. Individual works harder if given specific reward especially financial reward. During the In depth interview with the respondents, it was disclosed that some of them venture into other businesses in a bid to meet up with their financial responsibilities. According to them, most of the allowances and even their basic salaries were not paid as at when due. This resulted into abandoning their duties to do other things that could yield financial benefit to them. It is worthy to note that when lecturers’ salaries and entitlements
are paid as at when due, it motivates them to do their duties effectively. Also most of the lecturers interviewed were still pursuing their doctorate degree, they complained of inability of their universities to sponsor them. This according to them put much financial stress on them. Raymond Mile Theory of human resources states that the development of employee (education and training) can exercise some degree of motivation as it increases their self-control and self-direction. In addition, Maslow’s theory of motivation states that human beings work best when given a worthwhile and challenging job, therefore, it is very necessary to motivate these lecturers by giving them challenging assignments as well as opportunities to exercise their initiative. The result further shows that it is important for management to take steps to encourage worker’s initiative. This according to them gives them a sense of fulfillment. Also, feedback derive from work done motivates the respondents also. For instance, good performance of students in courses taught gives them satisfaction and motivates them to perform more. This is in line with satisfaction theory which states that a satisfied employee is a productive employee. Other factors that motivate the agriculture lecturers include students ability to win international awards (mean = 2.90), benefits and allowances attached to salary (mean = 2.83), school policies and regulation (mean = 2.69), reasonable work load (mean = 2.83) and management/administrative style in the school (mean = 2.81). This result confirms the necessity of Lynn (2002) opinion which states that educational leaders should provide professional learning and growth opportunities in order to motivate teachers and to enhance their performance. The in-depth interview revealed that majority of the early career agricultural lecturers needs to be motivated. According to them, the school management and government in general seem not to have packages that could help them develop their career unlike their counterparts in developed nations.
Table 2: Motivational needs of early career Agriculture lecturers
Statement Highly motivates me
Moderately motivates me
Motivates me
Does not motivate me
Mean X Remarks
Conducive physical environment ( e.g. well furnished office)
29 (55.8) 9 (17.3) 7 (13.5) 7 (13.5) 3.15 Motivate
Salary and increment plan 29 (55.8) 11 (21.2) 6 (11.5) 6 (11.5) 3.21 Motivate Sponsorship to professional meeting e.g. conferences, workshop, symposium
33 (63.5) 7 (13.5) 6 (11.5) 6 (11.5) 3.29 Motivate
Provision/ availability of information and
23 (44.2) 18 (34.6) 4 (7.7) 7 (13.5) 3.10 Motivate

Nigerian Journal of Rural Sociology Vol. 15, No. 2, March 2015
58
Statement Highly motivates me
Moderately motivates me
Motivates me
Does not motivate me
Mean X Remarks
communication technology Availability of internet facility
27 (51.9) 16 (30.8) 4 (7.7) 5 (9.6) 3.25 Motivate
Functional collaborative research team
24 (46.2) 16 (30.8) 9 (17.3) 3 (5.8) 3.17 Motivate
Effective mentorship by senior colleagues
25 (48.1) 16 (30.8) 10 (19.2) 1 (1.9) 3.25 Motivate
Other benefits/allowances attached to salary
22 (42.3) 10 (19.2) 9 (17.3) 11 (21.2) 2.83 Motivate
Good retirement plan 27 (51.9) 11 (21.2) 13 (25.0) 1 (1.9) 3.23 Motivate Assurance of regular payment of pension
21 (40.4) 20 (38.5) 8 (15.4) 3 (5.8) 3.13 Motivate
Opportunity to apply one’s initiative in the job
29 (55.8) 14 (26.9) 6 (11.5) 3 (5.8) 3.33 Motivate
Implementation of research recommendations.
16 (30.8) 19 (36.5) 15 (28.8) 2 (3.8) 2.94 Motivate
Sponsorship to further education
27 (51.9) 9 (17.3) 12 (23.1) 4 (7.7) 3.13 Motivate
Availability of oversea scholarships
30 (57.7) 5 (9.6) 10 (19.2) 7 (13.5) 3.12 Motivate
Good relationship with other members of staff
21 (40.4) 24 (46.2) 7 (13.5) 0 (0.0) 3.27 Motivate
Management/administrative style in the school
10 (19.2) 24 (46.2) 16 (30.8) 2 (3.8) 2.81 Motivate
Appreciation or recognition for a job well done
18 (34.6) 17 (32.7) 10 (19.2) 7 (13.5) 2.88 Motivate
Effective flow of information
15 (28.8) 22 (42.3) 13 (25.0) 2 (3.8) 2.96 Motivate
Interesting work (the nature of the job itself)
19 (36.5) 20 (38.5) 13 (25.0) 0 (0.0) 3.12 Motivate
Satisfaction derive from work done
24 (46.2) 20 (38.5) 7 (13.5) 1 (1.9) 3.29 Motivate
Good student and lecturers relationship
25 (48.1) 21 (40.4) 6 (11.5) 0 (0.0) 3.37 Motivate
Good performance of student in courses taught.
26 (50.0) 22 (42.3) 3 (5.8) 1 (1.9) 3.40 Motivate
Student ability to win international awards
15 (28.8) 18 (34.6) 18 (34.6) 1 (1.9) 2.90 Motivate
School policies and regulation
7 (13.5) 26 (50.0) 15 (28.8) 4 (7.7) 2.69 Motivate
Challenging assignment 20 (38.5) 19 (36.5) 10 (19.2) 3 (5.8) 3.08 Motivate Reasonable work load 14 (26.9) 18 (34.6) 17 (32.7) 3 (5.8) 2.83 Motivate Happiness in my personal life (children, spouse)
37 (71.2) 10 (19.2) 4 (7.7) 1 (1.9) 3.60 Motivate
Promotions and growth in the organisation
30 (57.7) 13 (25.0) 6 (11.5) 3 (5.8) 3.35 Motivate
Tactful discipline 16 (30.8) 26 (50.0) 10 (19.2) 0 (0.0) 3.12 Motivate 14 (26.9) 19 (36.5) 16 (30.8) 3 (5.8) 2.85 Motivate
Source: Field survey, 2014
Figure in parenthesis are percentages Midpoint = 2.50, Any mean score <2.50 suggest do not motivate Any mean score ≥ 2.50 suggest motivate. Hypothesis testing Motivational needs of early career agriculture
lecturers are not influenced by their
socioeconomic characteristics
Nigerian Journal of Rural Sociology Vol. 15, No. 2, March 2015
59
Result of Ordinary Least Square multiple regression analysis for the determination of relationship between motivational needs of early career agriculture lecturers and their socio economic characteristics for all the four functional forms tried in this study are presented in Table 3. Linear functional form was chosen as the lead equation based on the high value of R2, more significant coefficients and highest F-value. The coefficient of multiple determination (R2) value of 0.652 indicates that about 65.2% of variation in the level of motivational needs could be explained by the explanatory variable while the remaining 34.8% was due to other variables not specified in the model. F – ratio of 4.01 at 1% level of significant in the regression result implies that all the variables have significant or joint effects on the dependent variable. The statistically significant value of the f-value shows that a relationship exists between the motivational needs of agriculture lecturers and their socio-economic characteristics therefore the null hypothesis which states that there is no relationship between the early career agriculture lecturers and their socio-economic characteristics was rejected. Coefficient of marital status, highest educational qualification, household size, and monthly income were found to be significant at 5% significant level. The coefficient of marital status (x3) was positively significant at 5%. This implies
that being married could serve as a motivational need for the early career agriculture lecturer since the married ones have more family responsibilities to cater for unlike their counterparts who have less family burden to bear. Also, the coefficient of educational qualification (x4) is positive and statistically significant at 5% level of significant. This could imply that achieving higher educational qualification is a motivational need of early career agriculture lecturers. Lecturers who have obtained the highest educational qualification are not motivated with things like sponsorship to further education. Furthermore, the coefficient of household size (x6) is positive and significant at 5% level of significant. This implies that larger household size is a motivational need of early career lecturers as having more mouths to feed and cater for could be an inspiring force making lecturers to carry out their duties effectively so as to earn salaries when due. Finally, the coefficient of monthly income (x7) is found to be positive and significant at 5% significant level. This is not surprising as the quest for higher monthly income can motivate lecturers (especially the early career whose salaries are still at a lower level) into working more effectively.
Table 3: Relationship between Motivational needs of early agricultural lecturers and socio-economic characteristics
**significant at 1% level. *significant at 5% level. The values are in parenthesis are t – values. Source: Field survey 2013.
CONCLUSION
Variables Linear Semi-log Exponential Double log
Constant 25.178 12.861 3.117 12.861 (6.331)** (5.691)** (15.523)** (5.691)** Gender(x1) 0.22 0.16 0.60 0.16 (1.38) (.107) (0.390) (0.107) Age (x2) 1.68 1.25 0.114 1.25 (0.872) (0.619) (0.630) (0.617) Marital status (x3) 5.133 0.19 5.143 3.21 (2.911)** (2.00)* (2.806)** (1.888)* Highest educative qualification (x4)
9.33 2.177 0.131 0.029
Teaching experience (x5) (3.46) (1.930) (1.823) (0.614) 0.03
(0.016) 0.03 (0.19)
0.19 (0.111)
0.03 (0.19)
Household size (x6) 0.086 (3.77)**
0.212 (1.248)
0.094 (2.405)**
0.080 (2.311)*
Monthly income (x7) 0.533 (4.17)**
0.258 (2.77)**
0.226 (1.617)
0.441 (2.61)**
R2 0.652 0.583 0.561 0.617 F 4.01** 3.58** 3.44** 3.98**

Nigerian Journal of Rural Sociology Vol. 15, No. 2, March 2015
60
Based on the findings of the study, it is concluded that a lot of factors ranging from opportunity to apply one’s initiative, satisfaction derive from work, good student and lecturer relationship to effective mentorship scheme motivate early career agriculture lecturers. These factors need to be extensively studied and applied in policy development. There is a relationship between the motivational needs of the early career lecturers and their socio-economic characteristics. Marital status, highest educational qualification, household size, and monthly income were the determinants of motivational needs of the respondents. Filak, (2003) opined that motivation is crucial to the long term success and performance of any educational system, therefore the need to put into use findings and recommendations of this study becomes very paramount.
RECOMMENDATIONS
Based on the findings of this study, it was recommended that: 1. Ministry of education in the Federal Republic
of Nigeria and all stakeholders involved in management and administration of higher institutions should restructure their package for better result and close the need gap (satisfaction) hence provide suitable incentive that will boost the morale of the early career lecturers’ towards better performance.
2. Sponsorship to further education should be put in place for early career lecturers as this will motivate them to perform their work better.
3. School authorities should factor out ways of instituting and maintaining good and effective human relationship between the early career agriculture lecturers and their senior colleagues as this will motivate early career lecturers towards better job performance.
4. Also better communication between the school authorities and the early career agriculture lecturers should be fostered for better job performance.
5. Trusted pension outfits should be put in place for early career lecturers.
6. Better salary, office environment, internet facilities and all other factors which was found to motivate early career lecturers should be packaged and implemented for the early career agriculture lecturers in order to motivate them towards better job performance.
REFERENCES
Adesope, O. M., Ifeanyi-obi, C. C., Matthews-Njoku, E. C., Agumagu, A. C., Asiabaka,
C. C. and Mgbada, J. U. (2014). Agricultural lecturer’s perception of the benefits of professional meetings in Nigeria. Journal of Agricultural
Extension, Vol., 18 (2). Pp. 21-26 Agbamu, J.U. (2005). Problems and Prospects of
Agricultural Extension Service in Developing Countries. In; Madukwe, M.C (Ed) Agricultural Extension in Nigeria. Agricultural Extension Society of Nigeria. (AESON).
Bedeian, A. G. (1993). Management. 3rd Ed. New York: Dryden Press.
Buford, J. A., Bedeian, A.G., & Lindner, J. R. (1995). Management in extension. 3rd Edition. Columbus, Ohio: Ohio State University Extension.
Filak, V. F. (2003). Student Psychological Need Satisfaction and College Teacher-Course Evaluations. Educational Psychology, 23 (3), Pp. 235-247.
Kovach, K. A. (1987). What motivates employees? Workers and supervisors give different answers, Business Horizons, 30, 58-65. DOI: 10.1016/0007-6813(87)90082-6, http://dx.doi.org/10.1016/0007-6813 (87)90082-6
Kreitner, R. (1995). Management. 6th ed. Boston: Houghton Mifflin.
Lynn, S. (2002). The winding path: understanding
the career cycle of teachers. The clearing house, 75, Pp.179-182.
McGregor, D. (1960). The human side of enterprise. New York, McGraw Hills Companies, Inc.
Ofoegbu, F. I. (2004). Teacher Motivation as an
Essential Factor for Classroom
Effectiveness and School Improvement. College Student Journal. Department of Educational Administration and Foundations, University of Benin, Benin City, Nigeria.
Steffy, B.E. and Walfe, M.P. (2001). A life cycle
model for career teachers. Kappa Delta pi Vol. 38 (1).
Vroom, V. (1966). Organisational choice: A study of pre- and post-decision process. In Organisational behavior and human
performance. 9th Ed. New Delhi: Prentice- Hall of India.
Wikipedia free encyclopedia. www.wikipedia.org/ wiki/ lecture. Retrieved on 12 March, 2013.
Nigerian Journal of Rural Sociology Vol. 15, No. 2, March 2015
61
PERCEIVED NUTRITIONAL AND MEDICINAL VALUES OF DATE PALM (Phoenix dactylifera)
AMONG RURAL DWELLERS OF KATSINA STATE, NIGERIA 1Ikwuakam, O. T. and 2Olutegbe, N. S. 1Federal College of Education, Katsina
2University of Ibadan, Ibadan E-mail: [email protected]
ABSTRACTS
The study investigated perceived nutritional and medicinal values of date palm (Phoenix dactylifera) among
rural dwellers of Kastina State, Nigeria. A total of 90 rural households were sampled in the state. Data were
analyzed using both descriptive and inferential statistical tools. Study reveals that respondents’ average age
was 36.0±16.1 years as 34.4% were aged between 31 and 40 years. Majority (93.3%) were Muslims, while
64.4% were married with an average household size of 11 members. About 50% had Quranic education. A
large number had consumed date palm before in both fresh (91.1%) and dry forms (64.4%). This may be due to
high level of awareness of the various functional values of date palm as majority were aware of the various
functional values. Overall levels of awareness of both nutritional (71.1%) and medicinal (53.3%) values of date
palm were also high among majority. Also, 56.7% and 64.4% of the respondents had favourable perception
towards medicinal and nutritional potentials respectively of date palm. Level of exposure to information
(r=0.410 and 0.578) and level of awareness (r=0.504 and 0.409) had significant relationship with respondents’
perceived nutritional and medicinal values of date palm respectively. The study concludes that information and
awareness were proven sine qua non for favourable perception of functional values of date palm among rural
dwellers in Kastina state.
INTRODUCTION
Phoenix dactylifera also known as date palm is one of the oldest subsistence cultivated crops mainly grown in the hot arid regions of the world. The plant can also thrive in an oasis setting because of water availability for the roots to soak up. It grows tall and produces sweet fruits known as date. The tree is believed to have originated from Africa and Asia (Zaid and Wet, 1999) but can be found today growing in Mexico, Chile, India, Italy, Spain, and South-western United States. Egypt (1.3m MT), Iraq (0.4m MT), Iran (1.0m MT) Qatar (0.02m MT), Pakistan (0.6m MT), Algeria (0.5m, MT), Saudi Arabia (0.9 MT), China (0.1), Oman (0.2m MT) and Libya (0.1m MT) are top producers with Egypt being the largest World producer followed by Iran and Saudi Arabia with annual production rates of 1,326,000MT, 1,000,000MT and 982,000MT respectively (FAO, 2008; Dada, Nwawe, Okere and Uwubanmwen, 2012). These same sources further revealed that in West Africa sub region, Mauritania is reportedly the highest producer, followed by Chad and Niger with annual production statistics of 22,000MT, 15,000MT and 8,000MT respectively. Although date palm is believed to have been introduced into Nigeria in the early 17th century by the Arab traders from North Africa and Muslim pilgrims to Mecca and Medina (Omamor, Aisagbonhi, and Oruade, 2000) yet it can be found growing extensively and commercially in the arid zones of northern Nigeria (Kaduna, Katsina, Kano, Sokoto, Kebbi, Zamfara, Jigawa, Yobe, Borno, Gombe and Bauchi States) and in the lower latitudes within the derived savanna areas of Plateau; Nasarawa, Niger, Kwara and Benue States
(AbdulQadir, Garba, Eseigbe and Omofonmwan, 2011). It is propagated by seed, off-shoot and tissue culture (AbdulQadir et al, 2011). Date palm is a dioeciously perennial plant that takes about four years to fruit depending on the agronomic practices. The relatively wide spread cultivation of date palm may have been necessitated by its numerous nutritional and health potentials and values. FAO (1982) found that date palm can be used in making local fan, ropes, baskets, foot mats, bags, beds, bird cages, traps, blankets, and chairs, cushion, doors, window frames, fences, fire wood, life belt as well as providing employment to both skilled and unskilled labour, thereby generating income and alleviating poverty. FAO further revealed that as a desert plant, it serves a useful purpose of shade provision to desert travelers, as wind breaks; checks wind erosion and desert encroachment particularly in the northern parts of Nigeria. Nutritionally, AbdulQadir et al. (2011) found out that date has more than 3000 calories/kg consisting of 70% carbohydrate (mostly invert sugar e.g. glucose and fructose) which is good for persons who cannot tolerate sucrose. The source further stated that it contains reasonable amount of potassium (K), calcium (Ca), magnesium (Mg), iron (Fe), copper (Cu), zinc (Zn), manganese (Mn) and very low quantities of silicon (Si), sulphur (S) sodium and fat. Also found in moderate quantities are chlorine (Cl), sodium (Na) and phosphorus. The iron content of date is almost a third the recommended dietary allowance for an adult male and these form the basis for date’s description as a wonderful delicious fruit (Dada et al 2012) and as ‘a mine’ in itself (Zaid and West, 1999).

Nigerian Journal of Rural Sociology Vol. 15, No. 2, March 2015
62
It has also been uncovered that date is a major source of health benefitting flavonoid polyphenolic antioxidants known as Tannins that has anti-infective, anti- inflammatory and anti-hemorrhagic (Dada et al 2012). This source reiterated that its vitamin A content is known to have antioxidant properties that are essential for vision, maintaining healthy mucus membrane and skin, protects the lungs and oral cavity cancers, prevents colon, prostate, breast, endometrial, lung and pancreatic cancers. Its iron content is a major component of hemoglobin and this is known to determine the oxygen carrying capacity of the blood. Also its potassium richness is an important cell and body fluid that assist in controlling the heart rate and blood pressure, thereby offering protection against stroke and coronary heart diseases (Dada et al
2012). On the other hand, the high tannins content is good medicinally as a detersive (having cleaning power) and astringent in intestinal trouble (Wikipedia, 2011). It can be used to treat sore throat; cold, bronchial catarrh and fever. Wikipedia (2011) further observed its efficacies in counteracting alcohol intoxication and in diarrhea and genitor-urinary ailments’ treatment. The seeds when soaked in water can be fed to horses, cattle, camel, sheep and goat while the dried and ground up can be included in chicken feed (Morton 1987). Darby, Ghalioungi and Louis (1977) and Manniche (1989) had earlier listed the medicinal values of date to include: remedy for swelling of any limb, swollen and aching legs, cough in children, worms, heat of the heart, sneezing, hair growth, and used in mummifying corpses (Lucas and Harris, 1962; Darby et al, 1977; Nazir, 1970). It is therefore interesting that consumption of date in Nigeria as observed by Dada et al. (2012) has been massive and reasonably outstripped local production which Omoti and Okolo (2000) noted is at subsistence level. Perhaps the massive rate of consumption and unequal rate of production warranted the importation of most dates consumed in Nigeria from neighboring countries like Chad, Niger and Sudan (Adesiji, Olujide, Bolarin, Sanusi, and Komolafe, 2013). Its production rate however, raises doubt on the awareness and perception of the populace over the numerous values of date palm. One had expected that date palm’s values and consumption rate should have necessitated a robust production level in Nigeria. It is against this concern that the study examined rural dwellers’ perception on the nutritional and medicinal values of Phoenix dactylifera (date palm) in Katsina State, Nigeria. Specifically, the study: 1. examined the socio-economic characteristics of
the respondents 2. identified respondents’ sources of information
on the nutritional and medicinal values of date palm
3. determine respondents’ awareness on nutritional and medicinal values date palm
4. describe respondents’ perception on the nutritional and medicinal values of date palm
METHODOLOGY
The study was carried out in Katsina state. Katsina State is located in the North-Western region of Nigeria. The state, covers an area of 23,938 sq. km and is located between latitudes 11°08'N and 13°22'N and longitudes 6°52'E and 9°20'E. The state is bounded by Niger Republic to the north, by Jigawa and Kano States to the east, by Kaduna State to the South and by Zamfara State to the West. Katsina State has rich cultural values with annual rainfall ranging from 800m to 1000mm. Katsina State has a total of 34 LGAs, out of which about 16 are rural. Therefore, the 16 rural LGAs were purposively selected for the study. Of the 16 LGAs selected, a total of 3 LGAs (25%) were selected through a simple random sampling technique. These are Kaita, Ingawa and Maidua. The third stage involves random sampling of 6 communities in the LGAs selected. A total of 90 rural households were then sampled proportionately across the 6 communities. A structured interview schedule containing questions ranging from the respondents’ socio-economic characteristics, sources of information, awareness and perception on the nutritional and medicinal values of date palm was used to collect data for the study. Frequency of accessing information were measured as respondents indicated whether it was always (3), occasionally (2), rarely (1) or never (0). Awareness of the nutritional and medicinal benefits of date palm was also determined as respondents indicated if they were aware (1) or not aware (0) for each of the awareness statements. For perceived nutritional and medicinal benefits of date palm, a five-point Likert-type scale was used to assess respondents’ level of agreement to each of the medicinal and nutritional values of date palm. A score of 5, 4, 3, 2 and 1 was assigned to each strongly agree, agree, undecided, disagree and strongly disagree, for positively worded statements and a reverse for negatively worded statements. A score of each of sources of information, awareness and perceived benefits was computed, and used for testing the hypotheses involving these variables. The mean awareness of the benefits of date palm, as well as their perceived benefits were obtained and used to categorize respondents level of awareness and perceived benefits into high and favourable (≥ mean score) and low and unfavourable (< mean score) respectively. Frequency counts, percentages and means were used in describing the data, while Chi-Square and PPMC were used to test the

Nigerian Journal of Rural Sociology Vol. 15, No. 2, March 2015
63
hypotheses. The methodology was adopted from Ikwuakam, Sangotegbe and Akinbile (2014).
RESULTS AND DISCUSSION
Socioeconomic characteristics
Table 1 presents the socio-economic characteristics of the respondents wherein their average age was 36±16.1 years as 34.4% were between the ages 31 and 40 years. It could therefore be inferred that most of the respondents were young. Also 74.4% of the respondents were male, indicating the male headed nature of most households in the area as earlier observed by Ikwuakam, et al. (2013). The study further shows that majority (93.3%) were Muslims, 64.4% of them were married, while most (25.6%) have household size of between 9 and 12 people, with mean household size of 10.8±7.6 which suggests that the respondents had large household size in the area. The finding on the marital status corroborates the findings of Ayanda, Akangbe, and Fakaya (2010), Suleiman (2010), Adesiji, Olujide, Bolarin, Sanusi and Komolafe (2013) who reported similar higher percentage values for married respondents in the same geographical location. The large household size may also be due to polygamous type of marriage that obtains in most Muslim dominated areas of Northern Nigeria (Adesiji et al., 2013). It was also revealed that 90.0% of the respondents were Hausas with majority (49.9%) having Quaranic education, while those with formal education attainment of primary, secondary and tertiary level were 28.9%, 13.3% and 7.8% respectively. This suggests that most of the respondents had no appreciable level of formal education, depicting the possibility of preference for and adherence to traditional remedies. Other facts revealed were that 91.1% of the respondents consumed date palm. A large number (64.4%) consumed date palm dried (Figure 1), while 30.0% of them had consumed it for a period of 10 years (Figure 2). Date palm has a lot of religion connotation both in the old world where it originated and the new world where it migrated to like Nigeria (FAO, 2002) and in Muslim dominated northern Nigeria, date palm is used to breakfast (Gbolagade et al., 2013). The result further revealed that majority (87.8%) source the date palm they consume from the market, implying its availability in the study area. Erskine, Moustafa, Osman, Lashine, Nejatian, Badawi and Ragy (2003) had noted that dates are traditionally marketed all over the world as a highly valued confectionary and Katsina state falls within the arid region of northern Nigeria where date palm are grown extensively and in commercial quantity (Dada et al., 2012).
Table 1: Socio-economic characteristic of the respondents Variable F % Mean ± SD Age:
≤20 12 13.3 35.98 ± 16.08 21-30 22 24.4 31-40 31 34.4 41-50 10 11.1 51-60 7 7.8 > 60 8 8.9 Sex: Male 67 74.4 Female 23 25.6 Religion: Christianity 6 6.7 Islam 84 93.3 Marital status: Married 58 64.4 Single 22 24.4 Divorced 2 2.2 Widow 8 8.9 Household size: 1-4 20 22.2 10.79 ± 7.63 5-8 19 21.1 9-12 23 25.6 13-16 11 12.2 >16 17 18.9 Ethnic group: Hausa 81 90.0 Yoruba 2 2.2 Igbo 2 2.2 Others 5 5.6 Education
attainment:
Primary education
26 28.9
Secondary education
12 13.3
Tertiary education
7 7.8
Quranic education
49 49.9
Consume date
palm
82 91.1
Years of
consumption:
< 5yrs 19 21.1 10 yrs 27 30.0 15 yrs 11 12.2 20 yrs 6 6.7 25 yrs 22 24.4 above 25 yrs 5 5.6 Source: Field survey, 2014

Nigerian Journal of Rural Sociology Vol. 15, No. 2, March 2015
Figure 1: Form of consumption of date palm among respondents
Figure 2: Main source of date palm to respondents
Sources of information on medicinal and
nutritional values of date palm
Table 2: Distribution of respondents on their sources of information on medicinal and nutritional values of date palm Sources AlwaysMedicinal:
Radio 26 Television 32 (35.6)Community health workers 18 (20.0)Friends 47(52.2)Health center 24(26.7)Newspapers 18(20.0)Churches 6(6.7)Mosque 42(46.7)Association 36(40.0)Internet 35(38.9)Nutritional Radio 34(37.8)Television 32(35.6)Community health workers 16(17.8)Friends 58(64.4)Health center 20(22.2)Newspapers 17(18.9)Churches 6(6.7)Mosque 40(44.4)Association 33(36.7Internet 31(34.4)Source: Field survey 2014. *Figures in parentheses are in percentages
Nigerian Journal of Rural Sociology Vol. 15, No. 2, March 2015
64
Figure 1: Form of consumption of date palm among
of date palm to respondents
Sources of information on medicinal and
Availability and accessibility of appropriate information are germane to overcoming most life challenges. Table 2 therefore shows the different sources of information utilised by respondents. The results show that majority of the respondents always source their information on the medicinal values of date palm from friends (52.2%), mosque (46.7%) and association (40.0%), while 93.3% and 46.7% never had information from church and newspapers respectively. The lack of information from church and newspapers could be an indicative of respondents’ religious (Islam) affiliation and education attainment (Quaranic). Also, the respondents never made use of internet (333.3%) and television (41.1%, 32.2%) as sources of information on medicinal and nutritional values respectively. This may be due to poor telecommunication network, implying that the respondents made use of information sources that their low educational status could avail them with. Similarly, friends (64.4%), mosque (44.4%) and radio (37.8%) were major sources of information on its nutritional values. However, friends (mean = 2.06) was ranked 1st among sources of information to the respondents, followed by mosque (mean = 1.78) that ranks 2nd as sources of information on both medicinal and nutritional values of date palm. The results are in conformity with the findings of Meludu, Ewebiyi and Sangotegbe (2012) on street food vendors’ sources of informatisafety practices.
Table 2: Distribution of respondents on their sources of information on medicinal and nutritional values of date
Always Occasionally Rarely Never
26 (28.8)* 20(22.2) 17 (18.9) 27(30.0)32 (35.6) 6 (6.7) 22 (24.4) 30 (33.3)18 (20.0) 10(11.1) 31(34.4) 31(34.4)47(52.2) 14(15.6) 16(17.8) 13(14.4)24(26.7) 15(16.7) 23(25.6) 28(31.1)18(20.0) 10(11.1) 20(22.2) 42(46.7)6(6.7) - - 84(93.3)42(46.7) 7(7.8) 20(22.2) 21(23.3)36(40.0) 10(11.1) 20(22.2) 24(26.7)35(38.9) 5(5.6) 18(20.0) 32(35.6)
34(37.8) 21(23.3) 16(17.8 19(21.1)32(35.6) 7(7.8) 22(24.4) 29(32.216(17.8) 9(10.0) 37(41.1) 28(31.1)58(64.4) 12(13.3) 12(13.3) 8(8.9) 20(22.2) 13(14.4) 29(32.2) 28(31.1)17(18.9) 9)10.0) 25(27.8) 39(43.3)6(6.7) - - 84(93.3)40(44.4) 6(6.7) 25(27.8) 19(21.1)33(36.7 17(18.9) 22(24.4) 18(20.0)31(34.4) 2(2.2) 20(22.2) 37(41.1)
Field survey 2014. *Figures in parentheses are in percentages
Availability and accessibility of appropriate information are germane to overcoming most life challenges. Table 2 therefore shows the different
information utilised by respondents. The results show that majority of the respondents always source their information on the medicinal values of date palm from friends (52.2%), mosque (46.7%) and association (40.0%), while 93.3% and
mation from church and newspapers respectively. The lack of information from church and newspapers could be an indicative of respondents’ religious (Islam) affiliation and education attainment (Quaranic). Also, the respondents never made use of internet (35.6%, 33.3%) and television (41.1%, 32.2%) as sources of information on medicinal and nutritional values respectively. This may be due to poor telecommunication network, implying that the respondents made use of information sources that
al status could avail them with. Similarly, friends (64.4%), mosque (44.4%) and radio (37.8%) were major sources of information on its nutritional values. However, friends (mean =
among sources of information ed by mosque (mean =
as sources of information on both medicinal and nutritional values of date palm. The results are in conformity with the findings of Meludu, Ewebiyi and Sangotegbe (2012) on street food vendors’ sources of information on food
Table 2: Distribution of respondents on their sources of information on medicinal and nutritional values of date
Mean Rank
27(30.0) 1.50 4th 30 (33.3) 1.44 6th 31(34.4) 1.17 8th 13(14.4) 2.06 1st 28(31.1) 1.39 7th 42(46.7) 1.04 9th 84(93.3) .59 10th 21(23.3) 1.78 2nd 24(26.7) 1.64 3rd 32(35.6) 1.48 5th
19(21.1) 1.78 3rd 29(32.2 1.47 6th 28(31.1) 1.14 9th
2.33 1st 28(31.1) 1.28 7th 39(43.3) 1.04 10th 84(93.3) 0.58 11th 19(21.1) 1.74 2nd 18(20.0) 1.72 4th 37(41.1) 1.30 7th

Nigerian Journal of Rural Sociology Vol. 15, No. 2, March 2015
65
Awareness on nutritional and medicinal values
of date palm
The nature of people’s perception on issues is often based on their level of awareness. Table 3 presents respondents’ awareness on the medicinal and nutritional values of date palm in the study area. The results show that respondents were aware that date palm has nutritional values for weight gain (77.8%), low protein (76.7%), fat content (74.4%), as well as iron and vitamins A, B, C, E (72.2%). The study further reveals that respondents were aware of the nutritional values of date palm for iron (76.7%), calcium (68.9%) and dietary fibre (61.1%). The result also reveals that higher percentages of the respondents and were aware that date palm is used for the treatment of diarrhea (75.6%), constipation and indigestion (68.9%),
leprosy (66.7%), asthma (63.3%), sore eyes (62.2%) and to facilitate delivery (62.2%). Sixty three percent (63.3%) of the respondents were unaware that date palm contains antioxidants that prevents cancer and delay ageing. This implies that respondents’ awareness that date palm contains cancer and ageing preventive substances is low. On the overall (Table 4), most respondents have high level of awareness on medicinal (53.3%) and nutritional (71.1%) values of date palm. This implies that the information sources of the respondents were good enough in creating high level of awareness on the nutritional and medicinal values of date palm. The result conforms to the findings of Satish (2010) and Akinbile and Aminu (2012) on Jatropha as a medicinal plant.
Table 3: Distribution of respondents’ awareness on the nutritional and medicinal values of date palm Awareness Aware Not aware Nutritional F % F %
Source of vitamin A,B,C and E 65 72.2 25 27.8 Source of calcium 62 68.9 28 31.1 Low protein and fat content 69 76.7 21 23.3 Good for weight gain 70 77.8 20 22.2 Source of iron 67 74.4 23 25.6 Good source of energy 69 76.7 21 23.3 Source of dietary fibre 55 61.1 35 38.9 Medicinal
Contains antioxidants that prevents cancer and delay ageing 33 36.7 57 63.3 Date palm is a natural remedy for constipation and indigestion 62 68.9 28 31.1 Facilitates delivery in women 56 62.2 34 37.8 Good for diarrhea patients 68 75.6 22 24.4 It has anti-inflammatory supplements 46 51.1 44 48.9 Assist in remedying sexual debility 48 53.3 42 46.7 Prevents leprosy 60 66.7 30 33.3 Good asthma treatment 57 63.3 33 36.7 Prevents bronchitis 50 55.6 40 44.4 Prevents tuberculosis 53 58.9 37 41.1 Prevents fevers 53 58.9 37 41.1 Controls cough and throat disorder 53 58.9 37 41.1 Controls sore eyes 56 62.2 34 37.8 Source: Field survey 2014 Table 4: Level of awareness of respondents on the nutritional and medicinal values of date palm Category Scores F % Mean SD Minimum Maximum
Medicinal
Low < 7.67 42 46.7 7.67 2.86 .00 13.00 High ≤ 7.67 48 53.3 Nutritional Low < 5.08 26 28.9 5.08 1.69 0 7.00 High ≤ 5.08 64 71.1 Source: Field survey 2014
Respondents’ perception of the nutritional and
medicinal values of date palm
Table 5 reveals that majority of the respondents have favourable perceptions towards most of the statements on medicinal values of date palm. These include: eating dates everyday helps in
controlling leprosy, asthma, bronchitis, tuberculosis, and fevers (mean = 4.43), eating dates at bedtime and drinking a glass of warm water takes care of constipation (mean = 4.43), Eating crushed dates cures general weakness (mean = 4.42), eating dates daily assist in sexual debility
Nigerian Journal of Rural Sociology Vol. 15, No. 2, March 2015
66
(mean = 4.39), rubbing seed of date fruit on a rough surface with water and applying the paste over the eyelids cures sore eyes (mean = 4.39) and that date is a good replacement for potassium that is often lost during diarrhoea (mean = 4.34). The result further revealed that respondents were not favourably disposed to the statement, date palm maintains healthy heart. Also, majority of the respondents favourably perceived the following statement on the nutritional values of date palm; date palm is a very good source of vitamin B-complex and C (mean = 4.78), dates are rich source of carbohydrate (mean = 4.59), dates are rich in essential minerals such as calcium, magnesium, iron, zinc, potassium, phosphorus, selenium and manganese (mean = 4.18), eating dates regularly helps to achieve healthy skin, hair and muscle tone (mean = 4.63), the seeds are used as food for horses, cattle, camels, sheep and goats and for
feeding chickens (mean = 4.18) and dates are excellent dietary fibre (mean = 4.06). The result on Table 6 shows that respondents had favourable perception towards medicinal (56.7%) and nutritional potentials (64.4%) of date palm, indicating that slightly less than half had unfavourable perception of the medicinal values. This suggests that high level of awareness of the medicinal values of date palm in the area did not translate to favourable perception of these values. On the other hand, the high level of awareness of the nutritional values did translate to favourable perception of the values. This implies also that rural dwellers did not express doubts over the efficacy of date palm in handling some of their nutritional needs but did raise doubts on its medicinal values.
Table 5: Distribution of respondents’ perceived nutritional and medicinal values of date palm
Medicinal values SA A U D SD Mean Status Eating dates everyday helps in controlling leprosy, asthma, bronchitis, tuberculosis, and fevers
55.6 36.7 5.6 0.0 2.2 4.43 F
Eating dates at bedtime and drinking a glass of warm water takes care of constipation
54.4 38.9 3.3 2.2 1.1 4.43 F
Eating dates daily assist in sexual debility 53.3 32.2 14.4 0.0 0.0 4.39 F Eating crushed dates cures general weakness. 54.4 34.4 10.0 1.1 0.0 4.42 F Rubbing seed of date fruit on a rough surface with water and applying the paste over the eyelids cures sore eyes
53.3 37.8 5.6 1.1 2.2 4.39 F
Date is a good replacement for potassium that is often lost during diarrhoea
52.2 33.3 12.2 1.1 1.1 4.34 F
Dates are effective in treating gonorrhea and urinary ailments
36.7 36.7 22.2 3.3 1.1 4.04 F
Eating date fruits by pregnant women labour reduces the need for inducing women at labour
45.6 37.8 11.1 5.6 0.00 4.23 F
It reduces intoxication 63.3 17.8 13.3 1.1 4.4 4.34 F It maintains healthy nervous system 51.1 33.3 11.1 2.2 2.2 4.29 F It strengthens tooth 66.7 15.6 11.1 5.6 1.1 4.41 F It strengthens tooth It is risky for diabetic patients 50.0 18.9 24.4 4.4 2.2 4.10 F Date palm maintains healthy heart 45.6 27.8 6.7 17.8 2.2 3.97 U Nutritional Value Date palm is a very good source of vit. B-complex and C
46.7 30.0 8.9 13.3 1.1 4.78 F
Dates are rich source of carbohydrate 73.3 13.3 12.2 1.1 0.0 4.59 F Dates are rich in essential minerals such as calcium, magnesium, iron, zinc, potassium, phosphorus, selenium and manganese
47.8 31.1 14.4 4.4 2.2 4.18 F
Eating dates regularly helps to achieve healthy skin, hair and muscle tone
78.9 8.9 10.0 1.1 1.1 4.63 F
The seeds are used as food for horses, cattle, camels, sheep and goats and to feed chickens
52.2 27.8 11.1 3.3 5.6 4.18 F
It is an excellent dietary fibre 47.8 24.4 17.8 5.6 4.4 4.06 F Source: Field survey 2014 F = favourable; U = unfavourable Table 6: Categorization of respondents’ perceived nutritional and medicinal values of date palm

Nigerian Journal of Rural Sociology Vol. 15, No. 2, March 2015
67
Category Scores F % Mean SD Minimum Maximum Perceived values
Medicinal
Unfavourable < 55.70 39 43.3 55.70 6.23 39.00 65.00 Favourable ≤ 55.70 51 56.7 Nutritional Unfavourable < 25.71 32 35.6 25,71 3.58 15.00 30.00 Favourable ≤ 25.71 64 64.4 Source: Field survey 2014 The study reveals that level of exposure to information (r = 0.410, and 0.332) and level of awareness (r=0.504 and 0.383) (Table 7) respectively had significant relationship with respondents’ perceived nutritional and medicinal values of date palm. In the same vein, levels of exposure to information (r = 0.578) and awareness (r = 0.409) significantly correlated with respondents’ level of perception of the nutritional and medicinal values of date palm The results show that awareness creation using different media has
been instrumental to helping the respondents understand better the nutritional and medicinal values of date palm, and this has consequently translated into their forming favourable perception of the plant’ values. This corroborates the findings of Ikwuakam, Sangotegbe and Akinbile (2013) which showed that awareness had positive and significant influence on perception of Moringa
oleifera values
Table 7: Relationship between respondents’ age, household size, level of exposure to information, awareness and perceived nutritional and medicinal values of date palm
Variable Nutritional Values Medicinal values r- value p- value Decision Variable r- value p- value Decisi
on Age 0.112 0.229 NS Age 0.104 0.330 NS Household size -0.039 0.716 NS Household size -0.055 0.605 NS Source of information
0.410 0.000 S Source of information
0.578 0.000 S
Awareness 0.504 0.000 S Awareness 0.409 0.000 S NS = Not Significant S = Significant
CONCLUSION
The study concludes that rural households in Katsina State comprised more of young than old household heads with relatively large household size. The major source of date palm was the market and it was mainly consumed dried. The various available media used in creating awareness among rural dwellers on the nutritional and medicinal values of date palm were effective, leading to high level of awareness and favourable perception among more than half of the respondents. Rural dwellers lack awareness of few important medicinal values of the plant and Islam provided a significant platform in creating awareness as it is considered as highly valuable among adherents, thereby increasing the understanding of rural dwellers on the medicinal and nutritional values of date palm. . RECOMMENDATIONS
Based on the findings of this, the following recommendations were made: 1. Vibrant efforts must be made by government at
the state and local government levels as well as non-governmental organisations in creating
awareness especially on the antioxidants content of date palm and its therapeutic potential to cancer
2. Community health workers and resident doctors in the local health centres of the study area should double their efforts in awareness creation on the values of date palm
3. The dissemination of such information should take into cognizance the specific forms of consumption for better results
REFERENCES
AbdulQadir, I. M., I. D. Garba, E. Eseigbe, E. I. Omofonmwan (2011) Nutritional components of Date palm and its production status in Nigeria, International Journal of Agricultural Economics & Rural Development - 4 (2): 83-89
Adesiji, G. B., M. G. Olujide, O. Bolarin, M. K. Sanusi, & S. E. Komolafe (2013): An assessment of Date Palm Technologies Utilised by the Farmers in Dutse Local Government Area of Jigawa State, Nigeria. Journal of Sustainable Development in Africa Vol.15, No.8 pp 14
Nigerian Journal of Rural Sociology Vol. 15, No. 2, March 2015
68
Akinbile, L. A and Aminu, O. O. (2012). Farmers’ Perception of Potentials of Jatropha Curcas in Mitigating Effects of Climate Change in Owo Local Government Area of Ondo State, Nigeria, Nigerian Journal of Rural Sociology, 13(1), 9-18
Ayanda, I. F., Akangbe, J. A. and Fakoya E. O. (2010): Participants perception of special Rice Project activities on rice production in Kwara State, Nigeria. The Nigerian
Journal of Rural Extension and
Development.Vol.3 July 2010.pp 23 Dada, M., C. N. Nwawe, R. A. Okere and I. O.
Uwubanmwen (2012) Potentials of Date Palm Tree to the Nigerian Economy World Journal of Agricultural Sciences Vol. 8 No 3: pp309-315
Darby, J. W., Ghalioungi, P. and Louis, G (1977). 'Food the Gift of Osiris' London: Academic
Erskine, W., A.T. Moustafa, A.E. Osman, Z. Lashine, A . Nejatian, T.Badawi & S.M. Ragy (2003). Date palm in the GCC countries of the Arabian Peninsula Available on http//www.icard.org/aprp/Datepalm/introduction/itro-body.htm
FAO (2008): FAO Statistical Data base (production data) Rome: FAO
Ikwuakam, O. T., N. S. Sangotegbe, & L. A. Akinbile (2014) Perceived Nutritional and Medicinal Values of Moringa oleifera
(zogale) among Rural Dwellers of Katsina State, Nigeria. Nigerian Journal of Rural
Sociology Vol. 14, No. 1 Lucas, A. and Harris, J.R. (1962): 'Ancient
Egyptian Materials and Industries' Pp.23, Edward Arnold Ltd, London.
Manniche, L. (1989): 'An Ancient Egyptian Herbal' p. 133-134. British Museum Publication Ltd.
Meludu, N.T., I.O. Ewebiyi and N.S. Sangotegbe (2012). Constraints to food safety practices of street food vendors in Ogun State, Nigerian Journal of Rural Sociology vol. 13 (1) 1-8
Morton, J (1987). Date In: Julia F, Morton, Miami, F.L Fruit of warm climates. Pp5-11
Nazir, W. (1970): 'Plants in Ancient Egypt' pp.340, Egyptian Co, Cairo
Omamor, I.B. Aisagbonhi, C.I. and Oruade Dimaro, E. A. (2000). Present Status of Date palm Diseases, Disorders and pests in Nigeria” In: proceedings of the Date palm international Symposium, Wind Hoek, Namibia 22– 25 February P. 237
Omoti, U. and Okolo, E.C. (2000). Date palm research in Nigeria: Progress and priorities. Proceedings of the Date palm international symposium held in Windhoek, Namibia. 22-25 February 2000. p. 351
Satis L (2010) Jatrophat Plantation Retrieved from www.svlele.com 10/08/2010
Suleiman, A. (2010). Cost and Return Analysis of fresh fish marketing in Kebbi State, Nigeria. The Nigerian Journal of Rural
Extension and Development. Vol.3 July, 2010 Pp.15-17
Wikipedia, (2011). The free encyclopedia htt://en.wikipeddia.org.wiki/phonenix_dactylifera
Zaid A. and Wet, P. F. (1999): Origin, Geographical Distribution and Nutritional Value of Date palm In: Zaid, A, (ed.) Date palm cultivation. Rome: FAO

Nigerian Journal of Rural Sociology Vol. 15, No. 2, March 2015
69
READERS’ PERCEPTION OF THE DEVELOPMENT INCLINATION OF ORIWU SUN
COMMUNITY NEWSPAPER IN IKORODU AREA OF LAGOS STATE
Badiru, I. O. and Ajao, S. T. Department of Agricultural Extension and Rural Development, University of Ibadan, Nigeria
E-mail: [email protected] ABSTRACT
Location and message content make Nigeria’s media urban-centred, thus creating information deficit on
development issues particularly in the rural areas. Since community newspapers are designed to fill this
development information gap at the local level, their efforts in carrying out this role deserve scrutiny. This study
therefore assessed readers’ perception of the development inclination of Oriwu Sun community newspaper in
Ikorodu area of Lagos State. Multistage sampling procedure was used to select 104 respondents from the study
area. Structured questionnaire was used to elicit information on demographic characteristics, content
preference, development roles, credibility and perception of the development inclination of the community
newspaper from the sampled respondents. Data were described using frequencies and percentages. Hypotheses
were tested using Spearman rho and Chi-square at 0.05 level of significance. Results show that most readers
were adults (77.9%), male (63.0%) with 17 years as mean year of living in the community. The most preferred
section of the newspaper content was the local/community news. The major roles performed by the newspaper
were giving voice to the community and mobilisation (�̅ =1.51) while, the watchdog role ranked lowly 4th.
Although the newspaper enjoys high credibility rating among the readers, they perceived it as having indifferent
inclination to development issues. The local news segment should feature more development content in order to
make it serve the community better.
Keywords: Community development news, media decentralisation, news credibility and development inclination.
INTRODUCTION
Communication is central to all human interactions (Bruce, Ellis and Delury, 2006). This is because the availability and free flow of information through an effective dissemination network represents a necessary pre-condition for the emergence of a crop of well-informed citizenry. Hence, it can be concluded that information is a basic human need. This basic need is however in short supply in the rural areas as the accessibility of the rural person to information is far from adequate (Issa, 2002). Relating the World Bank (2012) report that the rural population in Nigeria was slightly more (50.2%) than the urban population in 2010, with the rural media presence and reportage, one can conveniently say that there is an imbalance in terms of rural and urban reportage by Nigerian mass media. Since the rural populace is information-starved and also denied of having their voices heard in contrast to their urban counterparts, Issa (2002) posits that the rural area is one in which high level of social inequality is being silently but steadily perpetuated. This is as a result of the fact that the establishment and operations of agencies whose responsibilities are to ensure widespread information dissemination in Nigeria are strongly urban-biased in orientation. This trend often creates the un-wholesome impression that information needs and efforts toward its appropriate dissemination are strictly urban affairs. The establishment and operations of such mass-media agents as radio, television and newspaper houses are, to a large extent, exclusively urban and elitist, which, to say the least, negates rural interest. This
is a recipe for perpetual underdevelopment of the rural areas because Santas (2013) notes that rural development in relations to Africa will be inadequate if it does not accommodate rural development orientation. In the light of the foregoing, rural journalism becomes relevant in communicating the needs and aspirations of the rural people to the government. Although, it is often cited that the language of communication bars most of the rural dwellers from accessing the print media because of their low adult literacy level, it is hard to see a home in Southern Nigeria where they do not have a child in school even in the rural areas. Also, an equal or even more important issue of concern is that of content. Thorson, Meyer, Denton and Smith (2008) opine that the quality measurement of news is its content which can be sorted by topic (e.g., government, crime and judiciary, disasters, education, sports, weather, fashion, business and finance); by geography (local, state, national, international), type of writing (e.g., inverted pyramid versus narrative styles), and type of “voice” (e.g., straight news, opinion, analysis, columnists, citizen journalism). It can also be sorted by advertising versus editorial content and photos/illustrations/other visuals versus text. Hence, what is being presented to the reading public matters a lot. Another crucial quality of news is its believability or credibility. According to Rasha, Bruce, Michael, Paul and Denise (2002), credibility is defined as a multidimensional construct that measures the perceived believability of a message (article), source (journalist or media

Nigerian Journal of Rural Sociology Vol. 15, No. 2, March 2015
70
company) or medium (newspaper, web site, radio, etc.). Meyer and Zhang (2002) opine that the resulting higher quality justifies more public trust attributed to the newspaper and not only larger readership and circulation but influence which advertisers will want their names associated with it. This becomes more important given the background that sustainability of a media outfit is hinged on its ability to attract adverts. Since rural community radios have not fully been operational in Nigeria, reducing the information deficit in the rural areas becomes a major responsibility of the rural community newspapers among other existing traditional media. Aaneto and Anaeto (2010) state that the rural community newspaper is defined by community ownership, access, democratisation, local content and rural audience development as it help fine-tune the world view of the down trodden, give them voice and bring them closer to decision making process at the central level. Oriwu Sun is a community newspaper in Ikorodu area of Lagos state. The paper was launched on the 25th April, 1985 with the aim of sensitising, informing and educating the people of Ikorodu division of Lagos State, thus empowering them to participate actively in the development of their district. Journalists also make use of the publication to attract the attention of the authorities to the living conditions of the people of Ikorodu division, Lagos State. Main topics covered include social concerns, cultural and traditional matters, news, current affairs and the activities of the local and national governments as well as of high-profile personalities - all keeping pace with readers’ interests (International Programme for Development Communication, 1999). Considering that the newspaper has been in operation for three decades, there is the need to review its performance from the readers’ perspectives with a view to improving its service delivery to the community. Personal communication with the management of the newspaper and internet searches revealed little or no documentation of a similar effort in the past. Since the newspaper was conceived to empower the readers to actively partake in the development of their community through sensitisation, information and education, this study therefore assessed the readers’ perception of the development inclination of Oriwu Sun community newspaper in Ikorodu area of Lagos State. The specific objectives of the study were to; 1. determine the demographic characteristics of
readers, 2. ascertain the content preference of the
newspaper’s readers, 3. examine the development roles played by the
newspaper in the community;
4. assess the community newspaper’s credibility among the readers.
The following hypotheses stated in null form were tested; H01: there is no significant relationship between the
demographic characteristics of readers and their perception of the development inclination of the community newspaper.
H02: there is no significant relationship between readers’ credibility rating of the newspaper and their perception of its development inclination.
METHODOLOGY
Multistage sampling procedure was used to sample respondents in this study. Ikorodu Local Government Area (LGA) and two LCDAs (Ikorodu-North and Ikorodu-South) were randomly selected from the five Local Council Development Areas constituting Ikorodu LGA. Two wards each were randomly selected from the selected LCDAs and the LGA headquarters. From each ward, 40 respondents were selected to give a total of 240 respondents for the study. This was further trimmed down to 104 respondents who were readers of Oriwu Sun identified based on a prior question of “do you read Oriwu Sun community newspaper”? Structured questionnaires were used to elicit information on demographic characteristics, newspaper content preference, development roles of the community newspaper as well as readers’ perception of its development inclination from the sample. Data were described using frequency counts and, percentages. Hypotheses were tested with Chi-square and Spearman rho correlation at 0.05 level of significance. Perception of the development inclination of the community newspaper was measured with a list of attitudinal statements which were responded to using a five-point Likert type scale rated as strongly agree, agree, undecided, disagree and strongly disagree. The mean score was used to categorise the perception scores into favourable, neutral and unfavourable. Newspaper content preference was measured by asking the respondents to indicate their best-read sections of the newspaper by ranking while content/subject inclusion looked at what other content respondents would like to see in the newspaper. Development inclination roles performed by the newspaper were also asked to be indicated while respondents were equally asked to assess the credibility of the community newspaper in performing these roles using measures such as accuracy, balance coverage, concern for community wellbeing, trustworthiness, quality of writing and fairness of reporting over a four – point rating scale of excellent, good, fair and poor. These were scored 4, 3, 2 and 1 respectively.

Nigerian Journal of Rural Sociology Vol. 15, No. 2, March 2015
71
RESULTS AND DISCUSSIONS
Demographic characteristics
Table 1 reveals that the mean age of the readers was 39.69years. This suggests the presence of a youthful and vibrant category of respondents whose views will continue to matter for many years to come. Majority were male (63.0%), had higher education (81.0%) and were employed (69.0%) with many of the employment (40.0%) being paid ones. These imply that more men than women read the newspaper and suggests high literary predisposition in line with Agba (2002) who states that literacy is a very important readership factor. The high employment rate may be attributed to the fact that Ikorodu is a commercial centre as there are many governments and private owned organisations as well as other business oriented centres. Many of the respondents (56.0%) considered their community to be large with the mean length of living in the community being 17years. The fact that Ikorodu is among the five administrative divisions (Ikeja, Badagry, Ikorodu, Lagos and Epe) that constitute Lagos State makes the probability to view it as a small community very low. Also, the long length of residency makes their views important as this implies good knowledge of the community and its workings. This becomes relevant when one considers the position of Emke (2007) that long-term commitment to a community is fostered by local communications as this affects their commitment to stay in an area or their desire to leave. Table 1: Distribution of respondents by their demographic characteristics Variables Frequency Percent Mean Age (years) 16 – 29 23 22.1 39.69 30 – 43 31 29.8 44 – 57 38 36.5 58 – 73 12 11.5 Sex Male 65 62.5 Female 39 37.5 Highest
education
Primary school 3 2.9 Secondary 17 16.3 Mono-technic 39 37.5 University 39 37.5 Advanced 6 5.8 Employment
status
Employed 72 69.2 Unemployed 25 24 Retired 7 6.7 Occupation
Variables Frequency Percent Mean Age (years) Farmer 1 1 Trader 20 19.2 Artisan 9 8.7 Civil/private 42 40.4 Student 15 14.4 Nothing 17 16.3 Perceived size of Community 3 2.9 Mid-size 43 41.3 Large 58 55.8 Length of
residency
2 – 11 29 27.9 17.0 12 – 21 42 40.4 22 – 31 24 23.1 32 – 40 9 8.7 Source: Field Survey, 2014
Newspaper content preference
Table 2 shows that local/community news was the most preferred content (431.5) among the readers while pictures (430.5) and community people (405.5) were ranked second and third respectively. This result is in consonance with McTighe as cited by Sawisky (2010) that local coverage is the strength of the community newspaper whether it is a printed copy or an online version. Table 2: Newspaper content preference Newspaper content preference
Weighted score
Ranking
Local/community news
431.5 1st
Local school news 331.8 6th Features 327.2 7th Editorials 320.6 8th Community people 405.4 3rd Illustrations 374.0 4th Pictures 430.5 2nd Pull-outs 250.5 10th Advertorials 365.7 5th Religious news 285.7 9th Sport news 189.5 11th Source: Field Survey, 2014 Credibility rating of Oriwu Sun community
newspaper by readers
Table 3a shows that respondents rated Oriwu Sun highest in terms of accurate reportage (�̅ = 3.29). Other areas where it was rated very high were quality of writing (�̅ = 3.28) and trustworthiness (�̅ = 3.26). Table 3b further reveals that majority of the respondents (65.4%) rated Oriwu Sun high on credibility as against few (34.6%) who rated it low. These findings indicated that Oriwu Sun has great potential for being used in

Nigerian Journal of Rural Sociology Vol. 15, No. 2, March 2015
72
disseminating vital development information to majority of the readers who consider its contents as highly credible and therefore likely to adopt or act on its messages.
Table 3a: Distribution of the credibility ratings of Oriwu Sun community newspaper by the readers Factors Mean Accuracy 3.29 Balance coverage 3.11 Quality of writing 3.28 Fairness of reporting 3.13 Concern for community wellbeing 3.11 Trustworthiness 3.26 Source: Field Survey, 2014
Table 3b: Level of credibility Perceived credibility Frequency Percent
Low 36 34.6 High 68 65.4 Total 104 100
Mean = 19.16346; SD = 2.413999; Min = 10, Max = 24
Source: Field Survey, 2014
Roles of community newspaper
Table 4 reveals that the community newspaper was considered to be more important and passionate in giving the community people a voice (�̅ =1.51) and a means of mobilisation (�̅ =1.50) compared to its watchdog (�̅ =1.40) and economy
boosting roles (�̅ =1.40). This finding implies that Oriwu Sun was seen by many of the readers more as a means of informing the world about their situations and for mobilising the people for development of the community. Table 4: Roles of Oriwu Sun community newspaper Roles Mean Ranking Mobilising power 1.50 2 Voice 1.51 1 Watchdog 1.40 4 Promotional 1.42 3 Boost local economy
1.40 4
Source: Field Survey, 2014
Perception of development inclination of Oriwu
Sun community newspaper
As shown in Table 5b, most of the readers (77.0%) were neutral in their disposition to the development inclination of Oriwu Sun community newspaper compared to a few (11.5%) who were strongly disposed to it either favourably or unfavourably. This implies that the readers were largely non-committal in their perception of the development inclination of Oriwu Sun newspaper in Ikorodu area. This suggests that more efforts are still needed by the newspaper to convince the readers of their inclination as a development-focussed medium in the community.
Table 6a: Distribution of respondents by perception of development inclination of Oriwu Sun community newspaper Perception statements SA A U D SD The community newspaper gives me a sense of attachment or belonging to the community.
39 51 19 12 1
There is no bond between the community and the community newspaper.
5 26 12 49 30
The paper does not facilitate change and development of the community.
24 23 20 24 31
The community newspaper enhances in me a sense of shared identity with other community members.
36 46 12 27 1
The paper provides content that are irrelevant and irresponsive to the needs of the community.
21 24 10 33 34
The community newspaper aids maintenance of infrastructural facilities.
33 23 47 17 2
The community newspaper makes me have interest in what is going on.
31 43 16 27 5
The paper operates solely for profit and does not bridge the information gap of the community.
7 27 38 18 32
The community newspaper creates awareness on key matters/issues about the community.
43 55 8 9 7
The community newspaper upholds community (religious) institution.
33 44 20 12 13
There is no linkage of the community newspaper to our community.
13 13 18 41 37
The community newspaper plays an important role in this region’s economic development.
23 27 34 21 17
Nigerian Journal of Rural Sociology Vol. 15, No. 2, March 2015
73
Perception statements SA A U D SD The community newspaper spurs local leaders to action. 20 50 25 18 9 Sometimes the community newspaper champion particular development strategies to help the community to develop appropriately.
34 53 31 2 2
The paper is never a good medium to facilitate dialogue on the reasons for local leaders to take actions.
15 20 9 59 19
News covered by the community newspaper is never found in any other newspapers.
20 27 34 27 14
The community newspaper gives information needed to hold government or local leaders accountable.
34 46 12 20 10
I can easily comprehend the content of the community newspaper.
50 49 9 6 8
It provides no information and reflections for me to be aware of current events in the community.
16 30 10 41 25
In-depth information needed to checkmate activities of leaders is not provided by the paper.
40 34 22 17 9
Source: Field Survey, 2014
Table 6b: Level of perception
Perception Frequency Percent Parameters
Unfavourable 12 11.5 Minimum = 73 Neutral 80 77.0 Maximum = 116 Favourable 12 11.5 Mean = 92.68269 Total 104 100 SD = 9.601036 Source: Field Survey, 2014
Hypotheses testing
The results of the chi-square and correlation analyses on Table 7 indicate that there was no significant relationship between demographic characteristics and perception of development roles of Oriwu Sun community newspaper. This implies that the demographic characteristics of the respondents do not influence their perception of the development inclination of Oriwu Sun community newspaper. Table 7a: Chi-square and correlation analyses of relationship between demographic characteristics and perception of development inclination of Oriwu sun community newspaper Demographic characteristics
χ2 p-value Decision
Sex 2.791 0.162 Not Significant Education 6.165 0.237 Not Significant Employment 0.974 0.096 Not Significant Occupation 3.310 0.176 Not Significant Perceived location of area
2.435 0.151 Not Significant
r-value
Age -0.084
0.394 Not Significant
Length of residency
-0.062
0.535 Not Significant
The result of the relationship between perceived credibility and perception of
development inclination of Oriwu sun community newspaper on Table 8 shows a non-significant relationship. This implies that the respondents’ high credibility rating of the newspaper does not influence their perception of the paper as having a development inclination.
Table 8: Chi-square analysis of relationship between perceived credibility and perception of development inclination of Oriwu sun community newspaper χ2 p-value Decision Perceived credibility and perception of development inclination of the newspaper
3.392 0.183 Not Significant
Field survey (2014)
CONCLUSION AND RECOMMENDATION
The study revealed that readers of Oriwu Sun community newspaper are not clearly convinced of the development inclination of the newspaper in spite of the high credibility it enjoyed among them. They however expressed their preference for its news content and affirmed that it played a great role in giving voice to and mobilising the community members. It is therefore recommended that the local news segment of the community newspaper should feature more development

Nigerian Journal of Rural Sociology Vol. 15, No. 2, March 2015
74
content in order to make it serve the community better. REFERENCES
Agba, P. C. (2002). Perspectives in newspaper readership: Towards revitalizing the newspaper industry in the southeast Nigeria. Nsukka Journal of the
Humanities, 12, 120 – 141. Anaeto, S. G & Anaeto, M. (2010). Rural
Community Newspaper: Principles and
Practices, 2nd edition. Ibadan: Stirling-Horden, pp. 9 - 58.
Bruce, D., Ellis, K. & Delury, N. (2006). The Role and Impact of Community Newsletters in Fostering Social Cohesion and Community Development: Case Study. Journal of Rural and Community
Development 1, pp 176-185. Emke, I. (2007). Glue, Oil and Web: The Role of
Community Newspapers. In Canadian
Sociology Association annual meeting,
Saskatoon, Saskatchewan, (Unpublished),
pp. 2 – 22. Available from http://research.library.mun.ca/id/eprint/95.
Intergovernmental Conference of the International Programme for the Development Communication (1999): IPDC-UNESCO
prize for rural communication, IPDC Bureau extraordinary meeting, Paris, 20th March, 2000, pp. 27 – 28.
Issa, A. O. (2002). Information Dissemination to
the rural persons in Nigeria: A
Librarian’s Perspective. Retrieved from http://unilorin.edu.ng/publications/issaao/information%20 dissemination%20 to%20 the%20 rural%20 persons %20in%20nigeriapdf.
Lagos State Independent Electoral Commission (2011). Names of Local Government/Local
Council Development Areas and Wards in
Lagos State. Available on http://lasiec.org.ng/media-centre/news. Retrieved on 13th February, 2014.
Meyer, P. & Zhang, Y. (2002). Anatomy of a Death
Spiral: Newspapers and Their Credibility.
Paper delivered to the Media Management and Economics Division, Association for Education in Journalism and Mass Communication, Miami Beach, Fla., August 10, 2002.
Rasha, A. A., Bruce, G., Michael, S., Paul, D., & Denise, C. (2002). The Credibility of
Newspapers, Television News, and Online
News, A paper presented to the Mass Communication and Society Division, Association for Education in Journalism and Mass Communication, annual convention, Miami Beach, Fla.
Santas, T. (2013). Mass media, mass mobilisation
and rural development in Nigerian
democracy. An unpublished paper. Sawisky, G. (2010). Examining the Community
Press in the Present and Future. Small
cities Imprint, vol 2 No1, pp 31 – 60. Thorson, E., Meyer, H., Denton, F. & Smith, J.
(2008). Prediction of Print and Online
Newspaper Readership from Indices of
News Quality. Paper presentation at the annual meeting of the International Communication Association, TBA, Montreal, Quebec, Canada. Retrieved from http://citation.allacademic.com/meta/p233297_index.html.
World Bank (2012). Rural Population in Nigeria. Retrieved from: http://www.tradingeconomics.com/Nigeria/rural-population-wb-data.html.
Nigerian Journal of Rural Sociology Vol. 15, No. 2, March 2015
75
ROLES OF CREDIT INSTITUTIONS IN THE IMPROVEMENT OF RURAL LIVELIHOOD AND
POVERTY ALLEVIATION IN MANGU LOCAL GOVERNMENT AREA, PLATEAU STATE
Ejembi, S. A., Attah, A. J. and Damulak, J. S. Department of Agricultural Extension and Communication, University of Agriculture, Makurdi, Nigeria
E-mail: [email protected] ABSTRACT
Successive Nigerian governments have made great efforts toward the improvement of rural welfare through
poverty alleviation. These efforts translated into the establishment of several rural development programmes
including Agricultural Credit Guaranteed Scheme (ACGS) and Nigerian Agricultural Cooperative and Rural
Development Bank (NARCDB). This study is an assessment of the roles of these financial institutions in
improving the lives of the rural people of Mangu Local Government in Plateau state in terms of provision of
credit to enable adoption of technologies. The specific objectives were to identify the technologies available to
the people, examine farmers’ accessibility to the credit facilities and determine the extent to which accessibility
of credit facilities has helped adoption of innovation in the area. A total of 106 respondents were selected using
a stratified random sampling technique. Structured questionnaire was used to collect data from respondents.
Data were analysed using percentages and frequency distribution. The results of the analysis show that 87.5%
of the respondents agreed that very few of the technologies available were adopted because of financial
constraints. Also, 80.0% indicated that it was quite difficult to access the credit due delay in document
processing (41.96%, unattainable collaterals (27.68% and other corrupt practices 25%). He financial
institutions helped the very few to adopt technologies that were capital intensive by providing the required
credit. It was concluded based on the findings that the establishment of credit institutions has not helped the
Mangu people much, because of the inaccessibility of the facilities. Consequently, it is recommended that
farmers in this area should reduce their dependence on the formal financial/credit institutions by adopting
technologies that are less capital intensive or alternatively form their own traditional credit systems.
Technology development for farmers should take into account the social and economic capacity of the people to
have the desired impact on the people.
Keywords: Roles, credit institutions, improvement, rural, livelihood, poverty alleviation
INTRODUCTION
There has been a search by the founding fathers of sociology for a better society that is free of crime, impoverishment, undignified means of livelihood and resultant poverty which is also the focus of rural development policies and programmes in Nigeria. Rural livelihood has been bedeviled with drudgeries and poor returns on investments which have resulted in disenchantment on the part of rural dwellers and farmers making them to become fatalistic. It is a truism that rural livelihood depends largely on agricultural activities and its allied enterprises. As a consequence, agricultural practices cannot be undermined by any government. According to Famoriyo (1992), agricultural policies seem to be on tackling the technical aspects of production, the view of successive governments is that these technical aspects inhibited effective performance of the agricultural sector as the people not really empowered. He noted that such technical aspects are those related to low level of agricultural technology, inadequate quantity and quality of farm inputs and inadequate infrastructural facilities for storage, processing, marketing and distribution of farm produce. Mostly and Verschoor (2003) noted that Nigerian agricultural sector is unable to meet its basic traditional responsibility of providing food to the teeming population hence the decline in the
living standard of the rural people. According to Olubiyo and Hill (1998), about 94% of farmers in Nigeria are small scale farmers as they have farm plots of less than 10 hectares. About 98% of food crops are incidentally produced by these small scale farmers in spite of their limited access or none at all to innovations due to poor social, economic, cultural and institutional conditions. The major obstacle to agricultural and rural development is the difficulty in accessing credit facilities due to stringent collateral requirements. This made adoption of innovation an uphill task to farmers that resulted to the type of condition Ater (1991) described as being in the vicious cycle of poverty. This situation has affected their productivity and consequently their livelihoods means. In order to tackle these problems, successive regimes came up with agricultural financing policies. Agricultural financial institutions have the support of these agricultural financial policies in Nigeria. These policies acknowledge that agriculture has pivotal position in national development as the sector provides food, raw materials for industries, employs the bulk of the nation’s population, and generates foreign exchange as well as marketing outlet for industrial products. Therefore, it was conceived that farmers necessarily require financial assistance which should get to them with minimal stress or efforts. These policies also stipulated specific roles for

Nigerian Journal of Rural Sociology Vol. 15, No. 2, March 2015
76
these financial institutions including sustainable financing schemes, provision of prompt micro and macro credit facilities. This was believed will enable farmers contribute to food security, poverty reduction, generate further employments, reduce rural-urban migration, improve rural livelihood, reduce poverty and excessive dependence on importation as well as improve foreign exchange. To this effect, successive governments set up schemes, programmes and institutions such as Nigerian Agricultural Cooperative and Rural Development Bank (NACRDB), Agricultural Credit Guaranteed Scheme Fund (ACSGSF), the Peoples Bank of Nigeria (PBN), Community Bank (CB) just to mention these few. The rational for establishing these institutions was to provide farmers with purchasing power which will increase their productivities and improved living standard through enhanced income in the process (Aiyedu, 1995; Polson and Spencer, 1991). Agricultural inputs are generally costly, modern technological requirements for better agricultural output have not made it any cheaper or better, hence the need for institutional financial supports. Over time, it was observed that there has not been any significant improvement in the lives of farmers in Mangu Local Government Area. The question now relates to what extent has these institutions performed these roles toward the people of Mangu Local Government Area of Plateau state. As a result, this study sets out to assess the roles of credit institutions in the improvement of rural livelihood with specific reference to Mangu Local Government Area. In order to do this, the following questions become pertinent: i. What are the socio-economic characteristics of
the people in the study area? ii. What are the technologies available to farmers
that financial resources have constrained their adoption?
iii. What are their levels of adoption? iv. To what extent have these institutions carried
out their responsibilities to the people. The specific objectives of this study were to: • examine the socio-economic characteristics of
the people in the study area • identify the technologies available to farmers
that financial resources have constrained their adoption
• Determine their levels of adoption • Assess the extent to which these institutions
carried out their responsibilities to the people.
METHODOLOGY
This study was carried out in Mangu Local government Area of Plateau State. Mangu is made up of 20 council wards. The land is vast but undulating, however, it is very suitable for cultivating Irish potatoes, cabbage, apple, and any other temperate crops. The people grow maize,
millet and keep livestock. Mangu local government area is a multi-ethnic setting with Mwaghavul, Pyem and Kwandu as the major languages spoken. The people are mainly farmers. The study was targeted at the Nigerian Agricultural Cooperative and Rural Development Bank loan beneficiaries. This is the financial institution in the local government area. Fifteen (15) out of the 20 council wards were selected through systematic random sampling. Each of the council wards had specific number of target beneficiary, so in the 15 council wards there was a total of 350 beneficiaries. Thirty (30) percent of this population was used proportionately to randomly select 106 beneficiaries which constituted the sample for this study. The details of the sampling procedure and size are presented in Table 1 below: Table 1. Summary of sampling procedure and sample size Communities/council wards
Population of beneficiaries (x)
Sample size 30% of x
Ampang West 35 11 Mangu 25 8 Kerang 23 7 Langai 24 7 Chanso 12 4 Kadunu 21 6 Pushit 18 5 Kanbum 30 9 Mangu Halle 37 11 Bwonpe 24 7 Panyam South 22 7 Junnaret 17 5 Gindiri Ward II 20 6 Mangu Daro 27 8 Jipal 15 5 350 106 Data were collected from respondents using questionnaire and interview schedule. Data collected were analysed using frequency and percentages. RESULTS AND DISCUSSION
The results of this study are presented on the basis of the specific objectives: Table 2. Distribution of respondents according to their socio-economic characteristics Characteristics Frequency Percentage Sex
Male 75 70.8 Female 31 29.2 Total 106 100
Age
26-30 10 9.4 51-35 3 2.8 36-40 5 4.7

Nigerian Journal of Rural Sociology Vol. 15, No. 2, March 2015
77
Characteristics Frequency Percentage 41-45 13 12.3 46-50 32 30.2 51-55 21 19.8 56-60 22 20.8 Marital status
Married Single Total
Family size
100 6
106
94.3 5.7 100
1-5 21 19.8 6-10 68 64.2 11 and above 17 16.0 Educational
qualification
Adult education 26 24.5 Primary education 30 28.3 Post primary 28 26.4 Tertiary 22 20.8 Estimated annual income (₦)
Below 20000 68 64.2 20,000-40000 22 20.8 40001-60000 16 15.0 >60000 106 100 Total
Table 2 presents the analysis of the socio-economic characteristics of respondents. The entries show that 70% of the respondents were male, many (about 29%) were aged between 46 and 50 years, about 94% were married, majority (64.2%) had family sizes of between 6-10 members, many (28.3%) had primary school certificate educational status. The findings show that the people in the study were married and therefore responsible enough to judiciously use whatever credit they may access. Their ages of between 46 and 50 years also indicate the fact that the people had cognate farming experience to suggest that they truly understood what to do with the loan when accessed. The findings also indicate that everybody had attained one level of education or another. This suggests that the people are literate enough to understand agricultural innovations and can decide on what agro-allied information will be of significance to them. Table 3. Distribution of respondents according to technologies available Technology Frequency Percentage Improved seeds 5 4.8 Improved feeds 2 1.9 Fertilizers/pesticides 23 21.7 All of the above 76 71.7 Total 106 100.1
Table 3 is an analysis of data collected on the availability of technology in the area. The table
reveals that improved seed, improved feeds and chemicals such as fertilizers and pesticides were some of the innovations introduced to them. It was observed that the innovations all centered on farm inputs which require enhanced financial capacity to adopt. This makes the role of financial institutions critical to get the farmers to remain in business. Table 4. Distribution of respondents based on their perceptions of adoption of levels Level of adoption Frequency Percentage Low 94 88.7 High 12 11.3 Moderate 0 0 Total 106 100
Objective 4 was to examine the adoption levels of these innovations. The analysis in table 4 therefore is on the level of adoption of these technologies. The entries show that about 89% had low adoption level whereas about 11% had high adoption level. Table 5. Distribution of respondents according to their reasons for adoption levels Reasons Frequency Percentage Insufficient land 4 3.8 Lack of time 2 1.9 Insufficient funds 100 94.3 Total 106 100
The reasons for this abysmally low adoption level were further investigated and the results are presented on Table 5. The entries in the table show that majority (about 94%) of the respondents indicated that their low level of adoption of the various innovations in the area were due to insufficient or lack of funds. This finding disproves the notion that farmers are usually constrained by tradition which made them to be conservative and not always willing to accept innovation. Funds in this case are the limiting factors to adoption of innovation. Pam (1993) had earlier reported that farmers are not as conservative and unattractive to improved technologies but that they are only just being rational bearing in mind their resource poor state. This finding thus reinforces this perception. It is only logical for anyone who is poor to be risk aversive (Mostly and Verschoor, 2003).
Table 6. Distribution of respondents according to their frequency of benefits from financial institutions No. of times Frequency Percentage Once 22 20.8 Twice 43 40.6 Thrice or more 41 38.7 Total 106 100.1
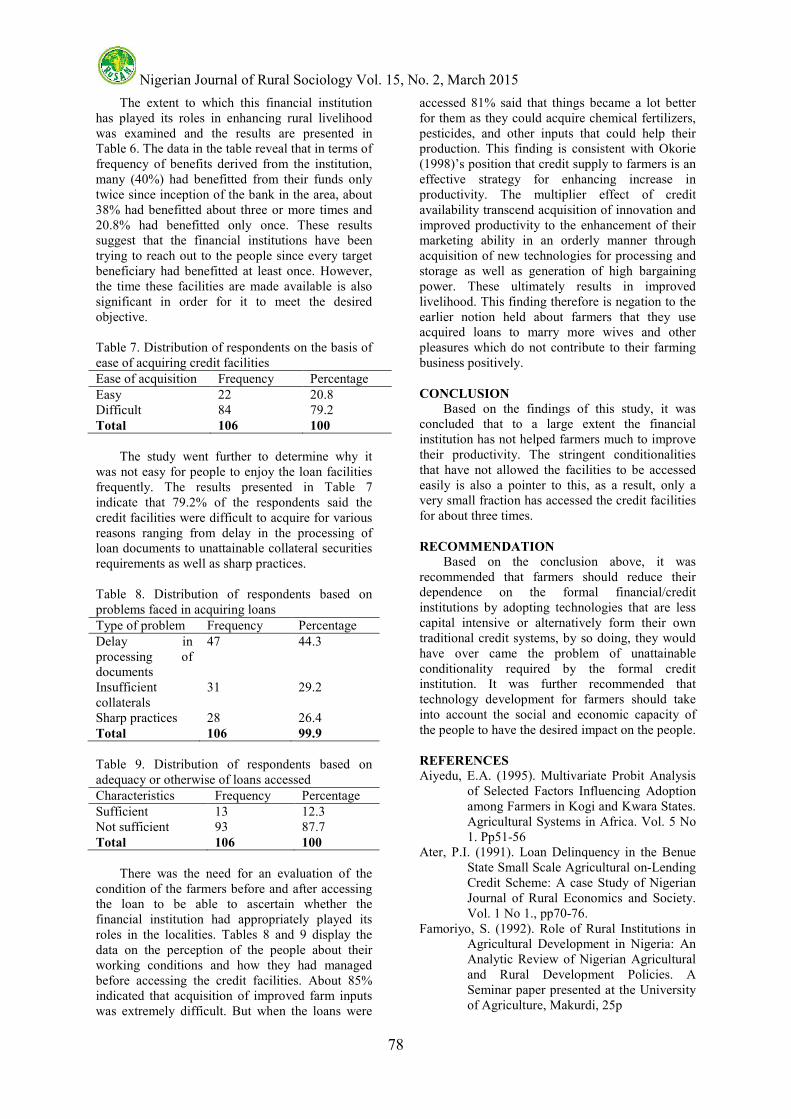
Nigerian Journal of Rural Sociology Vol. 15, No. 2, March 2015
78
The extent to which this financial institution has played its roles in enhancing rural livelihood was examined and the results are presented in Table 6. The data in the table reveal that in terms of frequency of benefits derived from the institution, many (40%) had benefitted from their funds only twice since inception of the bank in the area, about 38% had benefitted about three or more times and 20.8% had benefitted only once. These results suggest that the financial institutions have been trying to reach out to the people since every target beneficiary had benefitted at least once. However, the time these facilities are made available is also significant in order for it to meet the desired objective.
Table 7. Distribution of respondents on the basis of ease of acquiring credit facilities Ease of acquisition Frequency Percentage Easy 22 20.8 Difficult 84 79.2 Total 106 100
The study went further to determine why it was not easy for people to enjoy the loan facilities frequently. The results presented in Table 7 indicate that 79.2% of the respondents said the credit facilities were difficult to acquire for various reasons ranging from delay in the processing of loan documents to unattainable collateral securities requirements as well as sharp practices.
Table 8. Distribution of respondents based on problems faced in acquiring loans Type of problem Frequency Percentage Delay in processing of documents
47 44.3
Insufficient collaterals
31 29.2
Sharp practices 28 26.4 Total 106 99.9
Table 9. Distribution of respondents based on adequacy or otherwise of loans accessed Characteristics Frequency Percentage Sufficient 13 12.3 Not sufficient 93 87.7 Total 106 100
There was the need for an evaluation of the condition of the farmers before and after accessing the loan to be able to ascertain whether the financial institution had appropriately played its roles in the localities. Tables 8 and 9 display the data on the perception of the people about their working conditions and how they had managed before accessing the credit facilities. About 85% indicated that acquisition of improved farm inputs was extremely difficult. But when the loans were
accessed 81% said that things became a lot better for them as they could acquire chemical fertilizers, pesticides, and other inputs that could help their production. This finding is consistent with Okorie (1998)’s position that credit supply to farmers is an effective strategy for enhancing increase in productivity. The multiplier effect of credit availability transcend acquisition of innovation and improved productivity to the enhancement of their marketing ability in an orderly manner through acquisition of new technologies for processing and storage as well as generation of high bargaining power. These ultimately results in improved livelihood. This finding therefore is negation to the earlier notion held about farmers that they use acquired loans to marry more wives and other pleasures which do not contribute to their farming business positively.
CONCLUSION
Based on the findings of this study, it was concluded that to a large extent the financial institution has not helped farmers much to improve their productivity. The stringent conditionalities that have not allowed the facilities to be accessed easily is also a pointer to this, as a result, only a very small fraction has accessed the credit facilities for about three times.
RECOMMENDATION
Based on the conclusion above, it was recommended that farmers should reduce their dependence on the formal financial/credit institutions by adopting technologies that are less capital intensive or alternatively form their own traditional credit systems, by so doing, they would have over came the problem of unattainable conditionality required by the formal credit institution. It was further recommended that technology development for farmers should take into account the social and economic capacity of the people to have the desired impact on the people. REFERENCES
Aiyedu, E.A. (1995). Multivariate Probit Analysis of Selected Factors Influencing Adoption among Farmers in Kogi and Kwara States. Agricultural Systems in Africa. Vol. 5 No 1. Pp51-56
Ater, P.I. (1991). Loan Delinquency in the Benue State Small Scale Agricultural on-Lending Credit Scheme: A case Study of Nigerian Journal of Rural Economics and Society. Vol. 1 No 1., pp70-76.
Famoriyo, S. (1992). Role of Rural Institutions in Agricultural Development in Nigeria: An Analytic Review of Nigerian Agricultural and Rural Development Policies. A Seminar paper presented at the University of Agriculture, Makurdi, 25p

Nigerian Journal of Rural Sociology Vol. 15, No. 2, March 2015
79
Mostly, P. and Verschoor, A. (2003). Risks Attitudes in the Vicious Circle of Pobverty. University of Shieffield press, pp 2-26.
Okorie, A. (1998). Management of Risks and Default in Agricultural Lending. Pp 131-138
Olubiyo, S.O. abd Hill, G.P. (2002). Beyond Risk Factor Bank Lending to Small Scale Peasant Farmers in Nigeria. African Review Issues. Pp 10-21
Pam, R.D. (1993). The Concept of Linking Self Help Groups with Banks for Savings Mobilization and Credit Delivery. A paper presented at NACB Agricultural Credit Supervisors course on Small Scale Loan Scheme in Minna, Nigeria state on 8-12 November.
Polson, R.A. and Spencer, D.S.C. (1991). The Technology Adoption Process in Subsistent Agriculture: The Case of Cassava in South West Nigeria. Agricultural Systems vol. 36, pp 65-78.

Nigerian Journal of Rural Sociology Vol. 15, No. 2, March 2015
80
RURAL HOUSEHOLDS’ PERCEPTION OF SOLAR ENERGY AS AN ALTERNATIVE SOURCE OF
HOUSEHOLD ELECTRICAL ENERGY IN OYO STATE, NIGERIA
Ajao, I. E. and Oyesola, O. B. Department of Agricultural Extension and Rural Development, Faculty of Agriculture and Forestry, University
of Ibadan, Nigeria E-mail: [email protected]; [email protected]
ABSTRACT
Electrical energy is important for sustainable livelihood within rural households of Nigeria. Inconsistent and
lack of electricity supply from the national grid is problematic. This study investigated rural households’
perception of solar energy as an alternative source of electrical energy in Oyo State. A multi-stage sampling
procedure was used to select 130 rural households. Data were collected using structured interview schedule
and analyzed using both descriptive and inferential statistics. Majority (68.8%) of the respondents were male
and 66.7% earned less than N20,000 in a month. Majority (67.2%) were connected to the national electricity
grid (PHCN) with average electricity supply of 4 hours in 3 days per week. Most households spent N13,163.40
per month in fuelling their generators. The major household appliances respondents were willing to power with
solar energy were light bulbs (95.2%), television (92.0%), charging of phone (87.2%), standing fan (66.4%),
rechargeable lamp (60.0%), radio (55.2%), and DVD (52.9%) for 6-12 hours per day. Majority (52.8%) had an
unfavourable perception towards use of solar energy as an alternative source of household electrical energy.
There were significant relationships between respondents’ monthly income (r=0.269, p=0.002), religion
(��=0.244, p=0.019), education (��=0.238, p=0.050) and perception toward the use of solar energy as an
alternative source of household electrical energy. It was concluded that the respondents in the study area had
an unfavourable perception towards solar energy as an alternative source of household electrical energy,
therefore, rural households’ should be enlightened about solar energy.
Keywords: Solar energy, Alternative energy sources, perception, rural households INTRODUCTION
In the Western world, access to energy is considered an essential part of everyday life, yet, it is a great challenge in developing countries. According to World Energy Outlook (2014), billions of people lack access to most basic energy services and they are concentrated mainly in rural and peri-urban areas in developing countries in sub-Saharan Africa and Asia. Electricity is conceivably the most multipurpose energy carrier in modern global economy, and therefore primarily linked to human and economic development (Bazmi and Zahedi, 2011). About 1.3 billion people around the world are without access to electricity (International Energy Association IEA, 2014), amounting to over 18% of the world’s population and more than 95% of these people are either in sub-Saharan African or Asia with 84% residing in rural areas. Nigeria’s annual per capita electricity consumption is 106.63KWh (CIA World Factbook, 2012), which is 5% of Brazil’s (2,286.26KWh) and 3% of South Africa’s (4347.43KWh). The household sector accounts for the largest consumption of electricity and its consumption continues to rise as population increases (Eronini, 2014). Access to reliable and stable supply of electricity is a major challenge for both the urban and rural dwellers. In Nigeria, 49.4% of the population live without electricity (World Bank, 2012) and this is worse in the rural areas where more than 75% of Nigerian populace reside as the availability of electricity drops to 15% (Okafor and Uzuegbu, 2010).
According to Oyedepo (2014), access to reliable electricity enhances the quality of life and may provide economic returns in the long run that far exceed the costs involved. Electricity is essential for effective communication and information spread which is a vital component of agricultural production and marketing. The sources of information that are readily available to the rural farmers are radio, television, mobile phones; all of which require constant power supply for continuous use (Global Energy Access, GEA). Mobile phones, used by rural dwellers primarily for information exchange, are powered by rechargeable batteries, and lack of electricity for recharging is a huge constraint on use. Likewise, without electricity, extending common democratic norms and values through radio and television will be very difficult (Adejumobi, Adebisi and Oyejide, 2013). Most of the rural areas are off the national electricity grid because building power grids across long distances to reach remote communities is slow and costly. Energy companies and governments complain that they do not have the money to invest in electricity supply for rural areas where the density is low, the people are subsistence farmers living on less than $2 a day, the returns often fail to justify the massive investment (Uyigue, 2007). Moreover, the national grid is plagued by rather frequent power outages that last for several hours daily in places that are connected to the grid (Omorogbe, 2014). Majority of these people rely on candles, battery lamps, and CO2 emitting kerosene lanterns and diesel/petrol generators to light their homes. These fuels are dirty and contribute millions of tons

Nigerian Journal of Rural Sociology Vol. 15, No. 2, March 2015
81
of CO2 into the atmosphere. Burning kerosene in African homes and small businesses causes an estimated 30million to 50million tons of CO2 emissions annually (World Bank, 2010), resulting in air pollution and global warming. These alternatives can also be very expensive. The United Nations Environment Program estimates that Africans spend between $12 billion and $17 billion a year on fuel-based lighting. Recently, there has been an increasing advocacy for the use of renewable energy which is abundant in supply, naturally re-generated and environmentally friendly. There are several types of renewable energy but sunlight (solar energy) is the most predominant source of energy, as it contains a surprisingly large amount of energy capable of meeting the energy needs of whole world (Oji, Idusuyi, Aliu, Petinrin, Odejobi and Adetunji, 2012 ). It can also provide more power than any fossil fuel on the planet. The earth receives energy of about 1353W/m2; 120,000 terawatts directly from the sun on a daily basis (Chen, 2009). Nigeria enjoys an average daily sunshine of 6.25 hours, ranging between about 3.5 hours in the coastal areas and 9.0 hours at the far northern boundary. The annual average daily solar radiation in Nigeria is about 5.25 kWh/m²/day, varying between 3.5 kWh/m²/day in the coastal areas and 9.0 kWh/m²/day at the northern boundary. Solar energy is therefore Nigeria’s best opportunity at weaning itself off dependence on fossil fuels. Solar energy is not to power every household appliance but a few lights, cell phone chargers, and other basic necessities that can still significantly improve people’s lives. Investing in smaller energy outfits better fits the budget of the rural poor. In spite of its suitability, solar energy is making only very slow inroad into the Nigerian energy supply mix due to several factors such as lack of awareness, unfavourable perception about solar energy, its high cost of initial set-up and lack of recipient’s involvement in its set-up. This study therefore investigated rural households’ perception of solar energy as an alternative source of household electrical energy.
METHODOLOGY
The study was carried out in Oyo State. The target population for this study was rural household heads. Multi-stage sampling procedure was used in selecting the respondents. Afijio Local Government was purposefully sampled as a result of the ongoing collaboration among department of Agricultural Extension and Rural Development (AERD), Centre for Petroleum Economics and Energy Law (CPEEL), University of Ibadan and Imini community in Afijio Local Government on alternative/renewable energy projects. Afijio Local
Government has 10 wards: Ilora I, Ilora II, Ilora III, Fiditi I, Fiditi II, Fiditi III, Aawe I, Aawe II, Akinmorin/Jobele, Iware and Imini. Simple random sampling was used to select Akinmorin and Iware from the remaining 9 wards. A total of 130 rural household heads were randomly selected. Primary data was used for the study with the use of structured interview schedule. The Perception of respondents towards solar energy as an alternative source of household electrical energy was measured using a 5 point Likert scale of Strongly Agree (SA), Agree (A), Undecided (UD), Disagree (D) and Strongly disagree (SD) which were awarded scores of 5, 4, 3, 2, 1 respectively for positive statements and in reverse order for negative statements. A total of 16 statements were used, with a minimum score of 37, maximum score of 73, mean score of 54.6 and standard deviation of ±7.56 after analysis. Respondents with perception score less than mean (<54.6) were categorized as having unfavourable perception while mean and above (≥54.6) were categorized as having favourable perception. Descriptive statistical tools such as frequency counts, percentages and means were used to describe the data collected, while inferential statistical tools such as Chi-square, Pearson Product Moment Correlation (PPMC) were used to test the hypothesis.
RESULT AND DISCUSSION
The age distribution on Table 1 reveals that 76.8% of the respondents were less than 50 years of age, while 23.2% were older than 50 years. The mean age observed was 41 years, which implies that majority of the respondents were within the age of 40-50 years. The household heads were within the active age and the implication is that people within this age-group are liable to adopt new technology like solar energy. Majority (68.8%) of the respondents were male while 31.2% were female implying that there were more male-headed households than female-headed households in the study area. Household heads are the decision makers in the house as asserted by
FAO (2002) report that the sex of household head is used as a proxy for assessing decision-making within a household. In order to secure a more favourable perception about solar energy, household heads especially men should be educated on the mode of operation and advantages of solar system. There were more married household heads in the study area as 76.0% of the respondents were married. Majority of the household heads had one form of formal of formal education or the other, as only 20.5% had no formal education, meanwhile, 33.3% had secondary education, 25.6% had primary education and 20.5% had tertiary education. With their present level of education,

Nigerian Journal of Rural Sociology Vol. 15, No. 2, March 2015
82
they will be able to adopt better innovation techniques (Amao et al, 2007) such as solar energy for providing electricity. Majority (62.4%) were Christians, 36.0% were Muslims while 1.6% were traditional worshippers. Rural households were not only involved in farming, but they also diversified into other income-generating activities like trading and artisans in order to meet their needs. This is shown in the result of analysis as only 35.2% of the respondents were farmers, 36% were traders, 15.2% were artisans (bricklayers, hairdressers, fashion designers), 4% were civil servants, 2.4% were clergy. Majority (58.2%) of the respondents had between 1-5 persons per household. About 36.9% had household size of 6-10 while 4.9% had household of 11-15 persons. Average household size in the study area was 5.5 and it implies that more respondents had household size of 5 and 6 persons. Furthermore, result of analysis shows that 66.7% of the respondents earned less than N 20,000 per month, 18.4% earned between N 21,000- N 40,000. The mean income was N 25,935.90. This implies that the income generated by the rural households on a monthly basis is quite low and this might impair their ability to afford solar energy as an alternative source of household electrical energy. Their low income also contributes to their unfavourable perception towards solar as they consider it as being expensive and unaffordable.
Table 1: Distribution of respondents according to their socio-economic characteristics (n=125) Variables Frequency % Mean
Score Age (years) 41.2 ≤ 30 39 31.2
31-40 31 24.8
41-50 26 20.8
51-60 14 11.2
61-70 9 7.2
71-80 6 4.8
Sex Male 86 68.8 Female 39 31.2 Marital status Single Married
26 95
20.8 76.0
Divorced 1 0.8 Widowed 3 2.4 Education No formal education
26 20.5
Primary 32 25.6 Secondary 43 33.3 Tertiary 26 20.5 Religion
Christian Islam Traditional
78 45 2
62.4 36.0 1.6
Variables Frequency % Mean Score
Occupation Farming 44 35.2 Trading 45 36.0 Artisan 19 15.2 Driving 5 4.0 Civil servant 5 4.0 Okada riding 4 3.2 Clergy 3 2.5 Household size 5.5 1-5 71 58.2 6-10 45 36.9 11-15 6 4.9 Monthly
income(N) 25,935.90
<20,000 86 68.8 21,000-40,000 23 18.4 41,000-60,000 12 9.6 61,000-80,000 4 3.2 Source: Field Survey, 2015
Electricity characteristics of households
Majority (67.2%) of the households in the study area were connected to the national electricity grid (PHCN) while 32.8% were not connected. Majority (73.8%) had electricity between 1-4 hours in a day and 26.2% between 5-8 hours in a day. In terms of the frequency in days per week, majority (71.4%) had electricity for 1-3 days in a week while only 7.1% had electricity every day of the week. The mean electricity frequency in hours per day and days per week was 3.9 hours and 3.3 days which implies that the households have electricity for an average of 4 hours in 3 days. The infrequent electricity supply from the national electricity grid suggests a more reliable source of electricity. This finding is in line with the Community Research and Development Centre (CREDC), (2009) which reported that majority of the people having access to electricity often suffer from frequent power outages which last for several hours. The infrequent electricity supply from the national electricity grid suggests a more reliable source of electricity. It was also revealed that majority (77.6%) of the households used generators with 68.2% using generators with a capacity of 0.75KVA and 70.4% used it for 1-4 hours daily. They spent about N4,952.26 on monthly fuelling and maintenance of their generators. The cost fuelling in the rural area is relatively high because the households get petrol at an exorbitant price of #200 per litre from black
market, not directly from petrol station. The implication of this finding is that a huge sum of the respondents’ income is spent on generators which are not environmentally friendly in terms of pollution and its contribution to green-house gases (Carbon monoxide).
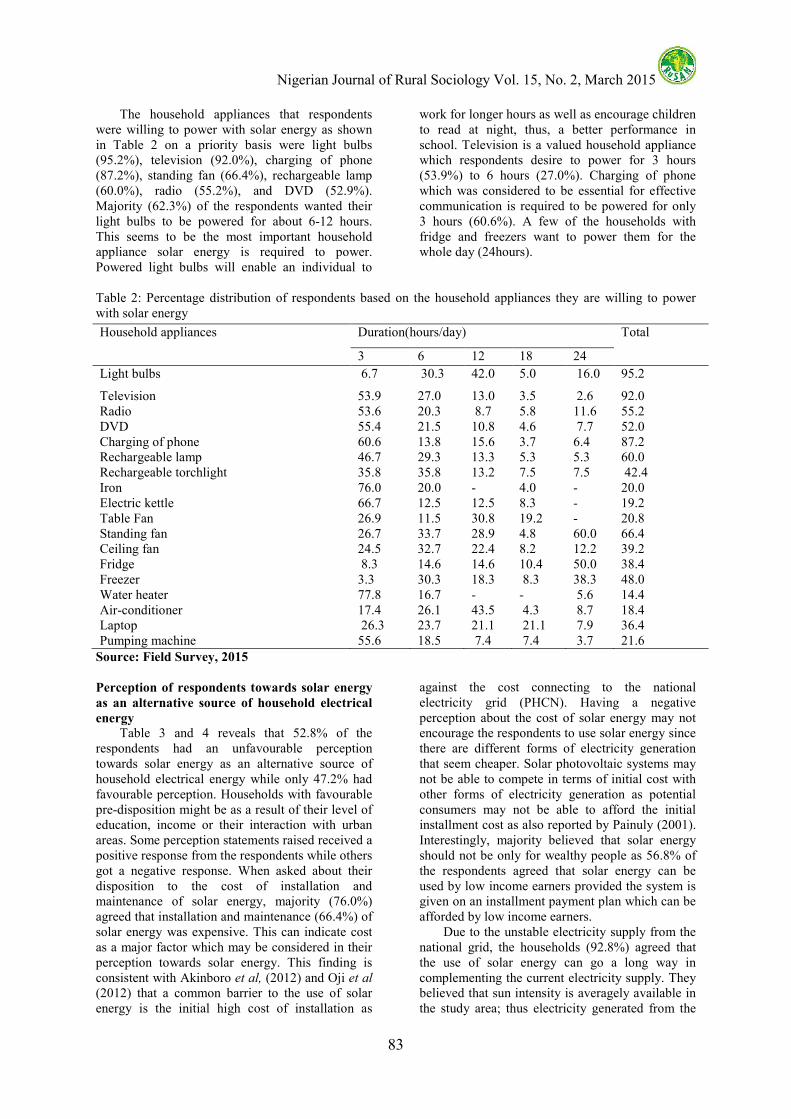
Nigerian Journal of Rural Sociology Vol. 15, No. 2, March 2015
83
The household appliances that respondents were willing to power with solar energy as shown in Table 2 on a priority basis were light bulbs (95.2%), television (92.0%), charging of phone (87.2%), standing fan (66.4%), rechargeable lamp (60.0%), radio (55.2%), and DVD (52.9%). Majority (62.3%) of the respondents wanted their light bulbs to be powered for about 6-12 hours. This seems to be the most important household appliance solar energy is required to power. Powered light bulbs will enable an individual to
work for longer hours as well as encourage children to read at night, thus, a better performance in school. Television is a valued household appliance which respondents desire to power for 3 hours (53.9%) to 6 hours (27.0%). Charging of phone which was considered to be essential for effective communication is required to be powered for only 3 hours (60.6%). A few of the households with fridge and freezers want to power them for the whole day (24hours).
Table 2: Percentage distribution of respondents based on the household appliances they are willing to power with solar energy
Source: Field Survey, 2015
Perception of respondents towards solar energy
as an alternative source of household electrical
energy
Table 3 and 4 reveals that 52.8% of the respondents had an unfavourable perception towards solar energy as an alternative source of household electrical energy while only 47.2% had favourable perception. Households with favourable pre-disposition might be as a result of their level of education, income or their interaction with urban areas. Some perception statements raised received a positive response from the respondents while others got a negative response. When asked about their disposition to the cost of installation and maintenance of solar energy, majority (76.0%) agreed that installation and maintenance (66.4%) of solar energy was expensive. This can indicate cost as a major factor which may be considered in their perception towards solar energy. This finding is consistent with Akinboro et al, (2012) and Oji et al (2012) that a common barrier to the use of solar energy is the initial high cost of installation as
against the cost connecting to the national electricity grid (PHCN). Having a negative perception about the cost of solar energy may not encourage the respondents to use solar energy since there are different forms of electricity generation that seem cheaper. Solar photovoltaic systems may not be able to compete in terms of initial cost with other forms of electricity generation as potential consumers may not be able to afford the initial installment cost as also reported by Painuly (2001). Interestingly, majority believed that solar energy should not be only for wealthy people as 56.8% of the respondents agreed that solar energy can be used by low income earners provided the system is given on an installment payment plan which can be afforded by low income earners. Due to the unstable electricity supply from the national grid, the households (92.8%) agreed that the use of solar energy can go a long way in complementing the current electricity supply. They believed that sun intensity is averagely available in the study area; thus electricity generated from the
Household appliances Duration(hours/day) Total
3 6 12 18 24 Light bulbs 6.7 30.3 42.0 5.0 16.0 95.2
Television 53.9 27.0 13.0 3.5 2.6 92.0 Radio 53.6 20.3 8.7 5.8 11.6 55.2 DVD 55.4 21.5 10.8 4.6 7.7 52.0 Charging of phone 60.6 13.8 15.6 3.7 6.4 87.2 Rechargeable lamp 46.7 29.3 13.3 5.3 5.3 60.0 Rechargeable torchlight 35.8 35.8 13.2 7.5 7.5 42.4 Iron 76.0 20.0 - 4.0 - 20.0 Electric kettle 66.7 12.5 12.5 8.3 - 19.2 Table Fan 26.9 11.5 30.8 19.2 - 20.8 Standing fan 26.7 33.7 28.9 4.8 60.0 66.4 Ceiling fan 24.5 32.7 22.4 8.2 12.2 39.2 Fridge 8.3 14.6 14.6 10.4 50.0 38.4 Freezer 3.3 30.3 18.3 8.3 38.3 48.0 Water heater 77.8 16.7 - - 5.6 14.4 Air-conditioner 17.4 26.1 43.5 4.3 8.7 18.4 Laptop 26.3 23.7 21.1 21.1 7.9 36.4 Pumping machine 55.6 18.5 7.4 7.4 3.7 21.6

Nigerian Journal of Rural Sociology Vol. 15, No. 2, March 2015
84
sun should be more reliable than electricity from the national grid. This was corroborated by Akinwale et al (2014) that majority perceived Solar PV can be used to solve electricity problems in their community. However, 41.6% still believed that at the long run, the national electricity grid is actually better than solar energy due its unlimited capacity when compared with power from solar energy which is dependent on the vagaries of weather (sun intensity). Majority (64.0%) of the respondents disagreed that solar energy can only power a few bulbs. They believe that solar energy
can also power other household appliances. This is contrary to what is reported by Akinboro et al (2012) that a lot of individuals think solar can only power a few watts of lightning and not other household appliances. This can be attributed to an increased awareness about solar energy. It is often believed that rural dwellers are uneducated, however, the respondents believe that uneducated people can use solar energy on the premise that they are taught the basics of how it operates.
Table 3: Percentage distribution of respondents based on their perception towards solar energy as a source of household electrical energy (n=125) Statements SA A UD D SD Mean (%) (%) (%) (%) (%) Installation of solar energy is expensive 49.6 26.4 8.0 8.8 7.2 2.0 Maintenance of solar energy is too expensive 44.8 21.6 8.8 14.4 10.4 2.2 Solar energy is meant for wealthy people 16.8 13.6 4.8 29.6 35.2 3.5 Solar energy will be more useful for household lighting 20.8 68.8 3.2 6.4 0.8 4.0 Use of solar energy can go a long way in complementing the current electricity source
32.0 60.8 4.8 0.8 1.6 4.2
Energy from the sun can also be used for water pumps 36.0 50.4 4.8 6.4 2.4 4.1 Recharge of phone batteries is not possible by the use of solar energy
4.0 12.8 4.8 46.4 32.0 3.9
Uneducated people cannot use solar energy 5.6 4.0 4.8 25.6 60.0 4.3 Solar energy can be used by low income earners 16.8 40.0 8.8 20.8 13.6 3.3 The durability of solar energy is questionable 12.8 22.4 24.8 28.8 11.2 3.0 It is not possible to use solar energy at home 4.0 3.2 5.6 60.0 27.2 4.0 Solar energy gives low power 6.4 20.0 16.0 29.6 28.0 3.5 The use of solar energy is not realistic 4.0 12.0 15.2 53.6 15.2 3.6 Solar energy is better used at the community level 5.6 24.8 19.2 34.4 16.0 2.7 Solar energy can only power a few light bulbs; not other household appliances
12.8 15.2 8.0 26.4 37.6 3.6
The National grid electricity is better than Solar energy 41.6 12.0 19.2 11.2 16.0 2.5 SA= Strongly Agree, A= Agree, UD= Undecided, D= Disagree, SD= Strongly Disagree Source: Field
Survey, 2015
Table 4: Distribution of respondents based on their level of perception Level of perception Freq % Favourable (≥54.6) 59 47.2 Unfavourable (<54.6) 66 52.8
Hypothesis testing
Relationship between selected socio-economic
characteristics and perception towards solar
energy as an alternative source of household
electrical energy
The result of analysis shows that there were no significant relationships between respondents’ sex (�� = 0.083, ! = 0.352), marital status (�� =0.104, p= 0.714) and their perception towards solar energy as an alternative source of electrical energy. However, there was a significant relationship between education and perception of solar energy as an alternative source of electrical energy (��= 0.238, p= 0.050). This implies that as the level of education increases, rural households’
perception towards solar energy as an alternative source of household electrical energy also increases in the study area.
Table 5: Chi-square analysis showing the association between selected personal characteristics and perception towards solar energy as an alternative source of household electrical energy Variable Chi-
square Df P Decision
Sex 0.083 1 0.352 Not significant Marital status 0.104 3 0.714 Not significant Education 0.238 3 0.050 Significant Religion 0.244 2 0.161 Not Significant
Correlation test as presented in Table 6 reveals that there were no significant relationships between respondents’ age (r=0.059, p=0.514), household size (r= -0.141, p=0.122) and perception towards solar energy as an alternative source of household

Nigerian Journal of Rural Sociology Vol. 15, No. 2, March 2015
85
electrical energy. However, a significant relationship existed between the household’s monthly income and perception towards solar energy as an alternative source of household electrical energy (r=0.269, p=0.002). This implies that as monthly income increases, the households tend to have a favourable perception towards solar energy as an alternative source of household electrical energy. Households with higher income are prone to have a more favourable perception towards other alternatives than solar. Increase in purchasing power of households predisposes them to view solar energy as favourable.
Table 6: Correlation test showing the association between selected socio-economic characteristics and perception towards solar energy as an alternative source of household electrical energy Variable r-value p-value Decision Age 0.059 0.514 Not
significant Household size
-0.141 0.122 Not significant
Monthly income
0.269 0.002 Significant
CONCLUSION
From the findings of this study, it can be concluded that rural households in the study area have an unfavourable perception towards solar energy as an alternative source of household electrical energy. The high cost of installation and maintenance of solar energy is a critical factor that instigates a negative perception from the households as they are low-income earners. Perception increases with increase in monthly income, thus, households with higher income have a more favourable perception towards solar energy as an alternative source of household electrical energy. In the same line, higher level of education pre-disposes the households to a favourable perception towards solar energy. The basic electricity need is for lighting of the house and environment, powering of television, radio and charging of phones, which they require to be powered for 3-6 hours. Erratic supply of electricity from the national grid shifts the rural households focus to solar energy as being able to complement the national electricity grid.
RECOMMENDATION
There should be public enlightenment about solar energy for household electrical energy especially the components of solar system, capabilities, its mode of operation and the cost of setting up household solar PV system. This can be achieved through the media: television, radio and newspapers. Proper education and enlightenment will encourage households to opt for solar energy.
As cost of solar energy creates an unfavourable perception from the rural households, solar system should be provided at a subsidized rate or on an installmental payment plan. It was also recommended that rural households’ electricity needs be incorporated into designing solar projects in Nigeria
REFERENCES
Adejumobi, I. A., Adebisi, O. I. and Oyejide, S. A. (2013). Developing small hydropower potentials for rural electrification. International Journal Recent Research
Applied Studies, 17(1) pp 105-110. Akinboro, F. G., Adejumobi, L. A. and Makinde,
V. (2012). Solar energy installation in Nigeria: Observations, prospect, problems and solutions. Transnational
Journal of Science and Technology May Edition vol.2, No 4, pp 73-84.
Akinwale, Y. O., Ogundari, I. O, Ilevbare, O. E. and Adepoju, A. O. (2014). A descriptive analysis of public understanding and attitudes of renewable energy resources towards energy access and development in Nigeria. International
Journal of Energy Economics and Policy
Vol. 4, No. 4, 2014, pp.636-646 Amao, J.O., Adesiyan, O.I, Salako., B.A.( 2007).
Economic analysis of cassava processing into garri in Ogo oluwa local government area of Oyo State Nigeria. Pakistan
Journal of Social Sciences, 4(2): 266-270. Bazmi, A. A. and Zahedi, G. (2011). Sustainable
energy systems: Role of optimization modeling techniques in power generation and supply—A review. Renew Sustain
Energy Rev Vol 15, No3, pp. 480–500. Chen, K.Y. (2009). Enhancing solar cell
efficiencies through 1-D nanostructures. Nanoscale Research Letter, 4, pp 1-10.
Eronini, N. (2014). The adoption of solar photovoltaic systems among industries and residential houses in Southern Nigeria. Thesis written in fulfillment of the requirement for a Master’s degree in Environmental Sciences.
FAO and UNDP, (2002). Key gender findings: Second Viet Nam living standards survey, 1997 1998. Gender differences in the transitional economy of Viet Nam.
International Energy Access (IEA), 2014. About energy access. Available on http://www.iea.org/topics/energypoverty/. Accessed on April 18, 2015.
Oji, J. O., Idusuyi, N., Aliu, T. O., Petinrin, M. O., Odejobi, O. A. and Adetunji, A. R. (2012). Utilisation of solar energy for power generation in Nigeria. International

Nigerian Journal of Rural Sociology Vol. 15, No. 2, March 2015
86
Journal of Energy Engineering, vol. 2 no. 2, pp 54-59. DOI: 10.5923/j.ijee.20120202.07
Okafor, E. C. N. and Joel-Uzuegbu, C. K. A. (2010). Challenges to development of renewable energy for electric power sector in Nigeria. International
Journal of Academic Research. Vol. 2(2): pp 211-216.
Omorogbe, Y. (2014). Policy law and the actualization of the right of access to energy Services. Kim Talus (Ed,) International Energy Law Handbook, Chapter 14. Edward Elgar Press.
Oyedepo, S. O. (2014). Towards achieving energy for sustainable development in Nigeria. Renewable and Sustainable Energy
Reviews Vol 34, pp 255–272.
Painuly, J. P. (2001). Barriers to renewable energy penetration: A framework for analysis. Renewable Energy, vol 24, pp 73-89.
Uyigue E. (Ed.), Agho M. (Ed.) and Edevbaro, A. (Ed.): Promoting renewable energy and energy efficiency in Nigeria: The Report of a one-day Conference which held at the University of Calabar Hotel and Conference Centre 21st November 2007.
World Bank (2012). Sustainable Energy for All (SE4ALL) database from World Bank, Global Electrification database.
World Energy Outlook, (2014). Modern energy for all. Available on http://www.worldenergyoutlook.org/resources/energydevelopment/. Accessed on April 16, 2015.

Nigerian Journal of Rural Sociology Vol. 15, No. 2, March 2015
87
SOCIAL FACTORS AFFECTING LIVELIHOOD STRATEGIES OF RURAL HOUSEHOLDS IN
SOUTH-EAST NIGERIA: IMPLICATION FOR RURAL DEVELOPMENT 1Nwaogwugwu, O. N., 2Matthews-Njoku, E. C.
1Department of Agricultural Economics and Extension, Faculty of Agriculture, University of Port Harcourt, Nigeria
2Department of Agricultural Extension, School of Agriculture and Agricultural Technology, Federal University of Technology, Owerri, Imo State, Nigeria
Email: [email protected], ABSTRACT
Negative social values have hampered the various rural development efforts for sustainable livelihoods in rural
Nigeria over the years. This study analyzed the social factors affecting livelihood strategies of rural households
in Southeast Nigeria. The specific objectives of the study were to identify the predominant livelihood strategies
of rural households and analyses the social factors affecting livelihood strategies of rural households in the
study area. With the aid of a structured and validated interview schedule, data were collected from a sample
size of 180 household-heads selected from a population of 754,702 households in the study area using a multi-
stage sampling procedure. The statistical tools used in data analysis included mean, frequency, percentage and
factor analysis. The result indicated that the predominant agricultural livelihood strategies found among rural
households in southeast Nigeria include crop farming (mean = 3.47), livestock farming (mean = 3.13) while the
predominant non-agricultural livelihood strategies includes petty trading (mean =3.13) and remittances from
relatives (mean = 2.70). The social factors affecting livelihood strategies of farm-families in the study area
include lack of trust and dependability among members of the community (mean = 3.02), misappropriation of
resources by corrupt political appointees at both state and local levels (mean = 3.27. Factor analysis result
showed 2 major social factor loadings affecting livelihood strategies of households in the study area as corrupt
social order and insecurity. It is concluded that social factors affected the livelihood strategies of households in
Southeast Nigeria. It is therefore recommended that sustainable programmes on social reformation,
transformation and re-orientation of national values should be designed and mounted by government at all
tiers, groups and organisations.
Keywords: Social factors, livelihood strategies, rural households, Southeast Nigeria.
INTRODUCTION
Recent population figures indicate that about two-third of Nigerian population live in rural areas. The means by which this vast population earns their living, which constitute their livelihood strategies, is drawing a wide range of concern and speculation among development experts and scholars. Loubser (1995) construed livelihood strategy as the totality of means by which people secure a living, have or acquire in one way or another, the requirement for survival and the satisfaction of needs as defined by the people themselves in all aspects of their lives. Livelihood pattern in rural households cuts across agricultural and non-agricultural activities. It has been established that majority of households especially in developing countries live in rural areas and rely on agriculture for their livelihood (FAO, 2000; Akinlo, 2001; World Bank, 2006). According to Alimi, et al (2001) about two-third of rural households earn their livelihood from subsistence agriculture, either as small-scale farmers or as low-paid farm workers while the remaining one-third engage in petty services. Understandably, agriculture for now and in the near future will remain the bedrock of the rural household economies because of their access to land (a major input in agricultural enterprises) through various forms of traditional land holdings;
the potential of agriculture to readily meet their basic needs for food and to some extent cash. It is obvious that agriculture provides increased on-farm and off-farm employment opportunities capable of raising incomes of the rural households and their purchasing power. In this vein, World Bank (2006) noted that increased growth of the agriculture sector offers direct benefits to rural households such as income and food, contributes to broader food security objectives and helps to establish forward linkages with high value-added industries as well as linkages between rural and urban centres. Furthermore, agricultural activities which embrace crop and livestock farming have strong linkages with non-agricultural livelihood activities which are common among rural households. Non-agricultural activities which include hire-labour, fabrication of tools, repair services, handicrafts, tailoring, trading, masonry, carpentry, welding, blacksmithing and arts apart from serving as stop-gaps, have helped to service rural agricultural enterprises while providing the needed income to meet household needs simultaneously. The capacity to diversify or combine the above livelihood strategies varies markedly among individual members of a particular household and across households in a given community. However, the benefits derivable from combining agricultural and non-agricultural livelihood strategies by a
Nigerian Journal of Rural Sociology Vol. 15, No. 2, March 2015
88
household cannot be over-emphasized. Working in different livelihoods has helped to spread risks and manage uncertainty especially when such activities engaged in do not rely on the same resources. To many other households, diverse livelihood strategies serve as a measure to cope with insufficiency arising from shortfalls and failures in a major livelihood means. Sometimes and often, when a favoured activity require working capital but the individual and household have no access to ready credit, they may likely undertake other livelihoods to generate income to support a preferred livelihood. To maximize the above benefits, successive governments in Nigeria in the last three decades have vigorously pursued different programmes on rural and agricultural development, which development experts consider as a precursor to sustainable rural livelihoods. Despite the efforts, some studies including that of the World Bank (2006) still suggest that people living in rural Nigerian communities are faced with high levels of resource limitation, material uncertainty and survival risk. Consequently, the country has continued to experience a vicious migration pattern of its nationals unprecedented in modern nation states, brain drain, kidnap/hostage taking, child labour, crises and other social problems. This is an indication that there are underlying forces against livelihood pursuits in rural areas that demand critical analysis. Some studies have identified economic, cultural, personal factors as affecting decision for a certain livelihood and/or a combination of livelihood strategies among rural dwellers (Olusi, 2001; Nwaogwugwu, 2014). Apart from the aforementioned factors, it is obvious that the social dimensions have not been given attention considering the fact that livelihood decisions in any society are essentially governed by certain social values. Social factor refers to a set of beliefs, moral values, tendencies that control interpersonal relationships between individuals, groups, institutions and agencies in society. Issues associated with social relations are deeply ingrained in the social behaviours of the people which govern decisions and guide their livelihood pursuits. Over the years in most parts of the Nigerian nation, negative social values have hampered the various rural development efforts for sustainable livelihoods. This becomes more critical in view of the nations long term efforts in fighting social vices to pave way for meaningful rural development. Against this background, the study identified the livelihood strategies of rural households and analyzed the social factors affecting livelihood strategies of rural households in southeast Nigeria, highlighting its implication for agricultural transformation agenda. METHODOLOGY
The study was carried out in southeast Nigeria, situated east of River Niger. The population of the study comprised of 754,702 rural household heads generated with the help of key informants in the study area. The sample size of 180 respondents was selected from the population using a 5-stage random sampling procedure. The stages involved the random selection of 3 States out of the 5 States in southeast Nigeria; 3 zones; 6 local government areas; 18 communities and 10 household heads from each of the selected communities. Data were collected with the aid of an interview schedule which was structured and validated by the researchers. The responses were measured on a 4-point Likert-type summated rating scale of agreement (strongly agree, agree, disagree and strongly disagree). The values of the scale (4, 3, 2 and1) were summed up to obtain 10. The mean value of the sum gave 2.50, which served as the cut-off mean. This became the benchmark for accepting any item as livelihood strategy and social factors affecting household livelihood strategies in the study area. Data analysis was carried out using descriptive statistical tools namely: frequency, mean and varimax rotated factor analysis. The extracted variables with co-efficient of 0.50 and above were used to rename the major factors according to Nwaogwugwu (2013).
RESULTS AND DISCUSSION
Agricultural livelihood strategies among rural
households
Agricultural livelihood strategies among rural households in the study area are presented on Table 1. The result revealed crop farming (mean = 3.47) as an agricultural livelihood strategies. This result agrees with previous findings, which identified crop farming as the most important livelihood strategy among rural households (Amao et al, 2003; Sinkaiye et al, 2008). It is further held in evidence in view of small-scale backyard and outskirt farms in various rural communities in the study area with a combination of roots and tuber crops, fruit and vegetable crops, grain and cereal crops, tree and plantation crops. Rural households may have adopted crop faming as a livelihood strategy because the crops serve as common staples, propagules are easily sourced locally, cultural and agronomic practices have been developed and mastered over the years and the crops concerned appear to have adapted to local soil and environmental conditions. Above all, these crops are grown under various farming systems in practice in the study area such as mixed cropping, mono-cropping, inter-cropping, inter-planting and crop-rotations. This is in line with the view of Ikwelle et al (2003) that food crops in Nigeria are variously grown by resource–poor farmers who inter-crop cocoyam with yam, maize, plantain, banana, vegetables and rice: The result also showed
Nigerian Journal of Rural Sociology Vol. 15, No. 2, March 2015
89
that households rear small livestock (mean = 3.13),which agrees with Agumagu et al (2006). The animals are adapted to the farming systems and husbandry practices in the area. Furthermore, the result revealed hired farm labour (mean = 2.84) as a livelihood strategy among rural households. This finding is consistent with report that indicated casual labour in the farms as livelihood strategy of the poorest household group in rural communities (Ashley et al, 2005). It serves as safety nets and easiest source of income to meet immediate survival needs of households. The result also indicated that farm product processing (mean = 2.81) is a livelihood strategy among rural households in the study area. This finding is in accordance with Olaleye (2003). The finding becomes remarkable since processing of agricultural produce adds value to the products, attracts better market, prevent spoilage and wastage, especially at the peak of harvests. Cassava processing, palm fruit processing, etc with wide range of marketable products, are becoming lucrative livelihood base among many rural households in the study area. According to the result, marketing of agricultural products (mean = 2.81) is an agricultural livelihood strategy among rural households covered in the study. The abundance of fruit and vegetable tree species as well as increased processing of agricultural products has helped to flourish this means of livelihood especially among women in rural communities covered in the study. Table 1: Agricultural Livelihood Strategies adopted by Rural Households in Southeast Nigeria Variables Mean Remark Crop farming 3.47 Accept Rearing of small live stocks 3.13 Accept Hired farm labour 2.84 Accept Fish farming 1.75 Reject Bee keeping 1.42 Reject Hunting of wild animals 2.27 Reject Gathering and selling of forest products (fuel wood, mushrooms, etc
2.32 Reject
Farm product processing 2.82 Accept Marketing of agricultural products
2.81 Accept
Palm-wine tapping and palm-fruit harvesting.
2.31 Reject
Note: Any mean score <2.50 imply disagreement with any of the items; any mean score > 2.50 imply agreement with any of the items. Non-agricultural Livelihood Strategies adopted
by Rural Households
Results presented on Table 2 indicated non-agricultural livelihood strategies in the study area. The result showed civil service (mean = 2.58) as a
non-agricultural livelihood strategy among rural household. Previous study by Agumagu et al (2006) agrees with this finding. Employment opportunities created in various local government areas, rural cottage industries and other service centres in the study areas may have enhanced civil service employments. Besides, a good number of government and non-governmental agencies have in recent years targeted rural households in their skill acquisition and training programmes for capacity building of many rural beneficiaries. Furthermore, petty trading (mean = 3.13) is shown in the result as a non-agricultural livelihood strategy in the study area. Previous studies with similar findings corroborate this present result (Ellis, 2000; Olawoye, 2000; Matthews- Njoku and Adesope, 2007). Petty and small-scale articles of trade ranging from candies and beverages to other food items as well as non-consumables in the study area are common sights among rural households. While these items of trade are easily available to meet the household needs, sales from such items also provide ready income to meet other household requirements, Petty trading appear lucrative because of small initial investible capital required for a start, which households could afford through their menial savings. Also tailoring and weaving (mean = 2.53) served as a livelihood strategy in the study area. This is one of the age-long livelihood bases that have persisted in rural economies despite transformations in modern times. Tailoring and weaving seem to sustain the interest of men and women and makes minimal and affordable demand in the course of its skill training. Above all, the service it renders in rural areas has made it an indispensable livelihood base. Furthermore, remittances from relatives (mean = 2.70) was shown as a livelihood strategy in the study area. Previous survey by Bryceson (2000) supports this present finding. This further underscores the bond of relationship in the extended family in Nigeria. Many rural household members are sustained through incomes remitted to them from migrated and non-resident relations. Table 2: Non-agricultural Livelihood Strategies adopted by Rural Households Variables Mean Remark Civil service 2.58 Accept Salon operators 2.48 Reject Carpentry and furniture making
2.06 Reject
Building/ masonry 2.24 Reject Petty trading 3.13 Accept Tailoring and weaving 2.53 Accept Transport services 2.33 Reject Food vending 2.26 Reject Music/ entertainment 2.07 Reject Remittances from relatives 2.70 Accept

Nigerian Journal of Rural Sociology Vol. 15, No. 2, March 2015
90
Note: Any mean score <2.50 imply disagreement with any of the items; any mean score > 2.50 imply agreement with any of the items. Social factors affecting livelihood strategies of
rural households
Results on Table 3 showed the social factors affecting livelihood strategies of rural households in the study area. The result also showed that misappropriation of resources by corrupt political appointees at both state and local levels (mean = 3.27) is a social factor affecting the livelihood strategies of rural households. This result finds evidence in the Nigerian society where politics is seen as an access to public treasury. Public funds for programmes designed to aid rural people and provide welfare services in rural communities are misappropriated and sometimes diverted to personal use. In line with this finding, Aluko (2001) identified the culture of corruption in Nigeria as a social factor affecting the livelihoods of Nigerians. It was also revealed that shortage and high cost of hiring labour stalls economic activities (mean = 3.27). It results from exploitative tendency by those who provide labour and non-standardized cost of labour in rural communities. Households who can hardly generate enough resources to foot high labour bills resort to supplying their own labour by utilising the services of all household members including children. Studies have shown that in such households women are over laboured in myriad of activities daily (Adekanye, 1993; Okeke, 1995). Furthermore, the result revealed illiteracy, unawareness and misinformation on available provisions and opportunities as social hinderances to livelihood strategies of rural resource-poor households (mean = 3.19). This situation appears acute among rural household because of low level of education. Despite the provision for Universal Basic Education; children from such households have the tendency to dropout of primary school education. Besides, rural households may not be able to take advantage of various governments programmes to improve their livelihoods due largely to lack of information. This finding is held in evidence by the view of Ashley et
al (2005) that due to illiteracy and lack of information, the resource-poor may be largely unaware of their legal rights and the programmes that have been set up to assist them. Welfare packages specifically designed for the rural people are constantly being intercepted by other segments of the Nigerian society to their detriment. The result further indicated poor attitudes of some household members towards labour matters as a social factor, which undermines the livelihood strategies of rural resource-poor households (mean = 3.18). The above result is suggestive that some individuals are risk-aversive, and sometimes lazy. However, to irk out a living in whatever livelihood,
demands sacrifice and courage to succeed, a price many people are unable to pay. Furthermore, the result showed that migration of rural labour is among the social factors affecting livelihood strategies of rural households (mean = 3.14). The migration of able-bodied young men and women over the last three decades has posed serious concerns for labour supplies in rural communities. In some households, where for instance, the husbands migrated leaving their wives as household heads, a twist in livelihood patterns may result. For instance, some livelihood activities for which labour is dominantly supplied by the male may be abandoned. Also, occasional communal crises, conflicts and strife among household members over land and other matters was revealed as a social factor affecting livelihood strategies of rural households (mean = 3.09). In most rural communities in the study area, all forms of conflict, clashes and crises have been experienced over the years rendering many homeless and disrupting their livelihoods. These may include land matters, deteriorated inter community relationship sometimes leading to wars and at the household level resulting in relocations. This finding is consistent with the view of Ekong (2003) that wars dislocate people making them refugees and prevent them from making a living, produces orphans, widows and physically challenged who form the bulk of the resource-poor. Lack of vocational and occupational skills and endowments among household members was found to be among the social factors affecting livelihood strategies of rural households (mean = 3.06). This could be attributed to low level of education associated with rural households in Nigeria. Education enhances human capital, work skills and livelihood earning potentials. In line with this finding World Bank (1996) noted that low endowment of human capital reinforces the resource-poor systems in Nigeria. It was revealed that lack of trust and dependability among members of the community (mean = 3.02) is a social factor affecting rural household livelihood strategies. This finding anchors on the uncertainties and dubious feelings in rural areas. The demand for commitment and honesty in interpersonal relationships and labour matters has serious implication on livelihood activities in rural areas. Result also showed the segregation and marginalization of women and youths over access to productive resources in the community as a social factor against livelihood strategies households (mean = 3.00). These practices have been going on in rural communities. Segregation and inequalities of women and youths embrace productive resources such as land, social amenities and social networks. This finding is expressed in the view of Oladoja et al (2005) that women’s experience of marginalization are acute because of
Nigerian Journal of Rural Sociology Vol. 15, No. 2, March 2015
91
gender based forms of exclusions. This might be responsible for limited livelihood opportunities available to women and youth in various rural communities. Also, the result revealed the exclusion of women, youths and children from certain livelihood activities as another social factor affecting livelihoods in rural households (mean = 2.83). This is because certain roles may be socially ascribed to the adult male members in the rural society. Oftentimes, roles ascribed to women, youths and children, are usually supportive, unrewarded and not monetized. Yet these household members render long hours of tedious and arduous jobs using traditional tools. These socio-cultural rigidities undermine livelihood survival strategies especially in women-headed households. This finding agrees with the view of Ogwumike (2001) that discrimination; a situation where unequal opportunities are given to some people to participate in the production process on the basis of gender and age considerations has impeded livelihood activities a great deal. Table 3: Social Factors Affecting Selected Livelihood Strategies of Rural Households. Variables Mean Misappropriation of resources by corrupt political appointees at both state and local levels.
3.27
Shortage and high cost of hiring labour. 3.27
Illiteracy, unawareness and misinformation on available provisions and opportunities.
3.19
Poor attitudes of some household members towards labour matters.
3.18
Migration of rural labour. 3.14
Occasional communal crises, conflicts and strife among household members over land and other matters.
3.09
Lack of vocational and occupational skills and endowment among household members.
3.06
Lack of trust and dependability among members of the community.
3.02
Segregation and marginalization of women and youth over access to productive resources in the community.
3.00
Exclusion of women, youths and children from certain livelihood activities.
2.83
Note: Any mean score <2.50 imply disagreement with any of the items; any grand mean score > 2.50 imply agreement with any of the items. Factor Analysis Results of Social Factors
affecting Livelihood Strategies of Rural
Households.
The varimax rotated factor matrix of social factors affecting livelihood strategies of rural households is presented on Table 4. With regards to
the item loadings, factor 1 which is renamed as corrupt social order includes major loaded items such as lack of trust and dependability among members (0.797), misappropriation of resources by corrupt political appointees (0.789). illiteracy, unawareness and misinformation on available provisions and opportunities (0.753), migration of rural labour (0.730), shortage and high cost of hiring labour (0.623), lack of vocational and occupational skills and endowment among household members (0.539), segregation and marginalization of women and youths, over access to certain productive resources in the community (0.508). The culture of corruption at all levels of the Nigerian society has helped to worsen the condition of the households and stall their capacity for a meaningful livelihood. Corruption is the bane of moral rectitude, lack of fairness, equity and insincerity that characterize social networks and relations in Nigeria. Looting of public treasury and diversion of public funds negate the provision of social infrastructure and services in rural communities which would have serious consequences on the livelihood pursuits of rural dwellers. Outright misappropriation and interception of rural development projects is an ongoing practice in Nigeria while the agencies are allowed to go moribund. The above pattern of behaviour underscores the view of Nzimiro (1992) that materialism became turbulent and the moral ethos that respected honesty becomes a taboo. It might be for the above reasons that Aluko (2001) identified the institutionalization of corruption in Nigeria as a critical factor undermining livelihoods of the very poor in the society. Factor 2 on Table 4 was also renamed insecurity and embraced major loaded items as occasional communal crises, conflicts and strife among household members over land and other matters (0.745), poor attitude of some household members towards labour matters (0.638) and exclusion of women, youths and children in certain income generating activities (0.572). This item loading is likely to create a sense of apathy leading to insecurity in the community. Improved livelihoods can be achieved in a secure and peaceful environment. Insecurity of life and property characterize the existence of many households in rural communities. This include all forms of inter and intra-community strife, family disputes over property rights, which often result in serious consequences on household livelihoods and overall rural development effort.
Implications for Rural Development
• The increasing state of corruption in the society creates a state of distrust and social imbalance which is inimical to cooperative effort towards sustainable development of social capital to drive livelihood activities.
Nigerian Journal of Rural Sociology Vol. 15, No. 2, March 2015
92
• Spates of insecurity give rise to human capital flight and dislocation of livelihood pursuit in rural households.
• Adequate policies and mechanisms to discourage corruption at all levels through proper sanctions will be necessary to restore social order to drive livelihoods towards overall national development.
Table 4: Varimax rotated factor Matrix of Social Factors affecting Livelihood Strategies of Rural Households. Variables Factor1:
Corrupt social order.
Factor2: Insecurity
Lack of trust and dependability among members of your community.
0.797 0.014
Misappropriation of resources by corrupt political appointees at both state and local levels.
0.789 0.085
Illiteracy, unawareness and misinformation on available provisions and opportunities are hindrances.
0.753 0.319
Migration of rural labour.
0.730 0.179
Shortage and high cost of hiring labour stalls economic activities
0.623 0.446
Lack of vocational and occupational skills and endowment among household Members
0.539 0.406
Segregation and marginalization of women and youths over access to certain productive resources in the community.
0.508 0.405
Occasional communal crises, conflicts and strife among household members over land and other matters.
-0.074 0.745
Poor attitudes of some household members towards labour matters.
0.271 0.638
Exclusion of women, youths and children in certain income generating activities
0.493 0.572
Note: Coefficients on the Table above represent regression weights.
CONCLUSION
Based on the findings of the study, it is concluded that livelihood strategies among rural households in the study area cut across agricultural and non-agricultural activities. A network of negative social factors, which centre on corrupt social order and insecurity undermine rural household livelihood pursuits with serious implication for rural development in Nigeria.
RECOMMENDATION
Based on the findings it is recommended that sustainable programmes on social reformation, transformation and re-orientation of national values should be designed and mounted by government at all tiers, groups and organisations.
REFERENCES
Adekanye, T. (1993). “Women, Population and Environment”. Paper Presented at the
National Seminar on Population and
Environment Development and Education
in Nigeria. Lagos, 5th
–7th
May. Adesope, O. M.; Agumagu, A.C. and
Nwaogwugwu, O.N. (2007). “Factors Limiting Rural Youth Sustainable Livelihood in Imo State, Nigeria”. Madukwe, M.C. (ed.). Agricultural
Extension and the Challenges of the
Millennium Development Goals (MDGs).
Proceedings, 12th
Annual National
Conference, Agricultural Extension
Society of Nigeria, 4-7th July pp 57-61. Agumagu, A.C.; Adesope, O.M.; Nwaogwugwu,
O.N. and Oladele, O.I. (2007). “Livelihood Interests of Rural Youths in Owerri North Local Government Area of Imo State, Nigeria.” Proceedings of the
Eleventh Annual Conference of the
Agricultural Extension Society of Nigeria. 3rd-6th April, 2006.
Akinlo, A.E. (2001). “Poverty; Global Trends and Challenges”. In Afonja, S.; Adelekan, D.; Soetan, F.; Alimi, T. & Ayanwale, B. (eds.). Research and Policy Directions on
Poverty in Nigeria. Ile-Ife, Anchor Print Limited. Pp. 5-23.
Aluko, M.A.O. (2001). “Strategies for Poverty Alleviation in Nigeria”. In Afonja, S.; Adelekan, D.; Soeten, F.; Alimi, T. & Ayenwale, B. (eds.). Research and
Policy Directions on Poverty in Nigeria. Ile-Ife, Obafemi Awolowo University Press. Pp. 186-193.
Amao, J.O.; Ogunnwale, A.B. and Ayanwuyi, E. (2003). “Income Generating Activities among Rural Women in Lagelu Local Government Area of Oyo State”. Jibowo, A.A. (ed.). Food security and Rural
Development in a Deregulated Economy.
Nigerian Journal of Rural Sociology Vol. 15, No. 2, March 2015
93
Proceedings of the Thirteenth Annual
Conference of the Nigerian Rural
Sociological Association. Pp 29-37. Ashley, C.; Start, D. and Slater, R. (2005).
Understanding Livelihoods in Rural India:
Diversity, change and Exclusion. UK, Department for International Development. Pp. 2 – 13.
Bryceson, D. F (2000). Rural Africa at the Cross-
roads: Livelihood Practices and Policies.
Series 52. United Kingdom, Oversees Development Institute (ODI).
Ekong, E.E. (2003). Rural Sociology: An
Introduction and Analysis of Rural
Nigeria. Second Edition. Uyo, Dove Educational Publishers. Pp. 341–369.
Ellis, F. (2000). Rural Livelihoods and Diversity in
Developing Countries. Oxford University Press. Pp. 148-354.
Food and Agriculture Organisation (FAO). (2000). Rural Women and Food Security, Current
Situation and Perspectives. Rome, FAO Publications Pp. 173 – 187.
Ikwelle, M.C.; Ezukile, T. O. and Eke-Okoro, O.N. (2003). “Contribution of Root and Tuber Crops to the Nigerian economy’. Proceedings of the Nigerian Triennial
Symposium of the Inernational Society for
Tropical Root crops- Africa Branch
(ISTRC- AB) held at the International Institute of Tropical Agriculture, Ibadan, November 12-16, 2003. Pp. 13-18.
Loubser, J. (1995). ‘Sustainable Livelihoods: A conceptual Exploration’. Paper presented
at the workshop of Civil society,
Sustainable Livelihoods and Women in
Development 5-8 November, Kuala Lumpur, Malaysia,
Mathews-Njoku, E.C. and Adesope, O.M. (2007). “ Livelihood Diversity Strategies of Rural Women in Imo State, Nigeria”. Madukwe, M.C. (ed.). Journal of Agricultural
Extension. 10:117-123. Matthews-Njoku E.C. and Nwaogwugwu, O.N.
(2014). Cultural Factors affecting Livelihood Strategies of Rural Households in Southeast Nigeria: Implication for Agricultural Transformation Agenda. Russian Journal of Agricultural and
Socio-economic Sciences, 12(36), 18-26. Nwaogwugwu, O.N. (2013). Analysis of Factors
affecting choice of Rural Livelihood Strategies in Southeast Nigeria. Unpublished Ph.D Thesis, Department of Agricultural Extension, Federal University of Technology, Owerri.
Nzimiro, I. (1992). Dark Days in our Universities:
The issue of cultist and Secret Cults (A
Sociological Evaluation). Lagos, University Press. Pp. 5-10.
Ogwumike, F.O. (2001). “Current State of Knowledge on Poverty in Nigeria.” In Afonja, S.; Adelekan, D.; Soetan, F.; Alimi, T. and Ayanwale, B. (eds.). Research and Policy Directions on
Poverty in Nigeria. Ile-Ife, Centre for Gender and Social Policy Studies. P.p. 24 – 34.
Okeke, E.A.C. (1995). “Women Empowerment and Rural Development.” In Eboh, E.C.; Okoye, C.U. and Ayichi, D. (eds.). Rural
Development in Nigeria: Concepts,
Prospects and Prospects. Enugu, Auto Century Publishing Company. Pp. 152–163.
Oladoja, M. A., Adisa, B. O. and Adokun, O. A. (2005). “Gender Issues in Antipovert Programmes and Rural Development in Nigeria”. Proceedings of the Fourteenth
Annual Congress of the Nigerian Rural
Sociological Association. Held at Olabisi Onabanjo University, Ogun State 7–10th November.
Olaleye, R. S. (2003): “ Rural Women’s Agro- processing Activities for Household Food Security Improvement in Ondo State, Nigeria: Jibowo A.A. (eds.). Food
Security and Rural Development in a
Deregulated Economy. Proceedings of the
13th
Annual Conference of the Nigerian
Rural Sociological Association, Oyo state. Pp 24-28.
Olawoye, J. E. (2000). “Making Extension Relevant to Sustainable Livelihoods for Poverty Alleviation”. Olowo, T.A (ed.). Agricultural Extension and Poverty Alleviation in Nigeria. Proceedings of the
Sixth Annual National Conference of the
Agricultural Extension Society of Nigeria. Pp. 74-80.
Olusi, J. O. (2001). “Poverty Alleviation in the Nigerian Economy: Policy Issues and Prospects”. In Afonja, S.; Adelekan, D.; Soetan, F.; Alimi, T. and Ayanwale, B. (eds.). Research and Policy Directions on
Poverty in Nigeria. Ile – Ife, Centre for Gender and Social Policy Studies. Pp. 73 – 184.
Sinkaiye, T.A.; Nwaerema, B. and Ajayi, A.O. (2008). “Application of Livelihood Analysis among Farmers in Amah Community of Rivers State, Nigeria: Implication for Extension Agents Training”. Madukwe, M.C. (ed.). Journal
of Agricultural Extension. 11: 87-98. World Bank (1996). Nigeria; Poverty in the Midst
of Plenty: The Challenge of Growth with

Nigerian Journal of Rural Sociology Vol. 15, No. 2, March 2015
94
Inclusion. Report No. 14733 – United Nations Publications.
World Bank. (2006). Agriculture and Achieving the
Millennium Development Goals.
Washington, D.C. International Food Policy Research Institute (IFPRI). Pp.1-10.

Nigerian Journal of Rural Sociology Vol. 15, No. 2, March 2015
95
SOCIO-ECONOMIC STATUS OF HOUSEHOLDS IN UNIVERSITY OF IBADAN SOCIAL
LABORATORY IN IGBO-ORA, OYO STATE, NIGERIA
Ayinde, Y. O. and Oyesola, O. B. Department of Agricultural Extension and Rural Development, Faculty of Agriculture and
Forestry, University of Ibadan, Ibadan, Nigeria E-mail: [email protected]
ABSTRACT
This study examined the socioeconomic indicator of households in Igbo-Ora community of Oyo State. Two
hundred households were randomly selected and used for this study. A quantitative survey was conducted with
the use of interview schedule. Both descriptive and inferential statistics were used to summarize and analyze
data collected. Results of analysis revealed that 37.5% and 32.0% were between the ages of 22-32 years and 33-
43 years respectively. Majority were males (95.5%), married (92.0%), Muslims (68.0%), and secondary school
leavers (43.0%). Eighty-two percent of the respondents had household size of 1-5 persons with 92.0% females
and 84.5% of males. Most (45.0%) of respondents were artisans, who diversified into farming. Respondents
(45.0%) earn between N451,000 - N901,000 annually from their various income generating activities. About
sixty percent had low socioeconomic status. There was no significant relationship between sex (χ2=0.036,
p=0.668), marital status (χ2=2.033, p=0.566), religion (χ
2=4.325, p=0.115); and socioeconomic status of
respondents in Igbo-Ora community. However, significant relationship existed between occupation (χ2=13.383,
p=0.031), educational attainment (χ2=3.723, p=0.054); and socioeconomic status in the community. The
socioeconomic status of respondents in Igbo-Ora was low. It is recommended that they should be sensitized on
financial management and investment, given that their socioeconomic status was not commensurate with their
income.
Keywords: Socioeconomic indicator, socioeconomic status and households
INTRODUCTION
Nigerian universities were established after the similitude of land grant universities with a commitment to render service directly to communities (Martin, 2001). They therefore have to respond to community felt needs towards rural development. Universities work with communities to increase opportunities, empowerment and security to neutralize socioeconomic deprivation (Hampton and Higham, 2006). University of Ibadan has a mission of rendering community development service to their model villages which can serve as teaching and research training for agricultural students especially during their practical year exercise. Also, the institution delivered packaged services in form of cooperate social responsibility for their adopted community. In furtherance, the university based delivery system is trying to be a model or pace setter for other social organisations to follow. Toward achieving its community development service mission, the University adopted Igbo-Ora community of Oyo state among others. This opportunity for Igbo-Ora community is centered on delivering corporate social responsibilities for the purpose of achieving agricultural and rural development, since university service delivery system is circled around capacity building, social capital development and institution strengthening. This intervention is expected to enhance the socioeconomic status (SES) of the community members. Since this study is centered on the households which males were mostly the household head in every household unit. It is therefore said that they are actively involved in
taking decisions for members of households and saddled with responsibilities of improving their socioeconomic status. According to Higgs (2002), socio-economic status of household is a good predictor of many outcomes in a person’s life both from the point of view of the consumer behavior and the point of view of the social and health circumstances. Patel and Anthonio (1974) submitted that differences in socio-economic status affect the social behavior of rural people, which suggests the need to understand the social behavior, by measuring the underlying socio-economic status as a precursor to assessing the impact of an intervention that may takes place in the community in the next few years. Socio-economic status is one of the key indicators of a number of different community issues. It is most often determined by analyzing family income and physical assets. It is a combination of the economic and sociological measures of a person's work experience and of an individual's or family's economic and social position in relation to others, based on income, education, and occupation. When analyzing a family's SES, the household income earners' education and occupation are examined. Similarly, socioeconomic status is the position that an individual or family occupies with reference to the prevailing average standards of cultural possessions, effective income, material possessions and participation in the group activities of the community (Akinbile, 2007). The measures of SES are meant to provide information about a household’s behavior. It gives good insight into some aspects of the lifestyle of a household.
Nigerian Journal of Rural Sociology Vol. 15, No. 2, March 2015
96
Whereas, food consumed in Nigeria comes mostly from the rural areas. This contributes to high concentration of agricultural activities practiced in the rural areas. However, rural areas are being marginalized with respect to socio-economic facilities but despite that, rural area form the most important sector of the economy due to the fact that majority of land, labour and capital are domiciled (World Factbook, 2010). The inadequate governmental presence and non-governmental presence in the rural communities is quite discouraging, which affect the morale of farmers since most of the community members engaged in farming, having affecting their morale on their main occupation (arable crop farming) which can therefore contributes to reduction in production per hectare and could lead to food insecurity, low socio-economic status and low wellbeing of the farmers. A nexus of these outputs are thus required to provide a baseline for any intervention that may likely come to the community in order to enhance the sustainability of such programme. Therefore, this study aimed at providing answers to the following research questions: i. What is the socioeconomic status of
households in the study area? ii. What are the personal characteristics of
households in the study area? iii. What is the relationship between selected
personal characteristics and socioeconomic status of households in the study area?
METHODOLOGY
The study was carried out at Igbo-Ora in Ibarapa LGA of Oyo-State. Igbo- Ora community has five quarters; Ibeerekodo, Sagahun, Paako, Igbole and Idofin. Their main occupation is arable crop farming due to plain topography nature of the terrain and this allows easy agricultural production operations. They also engaged in other income generating activities such as charcoal production, commercial motorcycling, trading and road transporting. Youths who form a larger proportion of the community’s population across the five quarters were reported to have abandoned agriculture due to the high level of uncertainty, heightened by climate change and intimidation by the pastoralists. Farming is usually practiced with the aid of crude implements such as hoes and cutlasses. Nowadays, there have been some changes in the system through the utilisation of tractors and fertilisers. Majority of people in these quarters have different ethnic background since they migrated from different place to settle in Igbo-Ora. (Department of Agricultural Extension and Rural Development, 2013. Interim College of Medicine-Igboora Needs Assessment. Interim Report of the needs analysis.pp3-4) The target population of this study was all household-heads that are members of registered
professional association/groups within Igbo-Ora community of Oyo-State. Systematic random sampling technique was used to sample 200 respondents from Ibeerekodo, Sagahun, Paako, Igbole and Idofin quarters within Igbo-Ora. This was done by sampling every 10th house from a starting point of 1-10 used to draw inference for the study. This was further achieved by selecting 40 respondents in each quarter which was sampled using every first random number of 10 houses and subsequently for the rest in selecting the total respondents in the study area to avoid biasness to a minimal level. Both qualitative (FGDs) and quantitative (Interview schedule) was used in collecting the data for this study. Also, the variables were measured as follows: Personal characteristics was measured by asking the respondents to indicate their actual age in years (interval scale); Sex (Nominal scale- Male-1, Female-2); Marital status (Nominal scale- Single-1, Married-2, Divorced-3, Widowed-4); Religion (Nominal scale- Christianity-1, Islam-2, Traditional-3); Educational attainment (Ordinal scale- No formal-1, Primary-2, Secondary-3, Tertiary-4); Household size (Interval scale); Occupation and their actual income (Interval scale). Also, socioeconomic status was measured by asking respondents to indicate the number of items they possess from the list of items provided (Quantity-Interval scale) with an assigned score of 5,4,3,2 and 1. The number of item possessed will be further used to multiply the score of each item provided to give the total score of individual item for each of the respondent (Interval scale). This is therefore calculated to indicate the minimum, maximum and mean scores. The mean score was used to categorize respondents into high and low socioeconomic status. Respondents with mean score and above were categorized as having high socioeconomic status while, those with scores below the mean were categorized as having low socioeconomic status. Descriptive statistical tools such as frequency counts, percentages and means were used to describe the data collected, while inferential statistical tools were used to test hypotheses, using Chi-square, Pearson and Product Moment Correlation (PPMC). Also, socioeconomic indicators were identified using a regression analysis.
RESULTS AND DISCUSSION
Analysis from Table 1 shows that 37.5% and 32.2% of the respondents were between ages 22 – 32years and 33- 43 years respectively. This indicates that most of the respondents are in their productive age and may actively contribute to the state of their socioeconomic status since Oludipe (2009) reported that majority of the work force are between the ages of 20 and 40 years. The result implies that most of the respondents were still very
Nigerian Journal of Rural Sociology Vol. 15, No. 2, March 2015
97
young and can be productive in performing multiple activities in sourcing for more income whereby pursuing the socioeconomic items that are more relative in measuring their SES. Table 1 also shows that majority of the respondents were males (95.5%). This implies that males are key stakeholders when bringing a sustainable developmental programme to the community as they head most of the households thus playing a crucial role within their household where they mostly determine their physical assets as an item of socioeconomic indicators of an individual. Furthermore, 7.0% of the respondents were single, 92.0% were married, 0.5% were divorced and 0.5% were widowed in terms of their marital status distribution. Majority being married shows the importance of marriage institution in Igbo-Ora community. Result of analysis corroborates Akinola (2007), Ebitigha (2008) and Oludipe (2009) that states the majority of rural work forces are married. Marriage can both increase the status of both men and women as this contributes to how they are treated in the society. Table 1 also reveals that 30.0%, 68.0% and 2.0% of respondents were Christians, Muslims, and traditional worshippers respectively. Religion is closely related to culture, so all development programmes and policies should be within Igbo-ora’s religious context since majority were Muslims and cultural context for its acceptance. Result of analysis supports qualitative reports that Igbo-Ora community is endowed with high literacy rate as Table 1 reveals that 13.0% of the respondents had no formal education, 26.0% completed primary education, 43.0% completed secondary education, 17.0% successfully completed tertiary education and 1.0% pass through adult literacy class in other to learn how to read and write. This corroborates Adediran (2008) and Oludipe (2009) that majority of rural work forces have secondary school education. This significantly reduces language barriers in communication and aids policy entry in the community because education is an important tool for any development to take place globally, nationally and locally. Besides, indigenes and non-indigenes will be more comfortable with development that occur due to formal education attained, as this contributes to the acceptance or declining of any development and its sustainability if it could meet the felt need of the community. Table1 also shows that 84.5% and 92.0% were males and females within the household size of 1 –5, while 15.5% and 8.0% were males and females that falls within household size of 6-10. This implies that the liabilities of the household tend to reduce at later, since female child has limited time to spend on their parents’ roof. With respect to the
total household size, Table 1 reveals that most (82.0%) of the respondents had household size of 1-5. This corroborates the findings of Ebitigha (2008) and Oludipe (2009) that majority of the households have a size that ranges between1 and 5. Qualitative report reveals that female are the majority in the community as it support the findings of quantitative which shows that the female are the majority within the household unit. This also suggests that the small household size within Igbo-ora community is because majority of children take up their own income generating activity or education outside the household activities after secondary school. Besides, as members of family become distant from their relatives, it decreases the family expenditure on individual household wards. All (100%) the respondents have more than one income earning activities. This is in line with Akinola, (2007) that majority of rural dwellers engaged in multiple income generating activities. Although, farming is regarded as the primary occupation in Igbo-ora community, this study revealed that majority (45.0%) were artisans but however, majority of households diversify into farming activities even those that regarded artisans as their primary occupation. This finding is consistent with Akinola (2007) and Oludipe (2009) that the largest percent of rural dwellers are crop farmers. Moreover, Table 1 reveals that 25.0%, 10.0%, 6.5% and 1.0% were farmers, traders, civil servants and teachers respectively. Twelve point five percent accounted for households that were involved in other income generating activities such as transporters, hired labourers and the likes. Table 1 further indicates that majority (43.0% and 45.0%) of the respondents earned ≤ N450,000 and between N451,000- N901,000 annually respectively. More so, 8.5% and 1.0% earned between N902,000 - N1,352,000 and N1,353,000 - N1,803,000 annually respectively. Only few (2.5%) earned above N1,804,000 annually. Although, the income level in Igbo-Ora is moderate for those that diversify especially from their primary occupation while people that mainly focus on farming earn lesser than the average income of N556,002.04. This is not consistent with the findings of Akinola (2007) and Oludipe (2009) that majority of rural work force earned N10,000 on the average a month, approximately N120,000 per year. This implies that their income in Igbo-Ora community is on the level of average since most of them engage in multiple income portfolios.
Table 1: Distribution of respondents by selected personal characteristics Variables Frequency % Mean Age (years) 22-32 75 37.5

Nigerian Journal of Rural Sociology Vol. 15, No. 2, March 2015
98
33-43 64 32.0 40.01 44-54 32 16.0
55-65 17 8.5 > 65 Sex
Male Female
12 95 5
6.0 95.5 4.5
Marital status Single 14 7.0 Married 184 92.0 Divorced 1 0.5 Widowed Religion
Christianity Islam Traditional
1 60 136 4
0.5 30.0 68.0 2.0
Educational
attainment
No formal 26 13.0 Primary education 52 26.0 Secondary education
86 43.0
Tertiary education 34 17.0 Others Household size
Male 1-5 6 and above Female
1-5 6 and above Total HH size
1-5 6 and above
2 169 31 184 16 164 36
1.0 84.5 15.5 92.0 8.0 82.0 18.0
Occupation
Farming 50 25.0 Trading 20 10.0 Civil service 13 6.5 Artisans 90 45.0 Teaching 2 1.0 Others 25 12.5 Annual income
(N)
<450000 86 43.0 556,002.04
451000-901000 90 45.0 902000-1352000 17 8.5 1353000-1803000 2 1.0 Above 1803000 5 2.5 Result of analysis from Table 2 shows the result of respondents’ possessions of SES indicators based on categories of between 1-2 items and 3 and above. The items they have in common were television, DVD player, functioning radio, which for the majority 81.5%, 83.5%, 87.0% respondents respectively which they possessed between 1-2 items. Radio was revealed as the first rank in the distribution. This shows that radio was the first indicator of socioeconomic status in this study. Moreover, respondents with above 3 items
are few but yet majority in the distribution are respondents who possessed plastic chairs and benches accounted for 16.5% and 15.5% respectively. But the least in this distribution 0.5% which accounted for respondents with above 3 possession of radio, motorcycle, well and more than 5 acres of land respectively.
Table 2a: Distribution of households based on
their socioeconomic status indicators Variables Number of items
possessed Ranking
1-2 3 and above
50% and above
F (%) F (%) Houses built with block cities
2 (1.0) -
Houses with blocks in villages
21 (10.5) -
Houses built with mud in the villages
4 (2.0) -
Houses built with palm frond
2 (1.0) -
Big generator 47 (23.5) 3 (1.5) Small generator
100 (50.0) 1 (0.5) 13th
Rechargeable lantern
111 (55.5) 8 (4.0) 10th
Torch light 155 (77.5) 16 (8.0) 4th
Kerosene lantern
136 (68.0) 8 (4.0) 6th
Refrigerator (deep freezer)
18 (9.0) -
Freezer with fridge
5 (2.5) -
Big fridge 13 (6.5) 2 (1.0) Small fridge 17 (8.5) - Cooling bucket 5 (2.5) - Plasma television
6 (3.0) -
Coloured old model TV
163 (81.5) 4 (2.0) 2nd
Functioning DVD
167 (83.5) 4 (2.0) 3rd
Functioning radio
174 (87.0) 1 (0.5) 1st
White screen old model
4 (2.0) -
New model cars
5 (2.5) -
Old model cars 22 (11.0) 2 (1.0) Motorcycle 116 (58.0) 1 (0.5) 9th
Bicycle 3 (1.5) -
More than 5 acres land
58 (29.0) 1 (0.5)

Nigerian Journal of Rural Sociology Vol. 15, No. 2, March 2015
99
Variables Number of items possessed
Ranking
1-2 3 and above
50% and above
F (%) F (%) Btw 3-4 acres 6 (3.0) - Btw 2-3 acres 32 (16.0) - Btw 1-2 acres 22 (11.0) - Less than 1 acres
25 (12.5) -
Leather executive chair
5 (2.5) -
Cushioned chair
152 (76.0) 2 (1.0) 5th
Wooden chair 3 (1.5) 2 (1.0) Plastic chair 60 (30.0) 33 (16.5) Benches 106 (53.0) 31 (15.5) 12th
Pipe borne water
2 (1.0) -
Bore hole 109 (54.5) - 11th
Well with pumping machine
17(8.5) -
Well water 136 (68.0) 1 (0.5) 5th
Stream water 9 (4.5) - Wooden bed with covered mattress
66 (33.0) 9 (4.5)
Wooden bed with uncovered mattress
97 (48.5) 4 (2.0)
Mattress without wooden bed
19 (9.5) 1 (0.5)
Bed with mat 3 (1.5) - Ordinary mat 122 (61.0) 31 (15.5) 8th
Tiled toilet 11 (5.5) 3 (1.5)
Variables Number of items possessed
Ranking
1-2 3 and above
50% and above
F (%) F (%) with water cistern Untiled toilet water cistern
32 (16.0) -
Pit closet 45 (22.5) - Pit latrine 47 (23.5) - Bucket system 61 (30.5) - Result of analysis from Table 2 reveals that 61.0% of respondents had low socioeconomic status, while 39.0% had access to high socioeconomic status. This further shows a maximum score of 237.0 and a minimum score of 0, with mean score of 47.4. Majority having low socioeconomic status implies that their low level of their social capital as reported in qualitative data contributes to their low socioeconomic status and high level of diversification from their main occupation has also limit the growth of those activities since all the activities cannot be uniformly concentrated on, especially the poorer households which corroborate with Adediran (2008) that majority of rural work force are poorer than average due to the fact that they engaged in more than one income generating activities because of the seasonality of their main occupation. Although, studies states that we cannot totally assume all rural households have low or poor SES because some of them still possess high SES through accumulation of assets that are transferred from one generation to another.
Table 3: Distribution of households based on their level of socioeconomic status
Frequency % Minimum
Maximum Mean
Low (< 47) High ( ≥ 47) Total
122 78 200
61.0 39.0 100.0
0
237.0
47.4
Result of analysis in Table 4 reveals that there was no significant relationship between sex (χ2=0.036, p= 0.668), marital status (χ2=2.033, p=0.566) religion (χ2=4.325, p=0.115) and socioeconomic status of respondents in Igbo-ora community. On the other hand, a significant relationship existed between occupation (χ2=13.383, p=0.031), educational attainment (χ2=3.723, p=0.054) and socioeconomic status in the community. The implication of this is that sex, marital status and religion have influence on socioeconomic status. Also occupation did not have significant relationship with socioeconomic status
despite the high rate of non- agricultural activities saturated in the community. Since majority had secondary education and, educational attainment has a significant relationship with socioeconomic status in Igbo-Ora community. This implies that education improves knowledge, skills and attitude of people. Also it increases the capabilities of people to increase in their income generating activities thereby combining other activities making them to utilise their capital assets judiciously for proper management. Respondents with higher education thus have an increase in socioeconomic status and

Nigerian Journal of Rural Sociology Vol. 15, No. 2, March 2015
100
they embrace any developmental programmes that likely contribute to their SES.
Table 4: Chi-square test of association between selected personal characteristics and socioeconomic status of household heads Personal characteristics
Value
Df
p-value
Remark
Decision
Sex 0.036 1 0.668
NS Accept Null
Marital status
2.033 3 0.566
NS Accept Null
Religion 4.325 2 0.115
NS Accept Null
Educational attainment
3.723 1 0.054
S Reject Null
Occupation 13.383
5 0.031
S Reject Null
Table 5 shows that significant relationship exists between respondents income (r=0.428, p=0.000) and socioeconomic status in Igbo-Ora community. This implies that income is directly proportional to socioeconomic status. That is, the higher the income the better the socioeconomic status of an individual becomes. Despite, the averagely high level of income in the community yet, their socioeconomic status was low. This is because their income flow is not sustainable enough to assist in building their socioeconomic status, since their first socioeconomic indicator was functioning radio. It is therefore corroborated with FGD that most of their incomes earned are not meant to be their profit. This is thereby utilised as their main capital on the next activity they involved or engaged in, as such income activities has high vulnerability or liable to sudden shock, which tends not to sustain their living. Also, age and household size does not have significant relationship with the socioeconomic status. This implies that level of socioeconomic status had no effect on respondents’ age and household size.
Table 5: Correlation between selected personal characteristics and socioeconomic status Personal characteristics
r-value
p-value
Remark
Decision
Age 0.067
0.347
NS Accept Null
Household size
0.113
0.112
NS Accept Null
Income 0.428
0.000
S Reject Null
CONCLUSION AND RECOMMENDATIONS
It can be deduced based on the findings that socioeconomic status of Igbo-Ora community is
low despite their moderate level of income earning from their income earning activities and yet, does not have positive impact on their socioeconomic status. Igbo-Ora household are poor, as majority has functioning radio to be their first indicator in measuring the socioeconomic status. Majority were within the ages of 22-43 years, married, Muslims, completed primary and secondary education, males but with highest ratio of female within their households. Significant relationship existed between respondents’ income and socioeconomic status in the study area. Efforts should be made by the extension agencies concerning their SES indicator, so that if any intervention has to take place, those indicators should succinct with the innovation while addressing community felt needs for such intervention to become sustainable towards improving households’ socioeconomic status.
REFERENCES
Adediran D. 2008. Effect of Livelihood
Diversification on Socioeconomic Status
of Rural Dwellers in Ogun State, Nigeria. Project. Ibadan: University of Ibadan.
Akinbile, L. A. (2007). Standardization of Socioeconomic Status (SES) Scale for Farm Families in South West Nigeria. Journal of Social Science, 14(3): 221-227
Akinola, B. (2007). Livelihood activities of rural migrants in Odeda local government area of Ogun state Nigeria. Project. Ibadan: University of Ibadan.
Department of Agric Extension Rural Development, (2013). Interim college of medicine-Igboora Needs Assessment. Interim Report of the needs analysis.pp3-4
Ebitigha O. (2008). Effects of Livelihood
Diversification on Rural Households
Socioeconomic Status in Osun State,
Nigeria. M.Sc. Thesis, Unpublished. Ibadan: University Of Ibadan.
Food and Agricultural Organisation. (2006). Food Security. FAO Policy Brief June 2006(2). Rome: Food and Agriculture Organisation
Hampton, G. and Higham, D. (2006). The outcome
of an urban university on community
development. Retrieved from www.umdnj.edu/comreweb/../the_outcome_of_an_urban%20university.pdf may 12, 2015.
Higgs, N. (2002). Measuring socioeconomic status: A discussion and comparison of methods or letting the Gini out of the bottle plus some thoughts on wellbeing. Proceedings of the SAMRA Convention. South African Marketing Association, Drakensberg, South Africa.

Nigerian Journal of Rural Sociology Vol. 15, No. 2, March 2015
101
Martins, M. (2001). The land-grant university in the 21st century. Journal of Agricultural
and Applied Economics, 33(2), 377-380
Olawoye, J. E. (2000). Agricultural Extension Delivery in a Democratic and Deregulated Economy. A Paper Presented at the 6th Annual Conference of Extension society of Nigeria, Ibadan. pp 3-5
Oludipe, B. B. (2009). Livelihood Activities of Artisanal Fisher Folks in Epe Local Government Area of Lagos State, Nigeria. An Unpublished Msc project of the
Department of Agricultural Extension and Rural Development, Faculty of Agricultural and Forestry, University of Ibadan. pp 52-62
Patel, A.U and Q.B.O Anthonio. (1974). “Construction and standardization of a scale to measure Socioeconomic status of rural farm families in Western Nigeria.” Nigeria Journal of Economic and Social
Studies, 16: 99-113. World Factbook (2010).

Nigerian Journal of Rural Sociology Vol. 15, No. 2, March 2015
102
EFFECT OF VEGETABLE PROFITABILITY ON THE LIVING STANDARDS OF URBAN
FARMERS IN LAGOS STATE
Edeoghon, C. O. and Anozie, O. Department of Agricultural Economics and Extension Services, Faculty of Agriculture, University of Benin,
Benin City, Nigeria E-mail: [email protected], [email protected]
ABSTRACT
The study assessed the effect of vegetable production on the living standards of urban farmers in Lagos State. It
focused on the profitability of vegetable farming and the living standards/conditions of vegetable farmers. Data
were collected from 150 respondents using a structured questionnaire and analyzed using frequency counts,
means, percentages and standard deviation. Hypothesis testing was done using Spearman’s Rank Correlation
Coefficient. Major results show that pumpkin vegetables (mean=2.54) had high and uniform profitability among
all farmers. Few farmers enjoy good living conditions but were generally food secure. The relationship between
perceived profitability of vegetable farming and the standard of living of respondents show that all the variables
(consumption, r=0.025, income, r=0.019, health, r=0.123 and education, r=0.025) had a positive correlation
with perceived profitability of vegetable farming but were not significant. This implies that they had enough
profit to live fairly well but their small farm sizes deprived them of some entitlements. Farmers were advised to
increase their scale of operation so as to earn more from vegetable farming and hence increase their standards
of living.
Keywords: Vegetable profitability, Living standards, Urban agriculture
INTRODUCTION
Urban agriculture takes place on private, leased or rented land in peri-urban areas, in backyards, on roof tops, on vacant public lands (such as vacant industrial or residential lots, road sides), or on semi-public lands such as school grounds, in prisons and other institutions, as well as in ponds, lakes and rivers. Vegetable farming is the growing of vegetables for human consumption. Traditionally it was done in the soil in small rows or blocks, often primarily for consumption on the farm, with the excess sold in nearby towns. Both men and women are involved in vegetable production (Berinyuy, 1998). Leafy vegetables are an important feature of Nigerians’ diet that a traditional meal without it is assumed to be incomplete. Therefore, the horticultural sector which supplies vegetables occupies a significant niche in the food systems of urban and peri urban centers, providing often highly perishable produce to urban consumers. Urbanization is one of the major problems of mankind in the near future. By 2015, about 26 cities in the world are expected to have a population of 10million or more. To feed a city of the size Tokyo, Sao Paulo or Mexico City for example at least 6000tonnes of food must be imported each day (FAO-SOFA, 1998). A lack of job and income is leading to increasing urban poverty as well as to growing food insecurity among the urban poor. A substantial proportion of urban household expenditures (as much as 60-80%) is dedicated to food for poor households. In the city context the lack of cash income translates more directly into food shortages and malnutrition (Mougeot, 2006). On the average, urban consumers spend at least 30 percent or more on food but despite this their average calorie intake is low and in most cases insufficient (Argenti, 2000).
Worldwide around 852 million people are chronically hungry due to extreme poverty while up to 2 billion lack food security intermittently due to varying degrees of poverty (FAO, 2003). The urban farmers include men and women coming from all income groups, but the majority of them are low-income earners. Women tend to dominate certain components of urban cultivation such as vegetable farming (Idowu, Cofie and Adetola, 2012). Women are the key players in the production of vegetables as they are mostly involved in indigenous vegetables such as green leaf, bitter leaf, fluted pumpkin, soko, ewedu and the like (Schippers, 2000). Yet it has been observed by Southern African Development Committee (SADC) countries that women usually lack the savings needed to put down the equity payment requirement to get a loan to expand their farming enterprise. Also married women have no independent access to land or physical infrastructure that could be used as collateral for a loan. Even those married women who have knowledge, ability and time to engage in large scale business activities face difficulties in obtaining loans without permission from their husbands or fathers. In West Africa, married women in Nigeria also suffer from similar laws that limit their access to productive resources such as land (Deji, Koledoye and Owombo, 2013). At best, they have only temporary tenancy rights to use as part of their husband’s land (FAO, 1997, Iwuchukwu and Uzoho, 2009). A survey of 720 households in Harare shows that higher income farmers engage in more gardening and cropping activities (ENDA, 1999). The highest income earned was equivalent of 7 months’ salary at the industry minimum wage, while the average earnings were equivalent to about 2 weeks of an industrial salary (ENDA,

Nigerian Journal of Rural Sociology Vol. 15, No. 2, March 2015
103
1996). According to Success Digest (2013), vegetable farming is a lucrative business in the sense that it takes shorter period to mature and also has a regular market demand. Compared with cassava for example, that may stay a year or more in the ground, it is lucrative and gives an even source of cash to farmers as this period can give three harvests of vegetables (Abukutsa – Onyago, 2003, Thompson et al., 2010) However, urban farmers are still found to be poor, is it that they do not have enough resources or they are not making sufficient profit to cater for themselves and their households? From the above, it can be seen that there are some problems underling urban agriculture as it concerns vegetable production and this in turn affects the living standards of the urban farmers. The Living Standard Measurement Study (LSMS) was established by the Development Research Group (DECRG) to improve on the quality and type of household data collected. Indicators of living standard used include Housing, Education, Consumption, Income, Labour Employment, Health and Healthcare (Grosh and Glewwe, 1995). This study therefore seeks to address the following specific objectives arising from these challenges are: to determine the profitability of vegetable farming in the study area and to assess the living standards/ conditions of vegetable farmers in the study area; while hypothesis to be tested is: there is no significant relationship between profitability of vegetable farming and the standard of living of urban vegetable farmers.
METHODOLOGY
Lagos state is one of the 36 states in Nigeria and lies to the south-west of Nigeria with Ikeja as its capital. It extends approximately from latitude 60 2' North to 60 4' North and from longitude 20 45' East to 40 20' East. Of its total area of 4000sqkm, about 3277sqkm i.e. 78% is land and about 787sqkm or 22% is water (PATHS, 2012). The state is bounded in the North and the East by Ogun state, spans the Guinea coast of the Atlantic Ocean for over 180km to the South from the Republic of Benin on the West. The state is rich in natural and mineral resources including oil, natural gas, bitumen and the two non-metallic mineral resources available in commercial quantities in the state are clay and silica rich sands. Total population of Lagos is over 17.5 million (PATHS, 2012). Sampling technique - A multi-stage sampling was employed in this study. First, was the purposive selection of two agricultural zones (Badagry and Ikorodu) for the study out of the five agricultural zones in Lagos State. This is because vegetables are mainly cultivated or grown in these areas. Secondly, a total of 15 communities (7 from
Badagry and 8 from Ikorodu) were randomly selected. The third stage of this procedure was the random selection of 10 respondents (vegetable farmers) from each community for inclusion in the sample, thus giving rise to a total sample size of 150 respondents (70 respondents from Badagry and 80 from Ikorodu). Data collection - Both primary and secondary data were used to elicit information for the study. The primary data was obtained using a well-structured questionnaire which was administered to the farmers and also interview schedule. The secondary data used in chapters one and two and section of the result discussions were sourced from various publications such as journals, textbooks, internet, past research work, libraries relevant to the study. Measurement of variables - Profitability of vegetable farming was measured using a 3-point Likert type scale of Very profitable=3, profitable=2, Not profitable=1. Mean responses greater than or equal to 2.00 were considered as profitable while mean responses of below 2.00 were considered as not profitable. To assess the living standard of respondents, indicators for living standard such as Living Conditions, Education, Labour Employment, Health and Healthcare, Income and Consumption level were measured. Living conditions: This was measured by asking the respondents to indicate the type of house they lived in (Flat or Face to Face), Ownership of house and possession of facilities in the house. A list of facilities was given and respondents were required to tick YES or NO. YES was coded 1 while NO was coded 2. Education: This was measured by asking the respondents 6 questions. A 5-point Likert type scale of Strongly agree=5, Agree=4, Not sure=3, Disagree=2 and Strongly disagree=1 were used. Mean responses greater than or equal to 3.00 were considered as being significant while mean responses below 3.00 were considered as not significant. Labour Employment, Health and
Healthcare, Income and Consumption level: These were measured by asking the respondents some questions under each indicator. A 3-point Likert type scale of Always=3, Sometimes=2 and Never=1 were used. Mean responses greater than or equal to 2.00 were considered as high living standard while mean responses below 2.00 were considered as low living standard. Analytical techniques - Simple descriptive statistical technique such as frequency counts, percentages, means, standard deviation and rank order were used to analyze the data collected while Spearman’s rank correlation was used to test the hypotheses.

Nigerian Journal of Rural Sociology Vol. 15, No. 2, March 2015
104
The Spearman’s rank correlation coefficient is given by: ρ = 1 - 6∑di
2 n (n2 - 1)
Where di = Xi – Yi (Deviation = Differences between the ranks of each observation on the 2 variables) n = sample size Xi = Independent variable Yi = Dependent variable
RESULTS AND DISCUSSIONS
Perceived profitability of vegetables grown by
respondents
Perceived profitability of vegetables grown by respondents, findings from Table 1 indicates that pumpkin, bitter leaf, water leaf, ewedu, scent leaf and soko leaf were profitable since their means are greater than 2. This result agrees with that obtained by Adebooye and Opabode, (2004) ewedu, an indigenous leaf vegetable in south-west Nigeria was several times more expensive and profitable than routinely cultivated species (vegetables). He also reported that leafy vegetables such as pumpkin, soko, green leaf were also very
profitable. Srinivos (2012) also reported from his research in India that farmers are shifting from paddy production to vegetable production because vegetable was four to eight times more profitable than other crops. The results revealed that respondents made less profit from utazi leaf, egg plant, ila and worowo. This could be due to low demand of these vegetables in the study area. However ila production was considered profitable by Ikorodu farmers and utazi leaf was also profitable in Badagry despite their low demand in the study area, implying that there was viable market for ila and utazi in Ikorodu and Badagry respectively and this is probably due to the preference of these vegetables by consumers in Ikorodu and Badagry. The standard deviation of pumpkin production showed a dispersion of 2.54 ± 0.5 around the mean and did not affect the significance of the mean, but that of scent leaf 2.09 ± 0.323 affected the significance of the mean. This finding implies an even respondents’ uniformity of the profitability of pumpkin production but not all respondents agree to the profitability of scent leaf.
Table 1: Perceived profitability of vegetables grown Ikorodu Badagry Total
Mean SD Mean SD Mean SD Pumpkin (ugu) 2.48* .5 2.59* .5 2.54* .5 Soko leaf 2.48* .5 2.10* .3 2.27* .5 Ewedu leaf 2.36* .7 2.08* .6 2.22* .6 Water leaf 2.17* .4 2.21* .4 2.19* .4 Bitter leaf 2.21* .5 2.16* .5 2.18* .5 Green leaf 2.22* .4 2.08* .3 2.14* .4 Scent leaf 2.09* .4 2.10* .3 2.09* .3 Utazi leaf 1.97 .2 2.00* .0 1.99 .1 Ila 2.02* .5 1.97 .4 1.99 .4 Egg plant 1.95 .4 1.97 .4 1.96 .4 Worowo 1.95 .4 1.90 .3 1.92 .3 Source: Field Survey, 2012.* Multiple Responses.* Profitable Vegetable, mean ≥ 2.0
Respondents’ reasons for not growing some
vegetables despite their profitability Table 2 shows respondents’ reasons for not growing some vegetable despite their profitability. Reasons such as; lack of land, unfavourable weather, difficult to cultivate, no market value, no market, lack of input and lack of knowledge for cultivating the vegetable were considered serious since their means were greater than 2.50. These findings agree with that of Samantaray, Prusty and Raj (2009) in their study of constraints in vegetable production that some of the above reasons prevent or hinder farmers from growing vegetables. Diogo, Buerkert and Schlecht (2011) from their study in Niamey, Niger reported that unavailability of land, mainly in intra-urban areas, is a great hindrance to vegetable farming. They also noted that in general urban agriculture is known to be associated with
high-inputs such as fertilizers, seeds and pesticides among others. The standard deviation shows how the values deviate from the mean. A standard deviation that does not change the mean negatively shows that the variable is significant across the population. The standard deviation value (SD = 0.303) for lack of land and the standard deviation value (SD = 0.585) for lack of knowledge for cultivating the vegetable both have a dispersion of 3.90 ± 0.303 and 3.51 ± 0.588 respectively, both variables do not deviate from the mean showing that the significance or seriousness is very strong across all the population. Table 2: Reasons for not growing some vegetables despite their profitability Mean Std.
Nigerian Journal of Rural Sociology Vol. 15, No. 2, March 2015
105
Deviation
Lack of land 3.90* .303 Unfavourable weather 3.80* .447 Difficult to cultivate 3.58* .515 No market value 3.60* .577 No market 3.67* .577 Lack of input 3.75* .452 Lack of knowledge for cultivating the vegetable
3.51* .585
Source: Field Survey, 2012.*Multiple
Responses.*Serious Reason, Mean ≥ 2.50
Living standards of respondents and living
conditions of respondents
The living conditions of a household provide a good indicator of living standard measurement. The result in Table 3 shows that 51.3% of the respondents’ household in the study area lived in face to face and as much as 48.7% of respondents
lived in flat and 26.7% of the respondents owned the house they live in. The type of house an individual occupies is a function of his level of income. This also holds for house ownership. Based on house facilities possessed, majority of respondents (94.0%) possessed television sets, 85.3% possessed radio set and 84.0% possessed telephones. More than half (74.7%) had either rug/carpet/tiles, 69.3% had a C.D/DVD player and 63.3% had generators. Almost half (46.0%) of the respondents had a refrigerator and 46.0% had bore hole. The implication of the above result is that only some of the respondents could be adjudged to be enjoying good living conditions. This is because the house facilities they possessed were those that are basic i.e. they had only those basic facilities that are needed in a house and only a few of them could afford luxuries such as car, air conditioner.
Table 3.1: Living conditions of respondents Ikorodu Badagry Total Type of house lived Freq % Freq % Freq % Flat 45 64.3 29 36.2 73 48.7 Face to Face 25 35.7 51 63.8 77 51.3 House ownership 33 47.1 7 8.8 40 26.7 House facilities possessed
Television 67 95.7 74 92.5 141 94.0 Radio 62 88.6 66 82.5 128 85.3 Computer 6 8.6 10 12.5 16 10.7 CD/DVD player 53 75.7 51 63.8 104 69.3 Refrigerator 39 55.7 30 37.5 69 46.0 Washing machine 8 11.4 8 10.0 16 10.7 Rug/ carpet/ tiles 58 82.9 54 67.5 112 74.7 Generator 49 70.0 46 57.5 95 63.3 Bore hole 39 55.7 30 37.5 69 46.0 Water heater 23 32.9 8 10.0 31 20.7 Car 17 24.3 2 2.5 19 12.7 Electric/ gas cooker 20 28.6 12 15.0 32 21.3 Telephone 60 85.7 66 82.5 126 84.0 Water closet toilet 54 77.1 56 70.0 110 73.3 Air conditioner 2 2.9 2 1.3 Source: Field Survey, 2012.*Multiple Responses
Indicators of standard of living of respondents
Other indicators of standard of living include education, labour employment, health and healthcare, income level and consumption level. Grosh and Glewwe (1995). Standard of living as shown in Table 3.2 for education reveals that, respondents ability to enrol their children into primary school (given their income from vegetable farming), enrolment of respondents children into kindergarten from ages of 3 – 5 years, enrolment of respondents children into secondary school and ability of respondents to afford the education of their children up to university level; were all significant because their means were greater than
3.00. Respondents children being sent out of school due to lack of payment of fees and the possibility of their children not completing their primary and secondary education because they cannot afford the fees have means of 2.92 and 2.39 respectively. These variables were not significant since their means are less than 3.00. The implication of this result is that respondents can afford the educational requirements of their children from kindergarten up to university level. This is likely due to the fact that vegetable farmers in the study area are generating enough income to enroll and keep their children in school up to university level. Mougoet (2000) stated that urban farming is comparatively

Nigerian Journal of Rural Sociology Vol. 15, No. 2, March 2015
106
affordable, a noteworthy source of income and savings and is more profitable than rural-based farming. In Table 3.2, respondents’ labour employment show that self only, family members labour, hired labour, mixed labour were significant because their means are greater than 2.00. This implies that the labour employed by respondents in vegetable farming came either from self (i.e. respondents), family members, hired labour or mixed labour. The dispersion of the variants of hired labour 2.75 ± 0.558 and mixed labour 2.71 ± 0.597 around the mean do not affect the significance of the mean hence the significance is very strong across all the population. This is probably due to the high labour requirements of vegetable farming. This result is in line with the findings of Umoh and Yusuf (2000) who stated that urban vegetable farming involves the use of traditional farming implements such as hoe and machete. They noted that human power plays crucial role and this has been attributed to small and scattered farm holding, poverty of farmers and lack of affordable equipment. Concerning health and healthcare, Table 3.2 shows that ability of respondents to afford primary healthcare services for his family (mean = 2.59), afford good health package for themselves and family (mean = 2.24), immunization for all respondents children (mean = 2.95) were significant. Though respondents could afford the necessary health care packages for themselves and their household, however, their income might not be enough for them to acquire routine medical checkup which was not significant. This might be due to high cost associated with routine medical checkup. Also they preferred modern medicine to traditional medicine probably due to the increased availability of public health services and greater awareness on the relative importance of modern medicine. The standard deviation value (SD = 0.2) for immunization for respondents children have a dispersion of 2.95 ± 0.225 do not deviate from the mean showing that the significance is very strong across all the population. Respondents ability to afford good health package for their household have a dispersion of 2.24 ± 0.6, this variable deviate negatively from the mean showing that the significance is not very strong across all the population. Again the health and health care of respondents depends on their level of income. This agrees with Nugent, (2000) who stated that high living standard is associated with high income level and consumption. Table 3.2 also shows results on income: ability of income to meet daily household needs, provide
basic comfort of life, income being sufficient to keep respondents on vegetable farming on full time basis, income sufficient for future saving and income sufficient to expand production were not significant. This implies that the respondents’ income from vegetable farming was only enough to meet immediate needs as it comes but not enough for long time planning i.e. majority of respondents (46%) were in low income bracket. This finding concurs with that of Aina et al (2012) in their study: urban livelihood, which reported that majority of farmers involved in vegetable farming have low farm income and the low income earned might deprive the farmers of some entitlements (e.g. health, education). However Umoh (2006) had a different view, he reported that the percentage of farmers in Uyo who were on a high income bracket was slightly higher than those on a low income bracket. Table 3.2 also reveal results on consumption level of respondents reveals that ability of household to afford 3 square meals (mean = 2.74), access to safe drinking water (mean = 2.39), afford balanced diet (mean = 2.00) were significant. This implies that the respondents and their families were food secure. This also implies that majority of the respondents were food secured. This can be attributed to the fact that since respondents were famers, they had easy access to food. This corroborates with Maxwell, Levin and Csete (1998) who in their study: “Does urban agriculture help prevent malnutrition?” reported that in Kampala, children aged five years or less (in low - income farming households) were found to be significantly better-off nutritionally (less stunted) than counterparts in non-farming households. Adedeji and Ademiluyi, (2009) also observed in their study of urban agriculture in Lagos, Nigeria, that the production of leafy vegetables provides a quick return that helps families to meet their daily cash requirements for purchasing other food. Based on the indicators of living standard discussed above, it can be concluded that majority of the respondents have low living standards. This is because according Nugent (2000) high standard of living is associated with high income level and consumption level. Respondents are majorly of a low farm income although they are food secured. Hence the bulk of respondents’ income goes to household food consumption in order to be food secured while only a little is left to cater for other basic needs of life. The findings also do not support ENDA, (1996) who reported that vegetable farmers in Harare have a relatively high standard of living.
Table 3:2 Living standard of respondents

Nigerian Journal of Rural Sociology Vol. 15, No. 2, March 2015
107
Ikorodu Badagry Total Mean SD Mean SD Mean SD
Education
With my Income can sponsor my children in kindergarten 3.67* 1.4 3.10* 1.3 3.37* 1.3 With my income can enroll my children in primary school 4.19* .9 3.95* 1.0 4.06* .9 Have or will enroll children for secondary education. 4.00* 1.0 3.97* 1.1 3.99* 1.1 Can afford children education up to university level. 3.44* 1.1 3.00* 1.3 3.21* 1.2 My children may be sent out of school due to lack of payment of fees.
2.99 1.3 2.86 1.4 2.92 1.3
My children may be unable to complete their primary and secondary education because I may not be able to afford the fees.
2.49 1.3 2.31 1.2 2.39 1.3
Labour Employment
self only 2.03* .7 2.20* .6 2.12* .7 family members 2.29* .6 2.34* .6 2.31* .6 hired labour 2.76* .5 2.74* .6 2.75* .6 mixed labour; (self and hired labour) (family labour and hired labour)
2.71* .6 2.70* .6 2.71* .6
Health and Healthcare
Can afford primary health care services for family 2.77* .5 2.44* .7 2.59* .6 Can afford good health package for my household 2.53* .5 1.99* .6 2.24* .6 Completed immunization programme for all my children 2.97* .2 2.93* .3 2.95* .2 Can afford routine medical checkup for my household 1.80 .7 1.23 .5 1.49 .7 Prefer traditional medicine to modern medicine because it is cheaper
1.97 .7 1.78 .7 1.87 .7
Income
Income sufficient to keep me in vegetable farming on full time basis
2.09* .7 1.55 .7 1.80 .8
Income able to meet daily household needs 2.17* .8 1.77 .7 1.96 .8 Income sufficient to enable future saving 1.76 .8 1.35 .6 1.54 .7 Income sufficient to expand production 1.46 .6 1.32 .6 1.39 .6 Income provides basic comfort of life 2.01* .6 1.71 .6 1.85 .7 Consumption Level
Household can afford 3 square meals 2.73* .5 2.75* .5 2.74* .5 household can afford balanced diet 2.13* .7 1.89 .6 2.00* .7 In the last one year, how frequently do you or any member of your family skip meals or cut the size of your meals because there was not enough money for food?
1.66 .6 1.61 .5 1.63 .6
Worry whether food would run out before money is available to buy more
1.97 .6 1.95 .4 1.96 .5
In the last 12 months, did you or your children lose weight because of insufficient food
1.47 .6 1.58 .5 1.53 .6
Have access to safe drinking water 2.60* .7 2.20* .9 2.39* .9 Source: Field Survey, 2012. *High living standard (For Education mean ≥ 3.00, For Labour Employment,
Income, Health and Consumption, mean ≥ 2.00)
Relationship between profitability of vegetable
farming and the standard of living of urban
vegetable farmers
Table 4 shows the relationship between perceived profitability of vegetable farming and the standard of living of respondents. All the variables had a positive correlation with perceived profitability of vegetable farming but were not significant. Correlation between consumption level as an indicator of living standard and perceived profitability of vegetable farming is positive (r = 0.025). The positive relationship implies that
respondents with higher consumption level felt they made more profits than respondents with low level of consumption. Correlation between health and healthcare as an indicator of living standard and perceived profitability of vegetable farming is also positive (r = 0.123) implying that respondents can afford improved health care packages. Correlation between education as indicator of living standard and perceived profitability of vegetable farming was positive (r = 0.025), implying that respondents who could afford formal education for household members. The reason for the above positive correlations is probably due to the fact that

Nigerian Journal of Rural Sociology Vol. 15, No. 2, March 2015
108
increased profit implies more income for the respondents which enabled respondents to afford improved consumption level, better health package, improved education for household members and higher farm income which would lead to high living standard. The findings agree with Nugent (2000) who stated that high standard of living is usually associated with high income level and consumption level. However, consumption, income, health and education as indicators of living standard were not significant probably because most of the respondents had small farm sizes which resulted in low farm income. This is also in line with Sen’s (2001) research on poverty and families: an essay on entitlements and deprivation, he reported that low farm income might deprive the farmers and households of some entitlements.
Table 4: Relationship between profitability of vegetable farming and the standard of living of urban vegetable farmers
Perceived Profitability (total)
r Prob. level
Living standard – Consumption 0.025 0.758
Living standard – Income 0.019 0.821
Living standard – Health 0.123 0.133
Living standard – Education 0.025 0.763
**. Correlation is significant at the 0.01 level (2-
tailed)
CONCLUSION
Vegetable farmers were generally found to be food secure but have low standards of living since most of them could only afford basic requirements of life and not luxuries. However, farmers were advised to increase their scale of operation so as to earn more from vegetable farming and hence increase their standards of living.
REFERENCES
Abakutsa Onyango, M.O. (2003). Unexploited Potential of African Indigenous Vegetables in Western Kenya. Maseno
Journal of Education, Arts and Sciences. Vol. 4. pp. 103-122.
Adebooye, O.C. and Opabude, J.T. (2004). Status of Conservation of the Indigenous Leafy Vegetables and Fruits of Africa. African
Journal of Biotechnology. Vol. 3, pp. 700-705.
Adedeji, O.H. and Ademiluyi, I.A. (2009).Urban Agriculture and Urban Land Use Planning: Need for a Synthesis in Metropolitan Lagos, Nigeria. Journal of
Geography and Regional planning 2(3): 43-50.
Aina, O.S., Oladapo, A., Adebosin, W.G. and Ajijola, S. (2012). Urban Livelihood: Urban Agriculture Implication in Food Security. A Journal of Applied
Phytotechnology in Environment
Sanitation. Vol.1, pp. 155-161, May 2012. http://www.trisanita.org/japes.
Argenti, O. (2000). Food for the Cities: Food Supply and Distribution Policies to Reduce Urban Food Insecurity.
Beyinyuy, J.E. (1998). Socio-Economic Survey on Indigenous Vegetables in the Foumbot Area of the High Plateau Agro-Ecological Zone of Cameroun. Report for NRFs, Project on Indigenous Vegetables in East and Central Africa.
Deji, O. F., Koledoje, G. F., and Owombo, P. T. (2013). Gender Analysis f Constraints to Vegetable Production in Ondo State, Nigeria. Nigerian Journal of Rural
Sociology, Vol. 13 (No. 3). Diogo, R.V.C., Buerkert, A. and Schlecht, E.
(2011). Economic Benefit to Gardeners and Retailers from Cultivating and Marketing Vegetables in Niamey, Niger. Outlook on Agriculture. Vol. 40(1), pp. 71-78.
ENDA-Zimbabwe, (1996). Urban Agriculture in Harare: Results and Recommendations of a Household Survey. Harare: ENDA (Unpublished). Experience of Governador Valadares, Brazil. Urban Agriculture Magazine. Vol. 16, pp. 45–47.
FAO (Food and Agriculture Organization of the United Nation), (2003). Food Insecurity in the World. Avaliable at: http://www.fao.org.
FAO, (1997). Higher Agricultural Education and Opportunities Rural Development for Women Rome, FAO. Avaliable at: http://www.fao.org.
FAO-SOFA, (1998). Traditional Food Plants, Food and Nutrition Paper 42, FAO, Rome, Italy.
Idowu, O., Cofie, O. and Adetola, A. (2012). Gender Analysis of Land Use for Urban Agriculture and Sustainability of Livelihoods in Freetown, Sierra Leone. African Journal of Agricultural Research. Vol.7, No.5, pp.676-683. Available online at http://www.academicsjournals.org/AJAR.
Iwuchukwu, J.C., and Uzoho, U. C. (2009). Constraints to Vegetable Production among Women in Enugu North of Agricultural Zone of Enugu State. Journal
of Agricultural Extension, Vol. 13 (No. 1). http:// dx.doi..org/10.4314/jae.v13i1.53871.
Maxwell, D.G., Levin, C. and Csete, J. (1999). Does Urban Agriculture Help Prevent

Nigerian Journal of Rural Sociology Vol. 15, No. 2, March 2015
109
Malnutrition? Evidence from Kampala. Food Policy, Vol. 23, pp.411-424.
Mougeot, L.J.A. (2000). Achieving Urban Food and Nutrition Security in the Developing World: The Hidden Significance of Urban Agriculture, A 2020 Vision for Food, Agriculture and the Environment, Focus 3, Brief 6 of 10, International Food Policy Research Institute (IFPRI), Washington, DC.
Mougeot, L. (2006). Growing Better Cities: Urban Agriculture for Sustainable Development, International Development Research Center, Ottawa, Canada.
Nugent, R. (2000). The Impact of Urban Agriculture on the Household and Local Economics. In Growing Cities, Growing Food: Urban Agriculture on the Policy Agenda. A Reader on Urban Agriculture. Bakker, N., Dubbeling, M., Gundel, S., Sabel-Kosehella, U. and DeZeeuw, H. (eds). pp. 67-97. Feidafing, Germany: DSE/ETC.
PATHS (Partnership for Transforming Health System 2), (2012): Lagos State Overview. Avaliable at: www.paths2nigeria.org/index.php?option=com_content
Samantarary, S.K., Prusty, S. and Raj, R.K. (2009). Constraints in Vegetable Production-Experiences of Tribal Vegetable Growers. Indian Research Journal Extension
Education Vol.3, No.9, pp. 1-3. Schippers, H.P. (2000). Growing Plantain and
Banana Leaf. INFOMUSA. Vol. 5, No. 1, pp. 27-28.
Sen, A.K. (2001). Poverty and Families. An Essay on Entitlement and Deprivation. Claderon Press Oxford.
Srinires, N.N. (2012). Farmers Dump Paddy for More Profitable Vegetables. http:articles.economictimes.indiatimes.com/2012-0828/news/33426578_1_salary-hikes-mahindra-satyma-cp-gurnani.
Success Digest, (2013). How to get 100% Return on Investment every 60 days through Commercial Vegetable Farming. Printed edition, September 14, 2013.
Thompson, J., Gebauer, J., Hammer, K. and Buerkert, A. (2010). The Structure of Urban and Peri-urban Gardens in Khartoum, Sudan. Genetic Resources Crop Evolution, vol. 57, pp. 487-500.
Umoh, G.S. and Yusuf, S.A. (2000). An Empirical Analysis of the Poverty Status and Productivity of Rural Farmers in Obubra, Cross River State, Nigeria. The Nigerian
Journal of Economics and Social Studies. Vol. 41, pp. 259-274.
Umoh, G.S. (2006). Resource Use Efficiency in Urban Farming: An Application of Stochastic Frontier Production Function. International Journal of Agriculture and
Biology. 1560-8530/2006/08-1-34-44. http://www.fspublishers.org.
UN-HABITAT, (2007). State of the World’s Cities Report 2006/2007.London, Earthscan.
Wikipedia, The Free Encyclopedia, (2010): Lagos State. Avaliable at: www.wikipedia.org.

Nigerian Journal of Rural Sociology Vol. 15, No. 2, March 2015
110
USE OF ENDOGENOUS KNOWLEDGE IN TREATING PESTS AND DISEASES OF SMALL
RUMINANTS IN OBOKUN LOCAL GOVERNMENT AREA OF OSUN STATE 1Omotara, O. A. and 2Olutegbe, N. S.
1 Department of Agricultural Education, Osun State College of Education, Ila Orangun, Osun state
2Department of Agricultural Extension and Rural Development, University of Ibadan, Ibadan E-mail: [email protected]
ABSTRACT
This paper examined the use of endogenous knowledge in treating pests and diseases of goats and sheep in
Obokun Local Government Area of Osun State. Multi stage sampling technique was used to select one hundred
and twenty rearers of small ruminants in the study area. Data were collected through a structured interview
schedule and analysed using frequency counts and chi-square. Majority (88.3%) of the respondents were
female, while 60.0% had one form of education or the other. The mean age was 50.7±16.5years. The most used
method in treating pests of small ruminants were adding shea butter oil and salt in treating mange(�̅1.23 ±
0.67),hand picking of tick (�̅1.08 ± 0.76) and rubbing the body of animal with palm kernel oil and salt for lice (�)0.45 ± 0.77),while those of diseases include treating helminthiasis with lime orange and grinded pawpaw
seed(�̅1.51 ± 0.63),using solution of charcoal and bitter leaf for diarrhoea(�̅1.30 ± 0.64), and treating
catarrh with tobacco snuff and pepper (�̅1.26 ± 0.63). Larger proportion (71.7%) of the respondents were
categorized as high level users of endogenous methods. Educational level, marital status and sex do not
significantly affect the level of use of endogenous knowledge. Endogenous knowledge is still relevant in
managing common pest and diseases of small ruminants in the rural areas. It is therefore recommended that the
knowledge be documented and incorporated in preventive and curative medicine for ease of passage from
generation to generation so as to prevent it from extinction.
Keywords: Endogenous knowledge, small ruminants, ectoparasite and endoparasite, animal diseases, animal Pests.
INTRODUCTION
Small ruminant animals constitute the most reared livestock among the farm families in Nigeria because of their ability to convert forages, crop and household residues into meat, fibre, skin and milk. Nigeria has a population of 34.5 million goats and 22.1 million sheep (Ajala and Adesehinwa, 2008). Sheep and goats play significant roles in the social and well-being of people in developing countries in terms of nutrition, income and intangible benefits such as insurance against emergencies and savings. It is of importance in ceremonies and cultural purposes (Kogsey, 2004). Pests and diseases portend a major risk to livestock development in Nigeria. The maintenance and sustenance of the health of farm animals constitute a major challenge to efficient livestock production among the rural livestock farmers as pests and diseases affect productivity, increase cost of production, reduce the quantity and quality of animal products and cause great loss to farmers. Small ruminants farmers, majority of whom reside in rural areas hardly take up veterinary treatment of their affected animals, as they often consider it as too expensive to bear and most of the times are not available (Fabusoro et al., 2007: Oluwafemi, 2009). They thereby result to ethno-veterinary treatment to save the lives of their diseased animals. However, the rural farmers have their own endogenous methods of preventing and managing animal diseases. Such knowledge and practices are rarely documented and are usually passed down orally from generation to generation.
Interestingly, endogenous practices still form the building blocks on which the foundations and development of pharmaceutical industry lie, and unless they are understood in their entirety, sustainable development may become difficult to attain. The dearth of information on the use of these endogenous knowledge in treating pests and diseases of small ruminants has therefore necessitated this study. This study thereby investigated the use of endogenous knowledge in treating pests and diseases of small ruminants in Obokun local government of Osun state. The specific objectives are to: 1. Examine the socio economic characteristics of
the small ruminants’ farmers in the area 2. Identify the sources of information on
endogenous methods used in treating pests and diseases
3. Investigate the uses of endogenous methods in treating pests and diseases in the study area.
4. Determine the effectiveness of using endogenous methods in treating pests and diseases of goats and sheep in the study area.
Hypotheses of the study
There is no significant relationship between selected socio-economic characteristics and the use of endogenous knowledge.
METHODOLOGY
The study was conducted in Obokun Local Government Area of Osun state, Nigeria. The study area is located on coordinates of 7o47’00N, 4o43’0E with a land mass area of 527 square
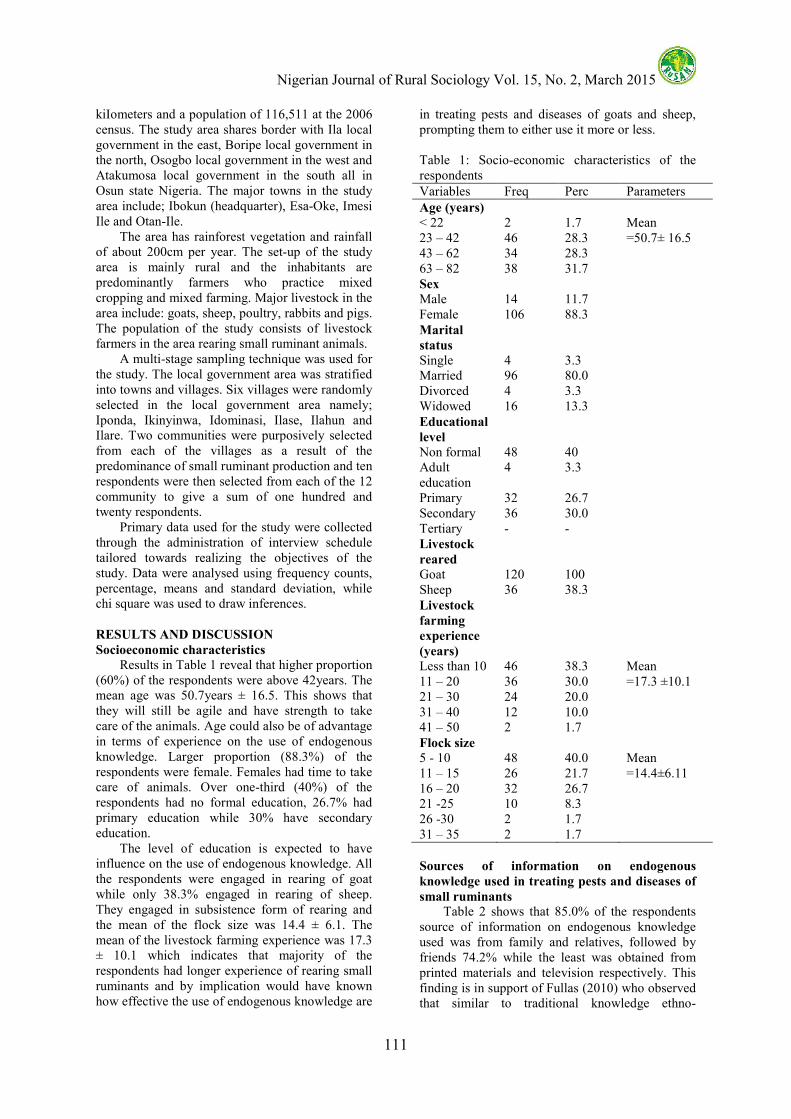
Nigerian Journal of Rural Sociology Vol. 15, No. 2, March 2015
111
kiIometers and a population of 116,511 at the 2006 census. The study area shares border with Ila local government in the east, Boripe local government in the north, Osogbo local government in the west and Atakumosa local government in the south all in Osun state Nigeria. The major towns in the study area include; Ibokun (headquarter), Esa-Oke, Imesi Ile and Otan-Ile. The area has rainforest vegetation and rainfall of about 200cm per year. The set-up of the study area is mainly rural and the inhabitants are predominantly farmers who practice mixed cropping and mixed farming. Major livestock in the area include: goats, sheep, poultry, rabbits and pigs. The population of the study consists of livestock farmers in the area rearing small ruminant animals. A multi-stage sampling technique was used for the study. The local government area was stratified into towns and villages. Six villages were randomly selected in the local government area namely; Iponda, Ikinyinwa, Idominasi, Ilase, Ilahun and Ilare. Two communities were purposively selected from each of the villages as a result of the predominance of small ruminant production and ten respondents were then selected from each of the 12 community to give a sum of one hundred and twenty respondents. Primary data used for the study were collected through the administration of interview schedule tailored towards realizing the objectives of the study. Data were analysed using frequency counts, percentage, means and standard deviation, while chi square was used to draw inferences.
RESULTS AND DISCUSSION
Socioeconomic characteristics
Results in Table 1 reveal that higher proportion (60%) of the respondents were above 42years. The mean age was 50.7years ± 16.5. This shows that they will still be agile and have strength to take care of the animals. Age could also be of advantage in terms of experience on the use of endogenous knowledge. Larger proportion (88.3%) of the respondents were female. Females had time to take care of animals. Over one-third (40%) of the respondents had no formal education, 26.7% had primary education while 30% have secondary education. The level of education is expected to have influence on the use of endogenous knowledge. All the respondents were engaged in rearing of goat while only 38.3% engaged in rearing of sheep. They engaged in subsistence form of rearing and the mean of the flock size was 14.4 ± 6.1. The mean of the livestock farming experience was 17.3 ± 10.1 which indicates that majority of the respondents had longer experience of rearing small ruminants and by implication would have known how effective the use of endogenous knowledge are
in treating pests and diseases of goats and sheep, prompting them to either use it more or less.
Table 1: Socio-economic characteristics of the respondents Variables Freq Perc Parameters Age (years) < 22 2 1.7 Mean 23 – 42 46 28.3 =50.7± 16.5 43 – 62 34 28.3 63 – 82 38 31.7 Sex Male 14 11.7 Female 106 88.3 Marital
status
Single 4 3.3 Married 96 80.0 Divorced 4 3.3 Widowed 16 13.3 Educational
level
Non formal 48 40 Adult education
4 3.3
Primary 32 26.7 Secondary 36 30.0 Tertiary - - Livestock
reared
Goat 120 100 Sheep 36 38.3 Livestock
farming
experience
(years)
Less than 10 46 38.3 Mean 11 – 20 36 30.0 =17.3 ±10.1 21 – 30 24 20.0 31 – 40 12 10.0 41 – 50 2 1.7 Flock size 5 - 10 48 40.0 Mean 11 – 15 26 21.7 =14.4±6.11 16 – 20 32 26.7 21 -25 10 8.3 26 -30 2 1.7 31 – 35 2 1.7
Sources of information on endogenous
knowledge used in treating pests and diseases of
small ruminants
Table 2 shows that 85.0% of the respondents source of information on endogenous knowledge used was from family and relatives, followed by friends 74.2% while the least was obtained from printed materials and television respectively. This finding is in support of Fullas (2010) who observed that similar to traditional knowledge ethno-
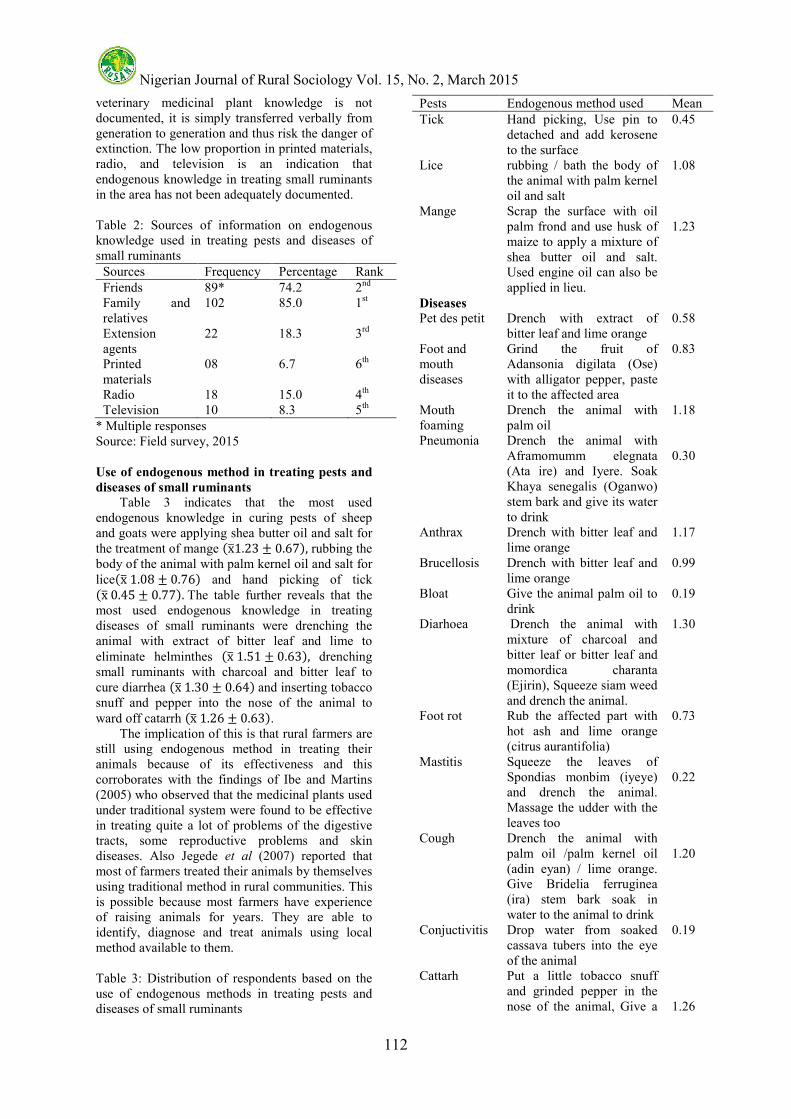
Nigerian Journal of Rural Sociology Vol. 15, No. 2, March 2015
112
veterinary medicinal plant knowledge is not documented, it is simply transferred verbally from generation to generation and thus risk the danger of extinction. The low proportion in printed materials, radio, and television is an indication that endogenous knowledge in treating small ruminants in the area has not been adequately documented.
Table 2: Sources of information on endogenous knowledge used in treating pests and diseases of small ruminants
Sources Frequency Percentage Rank Friends 89* 74.2 2nd Family and relatives
102 85.0 1st
Extension agents
22 18.3 3rd
Printed materials
08 6.7 6th
Radio 18 15.0 4th Television 10 8.3 5th
* Multiple responses Source: Field survey, 2015
Use of endogenous method in treating pests and
diseases of small ruminants
Table 3 indicates that the most used endogenous knowledge in curing pests of sheep and goats were applying shea butter oil and salt for the treatment of mange (x,1.23 ± 0.67), rubbing the body of the animal with palm kernel oil and salt for lice(x,1.08 ± 0.76) and hand picking of tick (x,0.45 ± 0.77).The table further reveals that the most used endogenous knowledge in treating diseases of small ruminants were drenching the animal with extract of bitter leaf and lime to eliminate helminthes (x,1.51 ± 0.63), drenching small ruminants with charcoal and bitter leaf to cure diarrhea (x,1.30 ± 0.64)and inserting tobacco snuff and pepper into the nose of the animal to ward off catarrh (x,1.26 ± 0.63). The implication of this is that rural farmers are still using endogenous method in treating their animals because of its effectiveness and this corroborates with the findings of Ibe and Martins (2005) who observed that the medicinal plants used under traditional system were found to be effective in treating quite a lot of problems of the digestive tracts, some reproductive problems and skin diseases. Also Jegede et al (2007) reported that most of farmers treated their animals by themselves using traditional method in rural communities. This is possible because most farmers have experience of raising animals for years. They are able to identify, diagnose and treat animals using local method available to them. Table 3: Distribution of respondents based on the use of endogenous methods in treating pests and diseases of small ruminants
Pests Endogenous method used Mean Tick Hand picking, Use pin to
detached and add kerosene to the surface
0.45
Lice rubbing / bath the body of the animal with palm kernel oil and salt
1.08
Mange Scrap the surface with oil palm frond and use husk of maize to apply a mixture of shea butter oil and salt. Used engine oil can also be applied in lieu.
1.23
Diseases Pet des petit Drench with extract of
bitter leaf and lime orange 0.58
Foot and mouth diseases
Grind the fruit of Adansonia digilata (Ose) with alligator pepper, paste it to the affected area
0.83
Mouth foaming
Drench the animal with palm oil
1.18
Pneumonia Drench the animal with Aframomumm elegnata (Ata ire) and Iyere. Soak Khaya senegalis (Oganwo) stem bark and give its water to drink
0.30
Anthrax Drench with bitter leaf and lime orange
1.17
Brucellosis Drench with bitter leaf and lime orange
0.99
Bloat Give the animal palm oil to drink
0.19
Diarhoea Drench the animal with mixture of charcoal and bitter leaf or bitter leaf and momordica charanta (Ejirin), Squeeze siam weed and drench the animal.
1.30
Foot rot Rub the affected part with hot ash and lime orange (citrus aurantifolia)
0.73
Mastitis Squeeze the leaves of Spondias monbim (iyeye) and drench the animal. Massage the udder with the leaves too
0.22
Cough Drench the animal with palm oil /palm kernel oil (adin eyan) / lime orange. Give Bridelia ferruginea (ira) stem bark soak in water to the animal to drink
1.20
Conjuctivitis Drop water from soaked cassava tubers into the eye of the animal
0.19
Cattarh Put a little tobacco snuff and grinded pepper in the nose of the animal, Give a
1.26
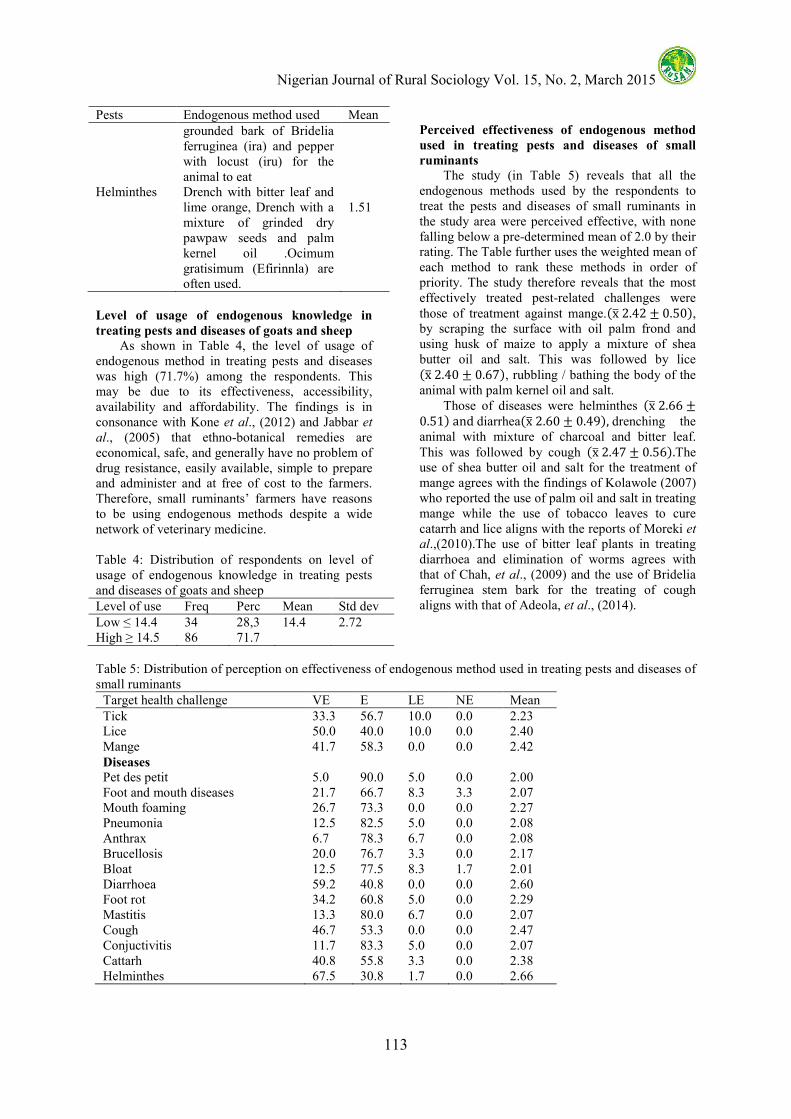
Nigerian Journal of Rural Sociology Vol. 15, No. 2, March 2015
113
Pests Endogenous method used Mean grounded bark of Bridelia ferruginea (ira) and pepper with locust (iru) for the animal to eat
Helminthes Drench with bitter leaf and lime orange, Drench with a mixture of grinded dry pawpaw seeds and palm kernel oil .Ocimum gratisimum (Efirinnla) are often used.
1.51
Level of usage of endogenous knowledge in
treating pests and diseases of goats and sheep
As shown in Table 4, the level of usage of endogenous method in treating pests and diseases was high (71.7%) among the respondents. This may be due to its effectiveness, accessibility, availability and affordability. The findings is in consonance with Kone et al., (2012) and Jabbar et
al., (2005) that ethno-botanical remedies are economical, safe, and generally have no problem of drug resistance, easily available, simple to prepare and administer and at free of cost to the farmers. Therefore, small ruminants’ farmers have reasons to be using endogenous methods despite a wide network of veterinary medicine.
Table 4: Distribution of respondents on level of usage of endogenous knowledge in treating pests and diseases of goats and sheep Level of use Freq Perc Mean Std dev Low ≤ 14.4 34 28,3 14.4 2.72 High ≥ 14.5 86 71.7
Perceived effectiveness of endogenous method
used in treating pests and diseases of small
ruminants
The study (in Table 5) reveals that all the endogenous methods used by the respondents to treat the pests and diseases of small ruminants in the study area were perceived effective, with none falling below a pre-determined mean of 2.0 by their rating. The Table further uses the weighted mean of each method to rank these methods in order of priority. The study therefore reveals that the most effectively treated pest-related challenges were those of treatment against mange.(x,2.42 ± 0.50), by scraping the surface with oil palm frond and using husk of maize to apply a mixture of shea butter oil and salt. This was followed by lice (x,2.40 ± 0.67), rubbling / bathing the body of the animal with palm kernel oil and salt. Those of diseases were helminthes (x,2.66 ±0.51)anddiarrhea(x,2.60 ± 0.49),drenching the animal with mixture of charcoal and bitter leaf. This was followed by cough (x,2.47 ± 0.56).The use of shea butter oil and salt for the treatment of mange agrees with the findings of Kolawole (2007) who reported the use of palm oil and salt in treating mange while the use of tobacco leaves to cure catarrh and lice aligns with the reports of Moreki et
al.,(2010).The use of bitter leaf plants in treating diarrhoea and elimination of worms agrees with that of Chah, et al., (2009) and the use of Bridelia ferruginea stem bark for the treating of cough aligns with that of Adeola, et al., (2014).
Table 5: Distribution of perception on effectiveness of endogenous method used in treating pests and diseases of small ruminants
Target health challenge VE E LE NE Mean Tick 33.3 56.7 10.0 0.0 2.23 Lice 50.0 40.0 10.0 0.0 2.40 Mange 41.7 58.3 0.0 0.0 2.42 Diseases Pet des petit 5.0 90.0 5.0 0.0 2.00 Foot and mouth diseases 21.7 66.7 8.3 3.3 2.07 Mouth foaming 26.7 73.3 0.0 0.0 2.27 Pneumonia 12.5 82.5 5.0 0.0 2.08 Anthrax 6.7 78.3 6.7 0.0 2.08 Brucellosis 20.0 76.7 3.3 0.0 2.17 Bloat 12.5 77.5 8.3 1.7 2.01 Diarrhoea 59.2 40.8 0.0 0.0 2.60 Foot rot 34.2 60.8 5.0 0.0 2.29 Mastitis 13.3 80.0 6.7 0.0 2.07 Cough 46.7 53.3 0.0 0.0 2.47 Conjuctivitis 11.7 83.3 5.0 0.0 2.07 Cattarh 40.8 55.8 3.3 0.0 2.38 Helminthes 67.5 30.8 1.7 0.0 2.66

Nigerian Journal of Rural Sociology Vol. 15, No. 2, March 2015
114
Categorisation of respondents based on
perceived effectiveness of endogenous method
used in treating small ruminants
Table 6 reveals that over half (56.7%) of the respondents perceived the endogenous method used in treating pests and diseases of ruminants as highly effective and this justifies the reasons why its level of usage was also high (71.7%) in the area of study. The finding agrees with that of Ogunlela (2007) who argued that most of the drugs that feature in pharmaceutical industry derive their origin from one or more plant products with different parts having uses in the treatment of human and animal ailments. Medicinal plants are thus best described as the bedrock of pharmaceutical industry. The rural livestock farmers are making use of their indigenous medicinal plants that have been tested and trusted in curing pests and diseases ravaging their farm animals. Plants contain antihelminthes, antimicrobials, acaricides, multivitamins, mineral supplements and anticoccidials thus its continuous usage in treating pests and diseases of animal.. Table 6: Distribution of perception scores of respondents on effectiveness of endogenous method used in treating small ruminants Level of effectiveness
Freq Perc Mean Std dev
Low (≤ 38.2) 52 43.3 38.2 2.23 High ( ≥ 38.3) 68 56.7
Socio-economic characteristics of the
respondents and level of use of endogenous
knowledge
Table 7 shows that there was no significant relationship between age, sex, educational level and level of use of endogenous knowledge. This implies that whether one is young or old, male or female, literate or non-literate does not affect the usage of endogenous knowledge in the study area. This may rather be a question of its accessibility, availability and affordability of these materials and services required.
Table 7: Chi-square analysis of relationship between socio economic characteristics of the respondents and levelof use of endogenous knowledge Variable X2 Df p - value Decision Remark Sex 0.267 1 0.411 Not Significant Accept null hypothesis Marital status 0.131 3 0.069 Not Significant Accept null hypothesis Educational level 0.222 3 0.118 Not Significant Accept null hypothesis
CONCLUSION AND RECOMMENDATIONS Based on the findings of the study the following conclusions were drawn: The respondents were in their productive age with a mean of 50.7. Larger proportion of the respondents were female with a mean flock size of 14.4.
Family, relatives and friends were the major sources of endogenous knowledge in treating pests and diseases of small ruminants and these endogenous knowledge were not adequately documented. The level of usage of endogenous method by the respondents as well as the perception of its effectiveness was high. Educational level, marital status and sex did not significantly affect the level of usage of endogenous methods in treating pests and diseases of small ruminants. The study therefore recommended that endogenous knowledge must be well documented and centers for alternative medicine should be established in each state of the federation. Exchange of knowledge on endogenous methods should be encouraged by extension agents through their programmes and incorporated into preventive and curative medicine for ease of passage from generation to generation in order to prevent it from going into extinction.
REFERENCES Adeola, A.O., Adewole, S.O. and Olofintoye, L.K.
2012. Studies on Ethno-veterinary Practice in Ruminants in Ekiti State Nigeria. Research Journal of Agriculture and Environmental Management. 3 (12):632 -645.
Ajala, M.K. and Adesehinwa, A.O.K. 2008. Analysis of Pig Marketing in Zango-Kataf of Local Government Area of Kaduna State Nigeria. Nigeria Tropicultura 26: 229 – 239.
Chah, J.M, Igbokwe,E.M. and K.F. Chah 2009.Ethno-Veterinary Medicine Used in Small Ruminant Health in the Eastern Guinea Savannah Nigeria. Nigeria Livestock Research For Rural Development 21 (12)
Fabusoro, E., Lawal-Adebowale, O.A. and Akinloye, A.K. 2007. A Study of Rural Livestock Farmers’ Patronage of Veterinary Services for Health Care of Small Farm Animals in OgunState.Nigerian Journal of Animal Production. 34 (1): 132 – 138.
Fullas, F. 2010. Ethiopian Medicinal Plants in Veterinary Health Care: A mini review. Ee – JRIF 2 (1): 48 – 58.
Ibe, A.E.,Martin, I.N. 2005. Identification, Collection and Domestication of Medicinal Plants in Southeastern Nigeria. Federal University of Technology Owerri,Imo State, Council for the Development of Social Science Research in Africa.
Jabbar, A., Akttar, M.S..Muhammad, G., Lateef, M., 2005. Possible role of Ethnoveterinary Medicine in Poverty Reduction in

Nigerian Journal of Rural Sociology Vol. 15, No. 2, March 2015
115
Pakistan: Use of Botanical Antihhelminthic as an Example. Journal of Agriculture and Social Sciences, 1: 187 – 195.
Jegede, O.Bolorunduro, P., and Ikani, E. Levels of Awareness and Adoption of Disseminated Livestock Technologies in Enugu State, Nigeria. Journal of Food Agriculture and Environment. 5(2), 185 – 189.
Kogsey, I.S. 2004. Breeding objectives and Breeding Strategies of Small Ruminants in the Tropics. Ph.D Thesis, Wageningen University, The Netherlands, Pp.272.
Kolawole, O.D., Okorie, V.O., Ogidiowa, M.T., Adeogun, M.O. 2007.Ethnoveterinary Practices Among Small-holder Farmers in Ekiti State Nigeria. Afr. J. Trad. Complement Altern. Medicine. 4 (4): 432 – 442.
Kone, M.M.,Vargeas, M., Keiser, J,.2012. Antihelmintic Activity of Medicinal Plants Used in Cote d’Ivoire for Treating
Parasitic Diseases.Parasitology Research.1101: 2351 – 2362.
Moreki, J.C., Poroga, B., Dikeme, R. and Sebo, D. 2010. Ethnoveterinary Medicine and Health Management in Poultry in South-western District Bostwana. Livestock Reseach for Rural Development 22 (6)
Ogunlela, V.B., 2007. Medicinal Plants in Agriculture.: The Nigerian Experience. In Husbandry and Cultivation of Medicinal Plants. Proceedings of the Akure Humboldt Kellog 3rd SAAT Annual Conference. Onibi, G.E., Agele,S.O., Adekunle, V.A.J., Olufayo, M.O., (Eds). Pp15 – 21.
Oluwafemi, R.A. 2009. Cattle Production and Marketing in Nigeria: The Impact of Diseases. A Case Study of Maiakuya, Assakio and Shinge Cattle Markets in Lafia Local Government Area of Nasarawa State.The International Journal of Veterinary Medicine Vol.6 (1).

Nigerian Journal of Rural Sociology Vol. 15, No. 2, March 2015
116
UTILISATION OF ACCESS TO GLOBAL ONLINE RESEARH IN AGRICULTURE (AGORA) BY
FINAL YEAR UNDERGRADUATE STUDENTS OF THE FACULTY OF AGRICULTURE AND
FORESTRY, UNIVERSITY OF IBADAN, NIGERIA
Badiru, I. O., Fawole, O. P. and Nkwocha, C. A. Department of Agricultural Extension and Rural Development, University of Ibadan, Nigeria
E-mail: [email protected] ABSTRACT
This study investigated the utilisation of Access to Global On-line Research in Agriculture (AGORA) by final
year undergraduate students of the Faculty of Agriculture and Forestry, University of Ibadan. A total of 140
respondents were selected from the eight departments in the faculty using simple random sampling technique.
Data collection was done using a structured questionnaire and the data were analysed using both descriptive
(frequency, percentage, means) and inferential statistics (Chi-square and PPMC) at P=0.05. The results
revealed that 52.1% of the respondents were female, 90% were single, 97.1% were computer literate and the
mean age of the respondents was 24 years. About 67.1% had high level of awareness on AGORA. Constraints to
the use of AGORA identified included irregular power supply (64.3%), limited access to AGORA password
(52.8%), and lack of awareness (49.3%). Significant relationship existed between level of awareness and use of
AGORA (r= 0.334; p = 0.05). There was no significant relationship between constraint and utilisation of
AGORA (χ2 = 3.334; p > 0.05). Hence, there is a need for increased publicity in order to encourage attitudinal
change and improve the utilisation of AGORA by the students.
Keywords: AGORA, online research, utilisation of AGORA.
INTRODUCTION
The reliance on electronic library resources have been on the increase in recent times because many journals and academic resources are now being digitized for easy accessibility by students and researchers in developed countries of the world (Nicholas and Huntington, 2006). This trend may not abate anytime soon as we are now in a digital world, hence the need to further strengthen it. However, there is a problem of under-utilisation of scholarly electronic journals in higher learning institutions especially in developing countries. Oyedapo and Ojo (2013) in a study on the use of electronic resources in Obafemi Awolowo University observed very low usage of electronic journal resources by students. The major reason that contributed to low utilisation of electronic resources was limited searching skills of students and researchers (Oyesika and Oduwole, 2004). According to Manda (2005) other factors leading to underutilisation of electronic resources includes lack of access to internet connected computers; low internet bandwidth and unreliable power supply. Manda and Mukangara (2007) in a study on gender analysis of use of electronic resources, also observed low usage of electronic scholarly journal databases. They however observed that most students and researchers preferred to use the Google search engine. Rahman and Ramzy (2004) and Kiondo (2007) concurred with these findings and maintained that the efficient use of electronic library resources can only be achieved if these challenges are addressed. The Access to Global Online Research in Agriculture (AGORA) project was designed to enrich the research capabilities of students and to increase the quality of research done. AGORA grants member institutions free low cost access to major scientific journals in agriculture and other
related discipline. It was launched in October 2003 and provides access to more than 3500 key journals and 3300 books from the world’s leading academic publishers to 2500 institutions in 116 countries. The Faculty of Agriculture and Forestry, University of Ibadan is one of the beneficiaries of the project. The components of AGORA will help to keep students updated and well informed about current research works in the field of agriculture, which can help avoid using old references and also build the writing and research skills of the students. Hence, her students are expected to benefit immensely from the project. However, students tend to still use materials (journals, articles, etc.) in the library which may be outdated thus limiting them to cite old references in their literature review. Since the launch of the project in University of Ibadan, there has not been much research effort on assessing its utilisation by the target population, hence the study.
METHODOLOGY
The population of the study consists of all the final year students in the eight departments of the -Faculty of Agriculture and Forestry, University of Ibadan. The total population of the final year students of the faculty is 301. Simple random sampling technique was used to select 50% of the students’ population which gave a total number of one hundred and fifty one (151) respondents to which questionnaires were administered, out of which only 140 respondents returned useful information, representing (92.7%) return rate. The -structured questionnaire was used to collect information on personal characteristics, level of awareness, attitude, constraints and utilisation of AGORA. Utilisation of AGORA which is the dependent variable was measured using a three point scale of regularly, occasionally and never.
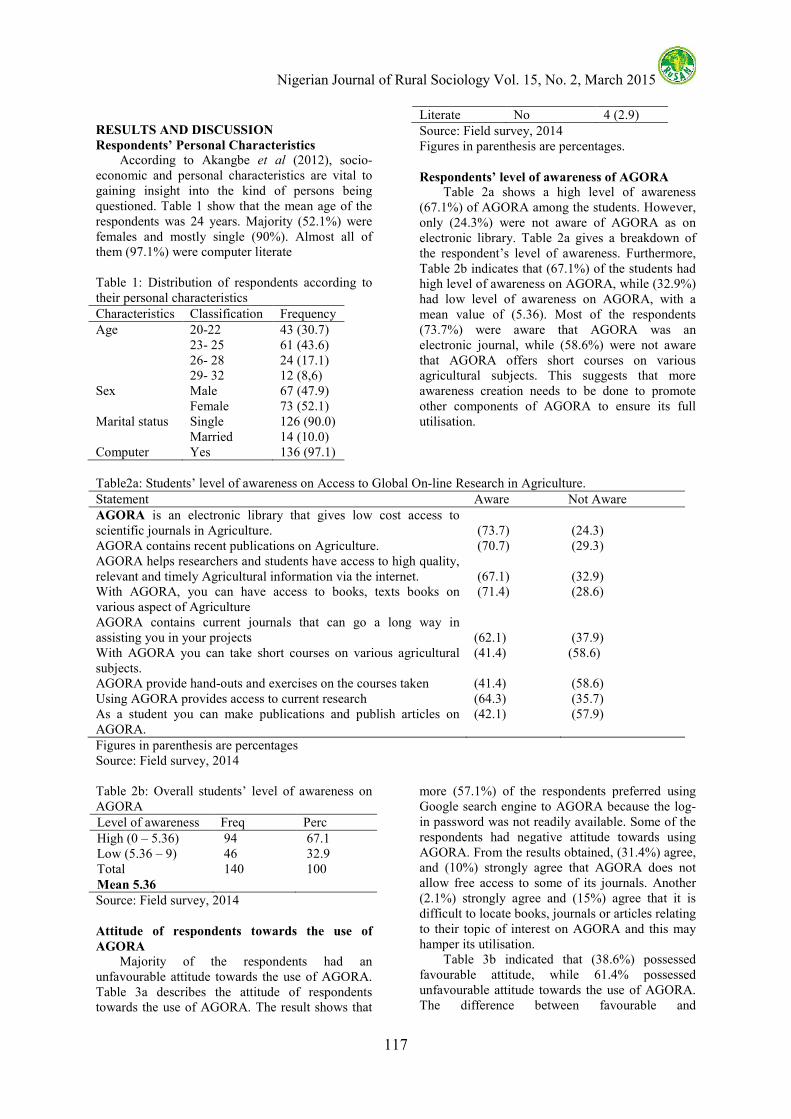
Nigerian Journal of Rural Sociology Vol. 15, No. 2, March 2015
117
RESULTS AND DISCUSSION
Respondents’ Personal Characteristics
According to Akangbe et al (2012), socio-economic and personal characteristics are vital to gaining insight into the kind of persons being questioned. Table 1 show that the mean age of the respondents was 24 years. Majority (52.1%) were females and mostly single (90%). Almost all of them (97.1%) were computer literate
Table 1: Distribution of respondents according to their personal characteristics Characteristics Classification Frequency Age 20-22
23- 25 26- 28 29- 32
43 (30.7) 61 (43.6) 24 (17.1) 12 (8,6)
Sex Male Female
67 (47.9) 73 (52.1)
Marital status Single Married
126 (90.0) 14 (10.0)
Computer Yes 136 (97.1)
Literate No 4 (2.9) Source: Field survey, 2014 Figures in parenthesis are percentages. Respondents’ level of awareness of AGORA
Table 2a shows a high level of awareness (67.1%) of AGORA among the students. However, only (24.3%) were not aware of AGORA as on electronic library. Table 2a gives a breakdown of the respondent’s level of awareness. Furthermore, Table 2b indicates that (67.1%) of the students had high level of awareness on AGORA, while (32.9%) had low level of awareness on AGORA, with a mean value of (5.36). Most of the respondents (73.7%) were aware that AGORA was an electronic journal, while (58.6%) were not aware that AGORA offers short courses on various agricultural subjects. This suggests that more awareness creation needs to be done to promote other components of AGORA to ensure its full utilisation.
Table2a: Students’ level of awareness on Access to Global On-line Research in Agriculture. Statement Aware Not Aware AGORA is an electronic library that gives low cost access to scientific journals in Agriculture.
(73.7)
(24.3)
AGORA contains recent publications on Agriculture. (70.7) (29.3) AGORA helps researchers and students have access to high quality, relevant and timely Agricultural information via the internet.
(67.1)
(32.9)
With AGORA, you can have access to books, texts books on various aspect of Agriculture
(71.4) (28.6)
AGORA contains current journals that can go a long way in assisting you in your projects
(62.1)
(37.9)
With AGORA you can take short courses on various agricultural subjects.
(41.4) (58.6)
AGORA provide hand-outs and exercises on the courses taken (41.4) (58.6) Using AGORA provides access to current research (64.3) (35.7) As a student you can make publications and publish articles on AGORA.
(42.1) (57.9)
Figures in parenthesis are percentages Source: Field survey, 2014 Table 2b: Overall students’ level of awareness on AGORA Level of awareness Freq Perc High (0 – 5.36) Low (5.36 – 9) Total Mean 5.36
94 46 140
67.1 32.9 100
Source: Field survey, 2014
Attitude of respondents towards the use of
AGORA
Majority of the respondents had an unfavourable attitude towards the use of AGORA. Table 3a describes the attitude of respondents towards the use of AGORA. The result shows that
more (57.1%) of the respondents preferred using Google search engine to AGORA because the log-in password was not readily available. Some of the respondents had negative attitude towards using AGORA. From the results obtained, (31.4%) agree, and (10%) strongly agree that AGORA does not allow free access to some of its journals. Another (2.1%) strongly agree and (15%) agree that it is difficult to locate books, journals or articles relating to their topic of interest on AGORA and this may hamper its utilisation. Table 3b indicated that (38.6%) possessed favourable attitude, while 61.4% possessed unfavourable attitude towards the use of AGORA. The difference between favourable and

Nigerian Journal of Rural Sociology Vol. 15, No. 2, March 2015
118
unfavourable is large, which suggests that the respondents are varied in their attitude to the use of AGORA, while the mean value was (64.7). The difference in attitude may suggest the need for
increased publicity in order to encourage attitudinal change towards the use of AGORA as the attitude of the students may have a high impact on the utilisation of AGORA by the students.
Table 3a: Attitude of respondents to using AGORA Attitudinal Statement
Strongly Agree
Agree
Undecided
Disagree
Strongly Disagree
Using AGORA journals is very tedious and time consuming
5 (3.6) 38 (27.1) 72 (51.4) 17 (12.1) 8 (5.7)
I prefer using GOOGLE search to using AGORA for my research
58 (41.4)
45 (32.1) 25 (17.9) 6 (4.3) 6 (4.3)
I do not use AGORA because it requires login password.
25 (17.9) 36 (25.7) 55 (39.3) 14 (10.0) 10 (7.1)
I do not use AGORA because I have no knowledge about how it works.
19 (13.6) 35 (25.0) 42 (30.0) 33 (23.6) 11 (7.9)
Getting journals on AGORA requires me having proper orientation on how to use it.
26 (18.6) 58 (41.4) 44 (31.4) 7 (5.0) 5 (3.6)
AGORA does not allow full access to some of its journals.
14(10.0 44(31.4) 71 (50.7) 5 (3.6) 6 (4.3)
I find it difficult to locate books or journals relating to my topic of interest on AGORA.
3 (2.1) 21 (15.0) 78 (55.7) 35 (25.0) 3 (2.1)
I experience irrelevant search results while using AGORA.
5 (3). 31 (22.1) 70 (50.0) 28 (20.0) 6 (4.3)
I need to be computer literate and have stable network before I can access AGORA
23 (16.4) 62 (44.3) 45 (32.1) 5 (3.6) 5 (3.6)
Downloading and uploading articles, journals or a publication on AGORA is very fast and easy.
10 (7.1) 36 (25.7) 80 (57.1) 12 (8.6) 2 (1.4)
AGORA is user friendly, easy to use and saves time.
12 (8.6) 40 (28.6) 74 (52.9) 13 (9.3) 1 (0.7)
With the login password I have a full access to all the components of AGORA.
28 (20.0) 80 (57.1) 27 (19.3) 4 (2.9) 1 (0.7)
The login password is easily accessible and simple
7 (5.0) 29 (20.7) 69 (49.3) 30 (21.4) 5 (3.6)
With a proper orientation on AGORA, working on the site is very easy and convenient
11 (7.9) 56 (40.0) 63 (45.0) 9 (6.4) 1 (0.7)
AGORA saves me the strength of moving from shelf to shelf in search of journals or books in the library.
17 (12.1) 53 (37.9) 58 (41.4) 9 (6.4) 3 (2.1)
I do not need orientation to work on AGORA because it is user friendly.
8 (5.7) 27 (19.3) 67 (47.9) 26 (18.6) 12 (8.6)
Getting journals or books relating to my topic of interest is very convenient and easy using AGORA
11 (7.9) 41 (29.3) 73 (52.1) 13 (9.3) 2 (1.4)
I do not need to be a computer literate to use AGORA.
5 (3.6)
25 (17.9)
52 (37.1)
36 (25.7)
22 (15.7)
Network strength does not affect the use of AGORA
7 (5.0)
16 (11.4)
65 (46.4)
42 (30.0)
10 (7.1)
Downloading or uploading articles on AGORA is very slow and tedious
4 (2.9)
19 (13.6)
91 (65.0)
22 (15.7)
4 (2.9)
Figures in parenthesis are percentages Source: Field survey, 2014

Nigerian Journal of Rural Sociology Vol. 15, No. 2, March 2015
119
Table 3b: Overall students’ attitude towards using AGORA Attitude Freq Perc Favourable (49 – 64.7) 54 38.6 Unfavourable (64.8– 88) 86 61.4 Total 140 100 Mean 64.7 Source: Field survey, 2014
Constraints to the use of AGORA Results in Table 4a revealed that irregular power supply was the most severe constraint
(64.3%), followed by lack of proper orientation of students on the use of AGORA (55.0%). Lack of awareness about AGORA (19.3%) is not a serious constraint since utilisation only comes with awareness. The university needs to take some practical steps by organising seminars and training workshops to orientate the students on how to use AGORA and also solve the problem of irregular power supply.
Table 4a: Constraint encountered in the utilisation of AGORA by the students Constraints Severe Mild Not Mean AGORA access is password protected 74 (52.8) 49 (35.0) 17 (12.1) 1.4 Lack of awareness about AGORA 69 (49.3) 44 (31.4) 27(19.3) 1.3 Lack of orientation for students 77 (55.0) 44 (31.4) 19 (13.6) 1.4 Network fluctuation 74 (52.9) 52 (37.1) 14 (10.0) 1.4 Irregular power supply 90 (64.3) 35 (25.0) 15 (10.7) 1.5 Irrelevant search results 45 (32.1) 74 (53.5) 20 (14.3) 1.2 Figures in parenthesis are percentages Source: Field survey, 2014
Utilisation of AGORA
Results in Table 5a reveal that (57.9%) of the respondents have never searched for journals on AGORA. Only (4.3%) have published on AGORA and this is a source of concern as majority (80.7%) have never participated in any group discussion on AGORA, signifying under utilisation of AGORA by the students in the study area. Lack of proper awareness on other uses of AGORA could have been the reason for the limited use of its components. More awareness creation on the components of AGORA should be done to encourage full utilisation.
Table 5b reveal that (40%) of the respondents have used AGORA, while (60%) have low utilisation of the components of AGORA, with mean value being 1.4. This implies that there is low utilisation of AGORA components, and the difference in utilisation may suggest the need for improvement on AGORA in order to encourage its use. This low utilisation could also be as a result of some constraints like epileptic power supply and unavailability of AGORA password. If these constraints are properly addressed, perhaps utilisation could increase significantly.
Table 5a: Frequency of utilisation of AGORA by the students Components Regularly Occasionally Never Mean Search AGORA journals 8 (5.7) 51 (36.4) 81 (57.9) 0.48 Take AGORA short course 4 (2.9) 29 (20.7) 107 (76.4) 0.26 Attempt exercises on AGORA 3 (2.1) 32 (22.9) 105 (75.0) 0.27 Read AGORA hand outs 6 (4.3) 49 (35.0) 85 (60.7) 0.44 Participate in group discussions on AGORA 2 (1.4) 25 (17.9) 113 (80.7) 0.20 Watch presentations published on AGORA 6 (4.3) 40 (28.6) 94 (67.1) 0.37 Figures in parenthesis are percentages. Source: Field survey, 2014
Table 5b: Overall students’ utilisation of AGORA Utilisation Frequency Percentage High (0 -1.4) 56 40 Low (1.4 – 11) 84 60 Total 104 100 Mean 1.4 Source: Field survey, 2014
Relationship between personal characteristics
and utilisation of AGORA
From the PPMC and Chi-square results in Table 6, there exists a direct relationship among the variables. Age had a significant relationship with the utilisation of AGORA. This implies that the age of the respondents affect the utilisation of AGORA. The younger they are, the more they are likely to utilise AGORA, and vice versa.

Nigerian Journal of Rural Sociology Vol. 15, No. 2, March 2015
120
Table 6: PPMC and Chi-square table showing the relationship between selected personal characteristics of students and utilisation of AGORA Variables r df X2 P
value Decision
Age 0.306 0.002 Significant Sex 1 2.104 0.147 Not
significant Marital status
1 0.053 0.818 Not significant
Computer literacy
1 0.386 0.534 Not significant
Writing project
2 1.875 0.392 Not significant
The PPMC results on Table 7 show that there is a significant relationship between the level of awareness of the students on AGORA and its utilisation. (r = 0.244; P = 0.05). This is understandable as utilisation only comes with awareness. Therefore, more awareness creation needs to be done to improve the utilisation of AGORA. Also, there is a significant relationship between the attitude of the students towards the utilisation of AGORA at p = 0.05 level of significance. This implies that respondents with favourable attitude towards the use of AGORA will have a high level of utilisation; therefore respondents should be encouraged to develop a favourable attitude towards the use of AGORA.
Table 7: Relationship between awareness and attitude with utilisation of AGORA Variable r-value P-value Decision Awareness 0.334 0.000 Significant Attitude 0.244 0.003 Significant *Significant, P < 0.05 r = PPMC value CONCLUSION AND RECOMMENDATIONS
The utilisation of AGORA by the respondents was low, despite their high level of awareness. This is because of the numerous constraints like irregular power supply they encounter in utilising AGORA, which resulted in an unfavourable attitude towards its use. Since users complain of unstable electricity supply, which discourages them from using AGORA, stable electricity supply should be provided. The AGORA password should be made readily available and easily accessible to the students.
REFERENCES
Akangbe, J. A., Ogunyinka, W., Ayanda, I. F., Achem, B. and Adisa, R. S. (2012). An assessment of effects of fadama II project on livelihood of farmers in Orire local government area of Oyo state, Nigeria.
Nigerian journal of Agriculture. Food and
Environment. 8(1), pp 27-32. Fasiola, O. S. (2013). Use of Electronic Resources
in a Private University in Nigeria: Awareness and Constraints. African Journals Online, (AJOL). Vol 10, No 2
Kiondo, E (2004), An Assessment of Levels of IT Investments, Electronic Information Literacy Skills of Users at the University of Dar Es Salaam, A Paper Presented at the Sixth Standing Conference of African National and University Libraries in Eastern, Central and Southern Africa, Kampala, 2nd- 4th July 2004, pp 6-9
Manda, P. A (2005), “Electronic Resource Usage in Academic and Research Institutions in Tanzania”, Information Development, Vol. 21, No. 4, pp 24-32.
Manda, P. A. and Mukangara, F (2007), “Gender Analysis of Electronic Information Resource Use: The Case of the University of Dar Es Salaam, Tanzania”, Library Journal, University of Dar Es Salaam, Vol. 9, No. 1, pp 7-9
Nicholas, D and Paul Huntington, P. (2006) "Electronic journals: are they really used?" Interlending & Document Supply, Vol. 34 Iss: 2, pp.74 – 77.
Oyedapo, R.O. and Ojo, R.A. (2013). A survey of the use of electronic resources in Hezekiah Oluwasanm Library, Obafemi Awolowo University, Ile-Ife, Nigeria. Library
Philosophy and Practice (e-journal), http://digitalcommons.unl.edu/libphilprac/884, retrieved on 26th January, 2014, 4.36am.
Oyesika and Oduwole (2004) Library Use in Distance Learning: A Survey of Undergraduates in three Nigerian Universities. African Journal of Library
Archives and Information Science 14 (2), pp 167-176.
Rehman, U. S and Ramzy, V (2004), “Awareness and Use of Electronic Information Resources at the Health Sciences Center of Kuwait University”, Library Review, Vol. 53, No. 3, pp 150- 156