NIGERIA: Rapid Assessment and Gap Analysis … · experiences acute energy crisis. Access to modern...
32
NIGERIA: Rapid Assessment and Gap Analysis OBJECTIVE The purpose of Rapid Assessment and Gap Analysis is to provide: A quick brief look of the energy situation in (Section 1) within the context of its economic and social development and poverty eradication. A good review of where the country is in terms of the three SE4ALL goals (Section 2), and A good estimate of the main challenges and opportunities vis-à-vis the three goals of SE4ALL where the major investments, policies and enabling environments will be required (Section 3) EXECUTIVE SUMMARY Nigeria is endowed with almost all energy types, with Oil and gas being the most prominent. Despite its large oil reserves, (the 10th largest in the world) and a massive natural gas reserve at about 187tcf (the 7th largest in the world) with potential to grow to as much as 600tcf, Nigeria still experiences acute energy crisis. Access to modern energy services in Nigeria is very low, with only about 40% of its 168 million people having access to electricity on meagre 150kWh average electricity consumption per capita. More than 15 million households do not have electricity and more than 67% of the population are dependent on biomass as primary source of energy. The situation is exacerbated by the nation’s heavy reliance on the oil sector as the mainstay of the economy, which accounts for about 95%(World Bank) of the export earnings and about 85% of the government’s revenues (IEA). Other factors responsible for this low energy access are lack of clear policy and legal framework that incentivise the private sector investments in the energy sector, weak institutions and outright corruption. Taking cognizance of that, the National Energy Policy (NEP) 2003 is aimed at creating “an energy economy in which modern renewable energy increases its share of energy consumed, and provides affordable access to energy throughout Nigeria, thus contributing to sustainable development and environmental conservation”. The Federal Government through the Energy Commission of Nigeria (ECN) recognizes energy efficiency and conservation measures as a key element in the nation’s efforts to reduce the imbalance between energy supply and demand. In fact, one of the main objectives of the National Energy Policy (NEP) of Nigeria is to guarantee an efficient and cost effective consumption of energy resources; and to ensure the importation and manufacture of the most energy-efficient equipment and machinery, as well as promoting public awareness about the benefits of improved energy efficiency. Specific energy efficiency activities in Nigeria include: 1 Million High Quality Compact Fluorescent Lamps (CFL) Pilot Project on the Replacement of Incandescent Lamps; National Awareness Creation/Capacity Building; Energy Efficiency Awareness Campaign through Posters, leaflets, handbills, radio, TV displays; Energy Efficiency and Conservation Programs in Industries; National Program on Capacity Building and Networking for Improved Energy Efficiency in Nigerian Industries; Establishment of the National Centre on Energy Efficiency and Conservation in
Transcript of NIGERIA: Rapid Assessment and Gap Analysis … · experiences acute energy crisis. Access to modern...

NIGERIA: Rapid Assessment and Gap Analysis OBJECTIVE
The purpose of Rapid Assessment and Gap Analysis is to provide: A quick brief look of the energy situation in (Section 1) within the context of its economic
and social development and poverty eradication. A good review of where the country is in terms of the three SE4ALL goals (Section 2), and A good estimate of the main challenges and opportunities vis-à-vis the three goals of
SE4ALL where the major investments, policies and enabling environments will be required (Section 3)
EXECUTIVE SUMMARY
Nigeria is endowed with almost all energy types, with Oil and gas being the most prominent. Despite its large oil reserves, (the 10th largest in the world) and a massive natural gas reserve at about 187tcf (the 7th largest in the world) with potential to grow to as much as 600tcf, Nigeria still experiences acute energy crisis. Access to modern energy services in Nigeria is very low, with only about 40% of its 168 million people having access to electricity on meagre 150kWh average electricity consumption per capita. More than 15 million households do not have electricity and more than 67% of the population are dependent on biomass as primary source of energy. The situation is exacerbated by the nation’s heavy reliance on the oil sector as the mainstay of the economy, which accounts for about 95%(World Bank) of the export earnings and about 85% of the government’s revenues (IEA). Other factors responsible for this low energy access are lack of clear policy and legal framework that incentivise the private sector investments in the energy sector, weak institutions and outright corruption. Taking cognizance of that, the National Energy Policy (NEP) 2003 is aimed at creating “an energy economy in which modern renewable energy increases its share of energy consumed, and provides affordable access to energy throughout Nigeria, thus contributing to sustainable development and environmental conservation”. The Federal Government through the Energy Commission of Nigeria (ECN) recognizes energy efficiency and conservation measures as a key element in the nation’s efforts to reduce the imbalance between energy supply and demand. In fact, one of the main objectives of the National Energy Policy (NEP) of Nigeria is to guarantee an efficient and cost effective consumption of energy resources; and to ensure the importation and manufacture of the most energy-efficient equipment and machinery, as well as promoting public awareness about the benefits of improved energy efficiency. Specific energy efficiency activities in Nigeria include: 1 Million High Quality Compact Fluorescent Lamps (CFL) Pilot Project on the Replacement of Incandescent Lamps; National Awareness Creation/Capacity Building; Energy Efficiency Awareness Campaign through Posters, leaflets, handbills, radio, TV displays; Energy Efficiency and Conservation Programs in Industries; National Program on Capacity Building and Networking for Improved Energy Efficiency in Nigerian Industries; Establishment of the National Centre on Energy Efficiency and Conservation in

2
University of Lagos and the on-going UNDP/GEF/ECN Project on Promoting Energy Efficiency in Residential and Public Building To enhance access to modern energy services and increase private sector participation, the Federal Government embarked on a number of initiatives and reforms which include the deregulation of the power sector by the passage of the Electric Power Sector Reform (EPSR) Act 2005 to govern the generation, transmission, distribution, supply of electricity and encourage private sector participation. Furthermore, a Roadmap for Power Sector Reform was launched in 2010 as the implementation plan for the reform to ensure full private sector participation in power delivery. The Federal Government also launched a national economic transformation blueprint in the Vision 20:2020 in a bid to making Nigeria one of the top twenty economies by 2020.The overarching objective of the government’s vision is to ensure that the power sector is able to efficiently deliver “sustainable adequate, qualitative, reliable and affordable power in a deregulated market”. According to the document, Nigeria aspires to generate up to 35,000MW by 2020 through combine investments of the public and Independent Power Producers (IPPs) in addition to the existing large hydro plants, coal-fired plants and other renewable energy sources. In an attempt to achieve this, about 60 (IPPs) have so far been licensed by the Nigerian Electricity Regulatory Commission (NERC) for power hydro and thermal projects and a feed-in tariff regime established effective from July 1, 2012. A Nigeria Gas Master Plan was launched with the aim of exploiting the potential for gas to promote rapid economic development and enhance Nigeria’s competitiveness in the gas market. In doing this, it hopes to rapidly expand the domestic market that will include gas-to-power, methanol, liquid petroleum gas (LPG),consolidate Nigeria’s regional position in the West African Gas Pipeline (WAGP) and increase export of liquefied natural gas (LNG)*. Public sector funding mostly from national budget has been the major source of investment in the energy sector. Between 1999-2007,government has been said to invest more than $16billion in the generation of electricity*, alone which actually peaked in 2007 when government appropriated about 1,127.87 billion naira representing 22.12 of the annual budget. Even though there has not been any rise in percentage ratio, the amount budgeted for 2010 significantly increased to 1,702.78billion naira representing 8.78% of the year’s annual budget*. With regards to doubling the share of renewable energy in the national energy mix, the ECN developed the Renewable Energy Master Plan (REMP) to complement the NEP, which reiterated government’s pledge to support the development, demonstration and implementation of renewable energy technologies (RETs) for both small and large applications. The REMP aims at 10% RE contribution to the national energy mix by 2030 through the adoption of a renewable portfolio standard, creation of innovative fiscal and market incentives to grow renewable energy industries and preferential customs duty exemptions for imported renewable energy technology components. However, not very much progress has been made in the implementation of the REMP nor has it been passed as law by the parliament. The REMP is currently being subjected to a review with likelihood of setting new targets. Nigeria’s key challenges in delivery of energy services can be summed up as follows: Low investments in a range of small scale decentralized power generation plants (based on renewable resources or natural gas), which could provide viable long-term solutions for Nigeria’s energy needs, particularly for low-income markets; Lack of transparency and issue of deep-rooted corruption. Government’s huge investment in the energy sector can hardly be fully accounted for and with very little to show; Absence of, or insufficient deployment of energy efficient technologies for rural household uses to reduce reliance on biomass for cooking; Lack of clarity in the management and utilization of gas for domestic purposes and coordination in gas supply; and

3
Government’s continued locked in a large carbon intensive energy plants as against small scale, off-grid renewable sources of energy.
Nigeria’s current energy challenge presents government an opportunity to pursue its economic growth agenda at a low carbon trajectory with minimal incremental cost. It also provides opportunities to create green jobs, enhance energy efficiency through appropriate energy labelling regulations and sustainably exploit its abundant renewable energy resources. Addressing these challenges will increase energy access, reduce the pervasive poverty across the countryand enhance standards of livelihoods with low health risks. Section I: Introduction 1.1 COUNTRY OVERVIEW
Nigeria is located in West Africa on the Gulf of Guinea between Benin and Cameroon. It has an area of 923,768 square kilometers, including about 13,000 square kilometers of water. Nigeria shares borders with Cameroon (1,690 kilometers) in the east, Chad (87 kilometers) in the northeast, Niger (1,497 kilometers) in the north, and Benin (773 kilometers) in the west.
Nigeria’s primary natural resources consist of natural gas, petroleum, tin, iron ore, coal, limestone, niobium, lead, and zinc. Nigeria has proven oil reserves of 36.2 billion barrels, the tenth largest reserves in the world. Proven natural gas reserves are estimated at 187 trillion cubic feet, the seventh largest reserves in the world and the largest in Africa. Estimates for oil and natural gas reserves are as of January 2007. 1. BASIC SOCIO-ECONOMIC DATA Population: As of mid-2010, Nigeria’s population was estimated at 163 million, and the annual population growth rate has been steady at about 2.5 percent. Provisional results of the 2006 census indicate a total population of 140 million. Nigeria’s overall population density in 2006 was about 139 people per square kilometer. Much of the population is concentrated along the coast and in the north around Kano. Although Nigeria is slightly below average for the level of urbanization (about 45 percent), it nevertheless has one of the world’s highest urbanization rates: an estimated 5.3 percent per year. The estimated net migration rate in 2008 was 0.25 migrants per 1,000 people. Demographic parameter 2005 2010 (est.) Total Population (million) 137.49 163.4 Population Growth rate (%) 3.16 3.52 Urban Population (million) 55.00 75.19 Urban Population share (%) 40 46 Potential labor force (million) 92.94 110.82 Actual labor force (million) 74.35 88.86 Number of persons per household 5.8 5.6 Source: NBS, ECN Report,
Key Economic Sectors

4
Figure 2: Sectoral Contributions to GDP (2010 – 2011)
(SOURCE: NBS Economic Outlook 2012-2015 Report)
Figure 2 above shows the key economic sectors in Nigeria and their percentage contribution to GDP in 2010 and 2011. In 2011, the largest sectoral contributors were recorded by agriculture comprising 40.24% to the economy, followed by wholesale & retail trade with 19.38% and crude oil and natural gas contributing 14.71%, the three sectors making up over 70% of the nation’s GDP in 2011. The contribution from the crude oil and natural gas sector was down by 1.17 percentage points in 2011 compared with 2010, while the agricultural contribution was down by 0.63 percentage points. In contrast, the wholesale and retail trade contribution to the economy increased by 0.69 percentage points from 2010 to 19.38 percent in 2011. Another notable sector with higher contributions in 2011 compared to 2010 was the Telecommunications & Post sector. Other sectors including Manufacturing, Solid minerals, Hotels & Restaurants, Building and Construction, Real Estate, as well as Business & other services also recorded marginal increases in sectoral contributions to GDP in 2011. Nevertheless, these increases were not sufficient to offset the declines in agriculture, crude petroleum & natural gas, and finance & insurance sectors, hence the marginal decline in real GDP growth in 2011. . (NBS 2012 Report).
Figure 3: Growth Rates of Key Sectors in the Nigerian economy, 2010-2011 (SOURCE: NBS Economic Outlook 2012-2015 Report)

5
Figure 3 revealed that the non-oil (energy) sectors of the economy remained vibrant with the telecommunication sector which recorded a growth rate of 34.76% in 2011. Other sectors including wholesale and retail, building and construction, hotel and restaurants and real estate posted double digit growth rates in 2011 with 11.33%, 12.26%, 12.09%, and 10.41% respectively. Between 2006 and 2010, these sectors have grown at a real average rate of 13.44 percent, 12.58 percent, 12.53 percent and 11.38 percent respectively. The crude oil and natural gas sectors recorded a decline of 0.57%, significantly down from 5.25 percent in 2010. (NBS 2012 Report). Poverty Rate (%): Current and Trend Whereas, the economy grew at an average of about 6.2 percent annually between 2002 and 2011, there is a general disconnect between Nigeria’s economic growth and human development. Nigeria is ranked 156 out of 187 economies (UNDP-HDR 2011). In 1988 the poverty level was 27.2% rising to 65.6% in 1999, an annual increase of 8.83%. In 2004, about 54.4% Nigeria’s over 130 million citizens lived below the poverty line. The situation worsened in 2011 when 69.1% of the Nigerian population or approximately 100 million people lived in abject poverty (NBS Report 2011). Table ….. Poverty Rate (%): Current and Trend Year Rural Urban National 1980 28.3 17.2 27.2 1985 51.4 37.8 46.3 1992 46.0 37.5 42.7 1996 69.3 58.2 65.6 2004 63.3 43.2 54.4 2011 80.1 50 69.1 Source: National Bureau of Statistics SUMMARY OF BASIC SOCIO-ECONOMIC DATA Nigeria’s socio-economic data and energy supply outlook is as per Table 1 below. Table 1. Basic socio-economic/energy data: Key Indicators Compound Indicators
Population (million)
154.73 TPES/Population (toe/capita)
0.70
GDP (billion 2000 USD)
78.33 TPES/GDP (toe/thousand 2000 USD)
1.38
GDP (PPP) (billion 2000 USD)
179.92 TPES/GDP (PPP) (toe/thousand 2000 USD)
0.60
Energy Production (Mtoe)
228.72 Electricity Consumption/ Population (kWh/capita)
120
Net Imports (Mtoe)
-122.01 CO2/TPES (t CO2/toe)
0.38
TPES (Mtoe)
108.25 CO2/Population (t CO2/capita)
0.27
Electricity Consumption* (TWh)
18.62 CO2/GDP (kg CO2/2000 USD)
0.53
CO2 Emissions ** (Mt of CO2)
41.19 CO2/GDP (PPP) (kg CO2/2000 USD)
0.23

6
*Gross production + imports - exports - losses **CO2 Emissions from fuel combustion only. Emissions are calculated using IEA's energy balances and the Revised 1996 IPCC Guidelines Source: IEA 1.2 ENERGY SITUATION
Nigeria is endowed with almost all types of energy resources as shown in Table 1. Table 1: Primary Energy Resources in Nigeria as at December 2010 S/No Resource Type Reserves (Natural Units) Production/Consumption 1. Crude Oil 36.22 Billion barrels 0.73 Billion barrels/yr 2. Natural Gas 187 Trillion SCF 2.4TSCF/yr 3. Coal and Lignite 2.175 Billion tonnes Negligible 4. Tar Sands 31 Billion barrels of
equivalent Negligible
5. Hydropower large 11,500MW 1,900MW 6. Small Hydropower 3,500MW 30MW 7. Solar Radiation 3.5-7.0kWh/m²/day 2MW 8. Wind (2-4) m/s at 10m height Negligble 9 Biomass Fuelwood 11 Million
hectares of forest and woodland
Excess of 1.2m tonnes/day
1.2 million tonnes/year
Animal Waste
211 Million assorted animals
Energy Crops and Agric Residue
72 Hectares of Agric. Land
10. Nuclear Not Yet Quantified Source: Compiled by the Energy Commission of Nigeria
2. Energy Supply (energy mix, export/import) Primary Energy Sources Prior to the 1960s, non-commercial energy (fuelwood, charcoal, agricultural wastes and residues as well as solar radiation) was the main primary energy source. The major commercial fuel was coal used by the railways and for power generation. Modest contributions came from petroleum products (petrol and diesel) and electricity (from coal and diesel generators). The structure of energy supply in Nigeria changed with the discovery of oil. By 2005, out of total primary energy consumption of 65.2Mtoe, natural gas accounted for 59.75%, followed by non-commercials (21.49%), petroleum products (17.73%) and hydropower (1.03%) as shown in fig. 1, while coal contribution had declined to an insignificant level.(ECN-MEAD Report-2008). Table 5.1 shows the percent consumption levels and structure of the consumption of the major energy resources by types over the years 1989 – 2005. Table 5.1: Energy Consumption of Primary Energy Resources (%) Year Coal Nat. Gas Pet. Prod. Hydropower Non-Com. 1989 0.16 21.77 31.10 10.98 35.99

7
1990 0.14 21.88 30.79 10.12 37.07 1991 0.19 21.81 32.25 9.52 36.23 1992 0.16 15.55 36.12 15.76 32.41 1993 0.01 20.76 30.47 15.42 33.34 1994 0.03 23.09 26.33 15.66 34.89 1995 0.04 25.55 25.09 8.93 40.38 1996 0.04 28.92 28.29 6.53 36.22 1997 0.04 30.88 23.44 6.79 38.85 1998 0.02 31.94 26.28 5.71 36.05 1999 0.02 33.67 23.88 5.70 36.73 2000 0.02 34.17 23.51 4.90 37.40 2001 0.02 43.26 22.30 4.34 30.09 2002 0.01 57.95 18.18 0.94 22.91 2003 0.01 57.24 18.62 1.11 23.03 2004 0.00 60.01 17.53 1.05 21.40 2005 0.00 59.75 17.73 1.03 21.19
Source: Report on “Energy Demand Projections for an Industrializing Nigeria”,
Report No. ECN/EPA/06/01
59.75%
17.73%
1.33%
21.19%
Total Energy Consumption in 2006 (%)
Natural Gas
Petroleum Product
Hydropower
Non-Commercial Fuels
Figure 1. Total Energy Consumption in 2006 (%)
Power Sector (Installed capacity, annual generation, import and export)
The Electricity Supply Industry (ESI) in Nigeria dates back to 1866 when two small generating sets were installed to serve the Colony of Lagos. The total installed capacity rose from a mere 30MW in 1956 to about 8,500MW in 2010 with a thermal to hydro mix of about 23:77. However, the functioning power stations had a combined installed capacity of about 4,680MW, which is about 70% the total installed capacity.
Type Location Year of comissionning Installed Capacity (MW)
Thermal Lagos – Egbin 1990 1320 Thermal Lagos– Egbin AES 2006 302 Thermal Delta – Sapele 1987 1020 Thermal Cross River – Okpai 2010 480 Thermal Rivers – Afam (I-V) 1987 702 Thermal Rivers – Afam (V) 1987 497 Thermal Delta 1995 882 Thermal Rivers – Omoku 2010 100 Thermal Kogi – Ajaokuta 2007 110 Thermal Kogi – Geregu 2007 414 Thermal Ondo – Omotosho New 335
8
Thermal Ogun – Olorunsogo/
Papalanto New 335
Thermal Ibom 2009 37
Hydro Niger – Kainji 1968 760
Hydro Niger – Jebba 1984 578
Hydro Niger – Shiroro 1990 600
Small Hydro Mgbowo Dam 2006 0.03
Small Hydro Waya Dam, Bauchi 2009 0.15
Small Hydro Kurra Fall, Ankwil II, Jos Plateau, NESCO
1927 8.0
Small Hydro Lere I, Jekko I, Jos Plateau State, NESCO
1937 4.0
Small Hydro Lere II, Jekko I, Jos Plateau State, NESCO
1950 4.0
Dispersed generation:
pilot wind, Solar PV
Streetlights, Solar PV
water boreholes, Solar
PV minigrid (ECN)
Across Nigeria 2005 ‐ 2011 9
TOTAL 8497.153
Source: PHCN, NERC, ECN, NBS, CBN
‐
250
500
750
1,000
1,250
1,500
1,750
2,000
2,250
2,500
1968 1984 1987 1990 1995 2006 2007 2009 2010 2011
Inst
alle
d C
apac
ity (M
W)
Year of Commission
Installed Capacity (MW) [1968 ‐ 2011]
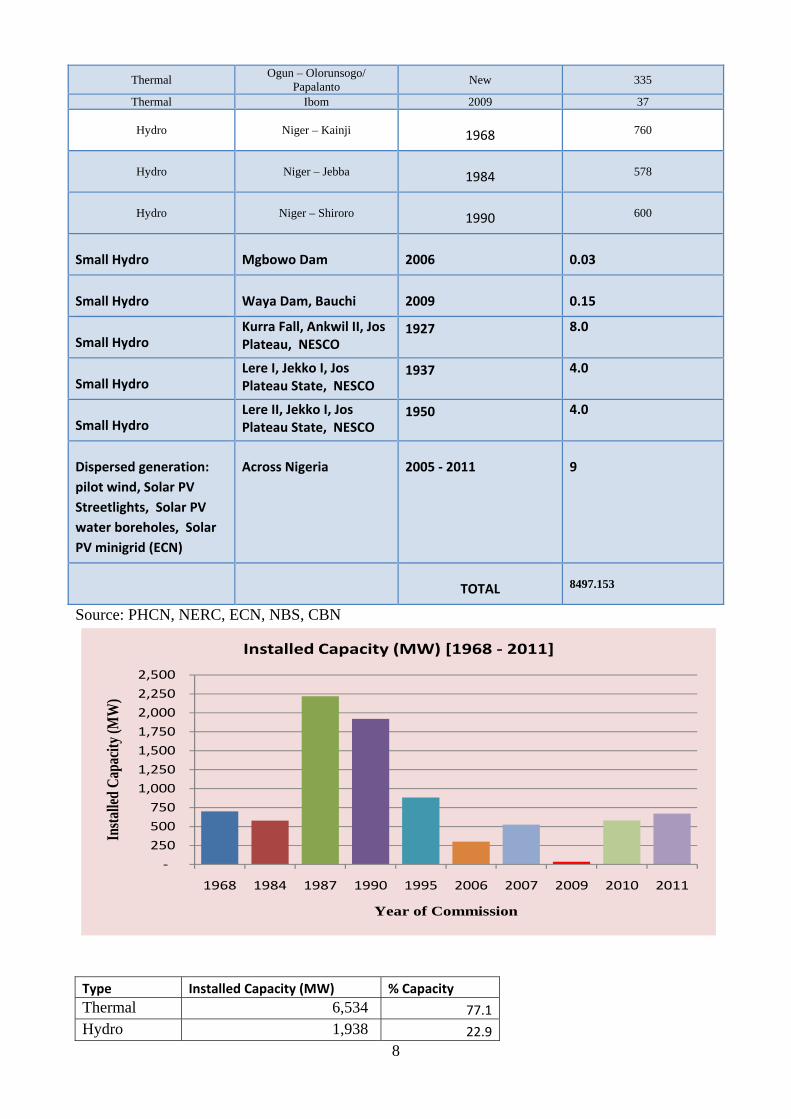
Type Installed Capacity (MW) % Capacity
Thermal 6,534 77.1
Hydro 1,938 22.9
9
Total 8,472
77.1%
22.9%
Installed Capacity (MW) by Type (%)
Thermal
Hydro
Annual Electricity Generation By the year 2005, the transmission network consisted of 5000km of 330kV lines and 600km of 132kV lines. The 330kV lines fed 23 substations of 330/132kV rating with combined capacity of 6,000MVA or 4,600MVA at utilization factor of 80%. In turn, the 132kV lines fed 91 substations of 132/33kV rating with a combined capacity of 7,800MVA or 5,800MVA at utilization factor of 75%. The distribution grid consisted of 23,753km of 33kV lines and 19,226km of 11kV lines. In turn, these fed 679 substations of 33/11kV rating and 20,543 substations of 33/0.415 and 11/0.415kV ratings. In addition, there were 1,790 distribution transformers and 680 injection transformers. The per capita consumption of Nigeria ranged from 68 to 95 kWh between 1980 and 1997, which was about 17% of the African average and 2% of that of South Africa. Moreover, only 34% and 45% of the population had access to electricity in 1998 and 2003 respectively. Furthermore, as at the year 2006, 661 (85%) of the 774 Local Government Headquarter (LGHQs) towns were connected to the national grid. Only four (4) of the 36 states plus FCT, namely, FCT, Ekiti, Lagos and Osun states had 100% grid electricity connectivity of their LGHQs while Bayelsa state had none of its LGHQs connected to the national grid. To increase access to electricity by the rural dwellers, the Federal Government under the on-going reform in the electricity sector, has established a Rural Electrification Agency (REA). Crude Oil Exports In 2008, Nigeria exported approximately 1.9 mob/d of its 2.17 million bbl/d of oil production. Of this, about 44% was exported to the United States, making Nigeria the 5th largest foreign oil supplier to the United States. Additional importers of Nigerian crude oil include Europe (25%), Brazil (7%), India (11%) and South Africa (4%) as shown in figure 2-11 below.

10
Electricity Export/ Import
Nigeria export of electricity to the Niger, Benin and Togo Republics for year 2009, 2010 and 2011 is presented in Table…
Table… Electricity Export in Nigeria Exports (GWh) Imports (GWh)
2009 0.63072 0
2010 0.63072 0
2011 0.63072 0
Source: NERC/PHCN Reports
3. Energy Demand: Overview of main energy consuming sectors, industry, residential, transport, commercial and public services The overview of the main energy consuming sectors in Nigeria is presented in Table 9. Industry, which comprises of agriculture, construction, mining and manufacturing sector consumed 4.8 Mtoe, representing 14.8%; while transport, residential and services consumed 9.90 Mtoe (30.5%), 15.82 Mtoe (48.7%) and 1.98 Mtoe (6%) respectively (Sambo 2011 – Journal of Energy Policy - 2011, Vol. 1, No.1 Pg.6). Table 9: Final Energy Demand by Economy Sector, Mtoe for 2005 Sector Energy Demand %
Share Industry 4.80 14.8 Transport 9.90 30.5 Household 15.82 48.7 Services 1.98 6.0 Total 32.50 100

11
14.8%
30.5%48.7%
6.0%
Final Energy Demand by Sector in 2005 (%)
Industry
Transport
Household
Services
The traditional fuels, which include fuelwood, charcoal, crop residues and animal droppings, are consumed largely for cooking and water heating in rural and sub-urban households with small quantities consumed in the services sector also for cooking while some cottage industries, such as bakeries and other food processing also use it in the manufacturing processes. The high proportion of energy consumption in the households (48.7%) is due to the consumption of low quality traditional fuels with low efficiency of utilization. Fossil fuels used for transportation follow with 30.5%, electricity with 5.03%, fossil fuels used for thermal purposes accounted for 4.21% while coking coal and feedstock accounted for the balance. Soft solar (solar thermal applications) contribution was practically zero. Electricity Demand The annual electricity consumption in Nigeria in 2009, 2010 and 2011 stood at about 2.27 GWh, 2.38 GWh and 2.43 GWh respectively. The percentage share of electricity consumption by sector is residential (53.9%, commercial (25.4%), industrial (20.65%) and Streetlighting+ (0.05%) as shown in Table…
Sector % of Electricity Consumption
Residential 53.9 Commercial 25.4 Industrial 20.65
Street lighting & Others 0.05
Source: NBS, PHCN, ECN

12
53.9%
25.4%
20.65%
0.05%Electricity Consumption by Sector - 2010
Residential
Commercial
Industrial
Street lighting & Others
Table 2: 2009 Energy Balance for Nigeria In thousand tonnes of oil equivalent (ktoe) on a net calorific value basis SUPPLY andCONSUMPTION
Coal and Peat
Crude Oil
Oil Products
Natural Gas
NuclearHydro Geothermal,Solar, etc.
Biofuelsand Waste
Electricity
Production 5 117470 0 18950 0 389 0 91907 0
Imports 0 0 7677 0 0 0 0 0 0 Exports 0 -115951 -678 -13058 0 0 0 0 0
International Marine Bunkers**
0 0 -621 0 0 0 0 0 0
International Aviation Bunkers**
0 0 -673 0 0 0 0 0 0
Stock Changes 0 897 1937 0 0 0 0 0 0 TPES 5 2416 7642 5893 0 389 0 91907 0
Transfers 0 177 -158 0 0 0 0 0 0
Statistical Differences
0 0 0 0 0 0 0 0 0
Electricity Plants 0 0 -586 -2732 0 -389 0 0 1701
CHP Plants 0 0 0 0 0 0 0 0 0 Heat Plants 0 0 0 0 0 0 0 0 0 Gas Works 0 0 0 0 0 0 0 0 0
Oil Refineries 0 -2592 2427 0 0 0 0 0 0 Coal Transformation
0 0 0 0 0 0 0 0 0
Liquefaction Plants
0 0 0 0 0 0 0 0 0

13
Other Transformation
0 0 0 0 0 0 0 -2443 0
Energy Industry Own Use
0 0 -212 -1634 0 0 0 0 -49
Losses 0 0 -18 -535 0 0 0 0 -100
TFC 5 0 9094 992 0 0 0 89464 1552
Industry 5 0 193 992 0 0 0 9055 279
Transport 0 0 8152 0 0 0 0 0 0
Other 0 0 620 0 0 0 0 80409 1273Residential 0 0 620 0 0 0 0 80409 874
Commercial and Public Services
0 0 0 0 0 0 0 0 399
Agriculture / Forestry
0 0 0 0 0 0 0 0 0
Fishing 0 0 0 0 0 0 0 0 0
Non-Specified 0 0 0 0 0 0 0 0 0 Non-Energy Use 0 0 129 0 0 0 0 0 0 - of whichPetrochemical Feedstocks
0 0 0 0 0 0 0 0 0
* Totals may not add up due to rounding. ** International marine and aviation bunkers are included in transport for world totals.
Source: http://www.iea.org/stats/balancetable.asp? Country_ Code=NG
4. Energy and Economic Development: Table 2: Real GDP Growth (1999 – 2007) Despite Nigeria’s huge energy resources, the energy sector has not contributed significantly to the Nation’s GDP. In 2007, Oil and Gas contributed about 19% to GDP as shown in figure 2-39 below. The National Bureau of statistics reports that crude petroleum and natural gas contributed about 18% to the GDP in 2008.
Contribution of Energy to National Economy
S/N Item 2001 2002 2003 2004 2005 2006 2007 Average
1 Contribution to GDP @1990) Basic Process(%)
26.0 23.5 26.5 25.7 24.3 21.9 19.4 24
Year 1999 2000 2001 2002 2003 2004 2005 2006 20Real GDP Growth (% ) 2.8 3.8 4.6 4.6 9.6 6.6 6.5 5.6
Source: CBN Annual Reports, 2001, 2005 and 2007

14
2 Contribution to Federally collected revenue (%)
63.3 68.8 75.1 77.5 72.9 76.7 67.7 72
3 Contribution to Export Earnings - Visible trade (%)
98.5 94.9 95.5 96.3 98.5 98.2 97.9 97
Source: CBN Annual Report (2005, 2007
Share of Energy in GDP
Figure 2: Sectoral Contributions to GDP (2010 – 2011) Figure 4 shows the sectoral contribution to GDP in 2010 and 2011. Agriculture (41%), Wholesale & Retail trade (19.38%) and Crude Petroleum & Natural Gas (14.71%) made up 70% of the nation’s GDP in 2011. Other important sectors include Telecommunications and Post, Manufacturing, and Building & Construction, recording slightly higher contributions in 2011 than in 2010. Public Expenditure on Energy: Share and absolute amount of public spending on energy, energy subsidies and energy security (share of imports in balance of payment) Public sector funding mostly from national budget has been the major source of investment in the energy sector. Between 1999-2007, government has been said to invest more than $16billion in the generation of electricity*, alone which actually peaked in 2007 when government appropriated about 1,127.87 billion naira representing 22.12 of the annual budget. Even though there has not been any rise in percentage ratio, the amount budgeted for 2010 significantly increased to 1,702.78billion naira representing 8.78% of the year’s annual budget*.

15
5. Energy Strategy and Relevant Targets (access, capacity, generation, energy security) A key challenge to the Nigerian economy is the increasingly jobless growth experienced over the past decade. The federal government envisages a significant proportion of new jobs to come from industrial growth over the next years. According to the International Labour Organization (ILO), in 2007, 74.2 million (53%) of the population were of working age. Of this number, about 41 million representing 55.3% constitute the working population while the proportion of the unemployed was 44.7%. Agriculture remains the main source of employment for 47% of the population; 22% are employed in the service sector, while manufacturing accounts for only 6% of the working population.* The Vision 2020 identified expanded employment opportunities as key to meeting the targets of making Nigeria a top 20 economy. Some of the actions to stimulate job creation include: expansion of investments in critical infrastructure, particularly the energy sector; fostering private sector-led non-oil growth; and investing in human capital development.
Section 2: Current Situation with regard to SE4ALL Goals
2.1 ENERGY ACCESS vis-à-vis GOAL OF SE4ALL
6. Overview and assessment The national energy outlook indicates a huge disparity in terms of energy access between the rural and urban population. Only about 47% of the population have access to electricity from the national grid and more than 15 million households do not have access to electricity with more than 67% of the population depending on biomass. Access varies widely between regions. For example, fewer than 10% of households in the rural northern states of Jigawa, Katsina, Kebbi, Sokoto and Taraba currently have access to grid electricity. In comparison, almost everyone living in the southern Lagos state has access to electricity. About 60% of residents in the southern states of Edo, Ondo and Osun can access the national grid.
Some of the major constraints in terms of providing Nigeria’s rural areas with universal electricity access include low and isolated loads in rural areas where population density is sparse; dispersed and inaccessible locations; rural consumer’s inability and willingness to pay and high cost of extending the grid. Invariably, a large increase in electricity supply and infrastructure will be necessary in order to improve people’s access to electricity across Nigeria.
The National Rural Electrification Programme aimed at connecting all the local government
headquarters and some strategic towns and villages to the national grid is considered as crucial to the overall development of the country. The programme is however very constraint by financial reasons to deliver on its mandate as the rate of electrifying the rural areas has remained grossly unfulfilled.
7. Modern energy for thermal applications (cooking and heating) Both rural and urban Nigerians are still heavily reliant on solid fuels for cooking with up to 76% of households using wood, coal, crop residues and animal dung or inefficient cooking stoves made from clay, metal or bricks. Table 5- Fuels used for cooking and access to modern fuels - National
Fuels % of Fuels used % Population with

16
for Cooking (National)
access to Modern fuels
Electricity 0.3
24.3
Gas 1 Kerosene 23 Charcoal 2.2 Wood 72.3 Dung 0.5 Coal 0.1 Other 0.6 Total 100 Source: National Bureau of Statistics, UNICEF, 2007 (Adapted from UNDP Energy Access in Developing Countries Report, 2009 Table 5- Fuels used for cooking and access to modern fuels - Rural Fuels % of Fuels used
for Cooking (Rural)
% of Rural Population with access to Modern fuels
Electricity 0.1
7.6
Gas 0.2 Kerosene 7.3 Charcoal 0.7 Wood 90.2 Dung 0.7 Coal 0 Other 0.8 Source: National Bureau of Statistics, UNICEF, 2007 (Adapted from UNDP Energy Access in Developing Countries Report, 2009
Table 5- Fuels used for cooking and access to modern fuels - Urban
Fuels % of Fuels used for Cooking (Urban)
% of Urban Population with access to Modern fuels
Electricity 0.7
57.7
Gas 2.4 Kerosene 54.6 Charcoal 5.2 Wood 35.9 Dung 0 Coal 0.2 Other 1.0 Total Source: National Bureau of Statistics, UNICEF, 2007 (Adapted from UNDP Energy Access in Developing Countries Report, 2009
8. Access to Electricity: Nigeria has an installed electricity generation capacity of 5,900 MW with the net generation capacity of 20.14 billion kilowatt hour in 2008*. About 72% of the total net generation comes from conventional thermal sources (mostly gas fired power generation) with the remaining 28% coming from large hydroelectricity. Although Nigeria is endowed with abundant renewable energy resources- the major ones being solar energy resource, wind, biomass small and large hydropower, renewable energies (excluding large scale hydroelectricity) still play an insignificant role in the

17
electricity generation. The current state of exploitation and utilization of solar photovoltaic (PV) energy in Nigeria is very low, limited mostly to pilot and small-scale applications such as residential and powering water pumps in rural areas.
The Transmission Company of Nigeria (TCN) is responsible for power transmission across the country’s grid. Currently the grid is comprised of 5,523.8km of 330kV and 6,801.49km of 132kV of transmission lines
a. 32 330/132kV sub-stations (with total installed transformation capacity of 7,688MVA – equivalent to 6,534.8MW)
b. 105 132/33/11kV sub-stations (with total installed transformation capacity of 9,130MVA – equivalent to 7,760.5MW). *
Characterised by obsolete equipment, overloaded transformers, inefficient dispatch of electricity and uncoordinated system planning, the Transmission reinforcement programme up to 2015 proposes the following in addition to a super grid
330kV lines: 500km/year New 330/132kV interfaces: 7 sub-stations/year New 330/132kV capacity: 2,000MVA/year 132kV lines: 1,300km/year New 132kV sub-stations: 23 sub-stations/year 132kV sub-station capacity: 2,200MVA/year*
Electricity Tariffs Nigeria has one of the lowest electricity tariffs in West Africa. This is put forth as the reason investors are reluctant to invest in the power sector. A comparison shown in the table illustrates the cost in Naira per kilowatt-hour across six West African Countries in 2009
Table 3- Tariff Comparison across six West African Countries (SOURCE: Union of Producers, Transporters and Distributers of Electric Power in Africa, UPDEA, www.updea-africa.org)
The NERC since 2008 has been tasked with ensuring stronger regulation, increased efficiency and cost reflective tariff to support the viability and growth of the Nigerian Electricity Supply Industry (NESI) consisting of the supply chain of generation, transmission, distribution and retail. While the government is subsidizing the costs to the consumer temporarily, it is expected that this will cease to be the case in years to come as the true costs emerge over the 15-year period (2008-2023). An assumption here is that availability of power will also increase. The multi-year tariff order (MYTO) is set over a 5-year period as shown in the Table 4 below

18
As of July 2012, the tariff schedule is as follows for the different classifications of electricity consumers.
Table 5- 2012 Tariff Schedule (SOURCE: NERC MYTO 2008-2013 Document)
9. Modern Energy for Productive Uses
Nigerian’s vast energy resources from both renewable and non-renewable sources supports a wide range of productive uses which include cooking, heating and energizing electrical appliances for household; transportation, industrial, agriculture and manufacturing. Final consumption or use of energy for electricity was estimated at 18051GWh in 2009*. Residential use accounts for 56%, while Commercial and Public Services use was at 26%. It is not surprising that only 18% was used by Industry, as most are heavily reliant on self-generation.
2.2 ENERGY EFFICIENCY vis-à-vis GOAL OF SE4ALL
10. Overview and Assessment
In Nigeria, the limited energy supplied is wasted through the use of old, obsolete and inefficient appliances as well as wasteful lifestyles in energy use. Consequently, the potential for energy savings is high, especially in the three main energy demand sectors, namely household, industry and transportation. This potential has remained untapped due to inadequate human capacity, low level of awareness; lack of coordinated research and developed laboratories dedicated to energy efficiency; unavailability of energy-efficient appliances and equipment and the influx of poor quality energy saving appliances where it exists; amongst others. All these and many others stand as great barriers to the promotion of energy efficiency and conservation in the country.

19
Current record indicates that between 25-40% of electricity generation is lost through low technical maintenance and high network losses. This signifies a great potential for substantial energy savings if the transmission systems are made more efficient and energy efficiency practices are adopted. In the household sector, there is considerable energy loss due to inefficient traditional three-stone stoves, used for cooking mainly in the rural areas. Again, recent survey conducted by the Energy Commission of Nigeria revealed that about 500 million inefficient incandescent lamps are being installed for lighting in residential sector alone. Similarly, there is considerable scope for energy conservation in the Nigerian industries. Industrial energy audit studies have shown that as much as twenty five percent of industrial energy can be saved through simple housekeeping measures. Also, our transport sector has substantial opportunities for savings, most especially the road transport sub-sector.
The Federal Government through the Energy Commission of Nigeria (ECN) recognizes energy efficiency and conservation measures as a key element in the nation’s efforts to reduce the imbalance between energy supply and demand. In fact, one of the main objectives of the National Energy Policy (NEP) of Nigeria is to guarantee an efficient and cost effective consumption of energy resources; and to ensure the importation and manufacture of the most energy-efficient equipment and machinery, as well as promoting public awareness about the benefits of improved energy efficiency.
11. Energy intensity of national economy: current situation and trend The industrial sector is one of the major energy consuming sectors and its accounts for about 25% of total commercial fuels currently consumed in the country. Inadequate and unreliable supply of energy to industry is a major to low industrial capacity utilization. Some studies revealed that many small firms have had to generate upto 50% of their electricity requirements, while some large firms are fully on self-generated electricity in order to have 100% reliability for their production processes. The most common fuels used in the industry are fuel oil (LPFO, HPFO, Gasoline), LNG and electricity. Poor electricity supply is perhaps the greatest infrastructure problem confronting the industrial sector. The typical Nigerian firm experiences power failure or voltage fluctuations about seven times per week, each lasting for about two hours, without the benefit of prior warning. Electricity consumers have responded to the nation’s utility inefficiency through self-generation. Electricity users, both firms and households, now generate their own electricity in part or in whole to substitute or complement supply from national grid by factoring generator costs into the overall investment cost. Nigeria's energy intensity has since 1981 remained relatively stable at around 8,500 BTU. Compared to other large African states, Nigeria's energy intensity is significantly lower. Compared to the same period in 2001, South Africa's energy intensity was 26,153 BTU, Egypt: 26,394 BTU; Algeria: 24,746 BTU; and Libya: 19,067 BTU. Nigeria's energy intensity in 2001 was also well below the OPEC average*.
Energy efficiency in the industrial sector in Nigeria is low. This is due to the old, obsolete and energy inefficient equipment currently in use. The potential for energy saving is very high. Over 40% of total energy used is wasted on old, obsolete and inefficient equipment. 25% saving potential exists through good housekeeping measures alone. Retrofitting in industries could save over 35% of energy currently used. 40% of electricity consumption for air conditioning could be saved through more efficient equipment and practices (Sambo, 2008). There is a big disparity between rural and urban household energy use. While the urban rich population are having access to petroleum products (LPG and gasoline) and electricity, the

20
rural people and the urban poor use predominantly fuelwood, kerosene and solar energy (particularly, open-to-sun drying).
2.3 RENEWABLE ENERGY vis-à-vis GOAL OF SE4ALL
12. Overview and Assessment Nigeria is endowed with abundant renewable energy resources that can be used in generating electricity, the significant ones being solar energy, small and large hydropower, biomass and wind. The country also has good potentials for hydrogen fuel, geothermal energy, ocean wave and tidal energy. The annual average of daily solar radiation ranges from 3.5 kWh/m2-day in the coastal belt of the south to 7.0 kWh/m2-day in the northern arid regions, while the daily sunshine hours has an annual average of 4 to 9 hours, increasing from south to north. Wind energy reserves in the country at 10m height shows that some sites have wind regime between 1.0 to 5.1 m/s. Wind speed range from a low 1.4 – 3.0 m/s in the Southern areas and 4.0 – 5.12 m/s in the extreme North. Peak wind speeds generally occur between April and August for most sites. Preliminary study shows that the total actual exploitable wind energy reserve at 10 m height, may vary from 8.0 MWh/yr in Yola to 51.0 MWh/yr in the mountain areas of Jos Plateau and its is as high as 97.0 MWh/yr in Sokoto. Hydropower is estimate that the gross hydro potential for the country is approximately 14,750MW (REMP) with current hydropower generation at about 14% of the nation’s hydropower potential and represents some 30% of the total installed grid connected electricity generation capacity. There are over 278 identified sites for small-scale hydropower production with a total capacity of 734MW that has remained unexploited. Biomass resources in Nigeria include wood, forage grasses and shrubs, animals waste and other waste from forestry, agriculture, municipal and industrial activities as well as aquatic biomass. It remains the most widely used source of energy in the country even though no clear overview exists on the size of this important resource base and the sustainability of its resource management. So far, government’s effort to improve the resource management of biomass energy has essentially focused on enhancing the adoption of improved woodstoves, briquetting and biogas technologies. One of the earliest actions taken by the government of the country, in pursuit of a coherent renewable programme in Nigeria, was the establishment in the 1982/83 year, of two Renewable Energy centers, namely, the National Center for Energy Research and Development (NCERD) at the University of Nigeria, Nsukka and the Sokoto Energy Research Center (SERC) at the Usman Danfodiyo University, Sokoto. Their activities, together with those of tertiary and other research institutions, have led to the development of a number of solar thermal, biomass and biogas devices and improved woodstoves technologies that are ready for commercial production and adoption into the national economy. The Federal Government of Nigeria through its agencies and development partners like UNDP, UNIDO, MDGs, WB has built renewable energy projects especially for solar street-lighting and solar boreholes. As far back as 1960s, more than 100 windmills for water pumping have been installed in the country mainly in the North-Western, Lagos (Badagry) and Plateau (Jos) areas to provide water for human and livestock consumption. Most of these are broken down and need rehabilitation. In 1989, Katsina State ordered for 62 windmill units for water pumping.
21
13. On-grid and Off-Grid Renewable ENergy Large-scale hydropower accounts for about 23% of the 8,500 MW installed electricity
generation capacity in Nigeria In May 2007 the Lagos State government launched a pilot solar power project to provide
off-grid electricity to a small offshore island where the local population (5,000 people) practise fishing and boat-building.
Off – grid 30 kW Pico Hydro at Evboro, Benin City Off-grid 30 kW Pico Hydro at Mgbowo, Enugu State 30 MW Small hydropower plant by NESCO, Jos, Plateau State UNIDO is supporting a pilot IPP in Ebonyi State, which will generate electricity from
waste rice husks. UNIDO and the Ebonyi State government have signed a memorandum of understanding to construct a 5MW power plant fuelled by locally sourced waste rice husks. Power generated from the plant will benefit local rice millers, farmers, small industries and local residents.
150 kW Mini Hydropower at Waya Dam, Bauchi State Between 2005 and 2010, the Energy Commission and other agencies have built a number
of off-grid and dispersed renewable pilot projects - pilot wind, Solar PV Streetlights, Solar PV water boreholes, Solar PV minigrid toalling over 12 MW(ECN).
14. Use of Renewable Energy Source for Thermal Application (Heating and Cooking) The largest single energy source that is used for heating and cooking in both rural and semi-urban areas of Nigeria is fuel-wood. It is believed that for many years to come fuelwood will continue to be the major energy source in the rural and semi-urban areas. The use of renewable energy source for thermal application is limited by the type technologies available to the people. Available technologies are rudimentary, inefficient, small scale and subsistent. Today, clean cook stoves are being constructed for efficient heating and cooking with fuelwood. Other technologies being developed locally are solar cookers, solar water heaters, solar dryers, improved woodstoves, etc… Biogas digesters are being built in many part of the country to generate cooking gas for rural dwellers. 15. Use of Renewable Energy Source (RES) for Productive Uses The small hydropower stations in isolated communities are used in food processing and other economic activities. Photovoltaic is used in powering a mobile phone-charging booth in villages that are not connected to the national grid. Solar refrigeration is used in some places for food preservation and for preservation of drugs in community clinis and health care centres. The Nigerian government is piloting large-scale biofuel production for use in automobiles and generators, and for biogas production. The government has signed a Memorandum of Understanding (MoU) with Brazil for technology transfer and supply of ethanol from sugar cane, including importing ethanol from Brazil until Nigeria is ready to start producing. There is a further agreement with Cuba on ethanol supply. Ethanol will be used as an additive to petrol, constituting a proposed 10 per cent of the mix. Other forms of small-scale biomass sources for stoves also provide an attractive option. Briquettes can be produced locally from local waste products such as rice husks, coconut cairn/shells, wheat husks, sawdust and other products. A viable - and low-carbon - briquette industry would provide jobs and enterprise opportunities locally while meeting a high demand for domestic cooking fuel. In Cross River State, for example, local NGOs source waste wood chips from local timber companies and process them into fuel pellets for locally manufactured stoves.

22
14 Consolidated Summary: problem statements with regard to energy access, energy efficiency and renewable energy Energy Access Energy poverty in Nigeria is pervasive and heavily characterized by limited access, unreliability and affordability. Majority of the population still relies on traditional biomass as source of cooking fuels with attendant health consequences (95,000 deaths for indoor pollution). Only about 40% of the country has access to the national grid and rate of spread of rural electrification is very low, even though government has resumed intensive investments to expand the energy services through its NIPP programme. Furthermore, electricity in rural is limited to basic energy services for households and social services like health and education. The country is still heavily dependent on oil and gas as its main economic asset and source of energy, a sector already saddled with inefficiency, wastes and corruption. The on-going reform in the petroleum sector through the Petroleum Industry Bill (PIB), the Gas Master Plan, the Privatization programme and the overarching objectives of the Vision 20:2020 would hopefully unlock the massive renewable energy potentials and increase access to energy. Energy efficiency and energy intensity: Continued losses of energy through electricity transmission and other unsustainable use of energy in industrial and domestic activities will continue to challenge energy delivery. Energy efficiency can be achieved through the reduction of losses in processes (energy production and consumption, transport and services industry), the deployment of renewable energy technologies and some measure of behavioural change. The UNDP/ECN Energy Efficiency Project has demonstrated that massive energy savings can be achieved through the implementation of robust strategy that addresses the twin problem of energy challenge and climate change. Renewable energy: The identified renewable energy resources in Nigeria can help meet the current country’s energy challenge. These resources can be easily deployed through off grid, decentralized/stand alone plants across the country. Despite the adoption of a feed in tariff regime, more financial investments are required to expand renewable energy in the country. More emphasis on small-scale renewable projects that can quickly deliver to the rural areas should be encouraged and appropriate legal frameworks that guarantee investments put in place. 2.4 SE4ALL GOALS
13. Goals
Energy access Energy efficiency Renewable energy
Energy access:
By 2030, renewable energy is expected to contribute about 10% share in the available energy mix.
To increase electricity access from the current 40% to 60% by 2015 and 80% by 2020 (Vision 2020)

23
By 2030,the population of people living without electricity supplies is will drop from the current 60% of the total population down to about 10%. This is expected to drop to about 20% by 2020.
The electricity generation will increase from the present 4,000 mw to 21,000mw by 2016 and 35,000mw by 2020.
Energy efficiency:
By 2015, efficient lighting (at least 5 times more efficient than incandescent lamps) will be used by 50 % of the households, 80 % by 2018 and almost 100 % by 2030.
For high energy consumer sectors (transport, power sector, agriculture) efficient energy technologies will be progressively introduced as well as other demand side management measures such as peak load management when possible. Compared with the current level, energy efficiency will increase by at least 20 % by 2020 and 50% by 2030.
By 2016, energy audits will be compulsory for all high-energy consumer sectors, public and para-statal buildings.
Renewable energy Nigeria’s renewable energy vision by 2020 is to achieve a technologically driven renewable energy sector that harnesses the nation's resources to complement its fossil fuel consumption and guarantee energy security. Specifically, Nigeria’s Vision 2020 for renewable energy are:
To achieve a 15% and 20% contribution of hydro electricity to the nation’s electricity generation mix by 2015 and 2020 respectively;
To achieve a 1% contribution of wind energy to the nation’s electricity generation mix by 2020;
To achieve a 1% contribution of solar energy to the nation’s electricity generation mix by 2020
To replace 50% of firewood consumption for cooking with biomass energy technology by 2020
To achieve a power generation capacity of 1,000 MW using biomass resource by 2020 Achieve a biofuel blends not exceeding 10% by 2020 using locally produced renewable bio-
fuels from secondary biomass.
Section 3: Challenges and opportunities for achieving SE4ALL goals 3.1 INSTITUTIONAL AND POLICY FRAMEWORK
The Energy Commission of Nigeria (ECN) was established by the ECN Act No. 62 of 1979 as amended in the Amendment Acts No. 32 of 1988 and No. 19 of 1989 and became operational in 9th August 1988. The Energy Commission of Nigeria (ECN) is charged with the responsibility for the strategic planning and co-ordination of national policies in the field of energy in its entire ramification.
18. Energy and development:
Energy in National Development and Poverty Reduction Strategies and Plans The most current National Development and Poverty Reduction Strategies and Plans with energy at its center is the Nigeria’s Vision 20: 2020 whose intent is to position Nigeria to be one of the top 20 economies in the world by 2020 by linking the objectives of the NEEDS programme with the Seven-point Agenda. The key objectives of vision 2020 are to:
Stimulate Nigeria’s economic growth and launch the country onto a path of sustained and rapid socio-economic development;

24
Place Nigeria in the list of top 20 largest economies of the world by the year 2020, with a GDP of not less than $900 billion and a per capita income of not less than $4,000/annum by 2020.
The Vision 20: 2020 has it that “by 2020, the energy sector will be the major engine of the nation’s sustainable social, economic and industrial growth, delivering affordable and constant energy supply efficiently to other sectors of the economy”. The strategic priorities of the Vision 20-2020 for the Nigerian Energy Sector are:
Attracting private investments (Local and foreign) to facilitate the necessary energy capacity expansion.
Consolidating ongoing local content campaign by expanding linkages to other sectors of the economy.
Achieving enhanced energy security by diversifying the energy mix through use of renewable energy resources (wind,solar,hydro and biomass).
Consolidating ongoing structural and economic reforms targeted at establishing effective institutional and regulatory frameworks in the energy sector.
Developing efficient and sustainable energy generation and consumption patterns. Since independence in 1960, the energy and power sector in Nigeria has witnessed many innovations in term of government policies and plans as introduced by different administrations for the development of the sector. While some of them were institutionalized and are being implemented, some are still in the process of becoming laws and therefore not being implemented yet. The followings are the Policies and legal frameworks in the sector:
National Energy Policy (NEP), 2003 National Energy Master Plan (NEMP), (2007) National Gas Policy and Master Plan Electric Power Sector Reform (ESPR) Act (2005) Power Sector Reforms Roadmap (2010) Biofuel Policy (2007) Petroleum Act of 1969 and all its subsequent Amendments Petroleum Industry Bill (PIB).
Energy Governance: institutions in charge of energy sector within the context of economic and social development in the country.
The current institutional structure of the Nigerian energy and power sector showing the Political leaderships, Policy and R&D cadre as well as the utility branches of the administration is demonstrated below:

25
19. Thermal energy for households Policy to distinguish between urban and rural households as their needs varies. Government to collaborate with financial institutions and local energy suppliers to
develop appropriate and effective framework to improve access to energy for households and explore sources of energy other than electricity and wood.
Rural electrification programme to be geared up through adequate budgetary allocations to enhance rural electrification distributions o rural households.
20. Power sector:
The Federal Government’s power sector reform is still on going with the Presidential Task Force on Power driving it with aim of revamping generation and distribution of electric power in the short term.
The key challenge remains the inability of the new and rehabilitated power stations to get gas supplies to fire the plants. This has become a big challenge to government and the IPPs. It has become imperative that the gas supply and management framework be overhauled.
The NERC recently released a Feed-in-Tariff with a view to providing private sector investors comfort and assuranceson the return on their investments. The regime will also provide some clarity of electricity rates and prices.
21. Modern energy for productive sectors: Government’s power sector reform must be fast-tracked and all constraints of licenced IPPs should be resolved particularly as it relates to gas supply.The International Oil Companies (IOCs) are already involved in the provision of electricity to communities in areas of their operations example, Total’s EgiElectrification Programme that is a 13mw independent power station in the Egi District of Rivers State.
The PIB that seeks to deregulate both Nigeria’s upstream and downstream operations needs to be completed to unlock the actual potentials of petroleum sector and encourage competition and
25
KEY: PHCN - Power Holding Company of Nigeria REA - Rural Electricity Agency (REA), NERC - Nigerian Electricity Regulatory Commission
ECN - Energy Commission of Nigeria NDPHC - Niger Delta Power Holding Company NEC - National Energy Council PPPRA – Petroleum Product Pricing Regulatory Agency
ECN
PHCN
Energy Research Centres (6 No.)
NERC
NAEC
PRESIDENCY
Special Adviser on Petroleum
Fed. Ministry of Science & Tech.
Fed. Ministry of Power
Fed. Ministry of Environment
Ministry of Petroleum Resources
DPR NNPC & Subsidiaries NNRA
NDPH
NEC
2-Nuclear Research Centres
PPPRA
KEY: DPR - Department of Petroleum Resources ECN - Energy Commission of Nigeria NAEC- Nigerian Atomic Energy Commission NDPHC -Niger Delta Power Holding Company NEC - National Energy Council NERC - Nigerian Electricity Regulatory Commission NNRA – Nigerian Nuclear Regulatory Authority NNPC - Nigerian National Petroleum Corporation PHCN - Power Holding Company of Nigeria PPPRA – Petroleum Product Pricing Regulatory Agency

26
enhance access to energy for other sectors of the economy like agriculture, manufacturing, transport and general services.
22. National monitoring framework for SE4ALL: INDICATORS
Energy access Energy efficiency Renewable energy National electrification rate (%) Rural electrification rate (%) National electricity consumption
kWh/y/capita Rural electricity consumption
kWh/y/capita % of households equipped with
modern energy for cooking in rural areas
TPES/GDP TPES/GDP (PPP) Losses in the power sector (transmission
and distribution) Efficiency of power sector (fuel
consumption in toe per MWh) : breakdown per technology
Energy efficiency per sector (industry, mining, transport)
Capacity installed (Hydro, solar, wind,
Number of Pdisseminated for Hbusinesses etc
Number of SWH households, &industries
3.2PROGRAMS AND FINANCING
23. Thermal energy:
The REMP remains government’s major programme to promote renewable energy, but lack of full implementation of the Plan has currently led to its being review to set need realistic targets and framework of implementation.
The Vision 20:2020 envisage a expansion of the energy base from all sources and it’s just at its implementation phases.
The means of implementation particularly funding these programmes continue to be a challenge.
24. Power sector:
The NIPP plans to increase additional generation capacity from all existing plants particularly those at Kainji, Jebba and Shiroro by 295mw by February, 2011, and by 340mw from Egbin,AfamI-V, Sapele Steam,Sapele Gas, Delta, Geregu, Omotosho and Olorunsogo thermal plants*.
25. Modern energy for productive use:
The agricultural sector that contributes over 40% of the GDP and employs about 60% of the country workforce is the most dynamic sector of the nation’s economy. With the government’s drive to diversify the economy, demand for all forms of energy will equally increase for critical sectors like transport, energy, and infrastructural developments and for small-scale entrepreneurships. The challenge for efficient use of energy and the penetration of renewable energy into the national energy mix will also increase.
Although no in-depth studies were carried out on the overall efficiency of the productive sectors, empirical evidence suggest that significant improvement could be made to reach better energy efficiency and ultimately a better use of the energy without compromising the cost performance of the productive sectors. On the contrary, their competitiveness might increase as energy efficiency investments very often have a short payback period and therefore a very good return on investment.
27
3.3 PRIVATE INVESTMENT AND ENABLING BUSINESS ENVIRONMENT
26. Thermal energy for households:
Investments in the importation of household energy appliances and products particularly from China have been in the increase lately. While the demand soars, the level of quality control and standardization has not been commensurate with flows of such products. Local productions of renewable energy technologies (RETs) have been faced with constraints of lack of financial, technological and attractive regulatory frameworks for the private sector to engage. The Manufacturers Association of Nigeria (MAN) that witnessed the closure of their plants due to the energy crisis has embarked on exploring alternative sources of energy to sustain their operations. Renewable energy and energy efficiency options provide viable options.
27. Power sector
Private Sector actors involved in supply chain The Electricity (Amendment) Decree 1998 and the NEPA (Amendment) Act 1998 that was passed, terminated the monopoly status of NEPA and invited private sector participation in the electricity sector.
The Electric Power Reform Implementation Committee (EPIC) was inaugurated by Bureau of Public Enterprise (BPE) and resulted in Federal Executive Council (FEC) approving the National Electric Power Policy in September 2001, which recommended:
Establishment of a sector regulator. Privatization of the electric power sector A market trading design and new rules, codes and processes
The first move of Government to tackle the poor state of the Power Sector was the setting up of a Technical Board to:
• Address the issue of collapsing infrastructure; • Rehabilitate some of the generating stations, transmission and distribution
infrastructure; • Commence the unbundling of NEPA for improvement in efficiency; and, • Prepare grounds for private sector participation.
In March 2005, the Federal legislature passed the Electric Power Sector Reform Act. The Act outlined the framework of the reform as follows: Unbundle the state owned power entity into generation, transmission and distribution: 18
New successor Companies: 6 generation companies, 1 transmission company and 11 distribution companies were incorporated;
Create a competitive market for electricity services in Nigeria (Independent Power Plants (IPPs), Joint Venture (JV) IPPs etc) ;
Set up an independent regulator - Nigerian Electricity Regulatory Commission (NERC); The launch of the Roadmap for Power Sector Reform by President Goodluck Jonathan in
August 2010. The transfer of assets , liabilities and staff of NEPA to PHCN’s Companies to carry on the
role of bulk trading in transition and liability management: o Nigeria Bulk Electricity Trading Co Plc, and o Nigerian Electricity Liability Management Company (NELMCO) ;
In order to fast-track the implementation of the power sector reform, a Presidential Task Force on Power (PTFP) was established by Mr President in June 2010 to drive the

28
implementation of the reform of Nigeria's power sector covering Generation, Transmission, Distribution, Fuel-to-Power as well as Regulatory and Transaction.
Liquidation Committee established on April 12, 2011 to seamlessly wind down the operations of PHCN
Barriers to Private Investment in new on-grid and off-grid There are a number of critical gaps and barriers, mainly financial, institutional and technical which limit the deployment of off grid and on grid power generation. Some of the key gaps and barriers are as follows:
Although costs are decreasing, RET are still expensive. However, if externalities (environmental costs) are accounted for, some RET might be cost effective
Because of the low density of rural areas, rural electrification projects are expensive and the capital cost per capita is high and the purchasing power of rural communities low.
The lack of adequately qualified electrical contracting companies locally presents a major problem
Lack of PV installers for certain regions in the country. Weak indigenous private sector: The capital base of the Nigerian private sector has not
been strong enough to finance the energy and power infrastructure which is slowing down the effect of liberalization and privatization of the sector.
Poor electricity pricing regime and weak revenue collation system Deplorable state of the electricity industry Management of the huge liabilities of PHCN
28. Modern energy for productive sectors: Financing remains a key barrier to a wider deployment of renewable energy on a large scale particularly from small hydro power and solar. Financial mechanisms such as feed in tariffs and purchase power agreement (PPA) may contribute to overcome these barriers. This implies a regulatory framework with guaranteed long-term incentives for private investors.
3.4 GAPS AND BARRIERS
29. Thermal energy for households:
Prohibitive taxes and tariffs, inadequate regulatory standards, poor coordination between grid and off-grid electrification and the overall acceptance of RE & EE strategies into national electrification strategies remain key challenges.
30. Power sector: Inability of public and IPPs developers to access gas supply from the Nigeria Gas
Company has been the bigger challenge for the power sector reform to deliver additional generation capacity.
The lack of implementation of the REMP has contributed to the persistent energy poverty, which has exacerbated economic poverty at a larger scale.
Rural Electrification Programme has not recorded the required impact due to lack of financial resources.
Small scale off grid, decentralized renewable energy plants are not given much priority in the national strategy for power expansion.
31. Modern energy for productive sectors:
The main challenge regarding electricity is to ensure that rural electrification is not limited to providing only basic services for households. Most rural electrification

29
programmes including in Nigeria (because of the high costs involved) are targeting only marginally productive end uses although reaching households is considered as a major achievement.
32. Summary: key gaps, barriers and additional requirements. - The key challenge for the power sector remains to meet the increasing electricity demand with limited installed capacity in the country coupled with the persistent lack of gas supply. - Despite the ESPR Act, which encourages private sector investment, the absence of a formal power market model, is a major constraint for the market participants and IPP developers who need to understand the Government’s policy with respect to the market model in order for them to pursue development consistent with the market rules. - Local investors and financial institutionsoften lack the technical and financial resources and expertise to develop and promoterenewable energy technologies. - Local financiers and developers often cannot design and or implement appropriate financing packages adapted to RET. - Lack of clarity on tariff regime, inadequate regulatory standards, poor coordination between grid and off-grid electrification and the overall acceptance of RE & EE strategies into national electrification strategies should be addressed. - The non-cost-reflective tariffs and inadequate revenue collection might be a big challenge in the context of rural electrification. - For most large-scale technology projects the country remains highly dependent on foreign expertise. - The lack of national renewable energy targets and/or other measures to incentivize the introduction of carbon-neutral generation capacity is a major constraint to the deployment of RES

30
Annex 1 –Matrix of existing programs and required financing for achievement of SE4ALL goals
1.1 On-going initiatives by the Government and development partners Title Lead
Agency Possible Financier
SE4ALL Goals Brief description and time frame
Estimated cost, N$
USAID Energy access Also focus on building knowledge for legislators, banks and consumers, and matching projects with investors
$10-32m
Renewable Energy and Energy efficiency Project
Ministry of Power
GIZ/EU Energy efficiency and Renewable energy
Technical assistance for Pilot projects in three states (4years)
9m euros
Nigeria Electricity and Gas Improvement Project
Ministry of Power
World Bank (WB)
Energy access (FY2012) $200M
Nigeria Energy Efficiency Project
UNDP/ECN
GEF Energy efficiency Data gathering for energy performance standards, set up of testing centres, focus behaviour change awareness
$5m
Access To Renewable Energy (ATRE)
UNDP BOI Renewable energy
Scale up initiative
UNIDO GEF Renewable energy
Mini-grid based on renewable energy sources to augment rural electrification
GEF GEF Energy access Small scale Associated Gas Utilization Project
Katsina State
JICA Renewable energy
Solar Project in Katsina
Niger State, ICEED
Swiss Embassy
Energy access Efficient woodstoves pilot project
________________________________________________________________________________

31
Selected references
Federal Republic of Nigeria: National Energy Policy 2005 Federal Republic of Nigeria-Energy Commission of Nigeria: Renewable Master Plan. November 2005. Shaad, B and E.Wilson (2009) ‘Access to Sustainable Energy: What role for international oil and gas companies? Focus on Nigeria.’ IIED, London. http://www.iied.org/pubs/display.php? o=16022IIED. More for Less: How Decentralized Energy Can Deliver Cleaner, Cheaper and More Efficient Energy in Nigeria. A report by the World Alliance for Decentralized Energy (WADE), Christian Aid and the International Centre for Environment and Energy Development (ICEEED) 2009. Nigeria Vision 20:2020: Economic Transformation Blueprint. December 2009. EIA Country Analysis Brief: Nigeria, http://www.eia.doe.gov/emeu/cabs/nigeria.html Electric Power Sector Reform (EPSR) Act 2005 National Energy Databank, www.nationalenergydatabank.org

32
List of figures
Figure 1. Total Energy Consumption in 2006 ..................................................................................... 7 Figure 2- Nigeris Power Generation by Fuel Type .............................................................................. 4 Figure 3- Power Losses as a Percentage of Genearation ................................................................... 15 Figure 4- Sectoral Contribution to GDP in Percentages for the years 2010-2011 (SOURCE: NBSEconommic Outlook 2012-2015 Report)…………………………………………………………………….. Figure 5- Fuels used for cooking and access to modern fuels (National), Adapted from UNDP Energy Access in Developing Countries Report, 2009……………………………………………………………….. Figure 6- Fuels used for cooking and access to modern fuels (Rural), Adapted from UNDP Energy Access in Developing Countries Report, 2009 .................................. Error! Bookmark not defined. Figure 7- Fuels used for cooking and access to modern fuels (Urban), Adapted from UNDP Energy Access in Developing Countries Report, 2009. Out of these only 6% of Nigerians have access to Improved Cooking Stoves (ICS) ........................................................ Error! Bookmark not defined. Figure 8- Share of Population using solid fuels for cooking with access to ICS for selected countries (SOURCE: UNDP, Energy Access Situation in Developing Countries, 2009)Error! Bookmark not defined. List of Tables Table 1-Basic socio-economic /energy data.
Table 2- 2009 Energy Balance for Nigeria.
Table 3- Tariff Comparison across 6 West African Countries.
Table 4- Multi-Year Tariff Order (MYTO) 2012
Table 5- 2012 Tariff Schedule
Table 6- Electricity Use by Sector