
NIGERIA: PRE AND POST CAMEL ANAYLSIS Kenn · PDF filebanks survivals in Nigerian: pre and post...
19
European Journal of Accounting, Auditing and Finance Research Vol.3, No.9, pp.12-30, September 2015 ___Published by European Centre for Research Training and Development UK ( www.eajournals.org) 12 ISSN 2053-4086(Print), ISSN 2053-4094(Online) EFFECTS OF RECAPITALISATION ON COMMERCIAL BANKS SURVIVAL IN NIGERIA: PRE AND POST CAMEL ANAYLSIS Kenn-Ndubuisi, Juliet Ifechi Ph.D Student,Department of Banking and Finance, Rivers State University of Science and Technology Nkpolu - Port Harcourt, Rivers State, Nigeria Henry Waleru Akani, Department of Banking and Finance, Rivers State University of Science and Technology Nkpolu - Port Harcourt, Rivers State, Nigeria ABSTRACT: This paper examined the analysis effects of recapitalization on commercial banks survivals in Nigerian: pre and post camel analysis. This is because the banking industry in Nigeria has witnessed a lot of transformation as a result of the restructuring programmes channeled towards resolving the existing problems of the industry by the central bank of Nigeria. The banking consolidation and recapitalization of commercial banks exercise which has shaped the structure of the Nigerian banking industry significantly. This was driven by the need to strengthen the banking sector and reposition the banks to be strong in order to meet up with the internationalization of financial and business globalization best practices. The exercise was deemed necessary because having a strong capital base increasing their ability to assume risk and absorb losses. The study used an Ex-post-facto research design comprising of pooled data which employs the use of secondary data covering a thirteen years period pre and post recapitalization (2006- 2012) using 10 out of the 25 banks that emerged after the transformation to test the effect of the reform . Chow test was used to check for structurally difference between the pre and post period using CAMEL framework as indicators for measurement. The result of the regression model of Minimum capital base on capital adequacy, asset quality, management quality and earnings quality and liquidity indicated an increase after recapitalization and consolidation but only Capital adequacy and management quality had a structurally difference with the increment. Based on the findings, it is discovered that recapitalization and consolidation is a welcome development that is needed by the banks but it cannot stand alone in achieving all round soundness and stability desired by Central Bank of Nigeria, little thereafter we are still faced with the post 2006 distress of banks even after the huge recapitalization reform and the Central Bank of Nigeria bailing out 8 banks with over 400 billion in 2012. Therefore, we recommend among other things the strict compliance to corporate governance practices, zero tolerance on misreporting and fraudulent practices, enforcing laws like the liabilities of board members of failing banks and finally, every business needs an enabling environment to enhance profitability. KEYWORD: Recapitalization Reform, Corporate Governance, Business Global Best Practices
Transcript of NIGERIA: PRE AND POST CAMEL ANAYLSIS Kenn · PDF filebanks survivals in Nigerian: pre and post...

European Journal of Accounting, Auditing and Finance Research
Vol.3, No.9, pp.12-30, September 2015
___Published by European Centre for Research Training and Development UK (www.eajournals.org)
12
ISSN 2053-4086(Print), ISSN 2053-4094(Online)
EFFECTS OF RECAPITALISATION ON COMMERCIAL BANKS SURVIVAL IN
NIGERIA: PRE AND POST CAMEL ANAYLSIS
Kenn-Ndubuisi, Juliet Ifechi
Ph.D Student,Department of Banking and Finance,
Rivers State University of Science and Technology
Nkpolu - Port Harcourt, Rivers State, Nigeria
Henry Waleru Akani,
Department of Banking and Finance,
Rivers State University of Science and Technology
Nkpolu - Port Harcourt, Rivers State, Nigeria
ABSTRACT: This paper examined the analysis effects of recapitalization on commercial
banks survivals in Nigerian: pre and post camel analysis. This is because the banking
industry in Nigeria has witnessed a lot of transformation as a result of the restructuring
programmes channeled towards resolving the existing problems of the industry by the central
bank of Nigeria. The banking consolidation and recapitalization of commercial banks
exercise which has shaped the structure of the Nigerian banking industry significantly. This
was driven by the need to strengthen the banking sector and reposition the banks to be strong
in order to meet up with the internationalization of financial and business globalization best
practices. The exercise was deemed necessary because having a strong capital base
increasing their ability to assume risk and absorb losses. The study used an Ex-post-facto
research design comprising of pooled data which employs the use of secondary data covering
a thirteen years period pre and post recapitalization (2006- 2012) using 10 out of the 25
banks that emerged after the transformation to test the effect of the reform . Chow test was
used to check for structurally difference between the pre and post period using CAMEL
framework as indicators for measurement. The result of the regression model of Minimum
capital base on capital adequacy, asset quality, management quality and earnings quality
and liquidity indicated an increase after recapitalization and consolidation but only Capital
adequacy and management quality had a structurally difference with the increment. Based on
the findings, it is discovered that recapitalization and consolidation is a welcome
development that is needed by the banks but it cannot stand alone in achieving all round
soundness and stability desired by Central Bank of Nigeria, little thereafter we are still faced
with the post 2006 distress of banks even after the huge recapitalization reform and the
Central Bank of Nigeria bailing out 8 banks with over 400 billion in 2012. Therefore, we
recommend among other things the strict compliance to corporate governance practices, zero
tolerance on misreporting and fraudulent practices, enforcing laws like the liabilities of
board members of failing banks and finally, every business needs an enabling environment to
enhance profitability.
KEYWORD: Recapitalization Reform, Corporate Governance, Business Global Best
Practices
European Journal of Accounting, Auditing and Finance Research
Vol.3, No.9, pp.12-30, September 2015
___Published by European Centre for Research Training and Development UK (www.eajournals.org)
13
ISSN 2053-4086(Print), ISSN 2053-4094(Online)
INTRODUCTION
The financial sector is one of the dominant sectors in any economy because of its
involvement in the promotion of economic growth and development. Banks are key players
in the financial sector because of their unique role as financial intermediary. As
intermediaries, they (banks) facilitate capital that enhances productivity thereby promoting
economic growth. However, banks’ ability to play the positive role in economic growth and
development depends on the health, soundness and stability of the financial system.
The need for an effective and efficient banking system lies in the fact that it is one of the few
sectors in which the shareholders fund is only a small portion of the liabilities. It is, therefore,
not surprising that the banking industry is one of the most regulated sectors in any economy.
In spite of government efforts in protecting the banks, failures and distress prevails due to bad
management, poor asset base and unprofitable operations amongst others and these failures
has serious implication for the financial system which by extension, affects the economy as a
whole as a result of the global financialization and integration of Business. Based on the fact
that banks generate financial resources and put these at the disposal of deficit economic unit
for increased consumption or output. Among the measures utilized to strengthen banks in
Nigeria from financial distress are capital regulations by the central bank of Nigeria.
Capitalization and consolidation is an important component of reforms in the Nigeria banking
industry, owing to the fact that a bank with a strong capital base has the ability to absolve
losses arising from non performing liabilities. Attaining capitalization requirements may be
achieved through consolidation of existing banks through mergers and acquisition or raising
additional funds through the capital market which is the market for long term funds. A look at
the history of banking in Nigeria reveals that the capital base of banks has been changed
from time to time since 1980. “From a modest value of N10 million naira minimum paid-up
capital in 1988, Nigerian commercial banks were required to maintain capital not below N50
million in 1991. Between 1991 and 2005 subsequent increases have also been made ranging
from N500 million in 1997; N1billion in 2001; N2 billion in 2002 to N25 billion in 2005”
(Onaolapo, 2006, Eagi and Akani, 2012)
The recapitalization policy of 2004/ 2005 by the central bank has been a major reform in the
history of Nigeria banking because of the leap in the movement of the minimum paid up
capital from N2 billion to N25 billion in asset base bringing about a reduction in the total
number of banks in the country from 89 to 25. The reform was expected to enhance better
performance, efficiency, stability, profitability, liquidity and reduce bank failure by
increasing their ability to assume risk. Prior to the reformation, the state of the Nigerian
banking sector was weak, exposed to failures due to bad management, poor asset base, gross
insider abuse, weak corporate governance, insolvency, lost of confidence by customers and
overdependence on public sector deposit.
Imala (2005) posited that the objectives of banking system are to ensure sound stability and
facilitate sustained rapid economic growth and development. This phenomenon has
necessitated continuous financial sector reforms globally and in 1988, an international
agreement among the banking authorities known as Basle agreement was reached. The main
objective of this international agreement is to apply a common set of rules for capital
adequacy in order to minimize the risk of bank failures. Through all the recapitalization
procedures, banks that fell short either had to face merger/ acquisition and “forcely marriage”
European Journal of Accounting, Auditing and Finance Research
Vol.3, No.9, pp.12-30, September 2015
___Published by European Centre for Research Training and Development UK (www.eajournals.org)
14
ISSN 2053-4086(Print), ISSN 2053-4094(Online)
or go into distress. (CBN financial bulletin 2001-2004). Various theorists have presented
findings on the reasons behind increase in capital requirements for commercial banks. Adam
(2003) traced the increase in capital requirements as taking its roots from bank failures.
Adedipe (2005) argued that the most fundamental reason for increase in capital requirements
was due to growing distress in the industry which was identified as the real threat of
imminent bank failures. In Zimbabwe some banks were put under curatorship because of
their involvement in specula. This is further supported by Imala (2005) who identified four
rationales behind banking system reform. These were low capital base of banks, a large
number of small banks with relatively few branches, the dominance of a few banks and poor
rating of a number of banks, the study concluded that bank failures was the major drive for
recapitalization in countries like Greece and Nigeria.
Adeyemi (2012) as cited in Soludo (2004) recapitalization of the banking sector was
necessitated by the high concentration of the sector by small banks with capitalization of less
than $10 million, each with expensive headquarters, separate investment in software and
hardware, heavy fixed costs and operating expenses, and with bunching of branches in few
commercial centers - leading to very high average cost for the industry. With the increasing
trend of satisfactory” banks declining steadily from 63 in 2001 to 51 in 2004. In the same
vein, the number of banks that were “marginal” increased from 8 in 2001 to 16 in 2004.
“Unsound” banks also increased from 9 in 2001 to 10 in 2004. This trend has called to
question the stability of banking system in Nigeria.
Onaolapo (2008) and Soyinbo and Adekanye (2008) concluded that increasing capital
requirements was a result of inadequate capital base, mismanagement of funds, overtrading,
lack of regulation and control; and unfair competition from the foreign banks. Oleka and
Mgbodile (2014) agreed that recapitalization is necessary because a bank with a strong
capital base has the ability to absorb losses arising from non performing loans and advances.
In a special session of the Bankers Committee on July 6, 2004 the Governor of the Central
Bank of Nigeria, Professor Charles Soludo, unveiled a 13-point reform agenda to bank chiefs
which included an upward review of banks capital base from N2 billion to N25 billion. In
explaining the need for re-capitalization, he stated that banking system is fragile and
marginal, they have not played their expected role in the development of the economy
because of their weak capital base which has resulted in persistent illiquidity, unprofitable
operations and poor asset base and as such, the decision to raise the capital base of banks, the
first phase of the reforms was with the aim of strengthening and consolidating the banking
system in order to ensure a diversified, strong and reliable banking sector which is
compliance with the Basle agreement so as to ensure the safety of depositors’ money,
increases confidence, play active development roles in the Nigerian economy and also
become competent and competitive in the regional and global financial system. It will also
serve as a buffer to stem the systemic distress that has continued to rock the banking system.
Adeyemi (2012).
The fragile state of the Nigerian Banking Sector in the pre- recapitalization exercise is so bad
that, only ten banks (10) out of the eight-nine (89) in operation accounted for 51.9% of total
assets, 55.4% of total deposit liabilities, and 42.8% of total credit (CBN, 2004). The rating of
the licensed banks in operation, using the CAMEL parameters, revealed that ten (10) banks
European Journal of Accounting, Auditing and Finance Research
Vol.3, No.9, pp.12-30, September 2015
___Published by European Centre for Research Training and Development UK (www.eajournals.org)
15
ISSN 2053-4086(Print), ISSN 2053-4094(Online)
were “sound”, fifty-one (51) were “satisfactory”, sixteen (16) were rated “marginal” and ten
(10) banks were rated “unsound” in 2004 (CBN, 2004).
However, bank management components comprises of asset, liquidity, liability, capital
adequacy and risk management, which portray a measure of sensitivity. Therefore, if the
increment in the minimum paid up capital was to achieve the benefits above and save the
banking sector from collapse, it means that it must impact the asset, liquidity, liability, capital
adequacy and risk areas of the bank, hence the need for the use of CAMEL framework to
assess the effect of recapitalization on commercial banks in Nigeria becomes imperative. As
used also in studies like Kngiri (2012) and Anwarul (2012).
The Basle Committee on Banking Supervision of the Bank of International Settlements has
recommended using capital adequacy, assets quality, management quality, earnings and
liquidity (CAMEL) as criteria for assessing a Financial Institution in 1988 (ADB 2002). The
sixth component, market risk (S) was added to CAMEL in 1997 (Gilbert, Meyer and
Vaughan 2000). However, most of the developing countries are using CAMEL instead of
CAMELS in the performance evaluation of the Financial Institutions. CAMELS framework
is a common method for evaluating the soundness of Financial Institutions and its use has
been growing both locally and internationally. This system was developed by regulatory
authorities of the U.S banks. The Federal Reserve Bank, the Comptroller of the Currency and
the Federal Deposit Insurance Corporation all use this system (McNally 1996).
Has the recapitalization policy which started 2004 and in December 2005, implemented by
the commercial banks in 2006 which was basically a review of their minimum paid up capital
been able to achieve its stated objectives? If so, why the post- recapitalization reports of
failing banks? What are the causes of recapitalization and the limitations associated with
recapitalizing?
This study aims at investigating the effect of recapitalization on commercial banks in Nigeria
by utilizing data from 10 banks that existed before and after the recapitalization reform of
2004.
Objective of the Study
The main objective of the study is to ascertain the effect of the recapitalization policy
implemented by the commercial banks in Nigeria.
Specifically, the objectives of the study includes
Evaluate the effects of recapitalization on the capital adequacy of commercial banks
in Nigeria.
Evaluate the effects of recapitalization on the asset quality of commercial banks in
Nigeria.
Evaluate the effects of recapitalization on management quality of commercial banks
in Nigeria.
Evaluate the effects of recapitalization on profitability of commercial banks in
Nigeria.

European Journal of Accounting, Auditing and Finance Research
Vol.3, No.9, pp.12-30, September 2015
___Published by European Centre for Research Training and Development UK (www.eajournals.org)
16
ISSN 2053-4086(Print), ISSN 2053-4094(Online)
Evaluate the effects of recapitalization on liquidity of commercial banks in Nigeria.
Research Questions
Has the level of minimum paid up capital improved the capital adequacy ratio of
commercial banks in Nigeria.
Has the level of minimum paid up capital improved the asset quality ratio of
commercial banks in Nigeria.
Has the level of minimum paid up capital improved the management quality of
commercial banks in Nigeria.
Has the level of minimum paid up capital improved the profitability ratio of
commercial banks in Nigeria.
Has the level of minimum paid up capital improved the liquidity ratio of commercial
banks in Nigeria.
Statement Of Hypotheses
H01: Bank recapitalization does not have a significant effect on its capital adequacy.
Ho2: Bank recapitalization does not have a significant effect on its asset quality
Ho3 : Bank recapitalization does not have a significant effect on its management quality.
Ho4: Bank recapitalization does not have a significant effect on its profitability
Ho5 : Bank recapitalization does not have a significant effect on its liquidity.
Empirical Studies on Recapitalisation
Nasiru et al (2012) conducted a study that sort to answer if capital regulations had only a
short term effect on addressing liquidity or a long term effect of forstalling distress using data
from commercial banks from 1997 – 2006. They discovered a positive relationship between
increase in minimum capital base and commercial banks liquidity and asset quality levels.
But with the post 2006 crises, they concluded that increased capital requirement alone only
accounts for a short term remedy.
Adegbaju and Olokoyo (2008) in their study investigated the impact of previous
recapitalization in the banking system on the performance of the banks in the country with
the aim of finding out if the recapitalization is of any benefit using both descriptive statistical
analysis such as means and standard deviations and analytical techniques such as the t-test
and the test of equality of means. According to Akani,(2013), it was found that the mean of
key profitability ratio such as the Yield on earning asset (YEA), Return on Equity (ROE) and
Return on Asset (ROA) were significant meaning that there is statistical difference between
the mean of the bank before 2001 recapitalization and after 2001 recapitalization. The study
recommended that the banks should improve on their total asset turnover and to diversify
their funds in such a way that they can generate more income on their assets, so as to improve
their return on equity.
European Journal of Accounting, Auditing and Finance Research
Vol.3, No.9, pp.12-30, September 2015
___Published by European Centre for Research Training and Development UK (www.eajournals.org)
17
ISSN 2053-4086(Print), ISSN 2053-4094(Online)
Oleka and Mgbodile (2014) studied 17 banks out of the 25 banks that emerged out of the 89
banks that were in operation in 2004 before the reform covering a ten year-period (2002-
2012) to see the significance of the reform. The study found that there was significant
difference in the performance of banks before and after the reforms as evidenced by
improved yields in the ratios used as performance measures. The ratios used as performance
indicators in this work showcased higher yields in the post-recapitalization as against the
lower yields before the reform. They concluded that it has changed the market structures of
banks by increasing the operational efficiency and raising their earnings potentials.
Bakare (2011) as cited in Alajekwu, and Obialor, (2014) examined the trend and the growth
implications of bank capitalization in Nigeria. The secondary data used for the study were
processed using sample test technique for difference between two means so as to compare the
means of the variables before and after recapitalization to see if there is any significant
difference between the two periods. The result indicated that post recapitalization mean at
21.58 is higher than the pre recapitalization mean of 15.09, implying that banks are more
adequately capitalized and less risky after the programme. This result also indicated that
recapitalization has low but significant influence on the growth of Nigerian economy
compare to other variables in the model.
Sani, and Alani, (2013) as cited in Obadan (2004) and Agundu, Akani, and Agbahiwe held
the view that the N25 billion would not guarantee banks soundness unless fundamental cases
of distress in the banks are tackled. Some factors were itemized such as adverse internal and
external stocks, unstable economic policies, adverse conditions and unguarded liberations of
entry into banking industry, reckless use of depositors fund and inadequate supervision and
enforcement of regulations may constitute some draw backs to the policy.
METHODOLGY
The study adopted a panel data and an ex-post-facto research design. An ex-post facto
research uses historical information in studying existing phenomenon with the intent to using
the result to understand the current trend in the issues under study and Panel data combines
both time series and cross- sectional data. Minimum paid up capital of different times during
the (2000- 2012) study years were collected so as to test the effect of the reform using 2006
as our base year, testing the capital adequacy, asset quality, management quality, earnings/
profitability and liquidity ratios. The study employed secondary data collected from the
quoted financial statement of ten banks as our sample study out of the twenty- five
commercial banks that emerged after the recapitalization process, journals, textbooks and
Central bank (CBN) annual bulletin of various issues wee also applied in the course of this
analysis. Data analysed using the Chow test to testing for structural or parameter stability of
regression models.
Description of Variables
Credit agencies, researchers, and bank regulators tend to evaluate banks‟ performance on the
basis of a formal approach called CAMELS bank assessment system. The CAMELS rating is
a supervisory rating system that originated from the United States to classify a bank’s overall
condition. The ratings are assigned based on ratio analysis of the financial statement

European Journal of Accounting, Auditing and Finance Research
Vol.3, No.9, pp.12-30, September 2015
___Published by European Centre for Research Training and Development UK (www.eajournals.org)
18
ISSN 2053-4086(Print), ISSN 2053-4094(Online)
combined with on-site examinations made by a designated supervisory regulator. The
components of a bank’s condition that are assessed includes six performance measures:
capital adequacy, asset quality, management quality, profitability/ earning, liquidity and
sensitivity to market risk. This study settled for the first five which includes Capital
adequacy, Asset, Management, Earnings/ profitability and Liquidity.
CAPITAL ADEQUANCY (CAR): capital to risk (weighted) asset ratio. It is the ratio of
bank’s capital to its risk. It offers a good measure of the degree of loss a bank can withstand
before wiping out shareholders equity.
Capital Adequacy Ratio = Tier 1 capital + Tier 2 capital / Risk weighted assets Tier 1 capital
absorbs losses without a bank being required to cease trading and Tier2 absorbs losses in the
event of a winding up and so provides a lesser degree of protector to depositors. If CAR
determines the bank’s capacity to meet time liabilities and other risks such as credit risk and
operational risk, that means post recapitalization should be better than pre recapitalization.
ASSET QUALITY: this is the evaluation of asset to measure the credit risk associated with
it. The most common asset requiring strict determination of asset quality is loans which can
be non-performing assets if borrowers default on repayment obligations. Poor asset quality
has been one of the major causes of bank failures in Nigeria. Asset quality ratio = loan loss
provision / Total loans.
MANAGEMENT QUALITY: Organizational efficiency and effectiveness in achieving
quality objective are contributed by identifying, understanding and managing all interrelated
processes as a system. Management in business is an art that coordinates the efforts of people
to accomplish goals and objectives using available resources effectively. People at all levels
of an organization are the essence of it since their complete involvement enables their
abilities to be to be used for the benefit of the organization therefore poor remunerations and
benefit was found by Alkeli (2008) be one of the sources of operational inefficiency.
However, the ultimate key decisions are made by the managers. Management quality ratio =
Salaries & benefits / Total asset
EARNINGS: A bank functions to make profit through its operations and through their
policies, some are paid out as dividend and others retained for investment and expansion
purposes. Return on capital employed will be used as proxy for profitability. ROCE is the
ratio of net operating profit of a bank to its capital employed. It measures the success of a
bank in generating satisfactory profit on capital invested. ROCE = Earnings before interest
and tax (EBIT) / Capital employed.
LIQUIDITY: this is the measure of the ability and ease with which assets can be converted
to cash. Liquidity ratio is a statutory required condition. Cash reserve and liquid assets ratios
are annually prescribed by the monetary authorities. Therefore, the main challenge to a bank
is to ensure its own liquidity under all reasonable conditions. The ability of banks to meet its
periodic cash demand of customers is a measure of its strength and an assurance for
depositors’ confidence. The higher the liquidity ratio, the higher the margin of safety that
bank possesses to meet its current liabilities. Liquidity ratio = Total loans and advances /
Current liabilities.
European Journal of Accounting, Auditing and Finance Research
Vol.3, No.9, pp.12-30, September 2015
___Published by European Centre for Research Training and Development UK (www.eajournals.org)
19
ISSN 2053-4086(Print), ISSN 2053-4094(Online)
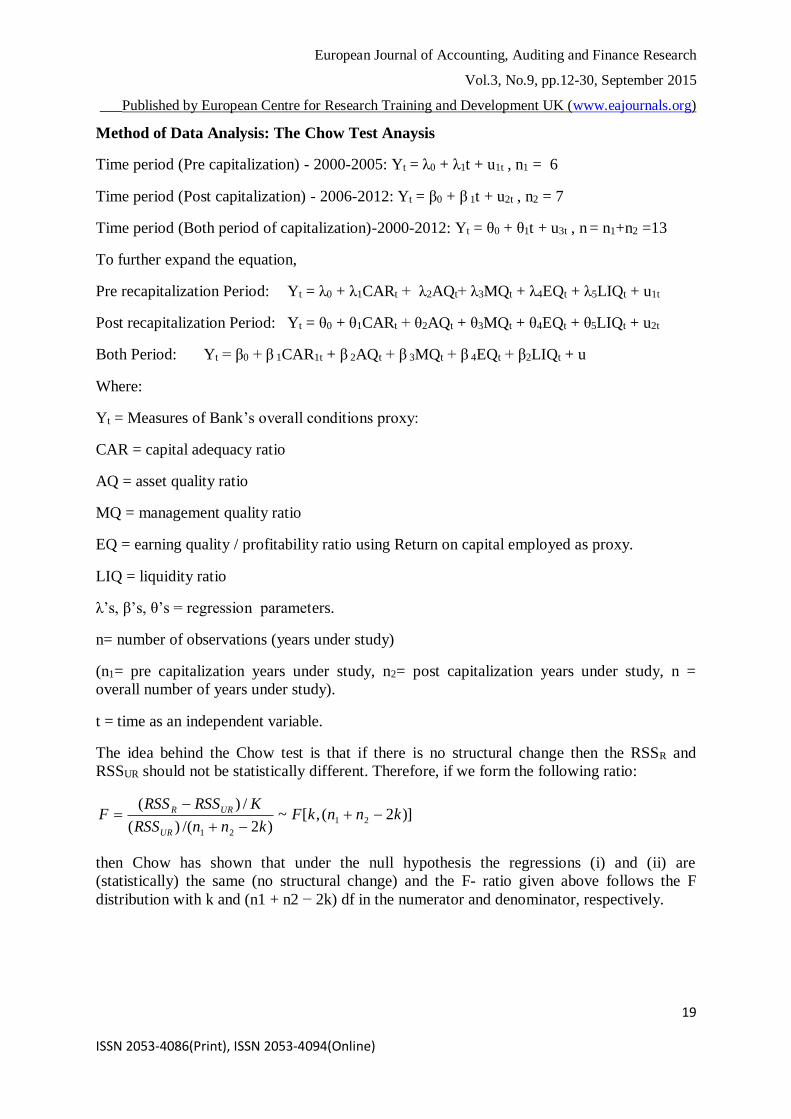
Method of Data Analysis: The Chow Test Anaysis
Time period (Pre capitalization) - 2000-2005: Yt = λ0 + λ1t + u1t , n1 = 6
Time period (Post capitalization) - 2006-2012: Yt = β0 + β 1t + u2t , n2 = 7
Time period (Both period of capitalization)-2000-2012: Yt = θ0 + θ1t + u3t , n = n1+n2 =13
To further expand the equation,
Pre recapitalization Period: Yt = λ0 + λ1CARt + λ2AQt+ λ3MQt + λ4EQt + λ5LIQt + u1t
Post recapitalization Period: Yt = θ0 + θ1CARt + θ2AQt + θ3MQt + θ4EQt + θ5LIQt + u2t
Both Period: Yt = β0 + β 1CAR1t + β 2AQt + β 3MQt + β 4EQt + β2LIQt + u
Where:
Yt = Measures of Bank’s overall conditions proxy:
CAR = capital adequacy ratio
AQ = asset quality ratio
MQ = management quality ratio
EQ = earning quality / profitability ratio using Return on capital employed as proxy.
LIQ = liquidity ratio
λ’s, β’s, θ’s = regression parameters.
n= number of observations (years under study)
(n1= pre capitalization years under study, n2= post capitalization years under study, n =
overall number of years under study).
t = time as an independent variable.
The idea behind the Chow test is that if there is no structural change then the RSSR and
RSSUR should not be statistically different. Therefore, if we form the following ratio:
)]2(,[~)2/()(
/)(21
21
knnkFknnRSS
KRSSRSSF
UR
URR
then Chow has shown that under the null hypothesis the regressions (i) and (ii) are
(statistically) the same (no structural change) and the F- ratio given above follows the F
distribution with k and (n1 + n2 − 2k) df in the numerator and denominator, respectively.
European Journal of Accounting, Auditing and Finance Research
Vol.3, No.9, pp.12-30, September 2015
___Published by European Centre for Research Training and Development UK (www.eajournals.org)
20
ISSN 2053-4086(Print), ISSN 2053-4094(Online)
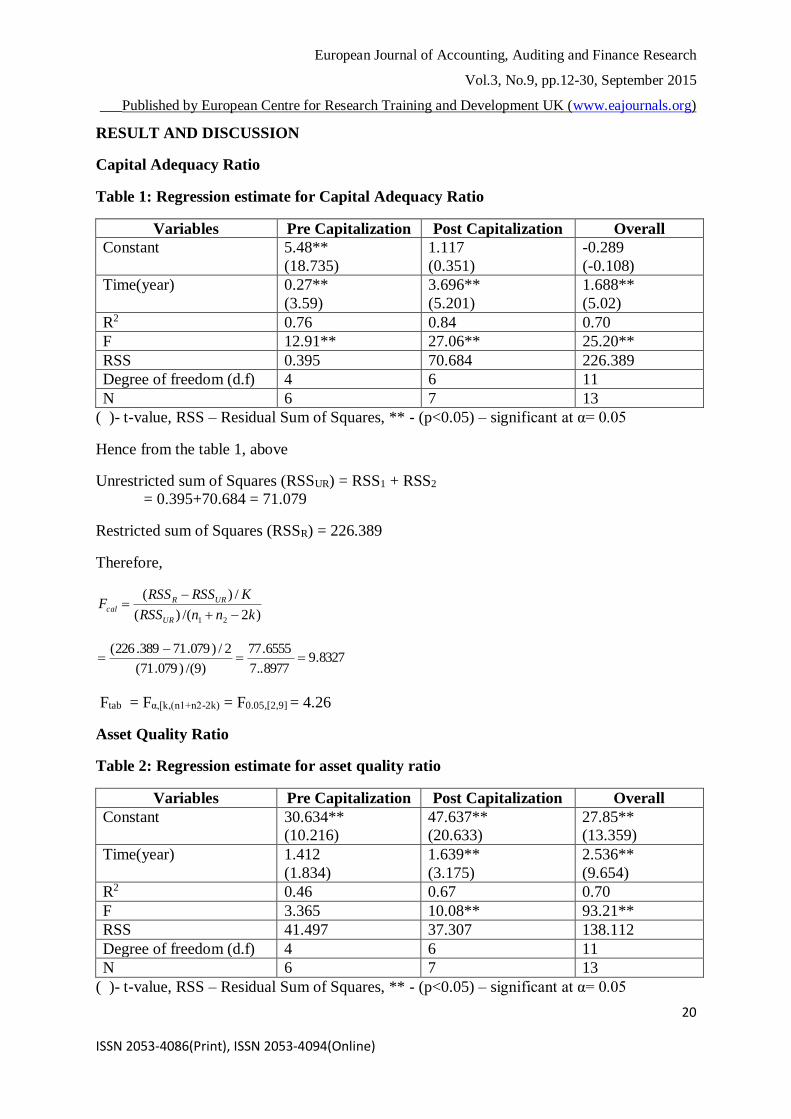
RESULT AND DISCUSSION
Capital Adequacy Ratio
Table 1: Regression estimate for Capital Adequacy Ratio
Variables Pre Capitalization Post Capitalization Overall
Constant 5.48**
(18.735)
1.117
(0.351)
-0.289
(-0.108)
Time(year) 0.27**
(3.59)
3.696**
(5.201)
1.688**
(5.02)
R2 0.76 0.84 0.70
F 12.91** 27.06** 25.20**
RSS 0.395 70.684 226.389
Degree of freedom (d.f) 4 6 11
N 6 7 13
( )- t-value, RSS – Residual Sum of Squares, ** - (p<0.05) – significant at α= 0.05
Hence from the table 1, above
Unrestricted sum of Squares (RSSUR) = RSS1 + RSS2
= 0.395+70.684 = 71.079
Restricted sum of Squares (RSSR) = 226.389
Therefore,
)2/()(
/)(
21 knnRSS
KRSSRSSF
UR
URRcal
8327.98977..7
6555.77
)9/()079.71(
2/)079.71389.226(
Ftab = Fα,[k,(n1+n2-2k) = F0.05,[2,9] = 4.26
Asset Quality Ratio
Table 2: Regression estimate for asset quality ratio
Variables Pre Capitalization Post Capitalization Overall
Constant 30.634**
(10.216)
47.637**
(20.633)
27.85**
(13.359)
Time(year) 1.412
(1.834)
1.639**
(3.175)
2.536**
(9.654)
R2 0.46 0.67 0.70
F 3.365 10.08** 93.21**
RSS 41.497 37.307 138.112
Degree of freedom (d.f) 4 6 11
N 6 7 13
( )- t-value, RSS – Residual Sum of Squares, ** - (p<0.05) – significant at α= 0.05

European Journal of Accounting, Auditing and Finance Research
Vol.3, No.9, pp.12-30, September 2015
___Published by European Centre for Research Training and Development UK (www.eajournals.org)
21
ISSN 2053-4086(Print), ISSN 2053-4094(Online)
The table 2 above suggest that
Unrestricted sum of Squares (RSSUR) = RSS1 + RSS2
= 41.497+37.307 = 78.804
Restricted sum of Squares (RSSR) = 138.112
Therefore,
)2/()(
/)(
21 knnRSS
KRSSRSSF
UR
URRcal
387.3756.8
654.29
)9/()804.78(
2/)804.78112.138(
Ftab = Fα,[k,(n1+n2-2k) = F0.05,[2,9] = 4.26
Management Quality
Table 3: Regression estimate for Management quality
Variables Pre Capitalization Post Capitalization Overall
Constant 39.78**
(13.468)
48.184**
(29.455)
36.202**
(16.038)
Time(year) -0.474
(-0.625)
-0.219
(-0.899)
0.981**
(3.449)
R2 0.09 0.62 0.67
F 0.391 3.389 11.898**
RSS 40.267 18.732 161.911
Degree of freedom (d.f) 4 6 11
N 6 7 13
( )- t-value, RSS – Residual Sum of Squares, ** - (p<0.05) – significant at α= 0.05
The table above shows that
Unrestricted sum of Squares (RSSUR) = RSS1 + RSS2
= 40.267+18.732 = 22.999
Restricted sum of Squares (RSSR) = 161.911
Therefore,
)2/()(
/)(
21 knnRSS
KRSSRSSF
UR
URRcal
179.275554.2
4556.69
)9/()999.22(
2/)999.22911.161(
Ftab = Fα,[k,(n1+n2-2k) = F0.05,[2,9] = 4.26
European Journal of Accounting, Auditing and Finance Research
Vol.3, No.9, pp.12-30, September 2015
___Published by European Centre for Research Training and Development UK (www.eajournals.org)
22
ISSN 2053-4086(Print), ISSN 2053-4094(Online)
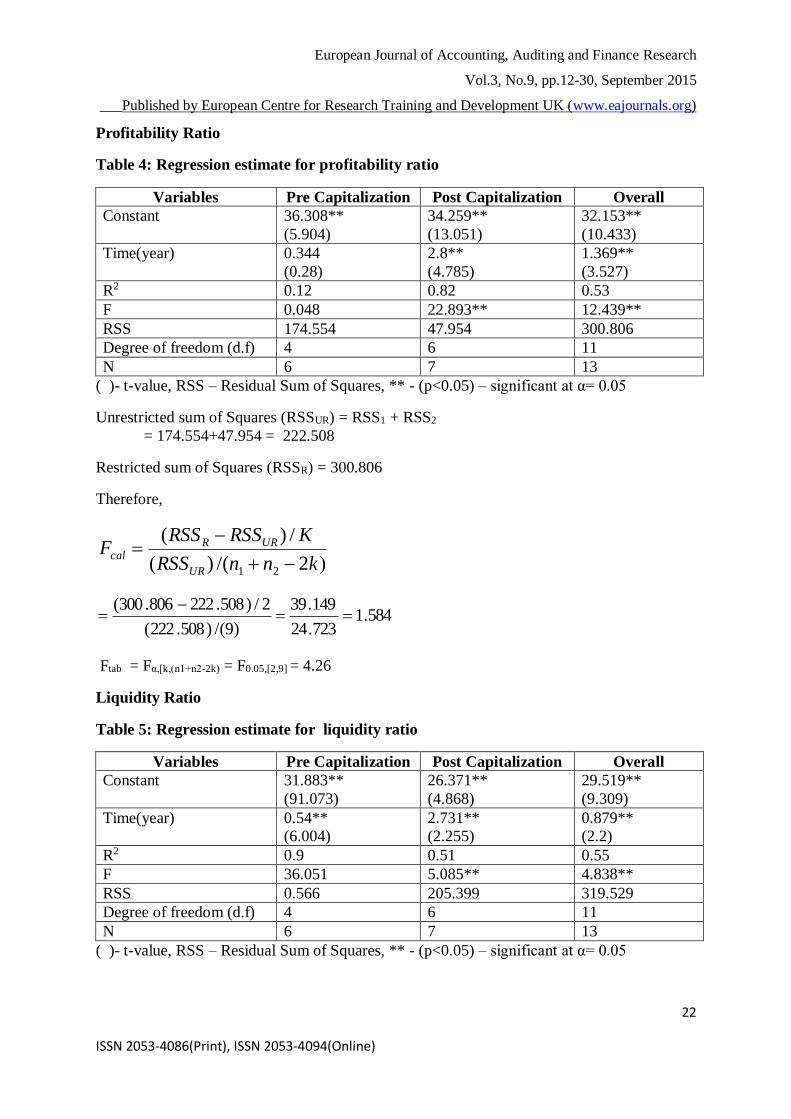
Profitability Ratio
Table 4: Regression estimate for profitability ratio
Variables Pre Capitalization Post Capitalization Overall
Constant 36.308**
(5.904)
34.259**
(13.051)
32.153**
(10.433)
Time(year) 0.344
(0.28)
2.8**
(4.785)
1.369**
(3.527)
R2 0.12 0.82 0.53
F 0.048 22.893** 12.439**
RSS 174.554 47.954 300.806
Degree of freedom (d.f) 4 6 11
N 6 7 13
( )- t-value, RSS – Residual Sum of Squares, ** - (p<0.05) – significant at α= 0.05
Unrestricted sum of Squares (RSSUR) = RSS1 + RSS2
= 174.554+47.954 = 222.508
Restricted sum of Squares (RSSR) = 300.806
Therefore,
)2/()(
/)(
21 knnRSS
KRSSRSSF
UR
URRcal
584.1723.24
149.39
)9/()508.222(
2/)508.222806.300(
Ftab = Fα,[k,(n1+n2-2k) = F0.05,[2,9] = 4.26
Liquidity Ratio
Table 5: Regression estimate for liquidity ratio
Variables Pre Capitalization Post Capitalization Overall
Constant 31.883**
(91.073)
26.371**
(4.868)
29.519**
(9.309)
Time(year) 0.54**
(6.004)
2.731**
(2.255)
0.879**
(2.2)
R2 0.9 0.51 0.55
F 36.051 5.085** 4.838**
RSS 0.566 205.399 319.529
Degree of freedom (d.f) 4 6 11
N 6 7 13
( )- t-value, RSS – Residual Sum of Squares, ** - (p<0.05) – significant at α= 0.05
European Journal of Accounting, Auditing and Finance Research
Vol.3, No.9, pp.12-30, September 2015
___Published by European Centre for Research Training and Development UK (www.eajournals.org)
23
ISSN 2053-4086(Print), ISSN 2053-4094(Online)
Unrestricted sum of Squares (RSSUR) = RSS1 + RSS2
= 0.566+205.399 = 205.965
Restricted sum of Squares (RSSR) = 319.529
Therefore,
)2/()(
/)(
21 knnRSS
KRSSRSSF
UR
URRcal
4812.2885.22
782.56
)9/()965.205(
2/)965.205529.319(
Ftab = Fα,[k,(n1+n2-2k) = F0.05,[2,9] = 4.26
Regression Analysis
Table 6: Regression Analysis of Mcap on CAR, AQ, MQ, EQ and LIQ.
Variables CAR AQ MQ EQ LIQ
Constant 3083.209
(0.615)
-35020.05**
(-5.692)
-73998.68**
(-5.466)
-24851.588
(-1.419)
-6733.766
(-0.33)
X 963.765**
(2.653)
1079.209**
(8.19)
2047.484**
(6.56)
935.439**
(2.26)
586.659
(1.038)
R2 0.39 0.859 0.796 0.319 0.089
F 7.036** 67.084** 43.039** 5.111** 1.078
( ) : t-value, ** - (p<0.05) – significant at α= 0.05,
ANALYSIS OF THE RESEARCH QUESTIONS
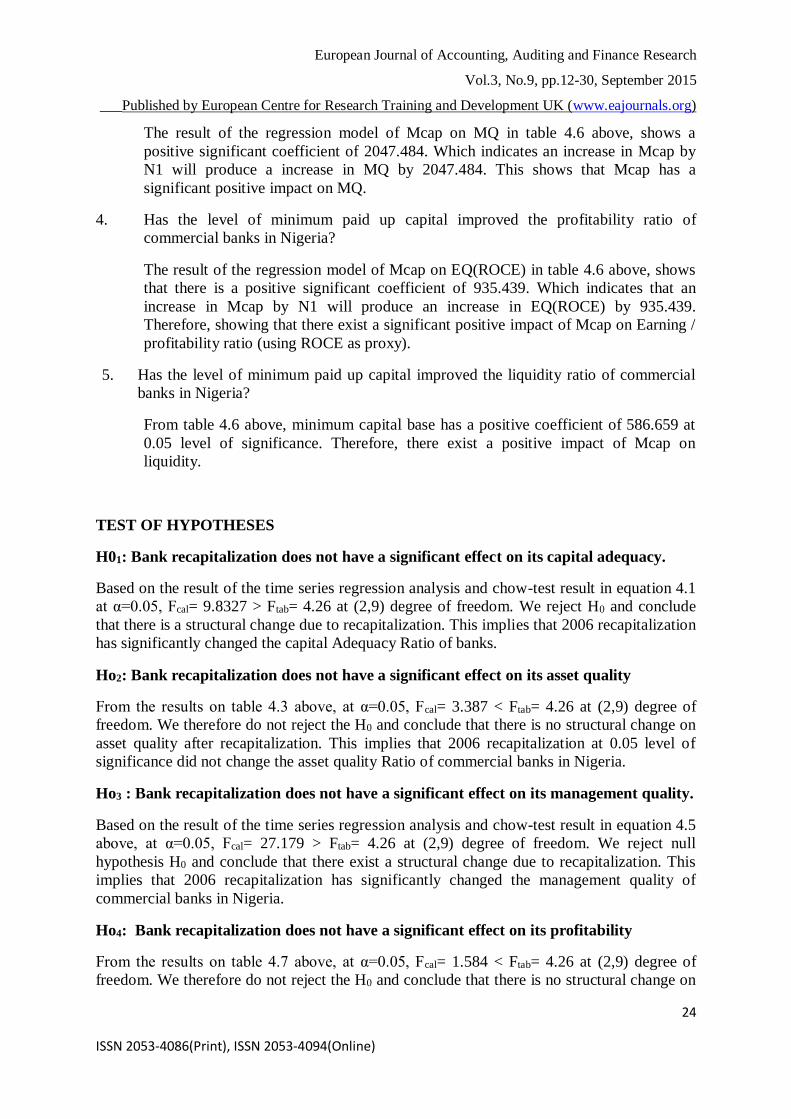
1. Has the level of minimum paid up capital improved the capital adequacy ratio of
commercial banks in Nigeria?
The result of the regression model of Mcap on CAR in table 4.6 shows a positive
significant coefficient of 963.765. Which indicates an increase in Mcap by N1 will
produce an increase in CAR by 963.765. Hence this implies that Mcap has a
significant positive impact on CAR.
2. Has the level of minimum paid up capital improved the asset quality ratio of
commercial banks in Nigeria?
The result of the regression model of Mcap on AQ in table 4.6 showed a positive
significant coefficient of 1079.209 indicating that an increase in Mcap by N1 will
produce an increase in AQ by 1079.209. This implies that Mcap has a significant
positive impact on AQ.
3. Has the level of minimum paid up capital improved the management quality of
commercial banks in Nigeria?
European Journal of Accounting, Auditing and Finance Research
Vol.3, No.9, pp.12-30, September 2015
___Published by European Centre for Research Training and Development UK (www.eajournals.org)
24
ISSN 2053-4086(Print), ISSN 2053-4094(Online)
The result of the regression model of Mcap on MQ in table 4.6 above, shows a
positive significant coefficient of 2047.484. Which indicates an increase in Mcap by
N1 will produce a increase in MQ by 2047.484. This shows that Mcap has a
significant positive impact on MQ.
4. Has the level of minimum paid up capital improved the profitability ratio of
commercial banks in Nigeria?
The result of the regression model of Mcap on EQ(ROCE) in table 4.6 above, shows
that there is a positive significant coefficient of 935.439. Which indicates that an
increase in Mcap by N1 will produce an increase in EQ(ROCE) by 935.439.
Therefore, showing that there exist a significant positive impact of Mcap on Earning /
profitability ratio (using ROCE as proxy).
5. Has the level of minimum paid up capital improved the liquidity ratio of commercial
banks in Nigeria?
From table 4.6 above, minimum capital base has a positive coefficient of 586.659 at
0.05 level of significance. Therefore, there exist a positive impact of Mcap on
liquidity.
TEST OF HYPOTHESES
H01: Bank recapitalization does not have a significant effect on its capital adequacy.
Based on the result of the time series regression analysis and chow-test result in equation 4.1
at α=0.05, Fcal= 9.8327 > Ftab= 4.26 at (2,9) degree of freedom. We reject H0 and conclude
that there is a structural change due to recapitalization. This implies that 2006 recapitalization
has significantly changed the capital Adequacy Ratio of banks.
Ho2: Bank recapitalization does not have a significant effect on its asset quality
From the results on table 4.3 above, at α=0.05, Fcal= 3.387 < Ftab= 4.26 at (2,9) degree of
freedom. We therefore do not reject the H0 and conclude that there is no structural change on
asset quality after recapitalization. This implies that 2006 recapitalization at 0.05 level of
significance did not change the asset quality Ratio of commercial banks in Nigeria.
Ho3 : Bank recapitalization does not have a significant effect on its management quality.
Based on the result of the time series regression analysis and chow-test result in equation 4.5
above, at α=0.05, Fcal= 27.179 > Ftab= 4.26 at (2,9) degree of freedom. We reject null
hypothesis H0 and conclude that there exist a structural change due to recapitalization. This
implies that 2006 recapitalization has significantly changed the management quality of
commercial banks in Nigeria.
Ho4: Bank recapitalization does not have a significant effect on its profitability
From the results on table 4.7 above, at α=0.05, Fcal= 1.584 < Ftab= 4.26 at (2,9) degree of
freedom. We therefore do not reject the H0 and conclude that there is no structural change on

European Journal of Accounting, Auditing and Finance Research
Vol.3, No.9, pp.12-30, September 2015
___Published by European Centre for Research Training and Development UK (www.eajournals.org)
25
ISSN 2053-4086(Print), ISSN 2053-4094(Online)
profitability after recapitalization on 0.05 level of significance. This implies that 2006
recapitalization at 0.05 level of significance did not change the return on capital employed of
commercial banks in Nigeria. Overall, this study has found that judging from the profitability
ratio of banks and test.
For structurally change between the pre and post 2006 recapitalization exercise, it is not
only capital that makes for good performance of banks. As banks recapitalize the economic
environment has to be conducive to make good profit and deepen the financial structure of
the economy.
Ho5 : Bank recapitalization does not have a significant effect on its liquidity.
Based on the results on table 4.9 above, at α=0.05, Fcal= 2.4812 < Ftab= 4.26 at (2,9) degree of
freedom. We therefore do not reject the H0 and conclude that there is no structural change on
liquidity after recapitalization. This implies that 2006 recapitalization at 0.05 level of
significance did not change the liquidity Ratio of commercial banks in Nigeria. Basel ii was
initially published in June, 2004 to create an international standard for banking regulators to
control how much capital banks need to put aside to guard against the various risks the bank
exposes themselves to but the 2008-2010 banking crises brought about the creation of Basel
iii to strengthen bank capital requirement on liquidity and leverage.
SUMMARY OF FINDINGS
1. There was a significant positive effect between the minimum capital base and capital
adequacy.
2. There was a significant positive effect between the minimum capital base and asset
quality.
3. There was a significant positive effect between the minimum capital base and
management quality.
4. There was a significant positive effect between the minimum capital base and earning
/ profitability using return on capital employed as proxy .
5. There was a positive but not significant effect at 0.05 level of significance between
the minimum capital base and liquidity
6. The recapitalisation process caused a structurally change in only the capital adequacy
and management quality of the commercial banks in Nigeria.
CONCLUSION
The paper has examined the effect of the 2006 commercial bank recapitalisation reform in
Nigeria, then without doubt or contradictions, there was plausible empirical evidence which
showed that recapitalization reform which took place in the Nigerian banking industry in
2006 had significant positive effect with the minimum capital base of the banks.

European Journal of Accounting, Auditing and Finance Research
Vol.3, No.9, pp.12-30, September 2015
___Published by European Centre for Research Training and Development UK (www.eajournals.org)
26
ISSN 2053-4086(Print), ISSN 2053-4094(Online)
From the results of the study, we conclude that even though there exist a relationship between
increase in minimum capital base requirement and the variables ( capital adequancy ratio,
asset quality ratio, management quality ratio, earning/ profitability rato and liquidity ratio of
banks ), there exist structurally change for only capital adequacy and management quality
confirming that though recapitalisation is a good development in the banking sector in
Nigeria, increasing minimum capital requirement alone cannot achieve stability as witnessed
by the post 2006 bank distress and the Central Bank of Nigeria intervention of the failing
banks (bailling out 8 banks with a tune of 400 billion in 2012. This has led to the conclusion
that recapitalisation alone cannot achieve the soundness and stability desired by the Central
Bank of Nigeria. (Nasiru,Joshua., and Nasiru, (2012), Adegbaju and Olokoyo,
Owolabi,Ogunlalu, (2013) and Akani,Wokoma and Uzobor (2012).
RECOMMENDATIONS
It is on the basis of our findings that this study recommends that capital regulation should be
a component of a total reform framework to ensure effectiveness.
There should be a balance between strict compliance to corporate governance practices, zero
tolerance on misreporting and fraudulent practices, enforcing laws like the liabilities of board
members of failing banks and finally, every business needs an enabling environment to
enhance profitability.
The combination of these with a strong capital base will help the Central Bank of Nigeria of
stemming the problem of bank failures and ensure a sound financial system.
REFERENCES
Adegbaju A. A and Olokoyo F.O (2008) “Recapitalization and Banks’ Performance: A Case
Study of Nigerian Banks” African Economic and Business Review, 6 (1): 1109-5609
Adeyemi, K.S (2012) “Banking Sector Consolidation in Nigeria: Issues and Challenges” A
Paper presented by the Executive director of Union Bank of Nigeria plc.
Agundu P.U.C., Akani, H.W & Agbahiwe, A.C. (2013), Intervention Strategy, Banking
Reengineering and Capital Formation in Nigeria. Research Journal of Finance and
Accounting, 4 (9): 108 – 115.
Akani, H. W. (2013), Analysis of Macroeconomic Aggregates on stock prices in Nigeria. An
application of Co-Integration and causality tests (1985 – 2011). International Journal
of Business and Management Review, 1 (3): 56 – 79.
Akani, H.W; Wokoma, V.C & Uzobor, C.C (2012), Corporate Governance and Customer’s
Patronage of Banking Services in third World Countries: the Nigerian Experience.
Paper Presented at the 1st Annual National Conference of School of Management
Sciences, Rivers State College of Art and Science, Port Harcourt, Nigeria.
AlajekwuUdoka B. and Obialor, M. C. (2014) “Nigerian Bank Recapitalisation Reforms:
Effect on the Banks and the Economy (2000 – 2012)” International Journal of
Managerial Studies and Research (IJMSR), 2 (2): 48-56
Bakare, A.S., (2011) “The trend and growth implications of bank recapitalization inNigeria”
African Journal of Business Management, 5(14): 5938-5945

European Journal of Accounting, Auditing and Finance Research
Vol.3, No.9, pp.12-30, September 2015
___Published by European Centre for Research Training and Development UK (www.eajournals.org)
27
ISSN 2053-4086(Print), ISSN 2053-4094(Online)
Egai and Akani (2010). Post Consolidation and Challenges in Banking Industry in Nigeria,
The University Advanced Research Journal, 1(2):61 - 83
Imala, O. I. (2005), “Consolidation in the Nigerian Banking Industry: A Strategy for
Survival and Development” A Paper Presented during the Visit of the Nigerian
Economics Students’ Association (NESA), University of Abuja Chapter.
John, E.E, Oke, M.O (2013) ‘Capital adequacy standards, basle accords and bank
performance: The Nigerian experience (A case study of selected banks in Nigeria),
3(2): 146- 159.
Nasiru, M.Y, Joshua, M., and Nasiru, A.K., (2012) “Bank recapitalization in Nigeria:
Resuscitating liquidity or forestalling distress”. International journal of business and
social sciences, 3(10):51-76.
Odeleye, A.T, (2014) “Pre-consolidation and Post-consolidation of Nigerian banking sector.
A Dynamic comparison”. International journal of economics and financial
issues, 4(1): 27-34.
Oleka, D.C, Mgbodile, C.C, (2014) “Recapitalisation Reform and Bank’s performance:
Empirical evidence from Nigeria”. Research journal of Finance and Accounting, 5(6):
81-96
Owolabi, S.A.,and Ogunlalu, A.E (2013) “Banking Industry Consolidation and Financial
Performance of Selected Quoted Banks in Nigeria”, Journal of Applied Finance &
Banking, 3(3): 219-238.
Saifullahi, S.I., Badamasi, S. M., Ibrahim, M. G., (2012) “Recapitalisation and Bank
Performance: Evidence from Banks in Nigeria” International Journal of Marketing
and Technology (IJMT), 2(3): 2249-1058
Sani, J. and Alani, G.O. (2013) “A comparative analysis of Pre and Post Re-capitalisation
Financial Performance of banks in Nigeria” International Journal of capacity building
in Education and Management (IJCBEM), 2(1): 2346- 7231.
Stephen, Nhuta (2014) ‘Recapitalisation strategies employed by commercial banks in
Zimbabwe’ international journal of research in social sciences, 3(7): 101-122
European Journal of Accounting, Auditing and Finance Research
Vol.3, No.9, pp.12-30, September 2015
___Published by European Centre for Research Training and Development UK (www.eajournals.org)
28
ISSN 2053-4086(Print), ISSN 2053-4094(Online)
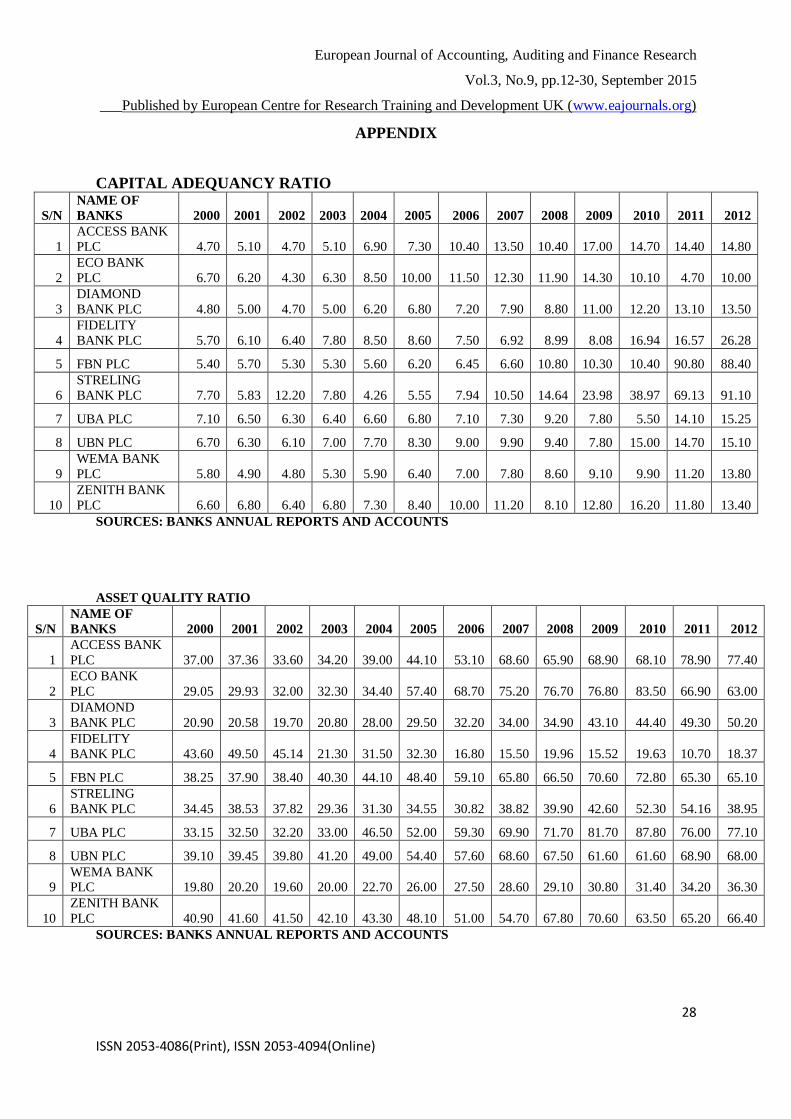
APPENDIX
CAPITAL ADEQUANCY RATIO
S/N
NAME OF
BANKS 2000 2001 2002 2003 2004 2005 2006 2007 2008 2009 2010 2011 2012
1
ACCESS BANK
PLC 4.70 5.10 4.70 5.10 6.90 7.30 10.40 13.50 10.40 17.00 14.70 14.40 14.80
2
ECO BANK
PLC 6.70 6.20 4.30 6.30 8.50 10.00 11.50 12.30 11.90 14.30 10.10 4.70 10.00
3
DIAMOND
BANK PLC 4.80 5.00 4.70 5.00 6.20 6.80 7.20 7.90 8.80 11.00 12.20 13.10 13.50
4
FIDELITY
BANK PLC 5.70 6.10 6.40 7.80 8.50 8.60 7.50 6.92 8.99 8.08 16.94 16.57 26.28
5 FBN PLC 5.40 5.70 5.30 5.30 5.60 6.20 6.45 6.60 10.80 10.30 10.40 90.80 88.40
6
STRELING
BANK PLC 7.70 5.83 12.20 7.80 4.26 5.55 7.94 10.50 14.64 23.98 38.97 69.13 91.10
7 UBA PLC 7.10 6.50 6.30 6.40 6.60 6.80 7.10 7.30 9.20 7.80 5.50 14.10 15.25
8 UBN PLC 6.70 6.30 6.10 7.00 7.70 8.30 9.00 9.90 9.40 7.80 15.00 14.70 15.10
9
WEMA BANK
PLC 5.80 4.90 4.80 5.30 5.90 6.40 7.00 7.80 8.60 9.10 9.90 11.20 13.80
10
ZENITH BANK
PLC 6.60 6.80 6.40 6.80 7.30 8.40 10.00 11.20 8.10 12.80 16.20 11.80 13.40
SOURCES: BANKS ANNUAL REPORTS AND ACCOUNTS
ASSET QUALITY RATIO
S/N
NAME OF
BANKS 2000 2001 2002 2003 2004 2005 2006 2007 2008 2009 2010 2011 2012
1
ACCESS BANK
PLC 37.00 37.36 33.60 34.20 39.00 44.10 53.10 68.60 65.90 68.90 68.10 78.90 77.40
2
ECO BANK
PLC 29.05 29.93 32.00 32.30 34.40 57.40 68.70 75.20 76.70 76.80 83.50 66.90 63.00
3
DIAMOND
BANK PLC 20.90 20.58 19.70 20.80 28.00 29.50 32.20 34.00 34.90 43.10 44.40 49.30 50.20
4
FIDELITY
BANK PLC 43.60 49.50 45.14 21.30 31.50 32.30 16.80 15.50 19.96 15.52 19.63 10.70 18.37
5 FBN PLC 38.25 37.90 38.40 40.30 44.10 48.40 59.10 65.80 66.50 70.60 72.80 65.30 65.10
6
STRELING
BANK PLC 34.45 38.53 37.82 29.36 31.30 34.55 30.82 38.82 39.90 42.60 52.30 54.16 38.95
7 UBA PLC 33.15 32.50 32.20 33.00 46.50 52.00 59.30 69.90 71.70 81.70 87.80 76.00 77.10
8 UBN PLC 39.10 39.45 39.80 41.20 49.00 54.40 57.60 68.60 67.50 61.60 61.60 68.90 68.00
9 WEMA BANK PLC 19.80 20.20 19.60 20.00 22.70 26.00 27.50 28.60 29.10 30.80 31.40 34.20 36.30
10
ZENITH BANK
PLC 40.90 41.60 41.50 42.10 43.30 48.10 51.00 54.70 67.80 70.60 63.50 65.20 66.40
SOURCES: BANKS ANNUAL REPORTS AND ACCOUNTS
European Journal of Accounting, Auditing and Finance Research
Vol.3, No.9, pp.12-30, September 2015
___Published by European Centre for Research Training and Development UK (www.eajournals.org)
29
ISSN 2053-4086(Print), ISSN 2053-4094(Online)
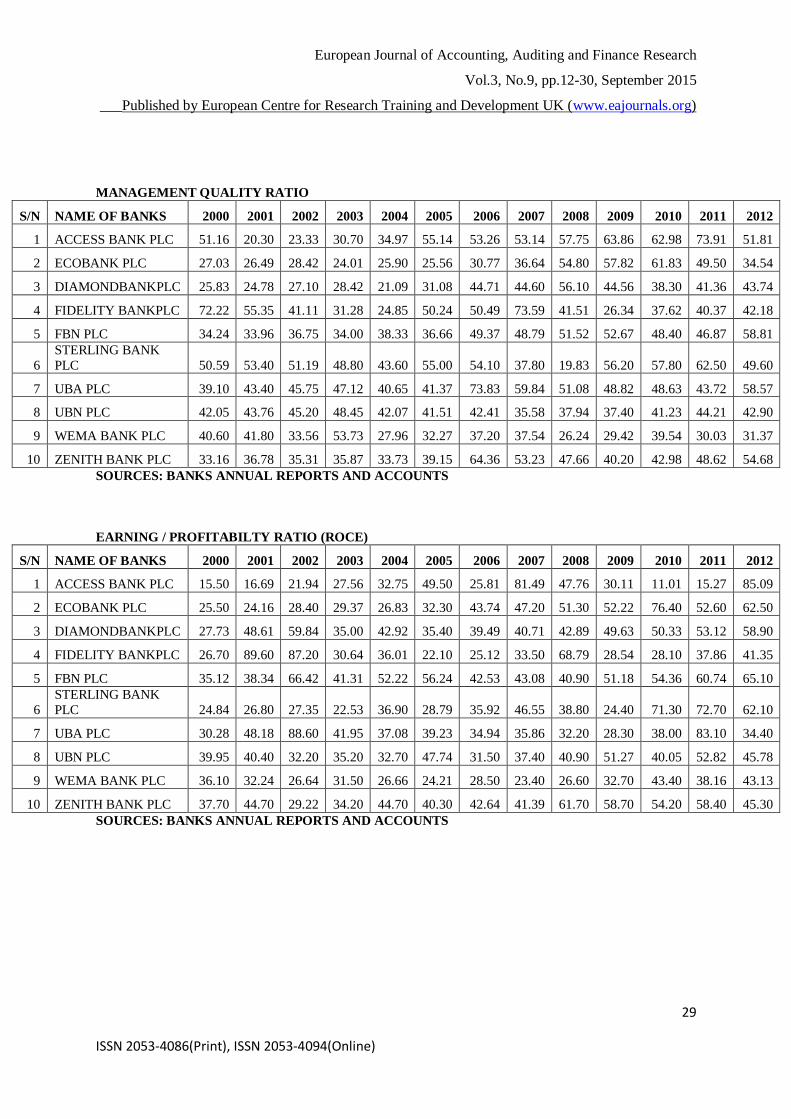
MANAGEMENT QUALITY RATIO
S/N NAME OF BANKS 2000 2001 2002 2003 2004 2005 2006 2007 2008 2009 2010 2011 2012
1 ACCESS BANK PLC 51.16 20.30 23.33 30.70 34.97 55.14 53.26 53.14 57.75 63.86 62.98 73.91 51.81
2 ECOBANK PLC 27.03 26.49 28.42 24.01 25.90 25.56 30.77 36.64 54.80 57.82 61.83 49.50 34.54
3 DIAMONDBANKPLC 25.83 24.78 27.10 28.42 21.09 31.08 44.71 44.60 56.10 44.56 38.30 41.36 43.74
4 FIDELITY BANKPLC 72.22 55.35 41.11 31.28 24.85 50.24 50.49 73.59 41.51 26.34 37.62 40.37 42.18
5 FBN PLC 34.24 33.96 36.75 34.00 38.33 36.66 49.37 48.79 51.52 52.67 48.40 46.87 58.81
6
STERLING BANK
PLC 50.59 53.40 51.19 48.80 43.60 55.00 54.10 37.80 19.83 56.20 57.80 62.50 49.60
7 UBA PLC 39.10 43.40 45.75 47.12 40.65 41.37 73.83 59.84 51.08 48.82 48.63 43.72 58.57
8 UBN PLC 42.05 43.76 45.20 48.45 42.07 41.51 42.41 35.58 37.94 37.40 41.23 44.21 42.90
9 WEMA BANK PLC 40.60 41.80 33.56 53.73 27.96 32.27 37.20 37.54 26.24 29.42 39.54 30.03 31.37
10 ZENITH BANK PLC 33.16 36.78 35.31 35.87 33.73 39.15 64.36 53.23 47.66 40.20 42.98 48.62 54.68
SOURCES: BANKS ANNUAL REPORTS AND ACCOUNTS
EARNING / PROFITABILTY RATIO (ROCE)
S/N NAME OF BANKS 2000 2001 2002 2003 2004 2005 2006 2007 2008 2009 2010 2011 2012
1 ACCESS BANK PLC 15.50 16.69 21.94 27.56 32.75 49.50 25.81 81.49 47.76 30.11 11.01 15.27 85.09
2 ECOBANK PLC 25.50 24.16 28.40 29.37 26.83 32.30 43.74 47.20 51.30 52.22 76.40 52.60 62.50
3 DIAMONDBANKPLC 27.73 48.61 59.84 35.00 42.92 35.40 39.49 40.71 42.89 49.63 50.33 53.12 58.90
4 FIDELITY BANKPLC 26.70 89.60 87.20 30.64 36.01 22.10 25.12 33.50 68.79 28.54 28.10 37.86 41.35
5 FBN PLC 35.12 38.34 66.42 41.31 52.22 56.24 42.53 43.08 40.90 51.18 54.36 60.74 65.10
6
STERLING BANK
PLC 24.84 26.80 27.35 22.53 36.90 28.79 35.92 46.55 38.80 24.40 71.30 72.70 62.10
7 UBA PLC 30.28 48.18 88.60 41.95 37.08 39.23 34.94 35.86 32.20 28.30 38.00 83.10 34.40
8 UBN PLC 39.95 40.40 32.20 35.20 32.70 47.74 31.50 37.40 40.90 51.27 40.05 52.82 45.78
9 WEMA BANK PLC 36.10 32.24 26.64 31.50 26.66 24.21 28.50 23.40 26.60 32.70 43.40 38.16 43.13
10 ZENITH BANK PLC 37.70 44.70 29.22 34.20 44.70 40.30 42.64 41.39 61.70 58.70 54.20 58.40 45.30
SOURCES: BANKS ANNUAL REPORTS AND ACCOUNTS

European Journal of Accounting, Auditing and Finance Research
Vol.3, No.9, pp.12-30, September 2015
___Published by European Centre for Research Training and Development UK (www.eajournals.org)
30
ISSN 2053-4086(Print), ISSN 2053-4094(Online)
LIQUIDITY RATIO
S/N NAME OF BANKS 2000 2001 2002 2003 2004 2005 2006 2007 2008 2009 2010 2011 2012
S/N NAME OF BANKS 2000 2001 2002 2003 2004 2005 2006 2007 2008 2009 2010 2011 2012
1 ACCESS BANK PLC 24.3 27 29.4 30.7 36.7 38.1 40.3 42 20 29.1 30 42 40
2 ECOBANK PLC 34.6 39.8 40 40.5 41.2 38.6 38 32.4 28.1 23.3 22.6 21.3 20
3 DIAMONDBANKPLC 32 32.4 32.7 33.1 31.4 29 25.4 32.1 21.6 27.9 38.2 46.5 60.6
4 FIDELITY BANKPLC 19.30 18.50 16.93 15.10 17.60 19.64 20.37 34.69 27.29 21.66 25.75 42.20 49.10
5 FBN PLC 33.4 36.3 39.3 40.2 40.6 42.15 42.9 44 40 31.7 47.8 58.3 80
6
STERLING BANK
PLC 20.96 25.46 35.83 32.05 36.55 34.16 35.44 37.82 39.28 39.86 42.27 32.43 44.10
7 UBA PLC 37.8 40.9 44 44.3 44 42 37.6 33.8 33.2 31.7 47.3 58.5 78.7
8 UBN PLC 44.70 46.20 42.30 44.30 40.60 43.00 37.40 30.20 25.00 29.10 30.00 42.00 45.10
9 WEMA BANK PLC 38.60 32.30 29.70 30.60 28.50 29.10 33.30 33.00 31.70 27.90 37.20 42.00 48.30
10 ZENITH BANK PLC 34.30 32.80 28.70 29.20 31.10 31.80 34.10 34.90 35.00 30.60 34.70 44.10 66.00
SOURCES: BANKS ANNUAL REPORTS AND ACCOUNTS