Nok Culture -Found in North central Nigeria off the edge of the Jos Plateau

AFRICAN DEVELOPMENT BANK AFRICAN DEVELOPMENT FUND
NIGERIA
PROJECT COMPLETION REPORT
PLATEAU STATE WATER SUPPLY PROJECT
INFRASTRUCTURE DEPARTMENT-CENTRAL AND WEST REGION JUIN 2005 PREPARED BY OCIN.2

TABLE OF CONTENTS
Page No. EXECUTIVE SUMMARY i-ii BASIC DATA iii-vi LOGFRAME vii-viii
1. INTRODUCTION 1
1.1 Background 1 1.2 Project Area 1
2. PROJECT FORMULATION AND OBJECTIVE 2
2.1 Sector Goal 2.2 Project Formulation
2 2
2.3 Project Objective 2 2.4 Project Description 2
3. PROJECT EXECUTION 3
3.1 Project Start-up 3 3.2 Modifications 4 3.3 Implementation Schedule 4 3.4 Reporting 5 3.5 Procurement 5 3.6 Project Cost 6 3.7 Financial Resources 6 3.8 Disbursements 7 3.9 Performance of Contractors, Suppliers and Consultants 8
4. PROJECT PERFORMANCE 9
4.1 Operational Performance 9 4.2 Institutional Performance 10 4.3 Financial Performance 11 4.4 Economic Performance 12
5. SOCIAL AND ENVIRONMENTAL IMPACT OF THE PROJECT 13
5.1 Social Impact 13 5.2 Environnemental Impact 14
6. PROJECT SUSTAINABILITY 14 7. PERFORMANCE OF THE BANK AND THE BORROWER 15
7.1 Bank Performance 7.2 Borrower Performance 7.3 Executing Agency’s Performance
15 16 16
8. OVERALL PERFORMANCE AND RATING 17 9. CONCLUSIONS, LESSONS LEARNT AND RECOMMENDATIONS 17
9.1 Conclusions 17 9.2 Lessons Learnt 17 9.3 Recommendations 19

LIST OF TABLES NO. TITLE 3.1 Project Cost 3.2 Financing Plan
LIST OF ANNEXES NO. TITLE 1. Map of Nigeria 2. Implementation Schedule at Appraisal and Actual 3. Organization Chart at Appraisal and at PCR 4. Annual Disbursement by Source of Funding at Appraisal and. Actual 5. Income Statements Projections at Appraisal and at Completion (Actual) 6. Balance Sheets Projections at Appraisal and at Completion (Actual) 7. Methodology and Assumptions for Financial and Economic Viability 8. Calculation of Financial Rate of Return 9. Calculation of Economic Rate of Return 10. Performance Evaluation Ratings 11. Project Outcome Evaluation Ratings 12 Sources of Information 13 Comments of the Executing Agency This Project Completion Report has been prepared by Mr. Rex K. Situmbeko, Financial Analyst, OCIN.2 and Mr. Collins Annoh, Water Engineer, Consultant, OCIN.2 following a mission to Nigeria in November/December 2004. Questions concerning this report should be addressed to Mr. M. Doumbia, Manager, OCIN.2 or Mr R.Situmbeko.

i
EXECUTIVE SUMMARY 1. The Federal Republic of Nigeria (FGN) approached the Bank Group to participate in financing the Plateau State Water Supply Project. The project was initially to be implemented in the three townships of Keffi, Akwanga and Doma to alleviate the problem of inadequate water supply which was perceived to be a major constraint to development. The Bank, upon review of documentation received early in 1990, requested the Government to commission feasibility studies including preliminary engineering designs to be carried out. The project was finally appraised in January 1991 with the inclusion of the Jos-Bukuru Metropolis as one of the project areas. Subsequently, the Bank approved an ADB loan of UA 90.17 million and an ADF loan of UA 3.84 million on 2 May 1991. The two loans became effective on 14 July 1992. 2. The objectives of the project were: (a) to increase water supply and thus improve the health condition of the population in the project area, resulting in improved social and economic conditions in the townships of Keffi, Akwanga and Doma, and the Jos-Bukuru Metropolis through the provision of increased and reliable water supply; and (b) to create favourable working conditions and economic and financial setup for the PSWB and NSWB to enable them function efficiently, sustain their investments and operate on a cost recovery basis. 3. The project components included the following: (a) construction of the Keffi and Akwanga water supply scheme comprising intake works, pumping stations with pumps, a treatment plant (capacity 62 850 m3/d), supply and installation of transmission pipes (19.9 km length) and distribution pipes (42.1 km length), service reservoirs, civil works including drainage and buildings; (b) construction of the Doma water supply scheme involving intake works with pumps, a treatment plant (capacity 13 000 m3/d), pumping station with pumps, supply and installation of transmission pipes (7.5 km length) and distribution pipes (11.4 km length), service reservoir, civil works including drainage and buildings; (c) construction of the Jos-Bukuru water supply scheme consisting of pump house modifications, pumps, a treatment plant (capacity 45 000 m3/d), supply and installation of transmission pipes (16 km length) and distribution pipes (110 km length), service reservoirs and extension of the Central Laboratory, etc.; (d) construction of workshop/stores and supply of operational equipment; (e) provision of technical assistance resulting in institutional strengthening; and (f) provision of engineering services for design and construction supervision.
4. At appraisal, project implementation was envisaged to commence in October 1991 with 39 months completion period ending on 31 December 1994, and with deadline for last disbursement on 31 December 1995. However, although project implementation started as envisaged at appraisal, it was not until July 1992 that physical implementation actually started in earnest with the implementation of the Keffi/Akwanga and Doma schemes. The delay could be attributed mainly to inadequate project preparation and delayed payment of advance mobilization due to ineffectiveness of the loans. The Doma, Kefi/Akwanga and Jos-Bukuru schemes were completed in 1994, 1996 and 2000, respectively. The project was finally completed in 2003. The deadline for last disbursement was extended eight times to 30 June 2004 to allow for the execution of all outstanding contracts. 5. A total of 20 contracts were awarded, of which 5 contracts are yet to be completed. The Bank’s standard procedures for procurement of goods and works, and its guidelines for use of consultants were followed. 6. The total project cost at appraisal was UA 106.43 million made up of UA 93.00 million foreign currency and UA 13.43 million local currency components. Actual total project cost is about UA 113.35 million, of which the Bank financed UA 93.73 million. The civil works contracts for the three

ii
schemes resulted in huge increases in cost due to variation orders, application of price escalations and delays in completion of the schemes in addition to inadequate estimation of appraisal costs due to insufficient project preparation prior to appraisal. The two State Governments contributed a total of about UA 19.62 million representing about 58% increase in their expected total contribution of UA 12.42 million at appraisal. 7. The infrastructure envisaged at appraisal for the three schemes have all been provided and are operating satisfactorily since their commissioning. However, operational deficiencies resulting from inadequate maintenance including supply of spare parts, inadequate and irregular supply of electric power, among others, seem to impact on the operational performance of the three schemes. Additionally, there has not been any change in the level of % losses estimated at appraisal, since the gains made in reinforcing the existing distribution, legalizing unauthorized connections, etc., have been modest. 8. The performance of the Plateau State Water Board which later split into two Boards after the division of the Plateau State into Nasarawa and Plateau States, has not been satisfactory as anticipated, since the project was appraised in 1991. Both institutions continue to suffer from the same weaknesses that were diagnosed at the time despite the technical assistance provided under the project by Management Consultants. Recommendations made by the Consultants have not been implemented thereby denying the institutions the opportunity to achieve the desired institutional strengthening and commercialization to improve on performance and enhance sustainability of the project. 9. The implementation of the project has increased water production and thereby guaranteed supply to numerous areas that hitherto had no supply of pipe borne water. The availability of water has an impact on industrial, commercial and domestic users in these areas, leading to likely economic upsurge and contributing to the overall growth of the national economy. Environmentally, no significant concerns were envisaged at appraisal. The laying of pipes seemed to pose some temporary environmental risks, particularly in residential and commercial areas. The risks were mitigated through the construction processes and additional measures adopted. 10 The FRR and ERR for the project are – 5 % and 4 % respectively signifying that the project is not viable financially and economically. 11. The sustainability of the project would depend on the long term technical, managerial and financial performance of the two Water Boards with regard to (a) maintenance capacity and availability of technical personnel, (b) metering of consumers, (c) adequate tariff levels to ensure full cost recovery and (d) commitment on the part of the Government to private sector participation (PSP). Under the prevailing circumstances, sustainability of the project is unlikely. 12. The overall implementation performance may be considered unsatisfactory with a rating of 1.8 out of 4. This is a result of inadequacies with regard to adherence to planned implementation and cost schedules, full compliance with agreed covenants and maintenance of infrastructure provided.

iii
A. BASIC DATA 1. Country : Nigeria 2. Project : Plateau State Water Supply Project 3. Loan Number : 2000191000038 (B/NGR/PS/WAS/91/18) 2100150000774 (F/NGR/PS/WAS/91/19) 4. Borrower : The Federal Government of Nigeria (FGN) 5. Guarantor : The Federal Government of Nigeria 6. Beneficiary : Plateau State Water Board (PSWB) 7. Executing Agency : PSWB B. LOAN DATA Appraisal Actual
1. Amount (UA Million) ADB: 90.17 ADF: 3.84
ADB: 89.95 ADF: 3.78
2. Commitment Charge 1 % per annum on the undisbursed portion of the ADB loan No change
3. Service charge 0.75% per annum on the undisbursed portion of the ADF loan No change
4. Interest Rate 7.50 % per annum on the amount disbursed and outstanding. No change
5. Repayment Period/ Amortization 15 years for the ADB loan No change 40 years for the ADF loan No change
6. Grace Period 5 years, commencing from the date of loan agreement for the ADB loan No change
10 years, commencing from the date of loan agreement for the ADF loan No change
7. Loan Negotiation Date 8. Loan Approval Date April 1991 02 May 1991 9. Loan Signature Date 19 December 1991 10. Date of Entry into Force October 1991 14 July 1992 C. PROJECT DATA Appraisal Actual 1. Project Cost Estimate (UA million) 106.43 113.35 2. Financing plan (UA million) FC LC FC LC
ADB 90.17 - 89.95 - ADF/TAF 2.83 1.01 3.78 - PSWB/NSG - 12.42 - 19.62 Total 93.00 13.43 93.73 19.62
3. Effective Date of First Disbursement 1991 1992 4. Date of Last Disbursement (Closing Date) 31 December 1996 30 June 2004 5. Commencement of Project Implementation Activities October 1991 July 1992 6. Date of Completion of Project Implementation Activities December 1994 October 2003 D. PERFORMANCE INDICATORS At Appraisal At PCR 1. Cost Over-run 6.5 % 2. Time Over-run 249 %
- Slippage on effectiveness 9 months - Slippage on first disbursement 1 year - Slippage on last disbursement 7 years 6 months - Number of extensions to last disbursement 8 No. - Slippage on completion date 8 years 10 months
3. Project Implementation Status - Date project started October 1991 13 July 1992 - Date project completed 31 December 1994 June 2004

iv
4. Institutional performance Unsatisfactory Appraisal Actual 5. Contractor's performance
Satisfactory, Unsatisfactory
6. Supplier's Performance Satisfactory 7. Consultant's performance
- Engineering Supervision Consultant Satisfactory, Unsatisfactory - Technical Assistance Consultant Satisfactory
8. Borrower's Performance Unsatisfactory 9. ADB's Performance Satisfactory 10. FRR (%) 12.57 - 5.0 11. ERR (%) 4 E. MISSIONS Date Missions No. of Persons Composition Man-Days Appraisal 16/01 - 22/01/91 2 1 Engineer, 1 Financial Analyst 14 Supervision 17/05 - 22/05/93 2 1 Engineer, 1 Financial Analyst 12 Supervision 28/07 - 28/07/93 1 1 Financial Analyst 1 Supervision 28/02 - 03/03/94 3 2 Engineer, 1 Financial Analyst 8 Supervision 08/03 - 09/03/94 2 2 Financial Analyst 4 Supervision 02/12 - 03/12/94 1 1 Financial Analyst 2 Supervision 27/10 - 31/10/95 2 1 Engineer, 1 Financial Analyst 10 Supervision 10/04 - 11/04/96 1 1 Engineer 2 Supervision 03/08 - 04/08/96 2 1 Trainer, 1 Procurement Spec. 4 Supervision 21/10 - 25/10/96 1 1 Engineer 5 Supervision 21/06 - 25/06/97 2 1 Engineer, 1 Financial Analyst 10 Supervision 29/08 - 30/08/97 1 1 Financial Analyst 2 Supervision 12/05 - 16/05/98 2 1 Engineer, 1 Financial Analyst 10 Supervision 22/06 - 25/06/99 1 1 Engineer 4 Supervision 11/09 - 12/09/00 2 2 Engineer 4 Supervision 19/05 - 25/05/01 2 1 Engineer, 1 Financial Analyst 14 Supervision 04/12 - 14/12/01 2 1 Engineer, 1 Financial Analyst 22 Supervision 16/07 - 20/07/02 2 1 Engineer, 1 Financial Analyst 10 Completion 06/12 - 16/12/04 3 1 Engineer, 1 Financial Analyst
1 Engineer Consultant 22
F. LOAN DISBURSEMENT (in UA'Millions) ADB Loan ADF Loan Estimates at appraisal 90.17 3.83 Total disbursed 89.95 3.78 Unused balance 0.22 0.05 Amount cancelled 0.00 0.00 Contract./ Description Contractor /
Supplier / Consultant
Date Contract Signed
Contract Termination Date
Contract Duration
Contract Amount (in Million)
Remarks
FC (UA)
LC (NGN)
Keffi Akwanga Civil Works & Pipeline Installation
SCC Italia SPA 27/12/1991 01/04/1996
4 yrs 4 mths 30.48 120.46
Jos-Bukuru Civil works & Pipeline Installation
RCC Nigeria Ltd. 31/01/1995 31/12/2000 6 yrs 7.26 414
Supply/Installation of Electro Mech Plant
Jos Hansen and Soehne 31/12/1991 31/12/1995 4 yrs 7.45 44.42
Provision of Treatment Plant
Pianimpianti SPA 31/12/1991 31/12/1995 4 yrs 5.11 43.8
Supply/Installation of Elecro Pianimpianti 22/09/1994

v
Mech. Equip. & PJ Consortium
01/12/2000
6 yrs 3 mths
4.09
64.74
Supply/Installation of Treatment Plant
CIBA Consortium 22/09/1994 01/12/2000
6 yrs 3 mths 1.98 52.95
Construction of New Head office Building in Jos
Space Dev. Partnership Ltd. 27/07/2001 27/07/2002 1 yr 0.75 23.66
Works Incomplete
Renovation of Existing Headoffice Building in Jos
Space Dev. Partnership Ltd. 27/07/2001 01/03/2002 8 mhs 0.2 3.09
Works Incomplete
Renovation of Existing Headoffice Builing in Lafia
Rhor and Lue Nigeria Ltd. 05/11/2001 31/03/2002 5 mths 0.22 18.32
Works Incomplete
Supply/Delivery of Pipes (Keff/Akw)
Pont A. Mousson 31/12/1991 30/12/1995 4 yrs 16.02 9.05
Supply/Delivery of Pipes for Jos Bukuru SCC Mcwane 27/09/1994 01/09/1999 5 yrs 12.64 106.68
Supply/Installation of Communication Equip.
Bright Future Enterprise 06/03/2001 31/01/2002 10 mths 0.15 12.54
Supply/Delivery of Tools/Water Meters
Gwol Ventures Nigeria Ltd. 05/11/2001 31/03/2002 5 mths 0.13 6.68
Supply/Delivery of Laboratory Equip. and Rods
UTC Nigeria Plc 05/11/2001 31/03/2002 5 mths 0.08 0.87
Supply/Delivery of Utility vehicles
Jay-Bee Nigeria Ltd. 05/11/2001 31/03/2002 5 mths 0.19 12.14
Supply/Delivery of Maint. Equip. and Machinery
Farmstead Int. Nigeria Ltd. 5 mths 0.19 11.58
Engineering Supervision of Keffi Akwanga A I C Limited 30/12/1991 31/12/1995 4 yrs 2.03 3.25
Design of Headoffice Building
Natconplan Consortium Ltd. 25/11/1992 17/06/1995 3 yrs 0.45 -
Engineering Services
AIC/SWK Joint Venture 31/01/1995 31/01/2001 7 yrs 1.27 25.92
Technical Assistance Medal 30/06/1992 30/04/1999 7 yrs 2.81 2.55

vi
CURRENCY EQUIVALENTS
National Currency = Naira NGN 1 NGN = 100 Kobo 1 USD = NGN 9.2 (At Appraisal January1991) 1 USD = NGN 140.0 (At PCR, Autonomous Market) 1 UA = NGN 13.1 (At Appraisal January 1991) 1 UA = NGN 199.7 (At PCR)
WEIGHTS AND MEASURES I kilometer (Km) = 1000 meters (m) = 0.62 mile 1 meter (m) = 100 Centimeters (cm) = 1000 millimeters (mm) 1 cubic meter (m3) = 1000 liters = 200 imperial gallons 1 million gallons (Mg) = 4545 m3
ABBREVIATIONS ADB = African Development Bank ADF = African Development Fund DCI = Ductile Cast Iron EA = Executing Agency ERR = Economic Internal Rate of Return FGN = Federal Government of Nigeria FRR = Financial Internal Rate of Return ICB = International Competitive Bidding l/c/d = Liters per capita per day LGA = Local Government Authority m3 = Cubic meters m3/d = Cubic meters per day NEPA = National Electric Power Authority NGCO = ADB Nigeria Country Office NSG = Nasarawa State Government NSWB = Nasarawa State Water Board PCR = Project Completion Report PIU = Project Implementation Unit PSG = Plateau State Government PSP = Private Sector Participation PSWB = Plateau State Water Board UA = Unit of Account
FISCAL YEAR
January 1 - December 31
vii
PLATEAU STATE WATER SUPPLY PROJECT
PROJECT MPDE MATRIX
Narrative Summary (NS)
Measurable Indicators (OVI) Means of Verification
(MOV)
Important Assumptions
Sector Goals: To improve the quality of life of the people of Plateau and Nasarawa States through provision of adequate water supply and sanitation in an affordable and sustainable manner.
1.1 Decrease in water related diseases and time
savings.
Statistics from State and Federal Government and other agencies. OPEV post evaluation.
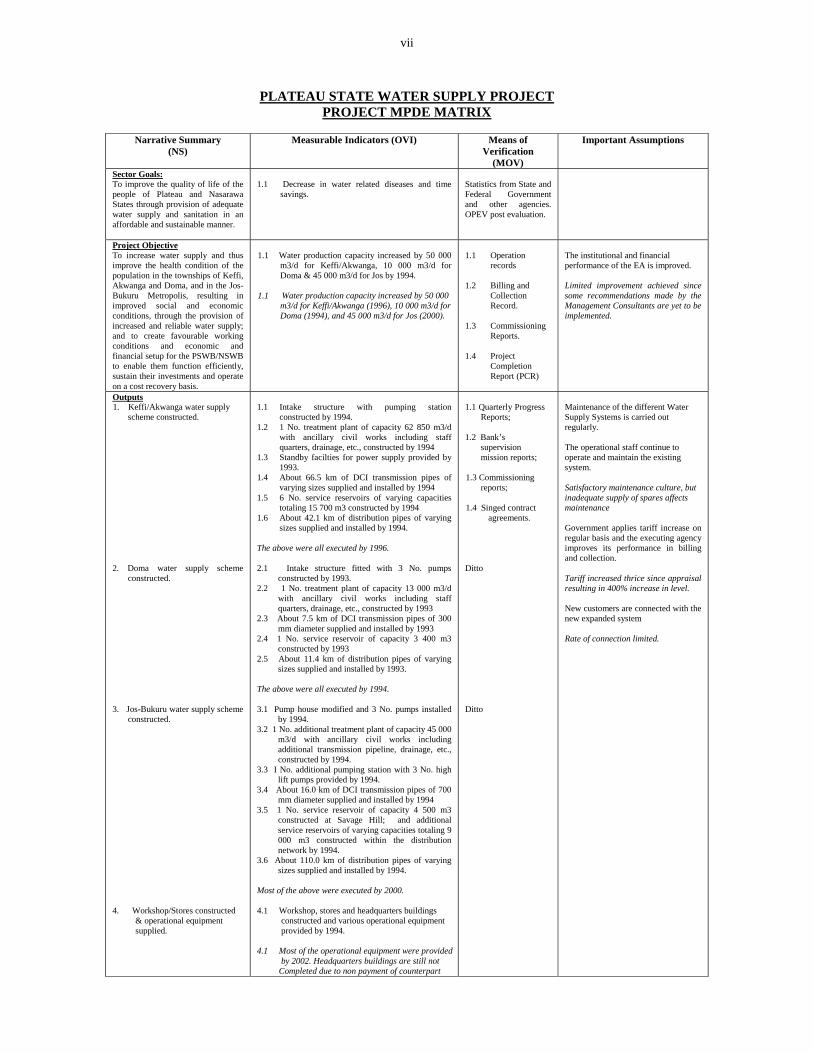
Project Objective To increase water supply and thus improve the health condition of the population in the townships of Keffi, Akwanga and Doma, and in the Jos-Bukuru Metropolis, resulting in improved social and economic conditions, through the provision of increased and reliable water supply; and to create favourable working conditions and economic and financial setup for the PSWB/NSWB to enable them function efficiently, sustain their investments and operate on a cost recovery basis.
1.1 Water production capacity increased by 50 000
m3/d for Keffi/Akwanga, 10 000 m3/d for Doma & 45 000 m3/d for Jos by 1994.
1.1 Water production capacity increased by 50 000
m3/d for Keffi/Akwanga (1996), 10 000 m3/d for Doma (1994), and 45 000 m3/d for Jos (2000).
1.1 Operation
records 1.2 Billing and
Collection Record.
1.3 Commissioning
Reports.
1.4 Project Completion Report (PCR)
The institutional and financial performance of the EA is improved. Limited improvement achieved since some recommendations made by the Management Consultants are yet to be implemented.
Outputs 1. Keffi/Akwanga water supply
scheme constructed. 2. Doma water supply scheme
constructed. 3. Jos-Bukuru water supply scheme
constructed. 4. Workshop/Stores constructed
& operational equipment supplied.
1.1 Intake structure with pumping station
constructed by 1994. 1.2 1 No. treatment plant of capacity 62 850 m3/d
with ancillary civil works including staff quarters, drainage, etc., constructed by 1994
1.3 Standby facilties for power supply provided by 1993.
1.4 About 66.5 km of DCI transmission pipes of varying sizes supplied and installed by 1994
1.5 6 No. service reservoirs of varying capacities totaling 15 700 m3 constructed by 1994
1.6 About 42.1 km of distribution pipes of varying sizes supplied and installed by 1994.
The above were all executed by 1996. 2.1 Intake structure fitted with 3 No. pumps
constructed by 1993. 2.2 1 No. treatment plant of capacity 13 000 m3/d
with ancillary civil works including staff quarters, drainage, etc., constructed by 1993
2.3 About 7.5 km of DCI transmission pipes of 300 mm diameter supplied and installed by 1993
2.4 1 No. service reservoir of capacity 3 400 m3 constructed by 1993
2.5 About 11.4 km of distribution pipes of varying sizes supplied and installed by 1993.
The above were all executed by 1994. 3.1 Pump house modified and 3 No. pumps installed
by 1994. 3.2 1 No. additional treatment plant of capacity 45 000
m3/d with ancillary civil works including additional transmission pipeline, drainage, etc., constructed by 1994.
3.3 I No. additional pumping station with 3 No. high lift pumps provided by 1994.
3.4 About 16.0 km of DCI transmission pipes of 700 mm diameter supplied and installed by 1994
3.5 1 No. service reservoir of capacity 4 500 m3 constructed at Savage Hill; and additional service reservoirs of varying capacities totaling 9 000 m3 constructed within the distribution network by 1994.
3.6 About 110.0 km of distribution pipes of varying sizes supplied and installed by 1994.
Most of the above were executed by 2000. 4.1 Workshop, stores and headquarters buildings constructed and various operational equipment provided by 1994. 4.1 Most of the operational equipment were provided by 2002. Headquarters buildings are still not Completed due to non payment of counterpart
1.1 Quarterly Progress
Reports;
1.2 Bank’s supervision mission reports;
1.3 Commissioning
reports; 1.4 Singed contract
agreements. Ditto Ditto
Maintenance of the different Water Supply Systems is carried out regularly. The operational staff continue to operate and maintain the existing system. Satisfactory maintenance culture, but inadequate supply of spares affects maintenance Government applies tariff increase on regular basis and the executing agency improves its performance in billing and collection. Tariff increased thrice since appraisal resulting in 400% increase in level. New customers are connected with the new expanded system Rate of connection limited.

viii
5. Management and training
services provided. 6. Engineering services provided.
funds. 5.1 Improved operational performance systems
designed and installed with supply and use of computer hard and software; and training of all relevant staff by 1994.
5.1 Improved operational performance systems
installed by 1999. 6.1 Engineering design and construction
supervision of works completed by 1994. 6.1 Supervision of all works completed in 2001.
Activities/Components: Recruitment of Consultants. Preparation of design and tender documents. Recruitment of Contractors. Provision of Technical Assistance.
Resources Amount (UA Million) Estimated Actual ADB 90.17 89.95 ADF 4.04 3.78 PSG/NSG 12.22 19.62 Components Costs (UA Million) Estimated Actual Keffi/Akwanga Scheme 47.66 55.33 Doma Scheme 8.54 9.96 Jos-Bukuru Scheme 17.22 37.88 Workshop/Op. Equip. 11.85 2.86 Technical Assistance 3.51 3.85 Engineering Services 4.11 3.47 Contingencies 13.53
1.1 Loan Agreements 1.2 Disbursement
Records
Loan conditions are met by the Government on time. Conditions were not met on time. ADB and ADF funds are released on time. Untimely payments were made from ADB and ADF funds. Adequate counterpart funds are available from the Government on regular basis Counterpart funds were inadequate and irregularly made available. Some payments are still outstanding. Political situation remains stable. No significant delays in the implementation of the Project. Significant delays in implementation resulting in slippage on completion of about 7 years.
Note: There was no requirement for preparation of a project matrix at the time of appraisal. The above matrix has been prepared at project completion.

1
1. INTRODUCTION 1.1 Background 1.1.1 The Federal Republic of Nigeria (FGN) approached the Bank Group to participate in financing the Plateau State Water Supply Project. Bank’s mission appraised the project in January 1991 and an ADB loan of UA 90.17 million and an ADF loan of UA 3.84 million were approved by the Bank on 2 May 1991. 1.1.2 In addition to this project, the Bank Group participated in financing seven other projects in public utilities/water sector in Nigeria. These included Ibadan emergency water supply, Ibadan water supply project II, Bauchi township water supply, Anambra/Enugu/Ebonyi States rural infrastructures, Niger State water supply, Edo/Delta (Bendal) States water supply, and Multi-State water supply projects. Out of the seven projects, four projects have been completed including Bauchi township water supply, Niger State water supply, Ibadan emergency water supply, and Ibadan water supply II projects. However, the Ibadan emergency water supply project, through utilization of loan savings, has been reactivated to implement additional works which are scheduled for completion in December 2006. The Edo/Delta (Bendal) States water supply project was terminated at 75% completion due to depletion of loan resources, while the closing date of the Anambra/Enugu/Ebonyi States rural infrastructures project expired at about 60% completion because of non-performance of the contractors. The remaining, Multi-State water supply project is at an advanced stage of implementation and is envisaged to be completed in December 2005. 1.1.3 A draft copy of the PCR was forwarded to the Executing Agency for their comments. The Executing Agency responded with the following summsrized comments, the details of which are attached as Annex 13..
i) The ratings are very low and should be adjusted from 1 to 3. ii) The performance of the Executing Agency should read satisfactory. iii) The organization chart should be corrected.
The above comments have been reviewed and it is the Bank’s view that the ratings should remain the way they are for reasons explained in the document. The performance of the Executing Agency should be maintained at unsatisfactory level. The organization chart has been corrected. 1.2 Project Area 1.2.1 The project area consists of Keffi, Akwanga and Doma townships which are administrative headquarters of three Local Government Authorities located within the newly created Nasarawa State, and Jos, the State Capital of Plateau State. Keffi town is commercially a fast growing town with fairly good road network and a population of about 80,000 (yr. 1990), and is located about 54 km from Abuja the Federal Captal. Akwanga, with a population of about 30,000 (yr. 1990), is located at the junction of two major roads and with many restaurants and hotels. Doma, with a population of about 35,000 is accessed by road from Lafia. Jos, with adjoining Bukuru township, has a number of private and public industries, academic institutions and an urban population of about 800,000 (yr. 1990). 1.2.2 At appraisal, Keffi was supplied with water from two sources, notably, the Makeri river scheme with conventional treatment and capacity of 58 m3/h and the Antau spring scheme that supplied limited quantity of water from a 5 m deep well. Akwanga was supplied water from the Arichua River by means of a conventional treatment system delivering up to 90 m3/h. The inhabitants of Doma depended on wells (av. depth 10 m) and small ephemeral streams flowing though the town. Jos–Bukuru,

2
on the contrary was supplied with water from several impoundments, notably, the Lamingo-Kogingiri, Laminga and Yakubu Gowon dams delivering water to treatment facilities with capacities of 3 000 m3/d, 18 000 m3/d, and 45 000 m3/d, respectively. Additionally, two abandoned mining pits which have since filled with water supplemented supply resulting in a total installed capacity of 71 000 m3/d for all the schemes. The existing distribution network for Jos-Bukuru covered about 60% of the Jos-Bukuru metropolitan area. 2. PROJECT FORMULATION AND OBJECTIVE 2.1 Sector Goal
The sector goal is to improve the quality of life of the people of Plateau and Nasarawa States through provision of adequate water supply and sanitation in an affordable and sustainable manner. 2.2 Project Formulation 2.2.1 The Government of the Federal Republic of Nigeria (FGN) approached the Bank Group for assistance to implement the Plateau State Water Supply Project, initially, in the three townships of Keffi, Akwanga and Doma to alleviate the problem of inadequate water supply which was perceived to be a major constraint to development. 2.2.2 The Bank’s review of documents submitted by the FGN on the project early in 1990 indicated that the project had not been adequately prepared for processing by the Bank prior to presentation to the Board. The Government was informed accordingly, subsequent to which the Plateau State Government (PSG) commissioned a consortium of consultants to carry out feasibility studies, preliminary engineering designs and tender documentation which were all financed by the PSG. The outcome of the initiative by the PSG resulted in the preparation of a revised feasibility and preliminary design reports on the proposed project, which were submitted in October 1990. As a result, an appraisal mission to Plateau State was launched in January 1991. The mission carried out field visits, reviewed other available documents and held various discussions with the PSG, parastatal agencies, the Executing Agency and private sector institutions including the engineering design consultants. 2.2.3 The proposed project was extended to cover the Jos-Bukuru metropolis during project appraisal without adequate preparation of the proposed extension. 2.3 Project Objective
The objectives of the project are: (a) to increase water supply and thus improve the health condition of the population in the project area, resulting in improved social and economic conditions in the townships of Keffi, Akwanga and Doma, and the Jos-Bukuru metropolis through the provision of increased and reliable water supply; and (b) to create favourable working conditions and economic and financial setup for the PSWB and NSWB to enable them function efficiently, sustain their investments and operate on a cost recovery basis. 2.4 Project Description The project consisted of the following components: 2.4.1 Construction of Keffi/Akwanga Scheme: This included intake works with raw water pumping station, conventional treatment plant of capacity 62 850 m3/d, clear well pumping station, supply and installation of electro mechanical equipment, administrative/chemical building and workshop, staff

3
quarters, power supply standby facilities, civil works including drainage for the treatment plant, supply and laying of DCI pumping main from the treatment plant to Gudi of 7.0 km total length and 600 mm diameter, a two chamber balancing tank at Mandara, supply and laying of DCI gravity main from Gudi to Keffi of 46.6 km total length and 700 mm diameter, supply and laying of DCI pumping main from the treatment plant to Akwanga of 12.9 km total length and 300 mm diameter, service reservoirs at Garaku (1 000 m3), Sabon Gida (750 m3), Keffi ( 3 No. totalling 12 600 m3) and Akwanga (13 550 m3), supply and laying of distribution network for Keffi and Akwanga of about 42.1 km total length and of varying diameters from 100 mm to 600 mm. 2.4.2 Construction of Doma Scheme: This involved intake works of Pontoon type complete with 3 No. new pumps, conventional treatment plant of capacity 13 000 m3/d, clear water pumping station with pumps, supply and installation of about 7.5 km of DCI pumping main of 300 mm diameter from the treatment plant to the service reservoir, administrative and chemical building/workshop, staff housing, service reservoir (3 400 m3), supply and installation of distribution network of about 11.4 km total length and of varying diameters from 100mm to 450 mm. 2.4.3 Construction of Jos-Bukuru Scheme: This included modification of the existing low lift pump house and supply and installation of 3 No. pumps, an additional treatment plant of capacity 45 000 m3/d and 700 mm diameter raw water main, additional high lift pumping station with 3 No. high lift pumps, additional 16 km of rising main with diameter 700 mm, service reservoir of capacity 4 500 m3 at Savages Hill, service reservoirs with capacity totaling 9 000 m3 within the distribution network, extension of the distribution network by about 110 km of pipes with varying diameters from 100mm to 300mm, and extension of the Central Laboratory including provision of testing equipment and materials. 2.4.4 Construction of Workshop/Stores and Supply of Operational Equipment: This involved rehabilitation of the newly allocated workshop, supply and installation of electro mechanical equipment and plant including spares and raw materials, supply of equipment and plant to facilitate operations, pipe laying, repairs, construction, etc., supply and installation of 100 000 consumer meters with spares, and provision of permanent headquarters for the Water Board. 2.4.5 Technical Assistance: This consisted of institutional strengthening of the Water Board through designing and installing engineering operations, management and accounting systems by the management consultant including provision of computer hardware and software as well as training of staff. The management study also included examination and recommendation of ways of improving revenue collection by the Water Board. 2.4.6 Engineering Services: This involved provision of consultancy services for design and supervision of the project execution including:
a) Supervision of the three water supply schemes; b) Design modifications, where relevant; and c) Updating of feasibility report, including preparation of design and tender documentation
for expansion of the water supply scheme for Jos-Bukuru metropolis. 3. PROJECT EXECUTION 3.1 Project Start-Up 3.1.1 The ADB and ADF loans were approved on 2 May 1991 and signed on 19 December 1991. The Borrower fulfilled the conditions precedent to first disbursement within a reasonable time and the loans were declared effective on 14 July 1992 for both ADB and ADF loans.

4
3.1.2 Though the procurement process was commenced in 1991 as envisaged at appraisal and with the award of contracts for the physical implementation of the Keffi/Akwanga and Doma schemes in December 1991, initial start-up delays were experienced in the implementation of the contracts due to the preliminary nature of working drawings, design review, delayed clearance of goods as a result of introduction of VAT, and untimely payment of mobilization advance due to loan ineffectiveness. The commencement of the Jos-Bukuru scheme was excessively delayed as a result of the need to carry out a feasibility study including preparation of engineering design. 3.2 Modifications 3.2.1 There were no major changes made during execution of the project except for variations made as a result of changes in prevailing site conditions, and reduction of the scope of the workshop, stores and operational equipment component after revision of the LGS to accommodate the cost overruns on the civil works contracts of the three schemes as follows:
• The increase in elevation of the service reservoir at Godi, resulting in reduction of pipe diameters of the gravity main from Mandara Hill to Keffi under the Keffi/Akwanga scheme. Cost savings made due to the reduction in pipe diameters were eroded by cost overruns of the civil works contract.
• The execution of flood protection works as a result of flood damage to constructed transmission pipelines for the Keffi/Akwanga scheme. These protection works were not envisaged at appraisal.
• The construction of the 12 000 m3 Eastern Reservoir as part of the infrastructure for Jos-Bukuru. • Reduction of the original scope of the workshop, stores and equipment component, notably, (a)
the reduction of the number of water meters from 100,000 to 27,000, (b) review of the extent of rehabilitation of existing office building and size of the new office building to be constructed, and (c) review of the type and quantity of workshop equipment to be procured, given that some of the proposed workshop equipment, e.g., overhead cranes and hydraulic jacks were to be procured under the then ongoing World Bank financed National Water Rehabilitation Project.
3.3 Implementation Schedule 3.3.1 At appraisal, project implementation was envisaged to commence in October 1991 with 39 months completion period ending on 31 December 1994, and deadline for last disbursement on 31 December 1995. However, although project implementation started as envisaged at appraisal, it was not until July 1992 that physical implementation actually started in earnest with the implementation of the Keffi/Akwanga and Doma schemes. The main reasons for the delayed commencement could be attributed to the preliminary nature of working drawings, design review, delayed clearance of goods as a result of introduction of VAT, and untimely payment of mobilization advance to the suppliers and contractors due to loan ineffectiveness. The schemes were completed in 1994 and 1996 for Doma and Keffi/Akwanga, respectively. The Doma scheme was completed about 3 months ahead of the scheduled appraisal completion date, while the Keffi/Akwanga scheme was completed about 1 year 9 months later than the scheduled completion date. Despite the late commencement of the Jos-Bukuru scheme in 1995 thereby causing delays due to the need to carry out a feasibility study including preparation of engineering design, additional delays were experienced in the award of the civil works contract due to a complaint submitted to the Bank by one of the bidders. The Jos-Bukuru scheme was substantially completed in 1999. 3.3.2 The shortest time lag between the appraisal and actual commencement dates was about 3 months for the supply and installation of treatment plants for the Keffi/Akwanga and Doma schemes, while the longest time lag was about 9 years for the implementation of the fourth component, i.e., workshop, stores and operational equipment component which is yet to be completed. The long lag

5
(delay) was basically due to the need to defer implementation of the fourth component as a result of the fact that commitments made on contracts awarded under the Jos-Bukuru scheme, were far in excess of the appraisal estimates. Implementation of the component could only commence after the actual costs of all contracts under the scheme had been determined on completion. Commencement of the technical assistance component experienced about 1 year time lag from the appraisal commencement date. 3.3.3 The deadline for last disbursement was extended eight times to 30 June 2004 to allow for the execution of all outstanding works including disbursements. The status of implementation at completion, and the comparison of the implementation schedule at appraisal with the actual are shown in Annex 2. 3.4 Reporting 3.4.1 Quarterly progress reports were regularly submitted to the Bank in accordance with the requirement of the General Conditions of the Loan. A total of 44 quarterly and 120 monthly progress reports were submitted covering the period 1992 to March 2004. The progress reports covered various aspects including status of fulfillment of loan conditions, procurement, physical implementation and disbursements. The reports also highlighted the problems encountered during implementation of the project and brought to the Bank’s attention those problems that required the Bank’s attendance. 3.4.2 Financial, technical and management audits were conducted by a private firm which reported on the financing, implementation progress, procurement, quality of works, capacities of the PIUs, consultants and contractors on quarterly basis. Audit of project accounts was informative and raised important issues in time for corrective action to be taken. A total of 12 such yearly audits were conducted during the implementation period. The PIUs kept comprehensive project accounts for both ADB and ADF. The accounting records maintained for the project fully captured the contributions of the Plateau and Nasarawa State Government contribution towards meeting the local costs of the project. 3.4.3 The Executing Agencies prepared the Borrower’s PCR in the Bank’s Format and submitted same to the Bank in September 2002. 3.5 Procurement 3.5.1 The Bank’s standard rules of procedure for procurement of goods and works, and its guidelines for use of consultants were followed. The criteria for bid analyses were consistently applied by the Executing Agency. A total of 20 contracts were awarded, of which 5 contracts are yet to be completed as shown in Annex 2. 3.5.2 Procurement of Consultants: Four consultancy contracts, two for engineering services, one for Management consultancy and the fourth for architectural services were awarded. The procurements were carried out in accordance with Bank's procedures. At the request of the State Government, the procurement of the engineering services for the Jos-Bukuru scheme was negotiated with the consultant, which carried out the feasibility study of the scheme. The same firm had earlier been engaged to provide engineering services for the Keffi/Akwanga/Doma schemes. 3.5.3 Procurement of Contractors: The physical components of the project were implemented under two major groups: Keffi-Akwanga/Doma and Jos-Bukuru schemes. For each group one supply and three works contracts were awarded. In addition, for the implementation of the various items which were agreed to be implemented under the revision of the List of Goods and Services (LGS),

6
three works contracts and five goods contracts were awarded. The procurement of all contractors was carried out in accordance with the Bank's procedures. 3.6 Project Cost 3.6.1 The total project cost at appraisal was UA 106.43 million made up of UA 93.00 million foreign currency and UA 13.43 million local currency components. According to the loan agreement, the Bank was to finance a part of the local currency component up to UA 1.21 million. 3.6.2 Actual total project cost is about UA 113.35 million, of which the Bank financed UA 93.73 million. The Keffi/Akwanga/Doma civil works contract resulted in huge increases in cost due to variation orders, application of price escalations which unjustifiably over benefited some contractors, and delays in completion of the schemes. The actual cost of the Jos-Bukuru scheme was about twice the appraisal estimate mainly due to inadequate cost estimation as a result of insufficient project preparation prior to appraisal. These cost overruns were accommodated with the reduction of the scope and appraisal cost estimate of Component IV through a revision of the LGS, since it was noted that (a) the cost of the component of UA 13.63 million had been over estimated at appraisal due to inadequate project preparation, and (b) the various items to be procured under the component would cost up to about 30% of the total estimated cost. The effect of the reduction of the scope of the component was a further reduction of the component cost to about 21% of the appraisal cost estimate. The table below shows the comparison of the appraisal and actual project costs:
Table 3.1 Comparison of Project Cost at Appraisal with Actual Cost in UA Million
Component At Appraisal Actual F.E L.C Total F.E L.C Total
I. Keffi/Akwanga WS Scheme 50.12 4.70 54.82 50.12 5.21 55.33 II. Doma WS Scheme 8.73 1.09 9.82 9.01 0.95 9.96 III. Jos-Bukuru WS Scheme 16.81 2.99 19.80 25.68 12.20 37.88 IV. Workshop, Stores, Operational Equipment 10.67 2.96 13.63 1.84 1.02 2.86
V. Technical Assistance 2.83 1.21 4.04 3.78 0.07 3.85 VI. Engineering Services 3.84 0.48 4.32 3.30 0.17 3.47
Total Cost 93.00 13.43 106.43 93.73 19.62 113.35
3.7 Financial Resources At appraisal, the total expected contribution of the Bank was about 88.3% of the estimated total project cost of UA 106.43 million. At completion, however, the Bank’s contribution reduced to 82.7% despite the increase in project cost. The total contribution of the Plateau and Nasarawa State Governments, on the contrary increased from the appraisal level of 11.7% to about 17.3% at completion. The two State Governments contributed a total of about UA 19.62 million representing about 58% increase in their expected total contribution of UA 12.42 million at appraisal. The comparison of the financial resources for the project at appraisal and at completion is summarized in Table 3.2 below:

7
Table 3.2
Comparison of Financial Resources at Appraisal and Completion (In UA Million)
Appraisal Actual Gap Funding Source
FC LC Total % FC LC Total % Value %
ADB 90.17 0.00 90.17 84.72 89.95 0.00 89.95 79.36 -0.22 -0.24
ADF 2.83 1.01 3.84 3.61 3.78 0.00 3.78 3.33 -0.06 -1.56
PSG/NSG 0.00 12.42 12.42 11.67 0.00 19.62 19.62 17.31 7.20 57.97
Total 93.00 13.43 106.43 100.00 93.73 19.62 113.35 100.00 6.92 6.50
3.8 Disbursements 3.8.1 The total amounts disbursed from the ADB and ADF loans are UA 89.95 million (99.8 %) and UA 3.78 million (98.7 %), respectively. The loan balance of UA 0.22 million for ADB loan and UA 0.05 million for ADF loan have been cancelled. 3.8.2 Initially, the PLSG succeeded in settling most of the local payments due to the contractors, suppliers and consultants. The total amount paid from counterpart funds is about NGN 871.45 million out of a total committed amount of NGN 1,026.29 million (UA 19.62 million), which amount is far in excess of the appraisal estimate of NGN 162.56 million. Counterpart fund payments encountered long delays mainly due to unavailability of funds. Recently executed contracts (under Component IV) based on revision of the List of Goods and Services (LGS) continue to suffer from non payment of counterpart funds. The amounts outstanding are NGN 145.56 million and NGN 22 million payable by the Plateau and Nasarawa State Governments, respectively. The issue has had adverse effects on timely completion of works, particularly the construction of the headquarters building for the two Water Boards and the external works at the Eastern Reservoir site in Jos. 3.8.3 Generally, Bank disbursements were made expeditiously once the process for payment was completed. However, during project execution, the PSG and NSG had difficulties in monitoring Bank disbursements. Confirmed disbursements were sent directly to the Ministry of Finance, without copies sent to the Executing Agency. 3.8.4 At appraisal, it was anticipated that about 20%, 60% and 95% cumulative disbursements would have been made at the end of the first, second and third year, respectively. At completion, these anticipated levels of disbursement could only be achieved at the end of the third, fifth and eighth year, respectively. The comparative yearly and total amounts disbursed are presented in Annex 4. 3.8.5 The disbursements were made over an extended period of 13 years instead of the estimated 4 years at appraisal. The last date of disbursement was extended eight times for a total cumulative period of 7 years 6 months to enable completion of the works.

8
3.9 Performance of Contractors, Suppliers and Consultants
Contractors 3.9.1 With the exception of the civil works contractor for the Jos-Bukuru Scheme and the contractors for the two headquarters buildings, the overall performance of all the contractors was generally satisfactory. Most of the works were fully executed and generally in accordance with engineering specifications and procedures, though sometimes with delays of several months. In particular, the following reflect the performance of the various civil works contractors:
a) The quality of workmanship of the concrete works for various structures under the Keffi-Akwanga/Doma schemes was considered to be good.
b) The flood, which caused extensive damage to the various crossings of the Mandara-Keffi gravity main during the successive rainy seasons, could be attributed to the poor performance of the contractor. The defects were corrected later by the same contractor.
c) With the Jos-Bukuru scheme, the quality of the various concrete works executed was very poor, e.g., the 12 000 m3 storage reservoir (Eastern Reservoir) which was completed in year 2000 could not be put in service until October 2003 due to excessive leakage as a result of very poor workmanship. The same contractor remedied the leakage by lining the inside walls, floor and columns with a special geo textile and PVC membrane and testing for water tightness for 21 days.
Suppliers
3.9.2 Suppliers executed their contracts satisfactorily.
Engineering Consultants
3.9.3 The overall performance of the engineering consultant is judged to be satisfactory with regard to engineering design of the water supply schemes. Their overall performance with regard to construction supervision and contract management is assessed to be unsatisfactory due to inadequate quality control for the Jos-Bukuru scheme and inadequate contract management for the Keffi Akwanga scheme. The following reflect some of the poor performance of the consultant:
a) Contract A (Construction Engineering and Pipeline Installation Work) of Keffi-Akwanga/Doma schemes incurred huge cost overruns, partly due to the consultant allowing the application of a price escalation formula to some contracts, which over-benefited contractors at the expense of the Client. Additionally, there were huge work variations due to different site conditions, additional works, etc., despite the fact that the same supervising consultant carried out the preliminary and detailed designs including tender documentation.
b) The flood, which caused damages at the various crossings of the Mandara-Keffi gravity main during the successive rainy seasons, could be attributed to poor engineering design.
c) The inadequate quality control of the civil works for concrete structures under the Jos-Bukuru scheme, among others.
Consultants for Supervision of Head office Buildings
3.9.4 As a result of the expiry of the engineering services contract for the main civil works under the project, the consultants from the Plateau State Ministry of Works, Jos were engaged in February 2002 to be in charge of engineering and architectural supervision of the construction of head office complex and modifications of workshops and stores. In addition, the consultants prepared interim payment

9
certificates, monthly progress reports on the works and a revised bill of quantities for the client. Their performance has been rated satisfactory by the Executing Agency. Similarly, the performance of the consultants engaged by the Nasarawa State Water Board to supervise construction of the head office building has been rated satisfactory.
Management Consultants 3.9.5 The management consultants carried out diagnostic studies and made recommendations for strengthening the internal structure of the PSWB and NSWB through staff training that cut across all the departments. The areas covered were Engineering, Production, Distribution, Finance, Commercial, Audit, Administrative, Personnel, Training and Computer technology courses. The management consultants also designed, developed and installed operating systems and procedures which ran across general accounting, management accounting, asset management and inventory control, internal auditing, commercial operations, organisation and personnel, computerisation of systems and operations. Implementation of the designed systems did not improve the operational performance of the PSWB and the NSWB. 3.9.6 The consultants carried out the necessary re-structuring of the Water Boards along commercial lines as required under the project, though they made recommendations to that effect. The majority of the management systems the consultants proposed were not implemented by the Executing Agency. The Executing Agency did not take advantage of the training provided by the consultants in order to substantially improve the quality of management and to ensure significant increase in the productivity of staff of the Water Boards. After the completion of the consultants’ assignment, no marked improvement could be seen in the sufficiency and timeliness of the information generated by the PSWB. The management practices and decision making process remain the same as in 1991. The failure in bringing about the required institutional and management reforms in the Water Boards was reluctance on the part of the State Governments/Water Boards to implement recommendations of the Consultant. 4. PROJECT PERFORMANCE 4.1 Operational Performance 4.1.1 The infrastructure envisaged at appraisal for the three schemes have all been provided and are operating satisfactorily and in accordance with design specifications since their commissioning, (Doma, 1996; Keffi-Akwanga, 1997; and Jos-Bukuru, 2000). All the three schemes rely on power supply provided by NEPA for the transmission of the treated water. The power supply from NEPA is irregular and unreliable as a result of which all of them operate only when NEPA power is available. All the three schemes use stand-by generators, which makes their operation very costly. However, due to the lack of continuous supply of diesel fuel, the generators are rarely operated. 4.1.2 Operational deficiencies resulting from inadequate maintenance including supply of spare parts, inadequate and irregular supply of electric power, among others, seem to impact on the operational performance of the three schemes.
4.1.3 Keffi/Akwanga Scheme: Production at the Plant is about 38 200 m3/d representing 61% of the installed capacity and with about 10 hours and 12 hours pumping time for Keffi and Akwanga, respectively. The limited operational hours are attributable to the need for a) reduction of costs of pumping, and b) conservation of water as charges for water consumption are on flat rate basis. The main operational problem encountered is the periodic siltation of the intake.

10
4.1.4 Doma Scheme: Production at the Plant is about 9 000 m3/d which is about 69% of the installed capacity and with about 8 hours pumping time. The limited operational hours are attributable to similar reasons stated in the preceding paragraph. The main source of power supply is the two diesel generator sets, one of which is out of service thereby reducing the capacity to generate electric power. Additionally, roofs of buildings at the plant site are periodically ripped off due to wind storms. 4.1.5 Jos-Bukuru Scheme: The Plant has a total installed capacity of 90 000 cu m per day. Available record indicate that average annual production from year 2000 to 2003 was about 33 000 m3/d. However, in the last quarter of 2004, the figure increased to about 42 400 m3/d which is about 47% of the installed capacity. The Plant is operated in three shifts with an average pumping time of 12 hours per day. In the same period, power supply to the plant of good voltage to enable operation of pumps, etc., was about 42% of the total supply hours. The main operational deficiencies include siltation of reservoirs, inadequate and irregular supply of power from NEPA due to low voltage, overload, etc., infrequent use of the available generator set due to high fuel consumption costs, inadequate supply of reagents for chemical analyses, inadequate road access to the plant site, among others. 4.2 Institutional Performance 4.2.1 The performance of the Plateau State Water Board which later split into two Boards after the division of the Plateau State into Nasarawa and Plateau States, has not been satisfactory. Both institutions continued to suffer from the same weaknesses that were diagnosed at the time which include: (a) unsuitable institutional arrangements under which the utilities are placed, (b) inappropriate organizational system, and (c) weak management due to low technical and managerial skills. These deficiencies were expected to have been corrected during the implementation of the project so that when the project became fully operational, the Water Boards would have been transformed into efficient utilities. 4.2.2 Top management of the Plateau State Water Board remained unstable during the entire period of project implementation, due to a high turnover of senior staff. The positions of the General Manager and the Project Manager changed hands several times since project appraisal in 1991. Other key staff also left the Boards due to low remuneration and poor working conditions. This situation had a negative impact on the performance of the two Water Boards and on the execution of the project. However, the working conditions of staff have greatly improved recently enabling the institutions to attract qualified staff even from the private sector. 4.2.3 There was no change in the legislative environment in which the PSWB and NSWB operate under as the Boards continue to function under the then existing edict which granted the Governments full control over the utilities. The institutions operate under the civil service rules and procedures in the conduct of their activities. The institutions therefore lack operational, managerial and financial autonomy to run their business, which situation was prevailing at the time of project appraisal by the Bank. This lack of autonomy has been an impediment to the performance of the Water Boards during and after the execution of the project. 4.2.4 There has not been any marked improvement in the management efficiency and effectiveness of the Water Boards since the project was appraised. The Board of Directors of the PSWB was re-constituted in October 2004. The deficiencies which were identified in the old structure were not corrected during project implementation. The institutional and managerial reforms which were planned by way of restructuring of the water utility have not taken place as anticipated. 4.2.5 There was practically little improvement in the management of the executing agencies despite the expenditure of substantial resources to address this problem. During the project,

11
comprehensive management systems were designed for the Executing Agency in the areas of organization, accounting and financial management, billing and collection, personnel management, and tariff structure and consumer census, and attempts were made to introduce these systems into the institutions after training of staff in the new systems. However, because of internal resistance within the institutions, very few of these systems were installed and are functional. The old systems continue to operate, and as a result, very little information is generated for appropriate and timely decision making. Thus, the operational and financial performance of the Water Boards continued to be unsatisfactory since the project was appraised. 4.2.6 The technical expertise of staff continues to be low as originally observed during the appraisal of the project. The institutions still have very few engineers, accountants and commercial officers. The problem was compounded by the embargo on recruitment of new staff during the period of project execution. Extensive training in both technical and managerial fields has been carried out internally and abroad during project execution. Some of the training has been beneficial. However, the impact of the training on the Water Boards has been quite limited. 4.2.7 The planned commercialization programme, which was a loan covenant, has not been implemented due to State Governments’ resistance to move in that direction. As a result, the water boards still find themselves under the control of the State Governments and this has a negative impact on their performance. 4.2.8 Conditions/Covenants: There were a total of eight conditions to be fulfilled precedent to entry into force, which were mostly undertakings. However, these were partially fulfilled by the Plateau and Nasarawa State Governments. The time frame for fulfillment of each condition was not respected. The conditions yet to be fully executed include the following:
• full privatization of PSWB/NSWB subject to satisfactory performance; • submission to ADB of measures for recovery of accounts receivable; • regularization of all illegal connections; • The execution of institutional reforms and commercialization programme as
recommended by the management study carried out under the project has been unsatisfactory.
4.3 Financial Performance 4.3.1 The financial performance has been measured by adequate income to cover the operational expenses, financial viability, and fulfillment of financial covenants vis-à-vis local counterpart funding and auditing of the project accounts. The financial performance viz profitability has been weak for the past 10 years (Reference is made to Annexes 5 and 6). Notwithstanding the completion of the project whereby improvement in water production was achieved, losses through leakage due to old, weak and worn-out reticulation system impacted adversely on the achievements. Additionally, revenue generated cannot cover operating costs and this is due to low tariffs, high operating costs and poor collection of revenue. Performance of the water boards remains weak in the area of credit policy management. 4.3.2 A review of the tariff levels to determine adequacy of both boards shows that these are totally inadequate and have been one of the reasons for the poor financial performance of the Boards as earlier noted. In both Boards, tariff levels are below the 1991 levels in real terms. For example, in PSWB, the highest monthly tariff for a domestic consumer with a house connection was NGN 86.00 (US$ 9.35) in 1991 and NGN 140 (US$ 1.00) in 2005. For NSWB, the same rate was 86 (US$ 9.35) in 1991 and NGN 100 (US$ 0.71) in 2005. The continued dependence of the two water boards on scare public funds, which could be spent on urgent social needs such as education and health services, should therefore be seriously examined by the State Governments.

12
4.3.3 Financial Covenants: The financial covenants associated with the project relate to (i) adequate budgetary allocations, (ii) meeting cost overruns, and (iii) no financing of local taxes, customs, etc., from the proceeds of the loan. These covenants were followed by the Executive Agency during the implementation of the project. However, it is pertinent to mention that in the latter stage of project implementation, no adequate budgetary allocations were made and this attributed to some of the delays in completing the project. 4.3.4 Financial Viability: The financial viability is measured through Financial Rate of Return (FRR) which was estimated at 12.6 % at appraisal. The re-calculated FRR is –5 % as shown in Annex 8. The FRR is far below the borrowing rate of 7.5 and therefore the project is not financially viable. The basic reasons for the negative rate of return include, (i) delays in project completion of almost 10 years resulting in delayed cash flows, (ii) low tariffs, and (iii) low volume of water produced due to irregular power supply from NEPA 4.4 Economic Performance 4.4.1 The economic justification at appraisal was based on qualitative analysis vis-à-vis water availability, socio-economic activities, reduced water borne diseases, impact on low income group and on women. Quantitative benefits in the form of revenues from water sales and service connection fees have been used in the calculation of Economic Rate of Return. Non-quantifiable benefits such as improved health, savings on medical expenses, increased productivity etc. have not been taken into account due to non-availability of data and therefore are only recognized in qualitative terms. The Economic Rate of Return (ERR) was calculated after adjustments to costs and benefits. The ERR was 4 % as shown in Annex 9. The ERR is lower than the opportunity cost of capital in Nigeria estimated at 10 %. The reasons for the low rate of return include, (i) delays in project completion of almost 10 years resulting in delayed benefits, (ii) low tariffs, and (iii) low volume of water produced due to irregular power supply from NEPA resulting in low benefits flow. 4.4.2 Other quantifiable benefits resulting from the project include improved supply to the area which has improved the socio-economic stance of the city’s dwellers. The provision of water by the Board has ensured a consumption based tariff and drastically reduced industrial product on costs where presently water supplied by vendors is purely on demand and supply. The potential health benefits which have resulted from the increased availability of clean potable water for domestic needs are obvious. Improved health had a chain reaction in the form of reduced medical bills, increased time to attend to other economically beneficial activities and as a result improved the socio-economical levels of the society. 4.4.3 Before implementation of the project, water for drinking and domestic purposes for the low income groups in the project area was collected from distant sources of dubious quality due to lack of water supplies nearby and the exorbitant prices charged by the private water vendors. The project has ensured that water is available to these groups within short distances through yard and communal taps. 4.4.4 The project has had significant impact on the women in the area. First, since it is traditionally women’s responsibility to ensure adequate supply of water in the household, they are currently forced to travel great distances. With the availability of water in greater number of homes, they have devoted the saved time for other economic activities. Furthermore the impact of potable water on the health of women and children is well known. Finally the project has accorded increased equal opportunity for employment of women in the two Boards.

13
5. SOCIAL AND ENVIRONMENTAL IMPACT 5.1 Social Impact
5.1.1 The provision of potable water supply has improved the social condition of the population in the project areas and signs of social change in this regard can be observed. The improved water supply in sufficient quantities has substantially raised the standard of living of the population by reducing the time spent on obtaining unsuitable water from distant sources especially by women and children. The time saved is being utilized for the pursuit of other economic or social activities. Another impact of the project on the population in the area is that it has increased the awareness of the communities served of the scarcity of resources and the high cost of water provided to them. As a result, contrary to what was prevailing in the past, consumers have been very co-operative in assisting the Water Boards to improve their operations with regard to reduction of water losses through leakages and illegal connections. The availability of water to most of the population through the sharing of yard taps has contributed to the increased level of community cohesion and co-operation which in turn have a positive impact on the social harmony of the people in the project area. Finally, the economic contribution of the project, as a result of the gains in additional income leading to increased consumption of available goods and services will bring about social changes in the long run.
5.1.2 The project is having a positive impact in the reduction of poverty in the area through increased production of goods and services. In Jos, several industries have started to fully utilize their existing capacities or are increasing them, which was not possible previously due to non-availability of water in sufficient quantities. In other areas, the informal sector is taking full advantage of the improved water supply through resale of water either in small quantities to the general public or in bulk to people in remote areas who have no direct access The result of these increased economic activities is leading to higher production of goods, increased employment and increased income for additional consumption. 5.1.3 The impact of the project on women and children in the area is quite profound. Before the execution of the project, women used to spend considerable part of their time to look for water sometimes from remote sources. The availability of water supply due to the project has reduced the time spent on this effort, thus enabling women to use time saved in the pursuit of other economic and social activities. 5.1.4 It is observed that the project is having positive impact on the education and health sectors in the area. Before the project, outbreaks of water-borne diseases such as typhoid and dysentery in Doma and Keffi/Akwanga and in the unconnected parts of Jos were very common. Limited incidences of these diseases have been reported in the project area since the completion of the project. The project has also made potable water available to all the heath facilities in the project areas, thus improving the health delivery system in the two states. Furthermore, nearly all categories of the educational institutions in the area have been connected to the water supply from the project. It was also noted that government investment in education and health has substantially increased in the past few years. The availability of water was also a major factor in building important educational facilities in the areas. Additionally, the supply of potable water supply in the project areas has led to an improvement in school attendance by children especially girls.

14
5.2 Environmental Impact 5.2.1 At appraisal, there were no Bank environmental guidelines, procedures and categorization of projects. However, no significant environmental concerns were envisaged. The laying of pipes seemed to pose some temporary environmental risks, particularly in residential and commercial areas. The construction processes and additional measures taken including traffic diversion, erection of warning signs, isolation of excavated trenches, etc., ensured that such risks were mitigated. There was no resettlement of people and also no incidence of encroachment on sites of cultural and archeological importance during construction. 5.2.2 The increased waste water resulting from increased water supply required improvement in the existing wastewater collection and disposal system. It was envisaged at appraisal that the situation was going to be addressed through integration of the then ongoing drainage works into proposed development programmes to be considered in the update of the feasibility studies. Gains made in the development of drainage infrastructure in the project areas have been rather limited. However, the environmental impact of increased water production and use is considered to be insignificant due to the following:
a) The abstraction of water from the run of the Mada River without impoundment (Keffi/Akwanga), from an existing impoundment constructed by the Federal Government initially for irrigation (Doma), and from the existing Yakubu Gowon dam, which is the main source of water supply to the Jos-Bukuru metropolis to meet the additional demand of 45 000 m3/d do not seem to have any significant environmental impact on the resource potential of the water sources. The NSG and PSG have acquired the right to use the sources for drinking water supply.
b) The provision of laboratories supplied with testing equipment and materials contributed to optimize the water treatment and quality control processes. The likely contamination of surface and ground water sources due to spillage of stored chemicals for treatment, increased generation of domestic and industrial waste water, etc., seem to pose limited environmental risk to both water sources given the geology of the area, standard of living of the population, level of industrial development, and resource potential of the sources. However, the access road from Doma (about 10 km), and from Jos (about 16 km) to the treatment plants require upgrading to reduce the dust nuisance created as a result of vehicles plying the roads. This nuisance may be of grave environmental concern to future development along the roads.
6. PROJECT SUSTAINABILITY 6.1 The sustainability of the project would depend on the long term technical, managerial and financial performance of the Water Boards. In this regard sustainability is measured by the following: maintenance capacity and availability of technical personnel, metering of consumers, adequate tariff levels to generate enough income to meet recurrent expenditure (i.e. full cost recovery system) and commitment on the part of the Government to private sector participation (PSP). 6.2 With ADB financing, PSWB and NSWB staff who were involved in the operation of various components of the system underwent sufficient training to enable them operate and maintain the system efficiently. Production and maintenance staff were trained in the operation and maintenance of the various plants at the Head works and Booster stations. The training that was programmed notwithstanding, recruitment of professional staff in key areas such as production and maintenance has not been effected. Although the water works are presently being operated and managed by competent technical expertise, lack of spare parts is a major bottleneck to sustainability of the project. The normal operation of the project would require regular supply of spare parts for the equipment.

15
6.3 Metering of consumers is not yet extensive and should be expanded in order to have wider coverage to facilitate the reduction of administrative losses. A large number of standpipes should be installed and the same needs to be accelerated and ensure care and maintenance of the facilities. In order for the project to be sustainable, PSWB has legalized most of the illegal consumers resulting in a total of about 28,000 registered consumers serving about 840,000 people in both urban and semi urban areas. 6.4 The Boards have not made serious efforts in increasing tariff levels, and are yet to charge an economic price towards achieving cost recovery. The present tariff levels are insufficient to generate enough revenue to meet the recurrent expenditure. The average tariff currently charged by PSWB is NGN 140 /m3 whereas the economic price has been estimated at NGN 200/m3. The present tariff levels cannot ensure the financial sustainability of the project. 6.5 The sustainability of the project under current operating conditions is unlikely. It would be very difficult for the Water Boards in their present operating environment to internally generate enough funds in the short to medium term to cover operation and maintenance costs, let alone provide for depreciation based on re valued assets and contribute to system expansion. Major transformation in the operating environment is mandatory. Sustainability is probable if timely steps are taken to involve private sector participation in some of their operations, where feasible, and to continue the proposed phased investment programme for the future. 7. PERFORMANCE OF THE BANK AND THE BORROWER 7.1 Bank Performance 7.1.1 At appraisal, the Bank’s assessment of the PSWB’s ability to achieve financial viability within the time frame of the project was unrealistic, underestimating the difficulties involved in implementing major change within a very fragile institutional context. Additional analysis might have led to recommending a gradual time bound set of measures, possibly with some degree of conditionality. The Bank’s assumption that huge annual tariff increases to meet financial objectives could be effectively met was thwarted by the poor quality of the service provided and the weak billing and collection systems. 7.1.2 In terms of expediting loan effectiveness, the Bank performed well, although it is pertinent to mention that the response time from ADB between the fulfillment of each condition could have been made shorter. Although one should not lose sight of the important and facilitative role the ADB played in assisting the Government process the loan from the first approach to the date the loan was declared effective. 7.1.3 Confirmed disbursements were hardly sent to the EA to enable adequate tracking of payments made directly to consultants, contractors and suppliers resulting in inadequate record keeping by the EA on payments. The Ministry of Finance, however, received such confirmed disbursements regularly and directly from the Bank since the Ministry could be easily reached by the Bank. 7.1.4 Regarding supervision, the Bank’s performance was satisfactory. The composition of supervision teams, the mix of skills seemed to be adequate. There was continuity in Bank’s supervision staff, which helped to foster trust and willingness on the part of PSWB sometimes to take very difficult decisions within a very challenging operating context.

16
7.1.5 The Bank’s performance with regard to some aspects of project execution was unsatisfactory based on the following:
a) Bank’s decision to award Contract A (Civil Works and Pipe Laying) of the Jos-Bukuru scheme to the firm which submitted a complaint to the Bank rather than the firm which was recommended by the EA, caused delays in the commencement of the contract and also strained later the relationship between the Client and the contractor.
b) The Bank’s decisions, on many occasions to suspend disbursements on the project, as a result of non-payment of counterpart fund arrears by the Federal Government of Nigeria, caused cost overruns due to claims by contractors as well as delays in the implementation of the Project.
c) The Bank caused delays as a result of its decision to award the contract for supply of additional fittings for pipelines under the Jos-Bukuru scheme to the main supplier of the pipes and fittings for the Keffi/Akwanga and Doma schemes, which at that time had completed its contract and was demobilized, instead of the firm recommended by the EA as the lowest evaluated bidder.
7.1.6 The Bank’s overall performance is judged to be unsatisfactory. 7.2 Borrower Performance 7.2.1 There were a number of problems associated with the Borrower which rendered it a low performer. These included: a) inadequate provision of counterpart funds, b) general failure to justify on a timely basis, utilisation of resources disbursed into revolving funds, c) poor co-ordination of the project at different levels vis-à-vis Federal, State Government and Executing Agency, and d) the recurring problem of arrears on loan repayments which caused imposition of sanctions on the country. 7.2.2 Contrary to the undertakings made by the PSG in the loan agreement to retain senior management staff of the PSWB, the General Manager of the PSWB was changed five times and the Project Manager twice. 7.3 Executing Agency’s Performance 7.3.1 The Executing Agency submitted quarterly progress reports on time. However, the performance of the Executing Agency (EA) in monitoring the implementation of the project was not satisfactory on account of the following:
a) The EA used revolving funds from the ADB loan to finance logistics and other operational
items to assist the PIU though this was not included in the original financing plan. The EA’s response was that the creation of the PIU was a condition of the loan agreement and therefore the funds necessary for the PIU to become functional were not originally provided for by the Government. As a result, at the request of the EA the Bank approved disbursements to be made in this regard.
b) The EA allowed additional works to be carried out without obtaining the necessary approval for variation orders from the Bank. The EA’s response was that the additional works, which were carried out periodically were for very critical items of the project. It gave its approval in principle for the works to be carried out in order to save time and to avoid further cost overruns, in anticipation that the Bank would agree to the variation orders after the necessary documentations were submitted to the Bank.
c) The EA utilized the Retention Money to pay interim certificates for Contract A under the Keffi-Akwanga scheme. The EA’s response was that it believed that the Bank had an accounting system to withhold Retention Money until specific requests were made for their disbursement.

17
d) The EA allowed the application of a price escalation formula to some contracts which over-benefited the contractors at the expense of the Client. Some indices, e.g., fuel were overly weighted in anticipation of fuel price increases by the Federal Government resulting in the huge price escalations, particularly given the delays encountered.
8. OVERALL PERFORMANCE AND RATING 8.1 Generally, all necessary infrastructure provided under the project are in serviceable condition and operational. Some equipment, e.g., pumps, generator sets, etc., have limited technical operational deficiencies requiring the urgent attention of the PSWB and NSWB. 8.2 The overall implementation performance may be considered unsatisfactory with a rating of 1.8 out of 4. This is a result of inadequacies with regard to adherence to planned implementation schedule, full compliance with agreed covenants and maintenance of infrastructure provided. The Bank’s overall performance is considered unsatisfactory with a rating of 1.8 out of 4. Overall performance ratings are presented in Annex 10. The overall project outcome rating (shown in Annex 11) of 1.6 out of 4 is considered unsatisfactory. 9. CONCLUSIONS, LESSONS LEARNT AND RECOMMENDATIONS 9.1 Conclusions 9.1.1 The primary objective of the project was to provide improved water supply to Keffi, Akwanga and Doma townships, as well as to increase the capacity of the water supply system of the Plateau State Capital, Jos-Bukuru Metropolis. All the project areas have been provided with improved access to good quality water supply. The secondary objective was to create favourable working conditions and economic and financial set-up for the PSWB to enable it to function efficiently, sustain its investment and operate on a cost recovery basis. This objective has not been fully achieved mainly as a result of the reluctance of the State Governments to pursue the necessary reforms recommended by the Management Consultants. 9.1.2 The institutional reforms as recommended by the management study carried out under the project, has not been fully implemented. Also, the implementation of the financial aspects concerning arrears and the time it took in legalizing most of the illegal consumers has not been satisfactory. This impacted negatively on the financial performance of the Boards. 9.1.3 The issue of non payment of counterpart funds by Plateau State and Nasarawa State Governments has had adverse effect on timely completion of works, particularly the construction of headquarters building for the two Boards and the external works at the Eastern Reservoir site. 9.1.4 The overall implementation performance and project outcome ratings are unsatisfactory. The issue of operational deficiencies due to inadequate power supply, limited supply of spare parts, inadequate billing and revenue collection, among others, may have an adverse impact on the long term sustainability of the investments made under the project. 9.1.5 The FRR and ERR for the project are – 0.5 % and 0.4 % respectively signifying that the project is not financially and economically viable. 9.2 Lessons learnt 9.2.1 At appraisal, there were difficulties encountered to provide estimates for indicators such as u-f-w, number of existing connections, number of billed consumers, etc. This situation leads to

18
compilation of an inadequate data base which in turn is used to make projections. The result is a wide gap between projections and actual outcome. Projections which are continually updated during project implementation provide a better opportunity for measuring development impact. 9.2.2 It has been noted that the project was appraised on the basis of preliminary engineering design. The Bank should pay more attention to project preparation in general and to review studies which underpin such preparation in particular. The excessive cost of the Jos-Bukuru scheme of about twice the appraisal estimate on completion could have been avoided if the relevant feasibility studies and engineering designs had been carried out prior to appraisal of the entire project. Additionally, inadequate project preparation may result in over estimation of project costs leading to the signing of loan agreements for which the Borrower may unjustifiably be required to make payment of commitment charges on undisbursed amounts. 9.2.3 Expectations on project start-up should be carefully examined in line with a) an Executing Agency’s prior experience with Bank financed projects, particularly with procurement rules, b) prior experience of similar agencies within a given country, and c) the types of management system existing, i.e., whether highly centralized or effectively decentralized, and d) the likely date of achievement of loan effectiveness. This will ensure that realistic start-up dates and implementation schedules are applied in order to minimize start up delays and deviations from planned implementation schedules. 9.2.4 The Bank’s review of documents prepared by consultants for procurement of works without much consideration of price adjustment formulae and indices may result in excessive price escalation of project costs thereby affecting the scope of work to be carried out under a given project. 9.2.5 Transformation of a public corporation into a financially viable one is a very gradual process which cannot be achieved in one project. The barriers to success include civil service culture, uncompetitive salaries, inexperienced management and government’s unwillingness to grant autonomy. 9.2.6 In line with the Federal Government’s and the Bank’s policy at the time, the ADB suggested and initiated the undertaking of reforms in order to ensure the long-term viability of the project and the Executing Agency. It is now clear that neither the State Government nor the Water Board was committed in reality to the successful implementation of the programme. In future, in order to protect the scarce resources, all parties concerned must be particular with the design of any project for which the necessary commitment does not exist on the part of the beneficiaries. 9.2.7 The time frame envisaged for achievement of a project’s institutional goals must be realistically matched with existing capacity. The duration of the Water Boards’ development plan was probably too short or the plan itself was too ambitious. A number of initiatives were programmed to take place simultaneously which impacted on the capacity of the Boards to undergo change. Nevertheless, institutional development was a key concern, and the overall institutional measures planned were individually sound. Provision of technical assistance has to be planned in a manner to optimize the benefits derived. 9.2.8 Financial covenants need to be tailored to specific Water Board conditions. The fact that the revenue covenant was complied with over several years with an unsatisfactory outcome, reflects on the poor design of the covenant. 9.2.9 Close attention needs to be paid to consumer connections and customer management in project design and implementation. Replacement of most of the existing poor quality consumer connections in Jos and Lafia was probably a more cost effective approach to u-f-w reduction

19
especially physical losses (of which about 60% was lost through consumer connections). Such new connections could have been designed to facilitate identification of connection with overdue accounts. In this way, technical operations and revenue generation could have been effectively linked. 9.2.10 Although the project’s objectives were clear and consistent with the underlying goal to develop the Water Boards over a long term period, the major problem with the project’s objectives which made it difficult for their attainment is that they were too ambitious to be achieved in a single project. The financial objectives were unrealistic given the very weak database on production and consumption and the low level of operating efficiency. Secondly, the timeframe for achieving financial viability is generally linked to physical progress. All of the previous water supply projects in Nigeria experienced start-up delays, but the appraisal report did not appear to consider the impact of a possible start-up delay in setting the timeframe for reaching financial viability. 9.2.11 The principal risk of the project was fairly well identified in the appraisal report as being Water Boards’ lack of autonomy to oversee the project to its satisfactory implementation, including its inability to implement a full economic, cost-reflecting tariff policy. Measures were mentioned in the appraisal report to mitigate this risk. The autonomy was not granted, and a cost-recovery tariff was not effectively implemented. In retrospect, while a full economic tariff policy is desirable, the appraisal report was not realistic in its expectations that this should be achieved within the timeframe of the project as this would have required frequent sizeable tariff increases irrespective of the standard of service. This was complicated by the fact that customer enumeration was non-existent. The appraisal report did not provide for customer awareness programmes combined with regular support from the State Government. 9.3 Recommendations The following recommendations are made on actions to be taken by the two State Governments, the Executing Agencies and the Bank to optimize the benefits and ensure sustainability of the project: To the State Governments/ Water Boards 9.3.1 The Plateau and Nasarawa State Government should provide the necessary counterpart funds to enable completion of the remaining works. 9.3.2 The State Government should endeavour to provide dedicated 33 KVA power supply lines in order to improve NEPA power supply to all treatment plants. In addition, all access roads to treatment plants and service reservoirs should be upgraded to reduce the wear and tear on operational vehicles and the dust nuisance caused as the vehicles ply these roads. 9.3.3 The State Governments should consider an evolution of Private Sector Participation in the production, distribution and maintenance of the water systems, billing and collection of revenue to ensure sustainability of the Water Boards. 9.3.4 Given the need for institutional and management reform of the two Water Boards, it is recommended that they pursue the reform measures necessary to enable them operate efficiently and effectively. 9.3.5 Since both State Governments have made heavy investments in the sector through the project and other schemes, the Water Boards must be able to generate sufficient resources to operate on their

20
own without government subvention. It is therefore recommended that the Water Boards immediately embark on the commercialization program planned at project appraisal. 9.3.6 Before the commercialization program becomes effective, the Water Boards must allow for adequate and timely tariff increases in order to ensure their financial soundness, long-term viability and sustainability. 9.3.7 It may be desirable for the PSWB and NSWB to have a continuous training programme through Training of Trainers scheme to provide the Boards with qualified staff to effectively and efficiently manage all technical infrastructure, improve productivity and reduce staff expenditure. 9.3.8 Although, the project is completed, the State Governments should: (a) payment of counterpart funding by the State Governments; (b) fulfillment of conditions and covenants; (c) reform measures necessary to enable the institutions operate on a cost recovery basis; (d) commercialization program planned at project appraisal; and (e) regular and adequate tariff increases in order to ensure the sound financial footing, long-term viability and sustainability of the Water Boards. The Bank should through the NGCO monitor the actions. Future Operations of the Bank 9.3.9 The Bank should ensure that the Executing Agencies receive confirmed disbursement data to enable monitoring of payments. The Bank should explore the possibility of extending the scope of SAP to enable timely information of Task Managers, the NGCO and Executing Agencies of confirmed disbursements.
9.3.10 State Governments should provide the needed counterpart funds for each year to be paid to a dedicated account at the beginning of the year before yearly Bank disbursements are made. 9.3.11 The Bank should formulate a more pragmatic policy on Private Sector Participation (PSP) and commercialization of Water Agencies in the Regional Member Countries. 9.3.12 In designing projects, the Bank should put emphasis on demand driven participatory approach in this type of urban environment and dialogue comprehensively with the beneficiary community and implementing agencies.

ANNEX 1
NIGERIA PROJECT COMPLETION REPORT
PLATEAU STATE WATER SUPPLY PROJECT
PROJECT LOCATION MAP
This map was provided by the African Development Bank Group exclusively for the use of the readers of the report to which it is attached. The names used and the borders showndo not imply on the part of the Bank and its members any judgement concerning the legal status of a territory nor any approval or acceptance of these borders.
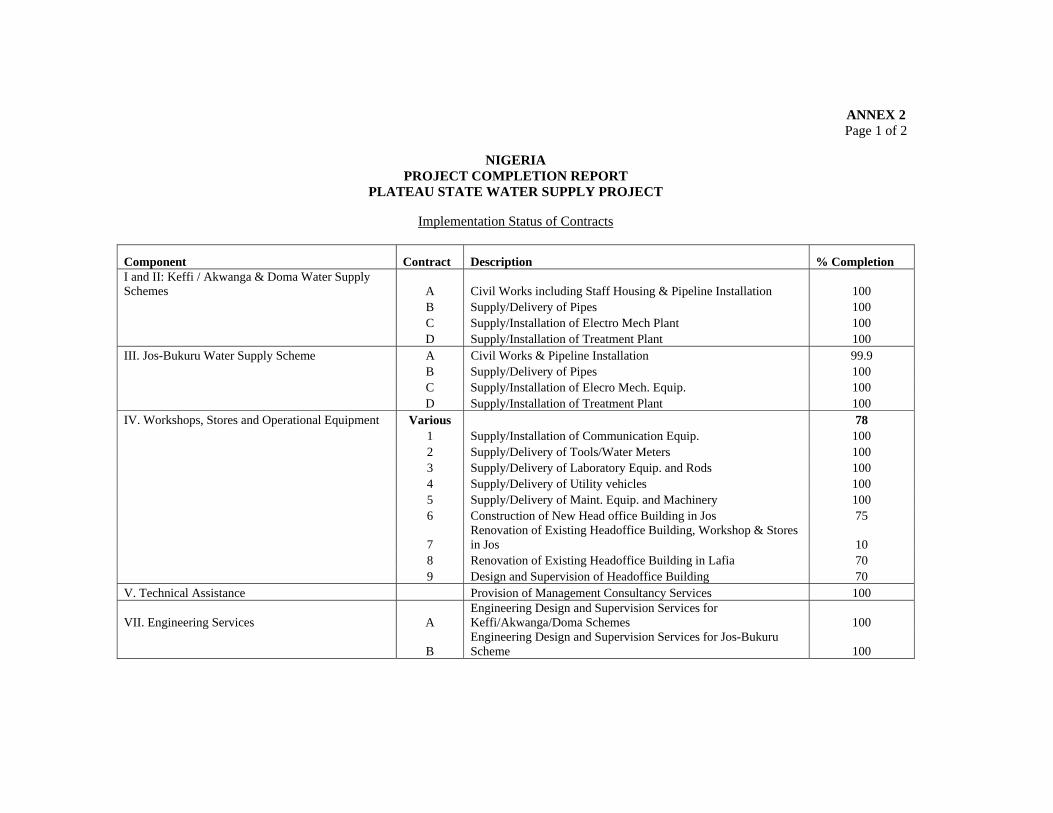
ANNEX 2 Page 1 of 2
NIGERIA
PROJECT COMPLETION REPORT PLATEAU STATE WATER SUPPLY PROJECT
Implementation Status of Contracts
Component Contract Description % Completion I and II: Keffi / Akwanga & Doma Water Supply Schemes A Civil Works including Staff Housing & Pipeline Installation 100 B Supply/Delivery of Pipes 100 C Supply/Installation of Electro Mech Plant 100 D Supply/Installation of Treatment Plant 100 III. Jos-Bukuru Water Supply Scheme A Civil Works & Pipeline Installation 99.9 B Supply/Delivery of Pipes 100 C Supply/Installation of Elecro Mech. Equip. 100 D Supply/Installation of Treatment Plant 100 IV. Workshops, Stores and Operational Equipment Various 78 1 Supply/Installation of Communication Equip. 100 2 Supply/Delivery of Tools/Water Meters 100 3 Supply/Delivery of Laboratory Equip. and Rods 100 4 Supply/Delivery of Utility vehicles 100 5 Supply/Delivery of Maint. Equip. and Machinery 100 6 Construction of New Head office Building in Jos 75
7 Renovation of Existing Headoffice Building, Workshop & Stores in Jos 10
8 Renovation of Existing Headoffice Building in Lafia 70 9 Design and Supervision of Headoffice Building 70 V. Technical Assistance Provision of Management Consultancy Services 100
VII. Engineering Services A Engineering Design and Supervision Services for Keffi/Akwanga/Doma Schemes 100
B Engineering Design and Supervision Services for Jos-Bukuru Scheme 100

ANNEX 2 Page 2 of 2
NIGERIA PROJECT COMPLETION REPORT
PLATEAU STATE WATER SUPPLY PROJECT
IMPLEMENTATION SCHEDULE
1 2 3 4 1 2 3 4 1 2 3 4 1 2 3 4 1 2 3 4 1 2 3 4 1 2 3 4 1 2 3 4 1 2 3 4 1 2 3 4 1 2 3 4 1 2 3 4 1 2 3 4
I & II: KEFFI / AKWANGA / DOMA WATER a) Pipes Supply & Civil Works
(Keffi/Akwanga)(Doma)
b) Supply/Installation of Electro Mech Plant
c) Supply/Installation of Treatment Plant
III: JOS-BUKURU WATER SUPPLY SCHEMEa) Pipes Supply & Civil Works
b) Supply/Installation of Electro Mech Plant
c) Supply/Installation of Treatment Plant
IV: WORKSHOP, STORES & OPERATIONAL On going-78 % completeEQUIPMENT
V: TECHNICAL ASSISTANCEa) Management and Training Consultancy
VI: ENGINEERING SERVICESa) Design & Supervision of Keffi/Akwanga/Doma
b) Design & Supervision of Jos-Bukuru
2002 2003
Planned Actual
1998 1999 2000 20011994 1995 1996 1997COMPONENTS
1991 1992 1993

ANNEX 3 Page 1 of 3
NIGERIA PROJECT COMPLETION REPORT
PLATEAU STATE WATER SUPPLY PROJECT
ORGANISATION CHART AT APPRAISAL PLATEAU STATE WATER BOARD
GOVERNOR
BOARD OF DIRECTORS
GENERAL MANAGER AREA MANAGER
AUDIT PROJECT IMPLEMENTATION UNIT
CIVIL/WATER DEPARTMENT
ADMIN DEPARTMENT
FINANCE DEPARTMENT
COMMERCIAL DEPARTMENT
MECH. & ELECT. ENGINEERING DEPARTMENT
QUALITY CONTROL
WATER SUPPLY &
CIVIL
RESEARCH & INVEST. &
SUR.
PERSONNEL
ACCOUNTS
COMPUTERS
STORES
DETECTION
REVENUE ACCOUNTS
CONSUMER SERVICES
ELECT
MECH.

ANNEX 3 Page 2 of 3
NIGERIA
PROJECT COMPLETION REPORT PLATEAU STATE WATER SUPPLY PROJECT
ORGANISATION CHART AT PROJECT COMPLETION
PLATEAU STATE WATER BOARD Board of
Directors
Assets Manager Finance Manager
Personnel Manager
Quality Asst Manager
Water Production Manager
Technical Manager
AGM – Management
Services
AGM – Computer Services
General Manager (Chief Exec.)
Internal Auditor
Sec/Legal Advisor
Project Manager
Asst Gen. Manager – Water and Technical Services
Bill Dist Manager
M I S Manager
Marketing Manager

ANNEX 3 Page 3 of 3
NIGERIA
PROJECT COMPLETION REPORT PLATEAU STATE WATER SUPPLY PROJECT
ORGANISATION CHART AT COMPLETION
NASARAWA STATE WATER BOARD
BOARD OF DIRECTORS
AREA ENGINEERS
GENERAL MANAGER
FINANCE & SUPPLY DEPT DIRECTOR OF FINANCE
COMMERCIAL DEPT DIRECTOR COMMERCIAL SERVICES
WATER DEPT DIRECTOR WATER SUPPLY OPERATIONS
MECH/ELECT DEPT DIRECTOR MECH/ELECT SERVICES
PLANNING/CIVIL WORKS DEPT DIRECTOR, PLANNING/CIVIL WORKS
INTERNAL AUDIT
LEGAL ADVISOR
ADMIN. DEPT. SECRETARY TO THE BOARD & HEAD OF ADMIN
P R O
COMPUTER SERVICES

ANNEX 4
NIGERIA PROJECT COMPLETION REPORT
PLATEAU STATE WATER SUPPLY PROJECT
ANNUAL DISBURSEMENT BY SOURCE OF FUNDING
(in UA Million) Source of Funding
Appraisal Actual Year ADB ADF P/NSG Total % ADB ADF P/NSG
Total %
1991 18.04 0.77 2.48 21.29 20.00
1992 36.06 1.54 4.97 42.57 40.00 10.02 0.67 1.07 11.77 10.38
1993 31.56 1.34 4.35 37.25 35.00 22.13 0.25 2.26 24.64 21.74
1994 4.51 0.19 0.62 5.32 5.00 21.46 0.62 0.68 22.76 20.08
1995 16.27 0.37 1.61 18.25 16.10
1996 8.77 - 2.55 11.33 9.99
1997 7.75 0.66 2.18 10.59 9.34
1998 1.17 0.05 5.73 6.95 6.13
1999 0.31 0.19 1.23 1.72 1.52
2000 0.68 - 0.68 1.36 1.20
2001 0.34 0.18 0.32 0.84 0.74
2002 0.40 0.69 0.44 1.53 1.35
2003 0.21 0.06 0.09 0.36 0.32
2004 0.45 0.03 0.78 1.25 1.11
1991 – 2004 90.17 3.84 12.42 106.43 00.00 89.95 3.78 19.62 113.35 100.00

ANNEX 5 Page 1 of 2
NIGERIA PROJECT COMPLETION REPORT
PLATEAU STATE WATER SUPPLY PROJECT
INCOME AND EXPENDITURE STATEMENTS AT APPRAISAL
NGN Million 1990 1991 1992 1993 1994 1995 1996 1997 1998 1999 2000 2001 2002 Water Production (MCM) 37 37 40 41 58 80 81 81 82 n/a n/a n/a n/a Net Sales (MCM) 29 30 32 33 50 68 68 69 70 n/a n/a n/a n/a Average Tariff (NGN/CM) 0.31 0.77 1.54 3.39 7.46 8.81 9.25 9.21 10.21 n/a n/a n/a n/a Total Revenue (‘000) 9 23 50 111 371 597 633 671 712 n/a n/a n/a n/a Operating Costs 14 23 41 67 118 156 188 216 250 n/a n/a n/a n/a Operating Profit/Loss -5 0 9 43 253 441 445 455 462 n/a n/a n/a n/a Net Income/Loss -4 1 2 1 129 304 295 301 304 n/a n/a n/a n/a Rate of Return (%) -2 0 1 3 15 22 19 16 14 n/a n/a n/a n/a Operating Ratio (%) 152 101 82 61 32 26 30 32 35 n/a n/a n/a n/a

ANNNEX 5 Page 2 of 2
NIGERIA
PROJECT COMPLETION REPORT PLATEAU STATE WATER SUPPLY PROJECT
INCOME AND EXPENDITURE STATEMENTS AT COMPLETION
PLATEAU STATE WATER BOARD
NGN Million
Years (NGN' millions) 1990 1991 1992 1993 1994 1995 1996 1997 1998 1999 2000 2001 2002
Turnover n/a n/a 17 11 38 63 58 92 135 136 179 527 577
Cost of Water Prod. n/a n/a -34 -28 -71 -107 -139 -148 -107 -351 -328 -366 -142 Subventions n/a n/a 28 27 63 66 48 403 231 207 44 Other Income n/a n/a 0.3 0.1 20 37 0.2 0.7 0.3 0.5 3 3 1 Total n/a n/a 11.3 10.1 -13 -7 -17.8 10.7 76.3 188.5 85 371 480
Staff Related Costs n/a n/a 9 10 ) 14 ) 24 ) 21 ) 21 ) 27 ) 62 6 98 95
Administrative Expense 1 1 ) ) ) ) ) ) 38 39 32 Finance Charges n/a n/a 0 0 ) ) ) ) ) ) 13 3 5 Depreciation n/a n/a 0.3 0.4 ) ) ) ) ) ) 3 8 7 Total Fixed Costs n/a n/a 10 12 14 24 21 21 27 62 60 148 139
Net Surplus n/a n/a 1 -2 -27 -31 -39 -10 49 127 25 223 341
Rate of Return (%) n/a n/a 1 -1 -4 -5 -7 -2 9 26 5 53 91
Operating Ratio (%) n/a n/a 159 209 137 138 136 123 120 146 134 128 124 Note: The accounts from 1992 to 1996 refer to Plateau State Utility Board and from 1997 to 2002 refer to Plateau State Water Board.
NASARAWA STATE WATER BOARD
NGN Million
1990 1991 1992 1993 1994 1995 1996 1997 1998 1999 2000 2001 2002
Turnover n/a n/a n/a n/a n/a n/a n/a 10 7 16 22 13 73 Subventions n/a n/a n/a n/a n/a n/a n/a 7 13 56 52 55 0
Other Income n/a n/a n/a n/a n/a n/a n/a 0 2 5 1 44 0
Total n/a n/a n/a n/a n/a n/a n/a 17 22 78 75 112 73
Project Direct Expenses n/a n/a n/a n/a n/a n/a n/a 86 110 130 45 72 16
Total Fixed Costs n/a n/a n/a n/a n/a n/a n/a 12 21 33 34 35 147
Total Costs 98 132 164 79 107 175
Net Surplus n/a n/a n/a n/a n/a n/a n/a -81 -110 -86 -4 5 -102
Rate of Return (%) n/a n/a n/a n/a n/a n/a n/a Operating Ratio (%) n/a n/a n/a n/a n/a n/a n/a 980 1886 1025 359 823 240

ANNNEX 6 Page 1 of 2
NIGERIA PROJECT COMPLETION REPORT
PLATEAU STATE WATER SUPPLY PROJECT
BALANCE SHEET AT APPRAISAL
NGN Million 1990 1991 1992 1993 1994 1995 1996 1997 1998 1999 2000 2001 2002 Fixed Assets 207 415 953 1524 1747 2040 2391 2813 3318 n/a n/a n/a n/a Current Assets 16 26 41 73 175 274 306 338 374 n/a n/a n/a n/a 223 441 994 1597 1922 2314 2697 3151 3692 n/a n/a n/a n/a Represented By Current Liabilities 7 8 10 17 30 39 159 177 198 n/a n/a n/a n/a Long Term Loan 0 0 629 1195 1384 1522 1563 1596 1621 n/a n/a n/a n/a Equity 216 433 355 385 508 753 975 1377 1873 n/a n/a n/a n/a 223 441 994 1597 1922 2314 2697 3150 3692 n/a n/a n/a n/a Current Ratio 2.286 3.25 4.1 4.294 5.833 7.026 1.925 1.91 1.889 n/a n/a n/a n/a Debt/Equity Ratio 0 0 1.772 3.104 2.724 2.021 1.603 1.159 0.865 n/a n/a n/a n/a

ANNNEX 6 Page 2 of 2
NIGERIA PROJECT COMPLETION REPORT
PLATEAU STATE WATER SUPPLY PROJECT
BALANCE SHEETS AT COMPLETION
PLATEAU STATE WATER BOARD
NGN Million 1992 1993 1994 1995 1996 1997 1998 1999 2000 2001 2002 Fixed Assets 206 204 649 604 569 423 520 492 456 421 375 Capital Work in Progress 0 0 12 12 22 250 213 3218 3439 3563 3727 Current Assets 62 103 121 154 191 221 301 838 712 1096 1497 Current Liabilities 14 15 24 39 77 82 80 488 188 223 339 Net Current Assets 48 88 97 115 114 139 221 350 524 873 1158 254 292 758 731 705 812 954 4060 4419 4857 5260 Represented By Capital Investment 155 155 228 228 167 274 416 541 1163 1226 1239 Long Term Loan 0 0 0 9 0 0 0 1965 2047 2120 2171 Equity 99 137 530 494 538 538 538 1954 1209 1511 1850 254 292 758 731 705 812 954 4460 4419 4857 5260 Current Ratio 4.43 6.87 5.04 3.95 2.48 2.7 3.76 1.72 3.79 4.91 4.42 Debt/Equity Ratio 0 0 0 0.01 0 0 0 0.79 0.86 0.77 0.7 Debtors 43 69 74 104 148 160 251 388 407 843 1294 Av Collection Period (In Months) 5 2 6 7 5 7 6 4 5 8 5
NASARAWA STATE WATER BOARD
NGN Million
1992 1993 1994 1995 1996 1997 1998 1999 2000 2001 2002 Fixed Assets n/a n/a n/a n/a n/a 703 615 541 451 365 277 Capital Work in Progress n/a n/a n/a n/a n/a 0 0 0 0 0 0 Current Assets n/a n/a n/a n/a n/a 51 31 76 81 94 112 Current Liabilities n/a n/a n/a n/a n/a 1 5 9 30 436 372 Net Current Assets n/a n/a n/a n/a n/a 51 6.2 67 51 -342 -260 n/a n/a n/a n/a n/a 754 621 608 502 23 17 Represented By Capital Investment n/a n/a n/a n/a n/a ) 835 ) 901 ) 802 ) 889 ) 489 ) 559 Long Term Loan n/a n/a n/a n/a n/a ) ) ) ) ) ) Equity n/a n/a n/a n/a n/a -81 -280 -194 -387 -466 -542 754 621 608 502 23 17 Current Ratio 51 6.2 8.4 2.7 0.2 0.3 Debtors 5 7 20 39 12 27 Av Collection Period (In Months) 24 12 10 7 13 32

ANNEX 7 Page 1 of 2
NIGERIA PROJECT COMPLETION REPORT
PLATEAU STATE WATER SUPPLY PROJECT
METHODOLOGY AND ASSUMPTIONS USED FOR FINANCIAL AND ECONOMIC VIABILITY
A FINANCIAL RATE OF RETURN (i) The cash flow is for a 20 year period including implementation period. (ii) The Financial Rate of Return analysis has been performed on an "incremental net cash flow basis" in
which revenues are net of investment and operating costs excluding depreciation and finance charges. (iii) The current and projected values have been deflated to 1992 base year using a construction price index. (iv) Salvage value of fixed assets is assumed to be 20 % of the investment. (iv) Investment costs :The total investment cost stand at UA 92.03 millions equivalent to NGN 4,315.39
million broken down as per the actual disbursement schedule. B ECONOMIC RATE OF RETURN (i) The economic assessment of the water project, like for financial viability is based also on incremental
approach. However, the economic evaluation is undertaken from a perspective which measures net benefits to the Nigerian economy as a whole. Where distortions exist, to convert financial prices to the real resource values of project inputs and outputs, appropriate adjustments are made in financial flows to reflect economic values.
(ii) Project Benefits: Quantitative benefits in the form of revenues from water sales and service connection
fees have been used in the calculation of Economic Rate of Return. Non-quantifiable benefits such as improved health, savings on medical expenses, time savings and increased productivity have not been taken into account due to non-availability of data and therefore are only recognized in qualitative terms.
(iii) Economic price of water: Data obtained from the Ibadan city reveal that there is premium paid by those
who do not have direct access to water. The price of NGN 140.0 per cubic meter is the financial price. The estimated economic price of water (measured by consumer’s willingness to pay) in Plateau is assumed to be NGN 200 per cubic meter. This compared to the financial price of NGN 140.0 results in a premium for demand for water of 43% giving rise to a general conversion factor of 1.43. As a result of this scarcity the benefits have been shadow-priced using this factor.

ANNEX 7
Page 2 of 2 NIGERIA
PROJECT COMPLETION REPORT PLATEAU STATE WATER SUPPLY PROJECT
METHODOLOGY AND ASSUMPTIONS USED FOR
FINANCIAL AND ECONOMIC VIABILITY (iv) With regard to the economic value of key inputs, we have assumed the following: a) Foreign exchange: there is existence of a foreign exchange premium of 6.75 %, i.e., a shadow
exchange rate of NGN 140 to 1 USD versus Government exchange rate of NGN 135 to 1 USD. The above results in a conversion factor of 1.0675 which is applied to the foreign exchange component of capital investment and operational costs.
b) Skilled labor: Market rates reflect real economic scarcity, hence there is no adjustment in the cost
of skilled labor (shadow price of 1). c) Unskilled labor: because of existence of massive unemployment, unskilled labor is shadow-
priced using a conversion factor of 0.80. d) All taxes and import duties are removed from project and operational costs. In other words,
imported items such as chemicals are valued at their border price (c.i.f. value). (v) The opportunity cost of capital in Nigeria is 10%. (vi) Economic costs: The economic costs have been adjusted to reflect iv, a) above. (vii) Salvage values: The same as in FRR calculation.

ANNEX 8
NIGERIA PROJECT COMPLETION REPORT
PLATEAU STATE WATER SUPPLY PROJECT
CALCULATION OF FINANCIAL RATE OF RETURN
NGN million Year Investment
Cost Incr Op
Costs Salvage Value
Incr Revenue
Net Incr Revenue
1992 218.2 0 0 0 (218.20) 1993 693.8 0 0 0 (693.80) 1994 684.5 0 0 0 (684.50) 1995 567.3 0 0 0 (567.30) 1996 281.6 2.2 0 13.2 (270.64) 1997 251.4 5.2 0 17.4 (239.18) 1998 35.8 23.0 0 32.8 (25.96) 1999 64.6 23.8 0 34.0 (54.40) 2000 92.7 31.4 0 44.9 (79.23) 2001 74.8 50.5 0 72.2 (53.14) 2002 180.6 58.1 0 93.0 (165.70) 2003 48.3 71.8 0 112.5 18.55 2004 95.3 71.8 0 112.5 74.55
2005 71.8 0 112.5 40.75
2006 71.8 0 112.5 40.75
2007 71.8 0 112.5 40.75
2008 71.8 0 112.5 40.75
2009 71.8 0 112.5 40.75 2010 71.8 657.78 112.5 698.53 -5%
FRR = -5 %

ANNEX 9
NIGERIA PROJECT COMPLETION REPORT
PLATEAU STATE WATER SUPPLY PROJECT
CALCULATION OF ECONOMIC RATE OF RETURN
(NGN million)
Year Adjusted Investment Costs
Adjusted Incr Operational Costs
Adjusted Incremental Benefits
Adjusted Salvage Value of Fixed Assets
Net Incremental Benefits
1992 174.6 0.0 0.0 -174.6 1993 555.0 0.0 0.0 -555.0 1994 547.6 0.0 0.0 -547.6 1995 453.8 0.0 0.0 -453.8 1996 225.3 1.6 13.8 -223.0 1997 201.1 3.6 18.9 -195.9 1998 28.6 16.1 39.4 -5.4 1999 51.7 16.7 40.8 -27.5 2000 74.2 22.0 53.9 -42.3 2001 59.8 35.4 86.6 -8.6 2002 144.5 40.7 100.6 -75.6 2003 38.6 50.2 133.0 44.1 2004 76.2 50.2 133.0 6.5 2005 0.0 50.2 133.0 82.8 2006 0.0 50.2 133.0 82.8 2007 0.0 50.2 133.0 82.8 2008 0.0 50.2 133.0 82.8 2009 0.0 50.2 133.0 82.8 2010 0.0 50.2 133.0 592.0 674.8
4 %
Economic Rate of Return = 4 1%

ANNEX 10 NIGERIA
PROJECT COMPLETION REPORT PLATEAU STATE WATER SUPPLY PROJECT
PERFORMANCE EVALUATION AND RATING
Implementation Performance
Indicators Rating (1 - 4) Remarks
Adherence to Implementation Schedule 1 Slippage on original completion date at appraisal is over 249%.
Adherence to Cost Schedule 2 Overall cost variation is +6.5% of appraisal cost estimate, but two project components have cost variation more than +/- 50% of appraisal cost.
Compliance with Covenants 1 Partial fulfillment of covenants relating to institutional reforms.
Adequacy of Monitoring and Reporting 3 Excellent progress reporting, but inadequate monitoring of cost of civil works contracts due to variations.
Satisfactory Operations (if applicable) 2 Generally, satisfactory operation and maintenance of installations. Unsatisfactory institutional performance.
Total 9
Overall Assessment of Implementation Performance 1.8 Category US – Unsatisfactory
Bank Performance
Indicators Rating (1 - 4) Remarks
At Identification 3 Project was part of the national priorities integrated within the PIP.
At Preparation of Project 1 Project Matrix was not prepared. Inadequate desk review and project preparation performed thereby limiting actions taken by the Bank before Appraisal.
At Appraisal 2 Processing stages of the Appraisal Report have been partially followed. Inconsistencies in data analyses and presentation.
At Supervision 1 Generally, the time duration for processing project documentation, contracts, etc., was reasonable. At least one supervision mission per year launched.
Total 7 Overall Assessment of Bank Performance 1.8 Category US – Unsatisfactory
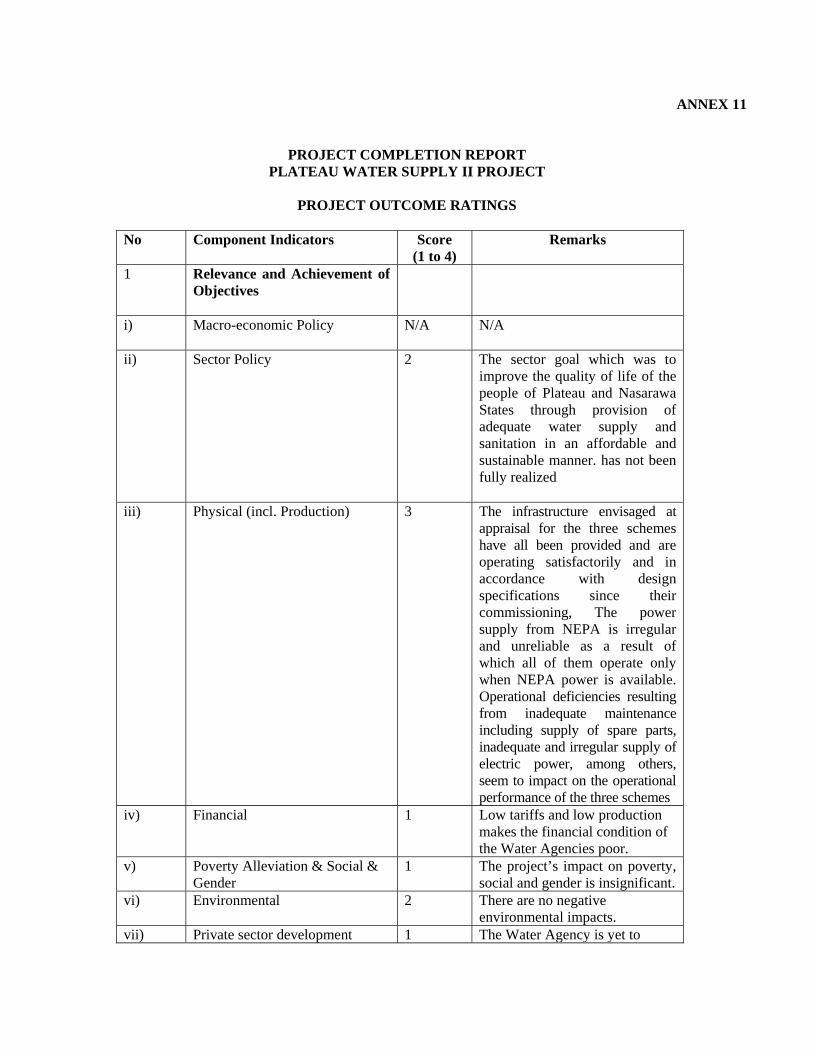
ANNEX 11
PROJECT COMPLETION REPORT PLATEAU WATER SUPPLY II PROJECT
PROJECT OUTCOME RATINGS
No Component Indicators Score
(1 to 4) Remarks
1 Relevance and Achievement of Objectives
i)
Macro-economic Policy N/A N/A
ii) Sector Policy 2 The sector goal which was to improve the quality of life of the people of Plateau and Nasarawa States through provision of adequate water supply and sanitation in an affordable and sustainable manner. has not been fully realized
iii) Physical (incl. Production) 3 The infrastructure envisaged at appraisal for the three schemes have all been provided and are operating satisfactorily and in accordance with design specifications since their commissioning, The power supply from NEPA is irregular and unreliable as a result of which all of them operate only when NEPA power is available. Operational deficiencies resulting from inadequate maintenance including supply of spare parts, inadequate and irregular supply of electric power, among others, seem to impact on the operational performance of the three schemes
iv) Financial 1 Low tariffs and low production makes the financial condition of the Water Agencies poor.
v) Poverty Alleviation & Social & Gender
1 The project’s impact on poverty, social and gender is insignificant.
vi) Environmental 2 There are no negative environmental impacts.
vii) Private sector development 1 The Water Agency is yet to

embark on Private Sector Participation initiatives.
viii) Other (Specify) N/A N/A 2 Institutional Development (ID) ii) Financial and Management
Information Systems including Audit Systems
1 The systems which were put in place by the Consultants, MEDAL have not been implemented by the Water Agencies.
iii) Transfer of Technology 2 To some extent, there has been transfer of technology vis a vis plant and equipment via on job training.
iv) Staffing by qualified persons (incl. Turnover), training & counter-part staff
1 The Water Agencies have failed to retain qualified and experienced personnel due to poor conditions of service.
3
Sustainability
i)
Continued Borrower Commitment
2 Continued Borrower’s commitment is low reflected in the institutional arrangements currently in place and the in ability to charge economic tariffication.
ii) Environmental Policy 2 The policy at both States and Federal levels are in place and are being implemented.
iii) Institutional Framework 1 Heavy involvement of the State Governments in the operation of the Water Agencies.
iv) Technical Viability and Staffing 2 Lack of spare parts and the inability to retain qualified staff.
v) Financial Viability including cost recovery systems
1 Negative Rate of Return and tariffs are far from being cost recovery based.
vi) Economic Viability 1 Low Rate of Return vii) Environnemental Viability 3 The project has had no negative
impacts on the environment. viii) O&M facilitation (availability of
recurrent funding, foreign exchange, spare parts, workshop facilities etc.)
1 The recurrent funding which is being supported by the State Governments is inadequate.
Total 27 Overall Assessment of
Outcome 1.6 Category US –Un satisfactory:

ANNEX 12
NIGERIA PROJECT COMPLETION REPORT
PLATEAU STATE WATER SUPPLY PROJECT
SOURCES OF INFORMATION
1 Appraisal Report, Plateau State Water Supply Project, Federal Republic of Nigeria, 1991
2 Borrower’s Project Completion Report, Plateau State Water Supply Project, Submitted by PSWB, 2002
3 Technical and Financial Operational Records Submitted by PSWB and NSWB
4 ADB Disbursement Ledgers
5 Quarterly Progress Reports, Plateau Water Supply Project
6 ADB Files; BTORs and Detailed Supervision Mission Reports, Plateau Water Supply Project
7 Annual Reports of Plateau and Nasarawa State Water Boards, 1992 to 2002

ANNEX 13 NIGERIA
PROJECT COMPLETION REPORT PLATEAU STATE WATER SUPPLY PROJECT
COMMENTS OF THE EXECUTING AGENCY
PSWB/ADB/S/PROJ-22/IV/X
28th April, 2005
The Division Manager,
Pubic Utilities Division,
Infrastructure Department,
Central and West, African Development Bank,
Tunisia.
E-Mail:m:documbia @afdb:org
NIGERIA: PROJECT COMPLETION REPORT (PCR) ON THE RECENTLY COMPLETED PLATEAU STATE WATER SUPPLY PROJECT.
Refer to the above report forwarded to us and dated 14th March, 2005.
We have the following comments and corrections to make.
1. Refer to page ii items 10 and 11 with captioned "project is not viable financially and
economically" and "sustainability of the project is unlikely".
The rating of 1 in Annex II 3 iii, v, vi, and viii is too low as we have done our best in the following areas.
(a) The State Government granted autonomy to the Plateau State Water Board for self sustenance.
There have been gradual improvement in cost recovery from 15% in 2000 to 5% in 2005.
(b) Funding from State Government have reduce from total dependance which includes salaries and
overhead is 2001 to only capital projects and part of NEPA bills.
(c) The economic activities of Jos/Bukuru have greatly improved and State expenditure on health
had also reduced. This can be seen from increased tourism, 12 new industries established and 8
new banks have been established between year 2000 to 2005. This is a result of improved water
supply. All of them are responding to payments of water bills.

(d) With the supply of workshop equipments from the Revised list of Goods and Services (RLGS)
and water meters, all industries are now metered and maintenance of our systems greatly
improved. Some spares are now fabricated like pump shafts, valve spindles, vehicle/generators
parts etc.
(e) The tariff levels are gradually increased as follows:- For 1m3 in year 2000 - N50, 2002 - N70,
2004 - N140 and 2005 - N150. It is hoped that the economic rate of N200 will be achieved by
2007.
We are recommending a change of rating from 1 each to 3 each in Annex 11, 3 iii, v, vi, viii.
2. Refer to page (ii) item 8 with captioned "The performance of the Eas has not been satisfactory as
anticipated. Recommendations made by the consultants have not been implemented".
The rating of 1 in Annex 11 2 (ii) is too low as a lot have been done to implement the recommendations
as follows:-
(a) The Accounting, Store and billing systems recommended by the Management Consultant is
exactly what is presently used by the Board. Billing is now monthly rather than quarterly as
previously obtained.
(b) The organizational chart recommended by the management consultant MEDAL is what is being
used except the position of AGM Technical Services was replaced with AGM Commercial
because of emphasis on cost recovery.
(c) 100No Senior Technical and Commercial staff were employed in year 2001 to strengthen the
institutional strength and improve on performance. The result is water rate collection improved
steadily from average N4m/month in year 2000 to average N13m/month in 2005.
(d) More training are being conducted to sustain the system with the Aid of International donors
coming in like Water Aid, EU and UN-Habitat in the following areas:- Community participation,
PSP involvement, sanitation provision, Hygiene Education, O&M, M&E systems, Institutional
Governance, IWRM, Targeting the urban poor, etc.
We are recommending a change of rating from 1 in Annex 11 2 (ii)
to 3.

3. Refer to page vii with the following corrections.
(a) Capacity of Keffi/Akwanga - 38,000m3/day
(b) Transmission mains Keffi/Akwanga - 50.5km
(c ) Service Reservoirs Keffi/Akwanga - 19,100m3
(d) Distribution Lines Keffi/Akwanga - 68.65km
(e) Capacity of Doma - 8,200m3/day
(f) Transmission mains Doma - 11.4km
(g) Service Reservoir Doma - 2,800m3
(h) Distribution Lines Doma - 24km
(i) Salvage Hill Reservoir, Jos - 12,000m3
(j) New Eastern side Reservoir Jos - 12,400m3
4. Refer to Annexture 3 page 2 & 3 .
The organization chart at project completion Plateau State Water Board has the following corrections.
(a) Add the position of PRO and Procurement Officer on the same line with Internal Auditor,
Project Manager and Sec/Legal Adviser.
(b) Correct AGM computer services to AGM Commercial Services.
(c) Correct Quality Assistant to Quality Assurance Manager
(d) Correct Water Production Manager to Water Operations Manager.
SIGNED:
ENGR. HOSSANAH DAJAN
GENERAL MANAGER.
NOTE: Response from Nasarawa State Water Board is still being
awaited and you will be communicated, please.


![NIGERIA POLIO ERADICATION SUPPORT PROJECT (NPESP ... · states [Sokoto, Jigawa, Kebbi, Gombe, Adamawa, Zamfara, Kogi, Taraba, Nasarawa, Yobe, Bayelsa and Plateau]. ES 2.3 Major Activities:](https://static.fdocuments.us/doc/165x107/5f79b031c3a31435df0501b9/nigeria-polio-eradication-support-project-npesp-states-sokoto-jigawa-kebbi.jpg)