Nielsen Retail Sales OJ, GJ and OJ/GJ Beverages · FLORIDA DEPARTMENT OF CITRUS Nielsen Retail...
15
FLORIDA DEPARTMENT OF CITRUS Nielsen Retail Sales OJ, GJ and OJ/GJ Beverages Monthly Topline Report Report #11 of 2016-17 Season For 4 weeks ending 08/05/17
Transcript of Nielsen Retail Sales OJ, GJ and OJ/GJ Beverages · FLORIDA DEPARTMENT OF CITRUS Nielsen Retail...

FLORIDA DEPARTMENT OF CITRUS
Nielsen Retail SalesOJ, GJ and OJ/GJ Beverages
Monthly Topline Report
Report #11 of 2016-17 Season
For 4 weeks ending 08/05/17
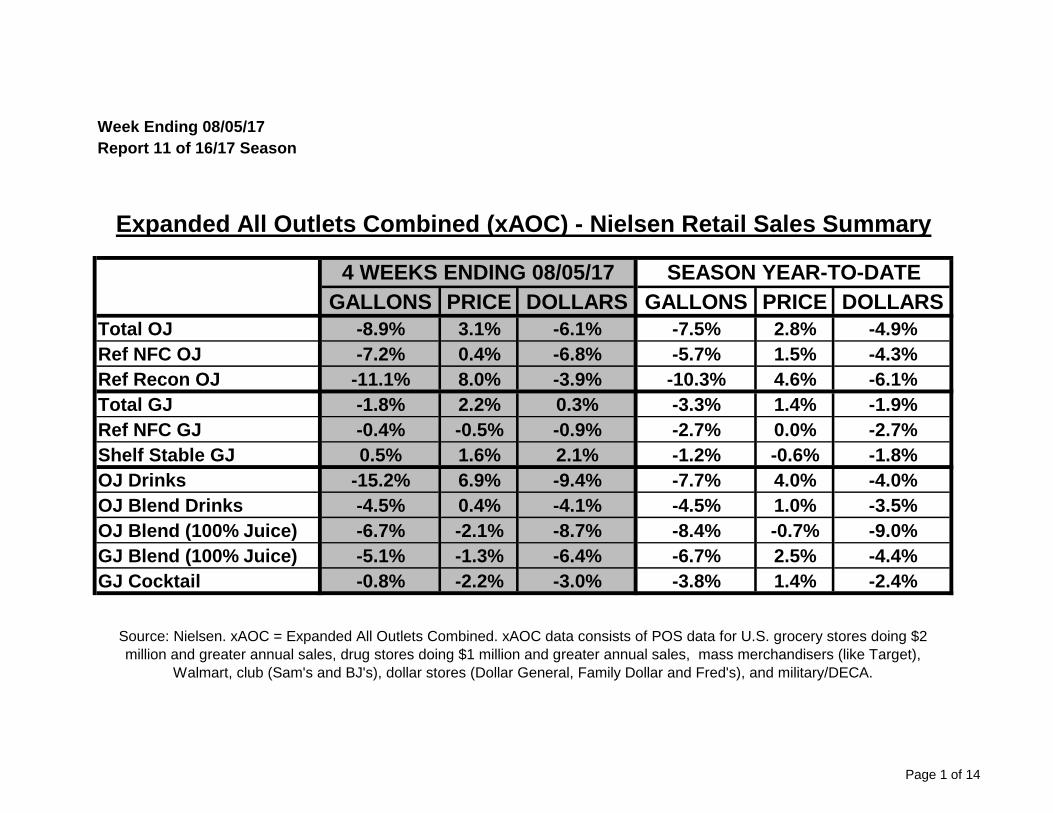
Week Ending 08/05/17
Report 11 of 16/17 Season
GALLONS PRICE DOLLARS GALLONS PRICE DOLLARS
Total OJ -8.9% 3.1% -6.1% -7.5% 2.8% -4.9%
Ref NFC OJ -7.2% 0.4% -6.8% -5.7% 1.5% -4.3%
Ref Recon OJ -11.1% 8.0% -3.9% -10.3% 4.6% -6.1%
Total GJ -1.8% 2.2% 0.3% -3.3% 1.4% -1.9%
Ref NFC GJ -0.4% -0.5% -0.9% -2.7% 0.0% -2.7%
Shelf Stable GJ 0.5% 1.6% 2.1% -1.2% -0.6% -1.8%
OJ Drinks -15.2% 6.9% -9.4% -7.7% 4.0% -4.0%
OJ Blend Drinks -4.5% 0.4% -4.1% -4.5% 1.0% -3.5%
OJ Blend (100% Juice) -6.7% -2.1% -8.7% -8.4% -0.7% -9.0%
GJ Blend (100% Juice) -5.1% -1.3% -6.4% -6.7% 2.5% -4.4%
GJ Cocktail -0.8% -2.2% -3.0% -3.8% 1.4% -2.4%
Expanded All Outlets Combined (xAOC) - Nielsen Retail Sales Summary
4 WEEKS ENDING 08/05/17 SEASON YEAR-TO-DATE
Source: Nielsen. xAOC = Expanded All Outlets Combined. xAOC data consists of POS data for U.S. grocery stores doing $2
million and greater annual sales, drug stores doing $1 million and greater annual sales, mass merchandisers (like Target),
Walmart, club (Sam's and BJ's), dollar stores (Dollar General, Family Dollar and Fred's), and military/DECA.
Page 1 of 14
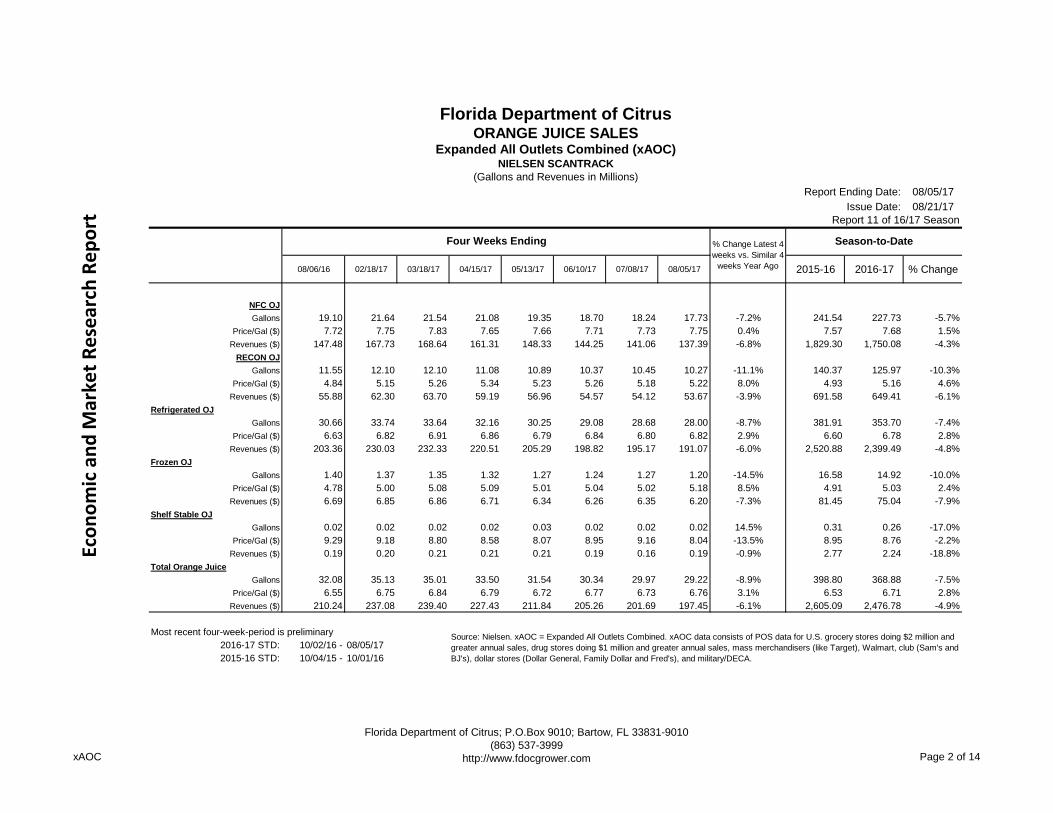
Report Ending Date: 08/05/17
Issue Date: 08/21/17
08/06/16 02/18/17 03/18/17 04/15/17 05/13/17 06/10/17 07/08/17 08/05/17 2015-16 2016-17 % Change
NFC OJ
Gallons 19.10 21.64 21.54 21.08 19.35 18.70 18.24 17.73 -7.2% 241.54 227.73 -5.7%
Price/Gal ($) 7.72 7.75 7.83 7.65 7.66 7.71 7.73 7.75 0.4% 7.57 7.68 1.5%
Revenues ($) 147.48 167.73 168.64 161.31 148.33 144.25 141.06 137.39 -6.8% 1,829.30 1,750.08 -4.3%
RECON OJ
Gallons 11.55 12.10 12.10 11.08 10.89 10.37 10.45 10.27 -11.1% 140.37 125.97 -10.3%
Price/Gal ($) 4.84 5.15 5.26 5.34 5.23 5.26 5.18 5.22 8.0% 4.93 5.16 4.6%
Revenues ($) 55.88 62.30 63.70 59.19 56.96 54.57 54.12 53.67 -3.9% 691.58 649.41 -6.1%
Refrigerated OJ
Gallons 30.66 33.74 33.64 32.16 30.25 29.08 28.68 28.00 -8.7% 381.91 353.70 -7.4%
Price/Gal ($) 6.63 6.82 6.91 6.86 6.79 6.84 6.80 6.82 2.9% 6.60 6.78 2.8%
Revenues ($) 203.36 230.03 232.33 220.51 205.29 198.82 195.17 191.07 -6.0% 2,520.88 2,399.49 -4.8%
Frozen OJ
Gallons 1.40 1.37 1.35 1.32 1.27 1.24 1.27 1.20 -14.5% 16.58 14.92 -10.0%
Price/Gal ($) 4.78 5.00 5.08 5.09 5.01 5.04 5.02 5.18 8.5% 4.91 5.03 2.4%
Revenues ($) 6.69 6.85 6.86 6.71 6.34 6.26 6.35 6.20 -7.3% 81.45 75.04 -7.9%
Shelf Stable OJ
Gallons 0.02 0.02 0.02 0.02 0.03 0.02 0.02 0.02 14.5% 0.31 0.26 -17.0%
Price/Gal ($) 9.29 9.18 8.80 8.58 8.07 8.95 9.16 8.04 -13.5% 8.95 8.76 -2.2%
Revenues ($) 0.19 0.20 0.21 0.21 0.21 0.19 0.16 0.19 -0.9% 2.77 2.24 -18.8%
Total Orange Juice
Gallons 32.08 35.13 35.01 33.50 31.54 30.34 29.97 29.22 -8.9% 398.80 368.88 -7.5%
Price/Gal ($) 6.55 6.75 6.84 6.79 6.72 6.77 6.73 6.76 3.1% 6.53 6.71 2.8%
Revenues ($) 210.24 237.08 239.40 227.43 211.84 205.26 201.69 197.45 -6.1% 2,605.09 2,476.78 -4.9%
Most recent four-week-period is preliminary
2016-17 STD: 10/02/16 - 08/05/17
2015-16 STD: 10/04/15 - 10/01/16
Florida Department of CitrusORANGE JUICE SALES
Expanded All Outlets Combined (xAOC)NIELSEN SCANTRACK
(Gallons and Revenues in Millions)
Four Weeks Ending % Change Latest 4
weeks vs. Similar 4
weeks Year Ago
Season-to-Date
Source: Nielsen. xAOC = Expanded All Outlets Combined. xAOC data consists of POS data for U.S. grocery stores doing $2 million and
greater annual sales, drug stores doing $1 million and greater annual sales, mass merchandisers (like Target), Walmart, club (Sam's and
BJ's), dollar stores (Dollar General, Family Dollar and Fred's), and military/DECA.
Report 11 of 16/17 Season
Eco
no
mic
an
d M
arke
t R
ese
arch
Re
po
rt
xAOC
Florida Department of Citrus; P.O.Box 9010; Bartow, FL 33831-9010
(863) 537-3999
http://www.fdocgrower.com Page 2 of 14
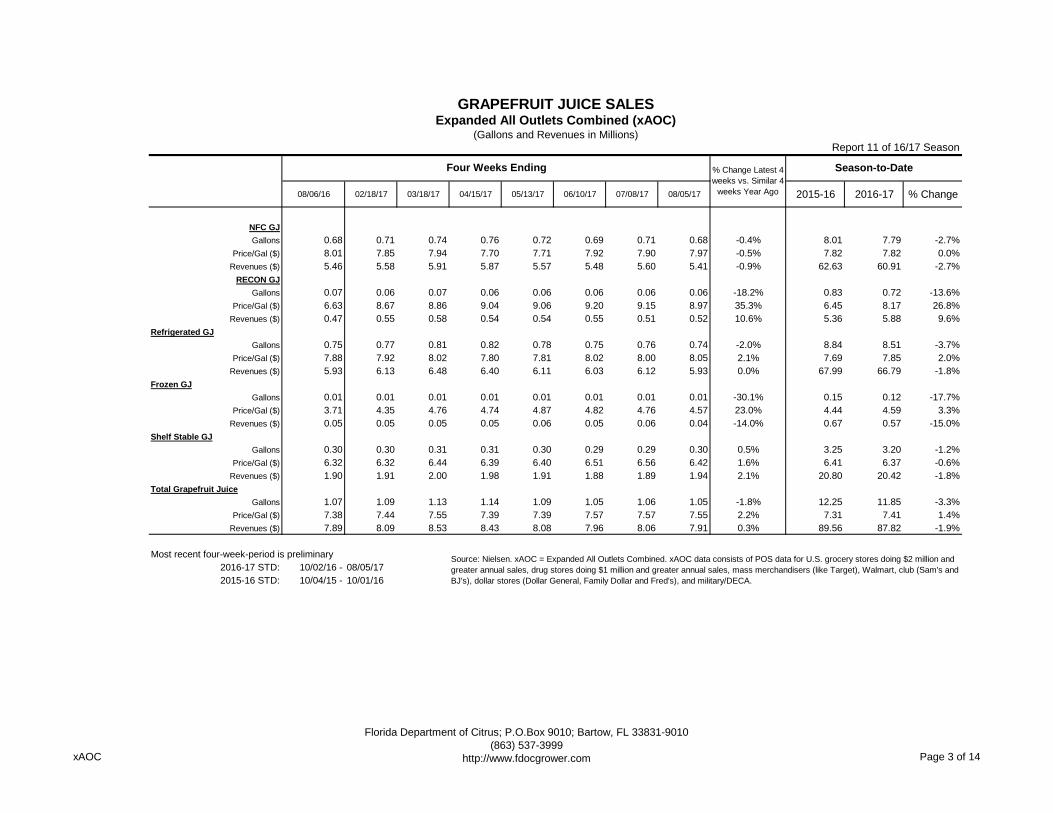
08/06/16 02/18/17 03/18/17 04/15/17 05/13/17 06/10/17 07/08/17 08/05/17 2015-16 2016-17 % Change
NFC GJ
Gallons 0.68 0.71 0.74 0.76 0.72 0.69 0.71 0.68 -0.4% 8.01 7.79 -2.7%
Price/Gal ($) 8.01 7.85 7.94 7.70 7.71 7.92 7.90 7.97 -0.5% 7.82 7.82 0.0%
Revenues ($) 5.46 5.58 5.91 5.87 5.57 5.48 5.60 5.41 -0.9% 62.63 60.91 -2.7%
RECON GJ
Gallons 0.07 0.06 0.07 0.06 0.06 0.06 0.06 0.06 -18.2% 0.83 0.72 -13.6%
Price/Gal ($) 6.63 8.67 8.86 9.04 9.06 9.20 9.15 8.97 35.3% 6.45 8.17 26.8%
Revenues ($) 0.47 0.55 0.58 0.54 0.54 0.55 0.51 0.52 10.6% 5.36 5.88 9.6%
Refrigerated GJ
Gallons 0.75 0.77 0.81 0.82 0.78 0.75 0.76 0.74 -2.0% 8.84 8.51 -3.7%
Price/Gal ($) 7.88 7.92 8.02 7.80 7.81 8.02 8.00 8.05 2.1% 7.69 7.85 2.0%
Revenues ($) 5.93 6.13 6.48 6.40 6.11 6.03 6.12 5.93 0.0% 67.99 66.79 -1.8%
Frozen GJ
Gallons 0.01 0.01 0.01 0.01 0.01 0.01 0.01 0.01 -30.1% 0.15 0.12 -17.7%
Price/Gal ($) 3.71 4.35 4.76 4.74 4.87 4.82 4.76 4.57 23.0% 4.44 4.59 3.3%
Revenues ($) 0.05 0.05 0.05 0.05 0.06 0.05 0.06 0.04 -14.0% 0.67 0.57 -15.0%
Shelf Stable GJ
Gallons 0.30 0.30 0.31 0.31 0.30 0.29 0.29 0.30 0.5% 3.25 3.20 -1.2%
Price/Gal ($) 6.32 6.32 6.44 6.39 6.40 6.51 6.56 6.42 1.6% 6.41 6.37 -0.6%
Revenues ($) 1.90 1.91 2.00 1.98 1.91 1.88 1.89 1.94 2.1% 20.80 20.42 -1.8%
Total Grapefruit Juice
Gallons 1.07 1.09 1.13 1.14 1.09 1.05 1.06 1.05 -1.8% 12.25 11.85 -3.3%
Price/Gal ($) 7.38 7.44 7.55 7.39 7.39 7.57 7.57 7.55 2.2% 7.31 7.41 1.4%
Revenues ($) 7.89 8.09 8.53 8.43 8.08 7.96 8.06 7.91 0.3% 89.56 87.82 -1.9%
Most recent four-week-period is preliminary
2016-17 STD: 10/02/16 - 08/05/17
2015-16 STD: 10/04/15 - 10/01/16
Source: Nielsen. xAOC = Expanded All Outlets Combined. xAOC data consists of POS data for U.S. grocery stores doing $2 million and
greater annual sales, drug stores doing $1 million and greater annual sales, mass merchandisers (like Target), Walmart, club (Sam's and
BJ's), dollar stores (Dollar General, Family Dollar and Fred's), and military/DECA.
GRAPEFRUIT JUICE SALESExpanded All Outlets Combined (xAOC)
(Gallons and Revenues in Millions)
Four Weeks Ending % Change Latest 4
weeks vs. Similar 4
weeks Year Ago
Season-to-Date
Report 11 of 16/17 Season
xAOC
Florida Department of Citrus; P.O.Box 9010; Bartow, FL 33831-9010
(863) 537-3999
http://www.fdocgrower.com Page 3 of 14

08/06/16 02/18/17 03/18/17 04/15/17 05/13/17 06/10/17 07/08/17 08/05/17 2015-16 2016-17 % Change
OJ Drinks 0-39.99%
Gallons 1.63 1.27 1.32 1.33 1.29 1.37 1.43 1.35 -16.9% 16.03 14.82 -7.5%
Price/Gal ($) 5.15 5.25 5.41 5.36 5.44 5.34 5.46 5.61 8.9% 4.99 5.28 5.8%
Revenues ($) 8.37 6.68 7.16 7.16 7.04 7.30 7.78 7.58 -9.5% 79.91 78.19 -2.2%
OJ Drinks 40-99.99%
Gallons 1.44 1.78 1.68 1.53 1.44 1.37 1.29 1.26 -12.6% 18.55 17.11 -7.8%
Price/Gal ($) 7.56 7.56 7.77 7.77 7.73 7.80 7.87 7.84 3.6% 7.47 7.66 2.5%
Revenues ($) 10.92 13.43 13.06 11.93 11.10 10.73 10.12 9.89 -9.4% 138.60 131.09 -5.4%
OJ Drinks - % not stated
Gallons 0.17 0.21 0.19 0.15 0.15 0.15 0.15 0.13 -22.0% 2.06 1.89 -8.1%
Price/Gal ($) 5.04 5.27 5.58 5.93 6.15 6.00 5.94 5.92 17.3% 5.17 5.66 9.5%
Revenues ($) 0.85 1.13 1.05 0.90 0.93 0.90 0.88 0.77 -8.5% 10.65 10.72 0.6%
Total OJ Drinks
Gallons 3.24 3.26 3.19 3.02 2.88 2.89 2.86 2.74 -15.2% 36.63 33.82 -7.7%
Price/Gal ($) 6.22 6.51 6.66 6.61 6.62 6.54 6.57 6.65 6.9% 6.26 6.50 4.0%
Revenues ($) 20.14 20.27 21.26 19.98 19.07 18.93 18.78 18.24 -9.4% 229.17 219.99 -4.0%
OJ BL Drinks
Gallons 15.48 14.90 15.29 14.86 14.64 14.69 14.82 14.78 -4.5% 170.42 162.76 -4.5%
Price/Gal ($) 3.28 3.33 3.44 3.40 3.33 3.35 3.29 3.29 0.4% 3.30 3.34 1.0%
Revenues ($) 50.76 49.69 52.60 50.51 48.73 49.21 48.79 48.67 -4.1% 562.54 542.86 -3.5%
OJ BL (100% Juice)
Gallons 2.36 2.50 2.61 2.69 2.44 2.34 2.37 2.20 -6.7% 29.56 27.09 -8.4%
Price/Gal ($) 7.50 7.34 7.34 7.16 7.28 7.30 7.16 7.34 -2.1% 7.32 7.27 -0.7%
Revenues ($) 17.66 18.32 19.14 19.23 17.76 17.09 17.01 16.13 -8.7% 216.40 196.85 -9.0%
GJ Cocktail
Gallons 0.74 0.77 0.81 0.78 0.73 0.73 0.73 0.73 -0.8% 8.62 8.29 -3.8%
Price/Gal ($) 6.43 5.85 5.93 6.20 6.29 6.33 6.42 6.29 -2.2% 5.98 6.06 1.4%
Revenues ($) 4.75 4.53 4.83 4.81 4.61 4.59 4.71 4.60 -3.0% 51.52 50.28 -2.4%
GJ BL (100% Juice)
Gallons 0.16 0.16 0.17 0.17 0.15 0.15 0.14 0.15 -5.1% 1.79 1.67 -6.7%
Price/Gal ($) 6.47 6.52 6.62 6.49 6.53 6.59 6.65 6.38 -1.3% 6.33 6.48 2.5%
Revenues ($) 1.02 1.05 1.12 1.10 0.99 0.96 0.96 0.95 -6.4% 11.32 10.83 -4.4%
Most recent four-week-period is preliminary
2016-17 STD: 10/02/16 - 08/05/17
2015-16 STD: 10/04/15 - 10/01/16
Source: Nielsen. xAOC = Expanded All Outlets Combined. xAOC data consists of POS data for U.S. grocery stores doing $2 million and
greater annual sales, drug stores doing $1 million and greater annual sales, mass merchandisers (like Target), Walmart, club (Sam's and
BJ's), dollar stores (Dollar General, Family Dollar and Fred's), and military/DECA.
LESS THAN 100% OJ & GJ BEVERAGESExpanded All Outlets Combined (xAOC)
(Gallons and Revenues in Millions)
Report 11 of 16/17 Season
Four Weeks Ending % Change Latest 4
weeks vs. Similar 4
weeks Year Ago
Season-to-Date
xAOC
Florida Department of Citrus; P.O.Box 9010; Bartow, FL 33831-9010
(863) 537-3999
http://www.fdocgrower.com Page 4 of 14

Report Ending Date: 08/05/17
Issue Date: 08/21/17
08/06/16 02/18/17 03/18/17 04/15/17 05/13/17 06/10/17 07/08/17 08/05/17 2015-16 2016-17 % Change
NFC OJ
Gallons 13.21 14.63 14.38 14.24 12.99 12.41 12.10 11.66 -11.7% 165.84 153.58 -7.4%
Price/Gal ($) 7.84 7.76 7.92 7.74 7.82 7.95 7.98 8.02 2.2% 7.68 7.78 1.4%
Revenues ($) 103.61 113.52 113.88 110.32 101.57 98.65 96.61 93.48 -9.8% 1,273.31 1,195.23 -6.1%
RECON OJ
Gallons 7.53 7.44 7.48 6.69 6.76 6.46 6.57 6.45 -14.3% 90.33 78.11 -13.5%
Price/Gal ($) 4.68 5.04 5.14 5.26 5.10 5.15 5.04 5.11 9.1% 4.78 5.04 5.5%
Revenues ($) 35.23 37.47 38.39 35.20 34.50 33.28 33.17 32.93 -6.5% 431.61 393.61 -8.8%
Refrigerated OJ
Gallons 20.74 22.06 21.85 20.94 19.75 18.87 18.68 18.11 -12.6% 256.17 231.68 -9.6%
Price/Gal ($) 6.70 6.84 6.97 6.95 6.89 6.99 6.95 6.98 4.2% 6.66 6.86 3.0%
Revenues ($) 138.84 150.99 152.27 145.52 136.07 131.93 129.78 126.41 -9.0% 1,704.92 1,588.84 -6.8%
Frozen OJ
Gallons 1.02 0.96 0.95 0.93 0.90 0.87 0.89 0.84 -17.0% 11.74 10.50 -10.6%
Price/Gal ($) 4.84 5.09 5.18 5.20 5.10 5.15 5.13 5.21 7.5% 5.04 5.14 2.0%
Revenues ($) 4.92 4.87 4.90 4.81 4.57 4.48 4.59 4.39 -10.8% 59.22 54.00 -8.8%
Shelf Stable OJ
Gallons 0.02 0.02 0.02 0.02 0.02 0.02 0.02 0.02 2.3% 0.27 0.22 -17.9%
Price/Gal ($) 9.72 9.46 8.93 9.39 8.76 9.22 9.56 8.77 -9.8% 9.37 9.21 -1.7%
Revenues ($) 0.17 0.18 0.20 0.19 0.18 0.17 0.15 0.16 -7.7% 2.52 2.03 -19.3%
Total Orange Juice
Gallons 21.77 23.04 22.82 21.88 20.67 19.76 19.59 18.97 -12.8% 268.18 242.40 -9.6%
Price/Gal ($) 6.61 6.77 6.90 6.88 6.81 6.91 6.87 6.90 4.4% 6.59 6.79 3.0%
Revenues ($) 143.94 156.04 157.37 150.51 140.83 136.58 134.52 130.96 -9.0% 1,766.65 1,644.87 -6.9%
Most recent four-week-period is preliminary
2016-17 STD: 10/02/16 - 08/05/17
2015-16 STD: 10/04/15 - 10/01/16
Source: Nielsen. Food data consists of POS data for U.S. grocery stores doing $2 million and greater
annual sales.
Florida Department of CitrusORANGE JUICE SALESFOOD ($2MM+ GROCERY)
NIELSEN SCANTRACK
(Gallons and Revenues in Millions)
Report 11 of 16/17 Season
Four Weeks Ending % Change Latest 4
weeks vs. Similar 4
weeks Year Ago
Season-to-Date
Eco
no
mic
an
d M
arke
t R
ese
arch
Re
po
rt
Food
Florida Department of Citrus; P.O.Box 9010; Bartow, FL 33831-9010
(863) 537-3999
http://www.fdocgrower.com Page 5 of 14
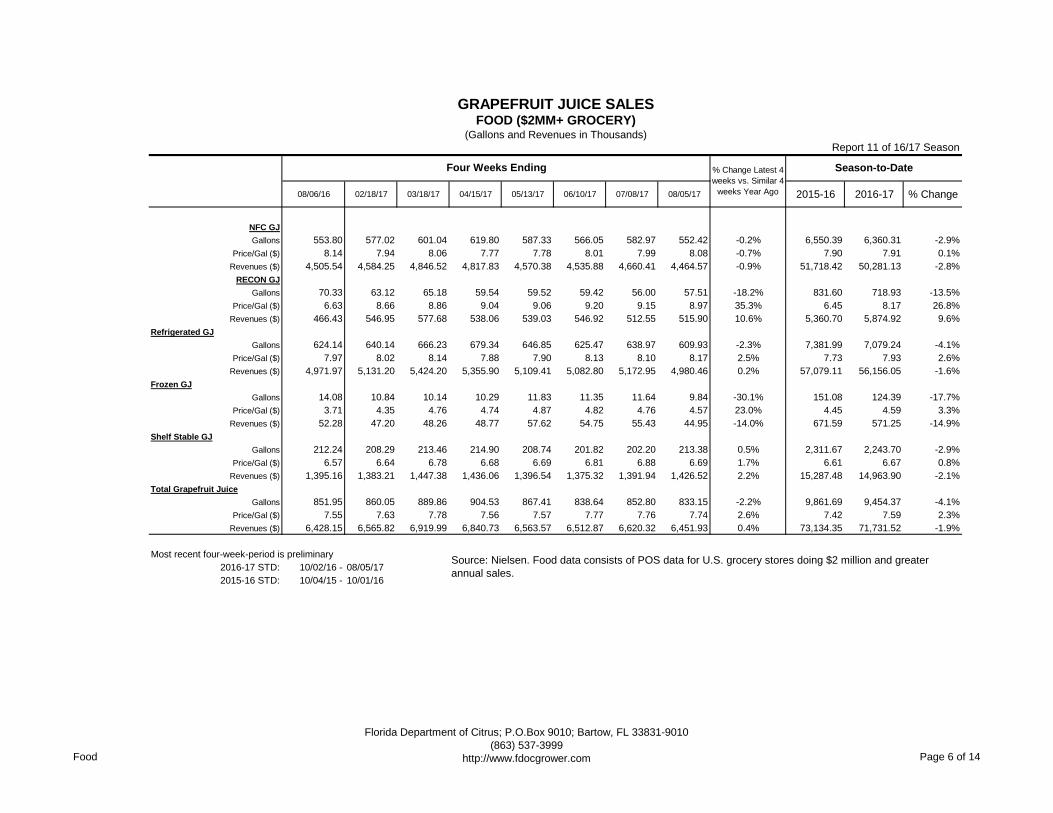
08/06/16 02/18/17 03/18/17 04/15/17 05/13/17 06/10/17 07/08/17 08/05/17 2015-16 2016-17 % Change
NFC GJ
Gallons 553.80 577.02 601.04 619.80 587.33 566.05 582.97 552.42 -0.2% 6,550.39 6,360.31 -2.9%
Price/Gal ($) 8.14 7.94 8.06 7.77 7.78 8.01 7.99 8.08 -0.7% 7.90 7.91 0.1%
Revenues ($) 4,505.54 4,584.25 4,846.52 4,817.83 4,570.38 4,535.88 4,660.41 4,464.57 -0.9% 51,718.42 50,281.13 -2.8%
RECON GJ
Gallons 70.33 63.12 65.18 59.54 59.52 59.42 56.00 57.51 -18.2% 831.60 718.93 -13.5%
Price/Gal ($) 6.63 8.66 8.86 9.04 9.06 9.20 9.15 8.97 35.3% 6.45 8.17 26.8%
Revenues ($) 466.43 546.95 577.68 538.06 539.03 546.92 512.55 515.90 10.6% 5,360.70 5,874.92 9.6%
Refrigerated GJ
Gallons 624.14 640.14 666.23 679.34 646.85 625.47 638.97 609.93 -2.3% 7,381.99 7,079.24 -4.1%
Price/Gal ($) 7.97 8.02 8.14 7.88 7.90 8.13 8.10 8.17 2.5% 7.73 7.93 2.6%
Revenues ($) 4,971.97 5,131.20 5,424.20 5,355.90 5,109.41 5,082.80 5,172.95 4,980.46 0.2% 57,079.11 56,156.05 -1.6%
Frozen GJ
Gallons 14.08 10.84 10.14 10.29 11.83 11.35 11.64 9.84 -30.1% 151.08 124.39 -17.7%
Price/Gal ($) 3.71 4.35 4.76 4.74 4.87 4.82 4.76 4.57 23.0% 4.45 4.59 3.3%
Revenues ($) 52.28 47.20 48.26 48.77 57.62 54.75 55.43 44.95 -14.0% 671.59 571.25 -14.9%
Shelf Stable GJ
Gallons 212.24 208.29 213.46 214.90 208.74 201.82 202.20 213.38 0.5% 2,311.67 2,243.70 -2.9%
Price/Gal ($) 6.57 6.64 6.78 6.68 6.69 6.81 6.88 6.69 1.7% 6.61 6.67 0.8%
Revenues ($) 1,395.16 1,383.21 1,447.38 1,436.06 1,396.54 1,375.32 1,391.94 1,426.52 2.2% 15,287.48 14,963.90 -2.1%
Total Grapefruit Juice
Gallons 851.95 860.05 889.86 904.53 867.41 838.64 852.80 833.15 -2.2% 9,861.69 9,454.37 -4.1%
Price/Gal ($) 7.55 7.63 7.78 7.56 7.57 7.77 7.76 7.74 2.6% 7.42 7.59 2.3%
Revenues ($) 6,428.15 6,565.82 6,919.99 6,840.73 6,563.57 6,512.87 6,620.32 6,451.93 0.4% 73,134.35 71,731.52 -1.9%
Most recent four-week-period is preliminary
2016-17 STD: 10/02/16 - 08/05/17
2015-16 STD: 10/04/15 - 10/01/16
Source: Nielsen. Food data consists of POS data for U.S. grocery stores doing $2 million and greater
annual sales.
(Gallons and Revenues in Thousands)
GRAPEFRUIT JUICE SALESFOOD ($2MM+ GROCERY)
Report 11 of 16/17 Season
Four Weeks Ending % Change Latest 4
weeks vs. Similar 4
weeks Year Ago
Season-to-Date
Food
Florida Department of Citrus; P.O.Box 9010; Bartow, FL 33831-9010
(863) 537-3999
http://www.fdocgrower.com Page 6 of 14

08/06/16 02/18/17 03/18/17 04/15/17 05/13/17 06/10/17 07/08/17 08/05/17 2015-16 2016-17 % Change
OJ Drinks 0-39.99%
Gallons 1,131.47 896.71 901.80 921.52 889.04 941.13 987.81 913.93 -19.2% 11,482.05 10,381.90 -9.6%
Price/Gal ($) 5.29 5.37 5.66 5.60 5.73 5.61 5.70 5.94 12.2% 5.19 5.48 5.5%
Revenues ($) 5,989.09 4,814.06 5,107.40 5,159.15 5,098.43 5,278.56 5,629.16 5,426.80 -9.4% 59,639.70 56,902.09 -4.6%
OJ Drinks 40-99.99%
Gallons 1,117.81 1,292.44 1,234.56 1,117.52 1,063.91 1,013.03 936.00 917.67 -17.9% 13,867.82 12,617.41 -9.0%
Price/Gal ($) 7.52 7.56 7.78 7.78 7.71 7.82 7.92 7.88 4.9% 7.52 7.66 1.8%
Revenues ($) 8,402.90 9,773.40 9,599.02 8,694.18 8,204.24 7,926.00 7,409.37 7,233.06 -13.9% 104,331.14 96,615.47 -7.4%
OJ Drinks - % not stated
Gallons 166.04 213.63 186.34 150.30 150.59 148.55 146.94 129.75 -21.9% 2,041.74 1,878.71 -8.0%
Price/Gal ($) 5.05 5.23 5.53 5.87 6.12 5.97 5.92 5.89 16.7% 5.18 5.63 8.7%
Revenues ($) 838.11 1,117.56 1,031.17 882.92 921.29 887.31 870.24 764.04 -8.8% 10,569.30 10,574.91 0.1%
Total OJ Drinks
Gallons 2,415.32 2,402.78 2,322.70 2,189.34 2,103.54 2,102.72 2,070.75 1,961.34 -18.8% 27,391.61 24,878.02 -9.2%
Price/Gal ($) 6.31 6.54 6.78 6.73 6.76 6.70 6.72 6.84 8.5% 6.37 6.60 3.5%
Revenues ($) 15,230.09 15,201.11 15,737.59 14,736.25 14,223.95 14,091.87 13,908.77 13,423.90 -11.9% 174,540.14 164,092.47 -6.0%
OJ BL Drinks
Gallons 8,155.05 7,287.53 7,356.92 7,357.57 7,510.44 7,389.30 7,583.90 7,430.18 -8.9% 86,429.25 81,675.46 -5.5%
Price/Gal ($) 3.27 3.34 3.38 3.38 3.28 3.32 3.27 3.30 0.7% 3.30 3.32 0.5%
Revenues ($) 26,703.90 24,354.97 24,860.26 24,874.97 24,653.31 24,497.19 24,791.78 24,492.50 -8.3% 285,574.57 271,157.44 -5.0%
OJ BL (100% Juice)
Gallons 1,568.60 1,643.99 1,703.73 1,776.82 1,609.11 1,584.35 1,613.82 1,477.65 -5.8% 19,798.87 18,071.30 -8.7%
Price/Gal ($) 7.41 7.35 7.32 7.12 7.26 7.25 7.10 7.29 -1.6% 7.22 7.24 0.3%
Revenues ($) 11,622.67 12,077.27 12,463.02 12,653.15 11,682.93 11,490.31 11,457.97 10,775.06 -7.3% 142,925.49 130,831.71 -8.5%
GJ Cocktail
Gallons 441.99 389.52 412.00 419.48 398.26 394.49 405.82 407.98 -7.7% 4,587.34 4,399.38 -4.1%
Price/Gal ($) 7.05 6.88 6.96 6.93 7.02 7.12 7.25 6.99 -0.8% 6.84 6.92 1.2%
Revenues ($) 3,115.91 2,679.75 2,867.20 2,904.94 2,794.85 2,808.98 2,940.65 2,852.95 -8.4% 31,371.96 30,449.41 -2.9%
GJ BL (100% Juice)
Gallons 91.82 92.20 96.11 92.74 83.98 82.62 82.61 86.08 -6.3% 1,083.70 962.78 -11.2%
Price/Gal ($) 6.28 6.96 7.17 6.99 7.06 7.14 7.22 6.78 8.0% 6.26 6.89 9.9%
Revenues ($) 576.59 641.28 689.03 647.98 592.72 590.15 596.75 583.83 1.3% 6,788.99 6,628.74 -2.4%
Most recent four-week-period is preliminary
2016-17 STD: 10/02/16 - 08/05/17
2015-16 STD: 10/04/15 - 10/01/16
Source: Nielsen. Food data consists of POS data for U.S. grocery stores doing $2 million and greater
annual sales.
LESS THAN 100% OJ & GJ BEVERAGES
(Gallons and Revenues in Thousands)
Report 11 of 16/17 Season
Four Weeks Ending % Change Latest 4
weeks vs. Similar 4
weeks Year Ago
Season-to-Date
FOOD ($2MM+ GROCERY)
Food
Florida Department of Citrus; P.O.Box 9010; Bartow, FL 33831-9010
(863) 537-3999
http://www.fdocgrower.com Page 7 of 14

Report Ending Date: 08/05/17
Issue Date: 08/21/17
08/06/16 02/18/17 03/18/17 04/15/17 05/13/17 06/10/17 07/08/17 08/05/17 2015-16 2016-17 % Change
NFC OJ
Average Promo Price 6.88 6.93 7.03 6.83 6.97 7.04 7.11 7.08 2.9% 6.76 6.90 2.1%
Price Reduction 94 93 95 94 95 94 94 94 0.0% 95 94 -0.6%
Feature & Disp 33 34 34 37 35 28 27 23 -30.3% 34 31 -7.7%
Display w/o Fea 26 28 31 30 30 24 25 25 -3.8% 28 27 -3.6%
Feature w/o Disp 91 91 92 90 91 89 85 85 -6.6% 90 90 0.0%
RECON OJ
Average Promo Price 3.84 4.37 4.69 4.71 4.44 4.37 4.39 4.64 20.8% 4.09 4.38 7.1%
Price Reduction 77 78 79 86 81 83 82 81 5.2% 78 79 0.5%
Feature & Disp 10 13 13 7 11 7 9 8 -20.0% 9 8 -11.8%
Display w/o Fea 17 14 17 14 12 12 12 15 -11.8% 15 13 -15.3%
Feature w/o Disp 55 57 66 57 63 62 63 60 9.1% 60 60 -0.5%
Refrigerated OJ
Average Promo Price 5.88 6.20 6.35 6.38 6.21 6.24 6.25 6.35 8.0% 6.02 6.23 3.5%
Price Reduction 96 96 96 96 97 96 96 97 1.0% 97 96 -0.9%
Feature & Disp 36 38 38 39 38 31 31 28 -22.2% 37 34 -6.3%
Display w/o Fea 35 34 38 36 35 30 32 32 -8.6% 35 33 -5.2%
Feature w/o Disp 94 91 94 91 92 92 89 90 -4.3% 92 92 -0.1%
Frozen OJ
Average Promo Price 3.22 3.82 4.31 4.41 3.86 4.00 3.95 4.12 28.0% 3.86 4.03 4.6%
Price Reduction 50 48 38 45 49 47 39 33 -34.0% 48 46 -4.3%
Feature & Disp 1 0 1 0 0 0 0 0 -100.0% 0 0 -66.7%
Display w/o Fea 1 1 1 1 1 1 1 1 0.0% 1 1 18.2%
Feature w/o Disp 13 11 11 9 13 6 10 6 -53.8% 12 10 -19.5%
Shelf Stable OJ
Average Promo Price 8.54 8.14 7.47 7.66 6.70 7.12 7.62 6.19 -27.5% 8.19 7.40 -9.7%
Price Reduction 5 12 16 13 14 13 10 19 280.0% 7 12 59.5%
Feature & Disp 0 0 0 0 0 0 0 0 0 0
Display w/o Fea 0 0 0 0 0 0 0 0 0 0
Feature w/o Disp 0 0 5 4 0 5 0 0 1 2 63.6%
Total OJ
Average Promo Price 5.80 6.15 6.31 6.34 6.15 6.18 6.20 6.32 9.0% 5.97 6.18 3.5%
Price Reduction 96 96 97 97 97 96 96 97 1.0% 97 97 -0.5%
Feature & Disp 36 38 38 39 38 32 31 28 -22.2% 37 34 -6.0%
Display w/o Fea 36 34 38 36 35 31 33 33 -8.3% 35 34 -4.3%
Feature w/o Disp 94 91 94 91 92 92 89 90 -4.3% 92 92 -0.1%
Most recent four-week-period is preliminary
2016-17 STD: 10/02/16 - 08/05/17
2015-16 STD: 10/04/15 - 10/01/16
Florida Department of CitrusORANGE JUICE PROMOTIONS
FOOD ($2MM+ Grocery Stores)NIELSEN SCANTRACK
(Prices in dollars and Promotion in %ACV)
Report 11 of 16/17 Season
Four Weeks Ending% Change
Latest 4 weeks
vs. Similar 4
weeks Year Ago
Season-to-Date
Source: Nielsen
Eco
no
mic
an
d M
arke
t R
ese
arch
Re
po
rt
Food-Promotions
Florida Department of Citrus; P.O. Box 9010; Bartow, FL 33831-9010
(863) 537-3999
http://www.fdocgrower.com Page 8 of 14

08/06/16 02/18/17 03/18/17 04/15/17 05/13/17 06/10/17 07/08/17 08/05/17 2015-16 2016-17 % Change
NFC GJ
Average Promo Price 6.99 6.97 6.98 6.71 6.75 6.99 7.08 7.10 1.6% 6.88 6.88 0.0%
Price Reduction 68 75 71 71 76 72 73 68 0.0% 74 73 -1.4%
Feature & Disp 2 2 3 3 2 2 2 2 0.0% 3 2 -8.0%
Display w/o Fea 4 6 5 7 8 7 7 4 0.0% 7 6 -10.6%
Feature w/o Disp 36 50 48 38 36 45 37 35 -2.8% 42 43 1.9%
RECON GJ
Average Promo Price 10.24 13.49 8.21 9.22 8.38 9.08 6.44 6.75 -34.1% 5.35 8.08 51.1%
Price Reduction 2 8 10 18 15 13 10 14 600.0% 8 12 55.8%
Feature & Disp 0 0 0 0 0 0 0 0 0 0
Display w/o Fea 0 0 0 0 0 0 0 0 0 0 -33.3%
Feature w/o Disp 0 0 0 1 0 0 1 1 1 0 -50.0%
Refrogerated GJ
Average Promo Price 7.01 7.01 7.00 6.80 6.79 7.04 7.04 7.08 1.0% 6.79 6.89 1.4%
Price Reduction 68 76 74 72 76 74 74 71 4.4% 75 74 -0.5%
Feature & Disp 2 2 3 3 2 2 2 2 0.0% 3 2 -8.0%
Display w/o Fea 4 6 5 8 8 7 8 4 0.0% 7 6 -4.5%
Feature w/o Disp 36 50 48 40 36 45 38 35 -2.8% 42 43 2.4%
Frozen GJ
Average Promo Price 2.72 3.01 3.70 5.01 4.58 5.07 4.94 3.98 46.3% 3.66 4.33 18.5%
Price Reduction 12 9 1 1 4 5 7 6 -50.0% 7 5 -23.2%
Feature & Disp 0 0 0 0 0 0 0 0 0 0
Display w/o Fea 0 0 0 0 0 0 0 0 0 0
Feature w/o Disp 0 0 0 0 0 0 0 0 1 0 -100.0%
Shelf Stable GJ
Average Promo Price 5.56 5.49 6.31 5.43 5.44 6.03 6.09 5.81 4.5% 5.56 5.65 1.7%
Price Reduction 44 40 38 38 43 37 45 44 0.0% 41 42 3.0%
Feature & Disp 0 0 0 0 0 0 0 0 0 0 -100.0%
Display w/o Fea 2 2 3 2 2 1 1 1 -50.0% 2 2 -19.0%
Feature w/o Disp 9 17 6 12 12 16 6 16 77.8% 13 13 -0.8%
TL GJ
Average Promo Price 6.60 6.77 6.91 6.60 6.58 6.89 6.90 6.81 3.2% 6.56 6.68 1.8%
Price Reduction 81 81 80 79 84 82 82 78 -3.7% 82 82 -0.9%
Feature & Disp 2 2 3 3 2 3 2 2 0.0% 3 2 -17.2%
Display w/o Fea 6 8 8 9 11 8 9 5 -16.7% 9 8 -8.0%
Feature w/o Disp 39 58 53 44 43 52 40 45 15.4% 49 49 1.6%
Most recent four-week-period is preliminary
2016-17 STD: 10/02/16 - 08/05/17
2015-16 STD: 10/04/15 - 10/01/16
% Change Latest
4 weeks vs.
Similar 4 weeks
Year Ago
Season-to-Date
FOOD ($2MM+ Grocery Stores)(Prices in dollars and Promotion in %ACV)
Report 11 of 16/17 Season
Four Weeks Ending
Source: Nielsen
GRAPEFRUIT JUICE PROMOTIONS
Food-Promotions
Florida Department of Citrus; P.O. Box 9010; Bartow, FL 33831-9010
(863) 537-3999
http://www.fdocgrower.com Page 9 of 14

08/06/16 02/18/17 03/18/17 04/15/17 05/13/17 06/10/17 07/08/17 08/05/17 2015-16 2016-17 % Change
OJ Drinks 0-39.99%
Average Promo Price 4.99 4.77 5.84 5.18 5.49 5.32 5.50 5.55 11.2% 4.82 5.28 9.5%Price Reduction 83 82 83 84 86 85 82 77 -7.2% 80 82 2.4%Feature & Disp 15 7 12 15 13 17 15 16 6.7% 9 11 31.0%
Display w/o Fea 44 29 33 32 37 35 38 37 -15.9% 35 33 -7.6%Feature w/o Disp 69 50 58 70 60 71 70 71 2.9% 55 60 9.4%
OJ Drinks 40-99.99%
Average Promo Price 6.92 6.93 7.22 7.05 7.09 7.11 7.14 7.24 4.6% 6.86 7.01 2.2%Price Reduction 73 77 79 75 75 70 70 71 -2.7% 77 75 -1.7%Feature & Disp 12 7 8 4 9 7 3 5 -58.3% 8 7 -22.6%
Display w/o Fea 9 11 13 10 10 9 7 8 -11.1% 10 10 -2.1%Feature w/o Disp 52 52 51 37 53 51 31 45 -13.5% 50 46 -7.1%
OJ Drinks - % not stated
Average Promo Price 4.57 4.74 5.10 4.80 5.69 5.70 5.28 5.75 25.8% 4.81 5.17 7.5%Price Reduction 17 15 10 12 21 21 13 13 -23.5% 16 15 -1.3%Feature & Disp 0 1 0 0 0 0 1 0 0 0
Display w/o Fea 2 1 1 2 2 2 2 2 0.0% 2 2 13.3%Feature w/o Disp 5 13 5 6 4 13 18 7 40.0% 6 9 50.8%
Total OJ Drinks
Average Promo Price 6.05 6.18 6.71 6.22 6.46 6.27 6.22 6.44 6.4% 6.04 6.30 4.3%Price Reduction 92 92 93 92 92 91 90 90 -2.2% 91 92 0.1%Feature & Disp 25 14 19 18 21 23 17 20 -20.0% 16 17 4.9%
Display w/o Fea 49 37 41 40 44 42 43 43 -12.2% 42 40 -4.8%Feature w/o Disp 76 73 76 76 81 79 75 78 2.6% 72 75 4.0%
OJ BL Drinks
Average Promo Price 2.84 2.77 2.76 2.76 2.62 2.79 2.75 2.91 2.5% 2.81 2.78 -1.1%Price Reduction 96 96 97 96 97 98 97 97 1.0% 95 96 0.9%Feature & Disp 33 26 27 29 33 33 35 35 6.1% 31 29 -6.9%
Display w/o Fea 72 56 60 65 65 68 68 69 -4.2% 65 62 -5.2%Feature w/o Disp 82 83 84 84 86 85 84 84 2.4% 80 83 4.8%
OJ BL (100% Juice)
Average Promo Price 6.49 6.65 6.51 6.28 6.36 6.35 6.29 6.34 -2.3% 6.48 6.39 -1.5%Price Reduction 88 86 90 88 87 90 90 87 -1.1% 88 88 0.1%Feature & Disp 7 10 8 14 8 6 10 5 -28.6% 9 8 -9.1%
Display w/o Fea 14 13 18 16 13 13 15 14 0.0% 12 14 9.7%Feature w/o Disp 64 75 69 80 66 71 75 59 -7.8% 71 70 -1.1%
GJ Cocktail
Average Promo Price 6.29 5.77 6.08 5.95 6.17 6.53 6.88 6.29 0.0% 6.01 6.04 0.5%Price Reduction 76 71 68 72 75 71 73 73 -3.9% 72 73 2.5%Feature & Disp 6 2 4 8 6 5 5 8 33.3% 5 5 3.9%
Display w/o Fea 28 16 18 17 20 19 19 20 -28.6% 19 18 -3.2%Feature w/o Disp 29 23 30 33 24 31 27 36 24.1% 27 31 14.9%
GJ BL (100% Juice)
Average Promo Price 5.32 6.41 7.09 6.41 6.42 6.68 7.06 6.04 13.5% 5.09 6.32 24.1%Price Reduction 44 45 41 42 43 40 36 43 -2.3% 40 44 11.4%Feature & Disp 0 0 0 0 0 0 0 0 0 0
Display w/o Fea 1 1 2 2 2 1 1 1 0.0% 1 1 7.7%Feature w/o Disp 12 3 10 7 6 1 9 7 -41.7% 10 8 -22.0%
Most recent four-week-period is preliminary
2016-17 STD: 10/02/16 - 08/05/17
2015-16 STD: 10/04/15 - 10/01/16
Source: Nielsen
LESS THAN 100% OJ & GJ BEVERAGES PROMOTIONSFOOD ($2MM+ Grocery Stores)
Four Weeks Ending % Change
Latest 4 weeks
vs. Similar 4
Season-to-Date
Report 11 of 16/17 Season
(Prices in dollars and Promotion in %ACV)
Food-Promotions
Florida Department of Citrus; P.O. Box 9010; Bartow, FL 33831-9010
(863) 537-3999
http://www.fdocgrower.com Page 10 of 14
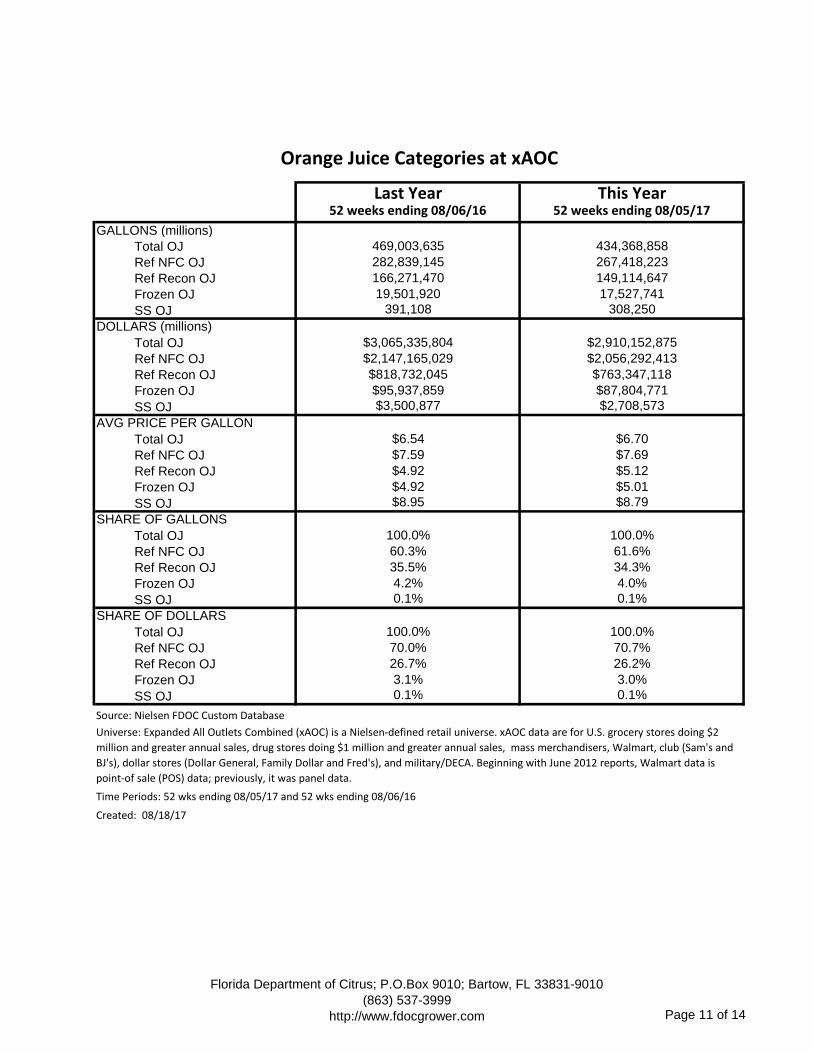
Last Year This Year52 weeks ending 08/06/16 52 weeks ending 08/05/17
GALLONS (millions)
Total OJ 469,003,635 434,368,858
Ref NFC OJ 282,839,145 267,418,223
Ref Recon OJ 166,271,470 149,114,647
Frozen OJ 19,501,920 17,527,741
SS OJ 391,108 308,250
DOLLARS (millions)
Total OJ $3,065,335,804 $2,910,152,875
Ref NFC OJ $2,147,165,029 $2,056,292,413
Ref Recon OJ $818,732,045 $763,347,118
Frozen OJ $95,937,859 $87,804,771
SS OJ $3,500,877 $2,708,573
AVG PRICE PER GALLON
Total OJ $6.54 $6.70
Ref NFC OJ $7.59 $7.69
Ref Recon OJ $4.92 $5.12
Frozen OJ $4.92 $5.01
SS OJ $8.95 $8.79
SHARE OF GALLONS
Total OJ 100.0% 100.0%
Ref NFC OJ 60.3% 61.6%
Ref Recon OJ 35.5% 34.3%
Frozen OJ 4.2% 4.0%
SS OJ 0.1% 0.1%
SHARE OF DOLLARS
Total OJ 100.0% 100.0%
Ref NFC OJ 70.0% 70.7%
Ref Recon OJ 26.7% 26.2%
Frozen OJ 3.1% 3.0%
SS OJ 0.1% 0.1%
Source: Nielsen FDOC Custom Database
Time Periods: 52 wks ending 08/05/17 and 52 wks ending 08/06/16
Created: 08/18/17
Orange Juice Categories at xAOC
Universe: Expanded All Outlets Combined (xAOC) is a Nielsen-defined retail universe. xAOC data are for U.S. grocery stores doing $2
million and greater annual sales, drug stores doing $1 million and greater annual sales, mass merchandisers, Walmart, club (Sam's and
BJ's), dollar stores (Dollar General, Family Dollar and Fred's), and military/DECA. Beginning with June 2012 reports, Walmart data is
point-of sale (POS) data; previously, it was panel data.
Florida Department of Citrus; P.O.Box 9010; Bartow, FL 33831-9010
(863) 537-3999
http://www.fdocgrower.com Page 11 of 14

Last Year This Year52 weeks ending 08/06/16 52 weeks ending 08/05/17
GALLONS (millions)
Total GJ 14,426,530 13,974,645
Ref NFC GJ 9,431,735 9,168,249
Ref Recon GJ 989,095 864,195
Frozen GJ 175,289 151,281
SS GJ 3,811,244 3,780,236
DOLLARS (millions)
Total GJ $105,607,720 $103,467,022
Ref NFC GJ $73,807,948 $71,787,231
Ref Recon GJ $6,369,520 $6,846,048
Frozen GJ $794,663 $674,944
SS GJ $24,526,440 $24,097,766
AVG PRICE PER GALLON
Total GJ $7.32 $7.40
Ref NFC GJ $7.83 $7.83
Ref Recon GJ $6.44 $7.92
Frozen GJ $4.53 $4.46
SS GJ $6.44 $6.37
SHARE OF GALLONS
Total GJ 100.0% 100.0%
Ref NFC GJ 65.4% 65.6%
Ref Recon GJ 6.9% 6.2%
Frozen GJ 1.2% 1.1%
SS GJ 26.4% 27.1%
SHARE OF DOLLARS
Total GJ 100.0% 100.0%
Ref NFC GJ 69.9% 69.4%
Ref Recon GJ 6.0% 6.6%
Frozen GJ 0.8% 0.7%
SS GJ 23.2% 23.3%
Source: Nielsen FDOC Custom Database
Time Periods: 52 wks ending 08/05/17 and 52 wks ending 08/06/16
Created: 08/18/17
Grapefruit Juice Categories at xAOC
Universe: Expanded All Outlets Combined (xAOC) is a Nielsen-defined retail universe. xAOC data are for U.S. grocery stores doing $2
million and greater annual sales, drug stores doing $1 million and greater annual sales, mass merchandisers, Walmart, club (Sam's and
BJ's), dollar stores (Dollar General, Family Dollar and Fred's), and military/DECA. Beginning with June 2012 reports, Walmart data is
point-of sale (POS) data; previously, it was panel data.
Florida Department of Citrus; P.O.Box 9010; Bartow, FL 33831-9010
(863) 537-3999
http://www.fdocgrower.com Page 12 of 14
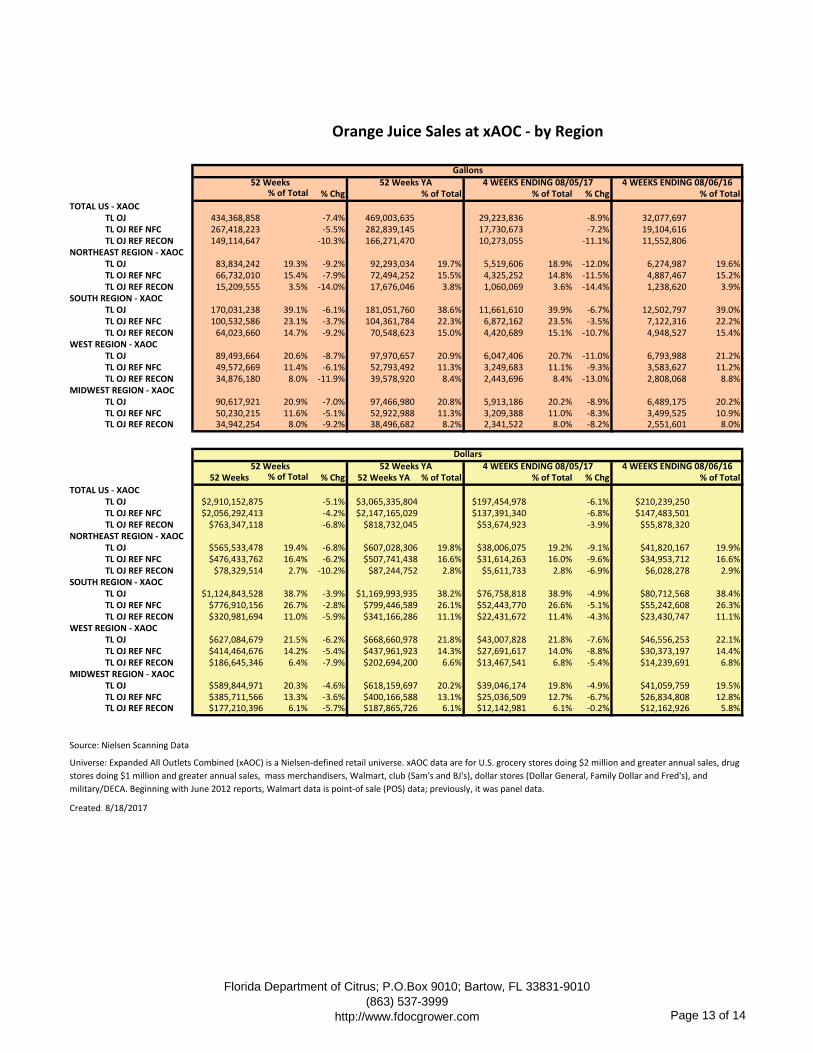
% of Total % Chg % of Total % of Total % Chg % of Total
TOTAL US - XAOCTL OJ 434,368,858 -7.4% 469,003,635 29,223,836 -8.9% 32,077,697 TL OJ REF NFC 267,418,223 -5.5% 282,839,145 17,730,673 -7.2% 19,104,616 TL OJ REF RECON 149,114,647 -10.3% 166,271,470 10,273,055 -11.1% 11,552,806
NORTHEAST REGION - XAOCTL OJ 83,834,242 19.3% -9.2% 92,293,034 19.7% 5,519,606 18.9% -12.0% 6,274,987 19.6%TL OJ REF NFC 66,732,010 15.4% -7.9% 72,494,252 15.5% 4,325,252 14.8% -11.5% 4,887,467 15.2%TL OJ REF RECON 15,209,555 3.5% -14.0% 17,676,046 3.8% 1,060,069 3.6% -14.4% 1,238,620 3.9%
SOUTH REGION - XAOCTL OJ 170,031,238 39.1% -6.1% 181,051,760 38.6% 11,661,610 39.9% -6.7% 12,502,797 39.0%TL OJ REF NFC 100,532,586 23.1% -3.7% 104,361,784 22.3% 6,872,162 23.5% -3.5% 7,122,316 22.2%TL OJ REF RECON 64,023,660 14.7% -9.2% 70,548,623 15.0% 4,420,689 15.1% -10.7% 4,948,527 15.4%
WEST REGION - XAOCTL OJ 89,493,664 20.6% -8.7% 97,970,657 20.9% 6,047,406 20.7% -11.0% 6,793,988 21.2%TL OJ REF NFC 49,572,669 11.4% -6.1% 52,793,492 11.3% 3,249,683 11.1% -9.3% 3,583,627 11.2%TL OJ REF RECON 34,876,180 8.0% -11.9% 39,578,920 8.4% 2,443,696 8.4% -13.0% 2,808,068 8.8%
MIDWEST REGION - XAOCTL OJ 90,617,921 20.9% -7.0% 97,466,980 20.8% 5,913,186 20.2% -8.9% 6,489,175 20.2%TL OJ REF NFC 50,230,215 11.6% -5.1% 52,922,988 11.3% 3,209,388 11.0% -8.3% 3,499,525 10.9%TL OJ REF RECON 34,942,254 8.0% -9.2% 38,496,682 8.2% 2,341,522 8.0% -8.2% 2,551,601 8.0%
52 Weeks % of Total % Chg 52 Weeks YA % of Total % of Total % Chg % of Total
TOTAL US - XAOCTL OJ $2,910,152,875 -5.1% $3,065,335,804 $197,454,978 -6.1% $210,239,250TL OJ REF NFC $2,056,292,413 -4.2% $2,147,165,029 $137,391,340 -6.8% $147,483,501TL OJ REF RECON $763,347,118 -6.8% $818,732,045 $53,674,923 -3.9% $55,878,320
NORTHEAST REGION - XAOCTL OJ $565,533,478 19.4% -6.8% $607,028,306 19.8% $38,006,075 19.2% -9.1% $41,820,167 19.9%TL OJ REF NFC $476,433,762 16.4% -6.2% $507,741,438 16.6% $31,614,263 16.0% -9.6% $34,953,712 16.6%TL OJ REF RECON $78,329,514 2.7% -10.2% $87,244,752 2.8% $5,611,733 2.8% -6.9% $6,028,278 2.9%
SOUTH REGION - XAOCTL OJ $1,124,843,528 38.7% -3.9% $1,169,993,935 38.2% $76,758,818 38.9% -4.9% $80,712,568 38.4%TL OJ REF NFC $776,910,156 26.7% -2.8% $799,446,589 26.1% $52,443,770 26.6% -5.1% $55,242,608 26.3%TL OJ REF RECON $320,981,694 11.0% -5.9% $341,166,286 11.1% $22,431,672 11.4% -4.3% $23,430,747 11.1%
WEST REGION - XAOCTL OJ $627,084,679 21.5% -6.2% $668,660,978 21.8% $43,007,828 21.8% -7.6% $46,556,253 22.1%TL OJ REF NFC $414,464,676 14.2% -5.4% $437,961,923 14.3% $27,691,617 14.0% -8.8% $30,373,197 14.4%TL OJ REF RECON $186,645,346 6.4% -7.9% $202,694,200 6.6% $13,467,541 6.8% -5.4% $14,239,691 6.8%
MIDWEST REGION - XAOCTL OJ $589,844,971 20.3% -4.6% $618,159,697 20.2% $39,046,174 19.8% -4.9% $41,059,759 19.5%TL OJ REF NFC $385,711,566 13.3% -3.6% $400,166,588 13.1% $25,036,509 12.7% -6.7% $26,834,808 12.8%TL OJ REF RECON $177,210,396 6.1% -5.7% $187,865,726 6.1% $12,142,981 6.1% -0.2% $12,162,926 5.8%
Source: Nielsen Scanning Data
Created: 8/18/2017
Orange Juice Sales at xAOC - by Region
Gallons
52 Weeks 52 Weeks YA 4 WEEKS ENDING 08/05/17 4 WEEKS ENDING 08/06/16
Dollars
52 Weeks 52 Weeks YA 4 WEEKS ENDING 08/05/17 4 WEEKS ENDING 08/06/16
Universe: Expanded All Outlets Combined (xAOC) is a Nielsen-defined retail universe. xAOC data are for U.S. grocery stores doing $2 million and greater annual sales, drug
stores doing $1 million and greater annual sales, mass merchandisers, Walmart, club (Sam's and BJ's), dollar stores (Dollar General, Family Dollar and Fred's), and
military/DECA. Beginning with June 2012 reports, Walmart data is point-of sale (POS) data; previously, it was panel data.
Florida Department of Citrus; P.O.Box 9010; Bartow, FL 33831-9010
(863) 537-3999
http://www.fdocgrower.com Page 13 of 14

% of Total % Chg % of Total % of Total % Chg % of Total
TOTAL US - XAOCTL GJ 13,974,645 -3.1% 14,426,530 1,048,321 -1.8% 1,067,929 TL GJ REF NFC 9,168,249 -2.8% 9,431,735 678,669 -0.4% 681,200 TL GJ REF RECON 864,195 -12.6% 989,095 57,510 -18.2% 70,335
NORTHEAST REGION - XAOCTL GJ 2,621,709 18.8% -4.7% 2,750,785 19.1% 191,883 18.3% -6.9% 206,166 19.3%TL GJ REF NFC 2,021,996 14.5% -4.7% 2,121,093 14.7% 144,310 13.8% -7.7% 156,378 14.6%TL GJ REF RECON 75,098 0.5% 24.9% 60,135 0.4% 7,188 0.7% 71.3% 4,197 0.4%
SOUTH REGION - XAOCTL GJ 5,825,096 41.7% -2.6% 5,981,923 41.5% 436,838 41.7% -1.6% 443,838 41.6%TL GJ REF NFC 3,651,863 26.1% 0.2% 3,645,949 25.3% 277,599 26.5% 4.3% 266,086 24.9%TL GJ REF RECON 502,745 3.6% -22.6% 649,888 4.5% 29,707 2.8% -35.8% 46,275 4.3%
WEST REGION - XAOCTL GJ 3,135,255 22.4% -4.5% 3,283,773 22.8% 242,244 23.1% 0.2% 241,820 22.6%TL GJ REF NFC 2,083,593 14.9% -6.5% 2,229,397 15.5% 154,726 14.8% -2.3% 158,443 14.8%TL GJ REF RECON 134,592 1.0% -2.4% 137,844 1.0% 9,976 1.0% 3.2% 9,668 0.9%
MIDWEST REGION - XAOCTL GJ 2,376,747 17.0% -1.1% 2,402,669 16.7% 173,975 16.6% -1.0% 175,703 16.5%TL GJ REF NFC 1,392,983 10.0% -2.3% 1,425,997 9.9% 97,709 9.3% -2.1% 99,823 9.3%TL GJ REF RECON 155,041 1.1% 10.2% 140,692 1.0% 11,866 1.1% 16.8% 10,160 1.0%
52 Weeks % of Total % Chg 52 Weeks YA % of Total % of Total % Chg % of Total
TOTAL US - XAOCTL GJ $103,467,022 -2.0% $105,607,720 $7,912,019 0.3% $7,885,905TL GJ REF NFC $71,787,231 -2.7% $73,807,948 $5,411,761 -0.9% $5,458,700TL GJ REF RECON $6,846,048 7.5% $6,369,520 $515,912 10.6% $466,455
NORTHEAST REGION - XAOCTL GJ $19,275,270 18.6% -4.0% $20,073,145 19.0% $1,436,060 18.2% -4.8% $1,507,795 19.1%TL GJ REF NFC $15,167,647 14.7% -5.1% $15,979,076 15.1% $1,099,386 13.9% -7.6% $1,189,686 15.1%TL GJ REF RECON $698,853 0.7% 45.5% $480,392 0.5% $67,648 0.9% 113.4% $31,704 0.4%
SOUTH REGION - XAOCTL GJ $41,928,067 40.5% -1.1% $42,414,045 40.2% $3,203,448 40.5% 1.2% $3,166,771 40.2%TL GJ REF NFC $28,133,527 27.2% -0.2% $28,180,275 26.7% $2,145,832 27.1% 2.3% $2,097,619 26.6%TL GJ REF RECON $3,755,301 3.6% -1.6% $3,817,036 3.6% $265,757 3.4% -8.0% $288,861 3.7%
WEST REGION - XAOCTL GJ $25,111,635 24.3% -3.6% $26,040,082 24.7% $1,964,517 24.8% 0.5% $1,954,716 24.8%TL GJ REF NFC $17,598,503 17.0% -5.8% $18,681,299 17.7% $1,340,011 16.9% -3.1% $1,382,852 17.5%TL GJ REF RECON $1,309,737 1.3% 13.8% $1,150,782 1.1% $106,652 1.3% 37.8% $77,370 1.0%
MIDWEST REGION - XAOCTL GJ $17,003,273 16.4% -0.2% $17,030,995 16.1% $1,270,035 16.1% 1.2% $1,254,499 15.9%TL GJ REF NFC $10,722,020 10.4% -1.6% $10,900,994 10.3% $781,179 9.9% -0.6% $785,652 10.0%TL GJ REF RECON $1,104,793 1.1% 20.4% $917,834 0.9% $84,537 1.1% 23.6% $68,399 0.9%
Source: Nielsen Scanning Data
Created: 8/18/2017
Grapefruit Juice Sales at xAOC - by Region
Gallons
52 Weeks 52 Weeks YA 4 WEEKS ENDING 08/05/17 4 WEEKS ENDING 08/06/16
Dollars
52 Weeks 52 Weeks YA 4 WEEKS ENDING 08/05/17 4 WEEKS ENDING 08/06/16
Universe: Expanded All Outlets Combined (xAOC) is a Nielsen-defined retail universe. xAOC data are for U.S. grocery stores doing $2 million and greater annual sales, drug
stores doing $1 million and greater annual sales, mass merchandisers, Walmart, club (Sam's and BJ's), dollar stores (Dollar General, Family Dollar and Fred's), and
military/DECA. Beginning with June 2012 reports, Walmart data is point-of sale (POS) data; previously, it was panel data.
Florida Department of Citrus; P.O.Box 9010; Bartow, FL 33831-9010
(863) 537-3999
http://www.fdocgrower.com Page 14 of 14


![ABSTRACT arXiv:1811.11157v1 [astro-ph.HE] 27 Nov 2018 · GJ >1 or J=J GJ](https://static.fdocuments.us/doc/165x107/5fb735a03083292ac743a6a4/abstract-arxiv181111157v1-astro-phhe-27-nov-2018-gj-1-or-jj-gj-.jpg)