
Nielsen / IAB - Digital video-and-tv-advertising-viewing-budget-share-shift-and-effectiveness-final...
124
1 Copyright © 2012 The Nielsen Company. Confidential and proprietary. IAB Online Video Study Copyright © 2012 The Nielsen Company. Confidential and proprietary. A Comprehensive Picture of Digital Video and TV Advertising: Viewing, Budget Share Shift and Effectiveness
-
Upload
babelfish-brian-crotty -
Category
Marketing
-
view
382 -
download
0
Transcript of Nielsen / IAB - Digital video-and-tv-advertising-viewing-budget-share-shift-and-effectiveness-final...
1
Copyright © 2012 The Nielsen Company. Confidential and proprietary.
IAB Online Video Study Copyright © 2012 The Nielsen Company. Confidential and proprietary.
A Comprehensive Picture of Digital Video and TV Advertising:
Viewing, Budget Share Shift and Effectiveness
2
Copyright © 2012 The Nielsen Company. Confidential and proprietary.
IAB Online Video Study
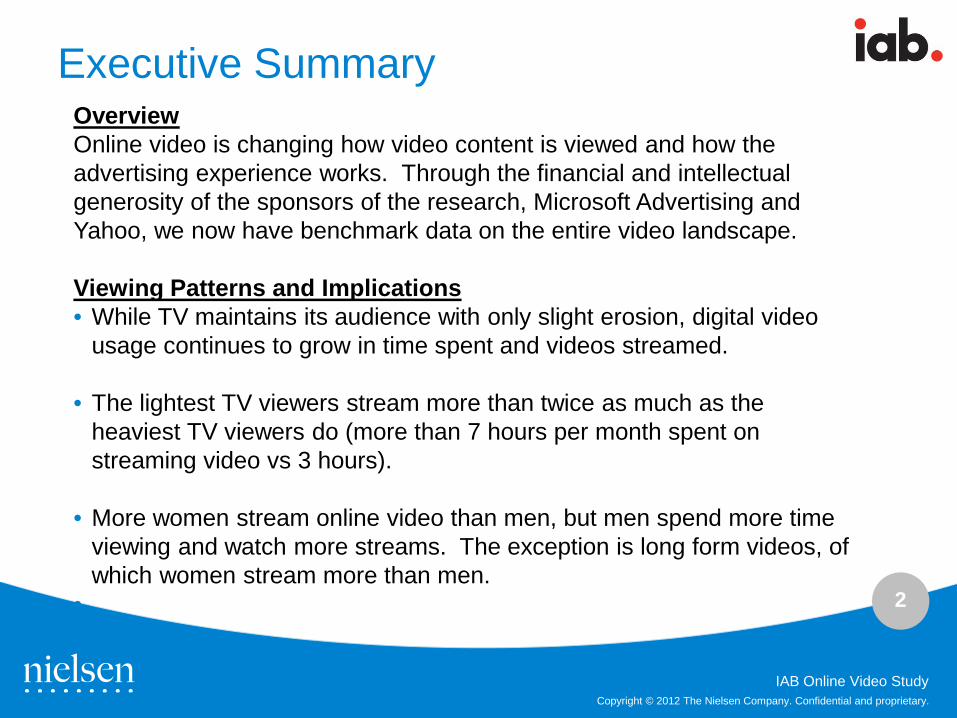
Executive Summary Overview Online video is changing how video content is viewed and how the advertising experience works. Through the financial and intellectual generosity of the sponsors of the research, Microsoft Advertising and Yahoo, we now have benchmark data on the entire video landscape. Viewing Patterns and Implications • While TV maintains its audience with only slight erosion, digital video
usage continues to grow in time spent and videos streamed.
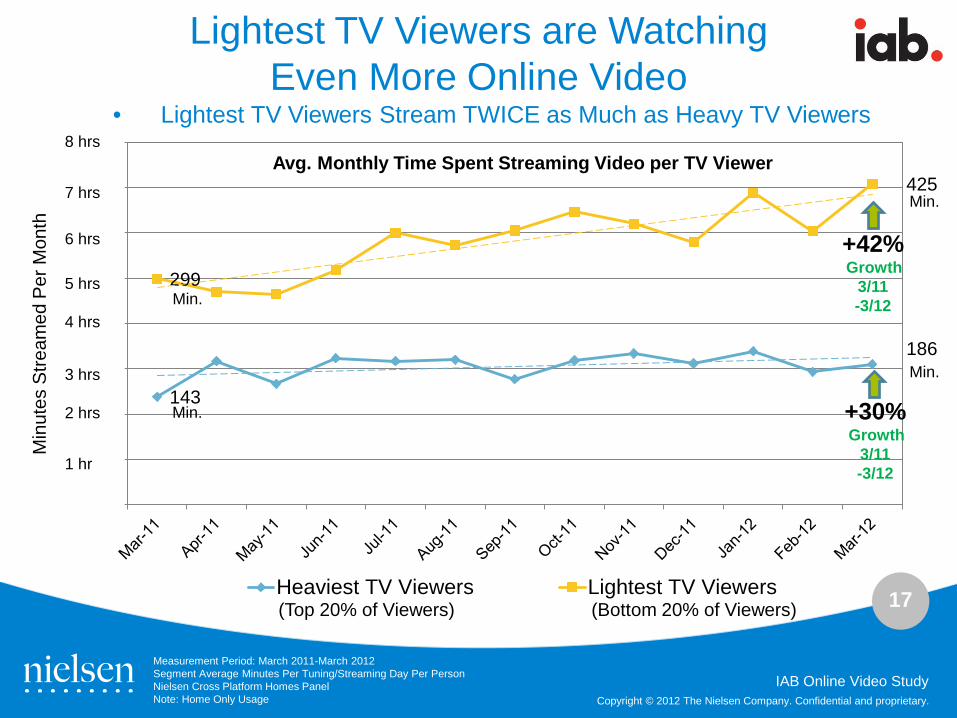
• The lightest TV viewers stream more than twice as much as the heaviest TV viewers do (more than 7 hours per month spent on streaming video vs 3 hours).
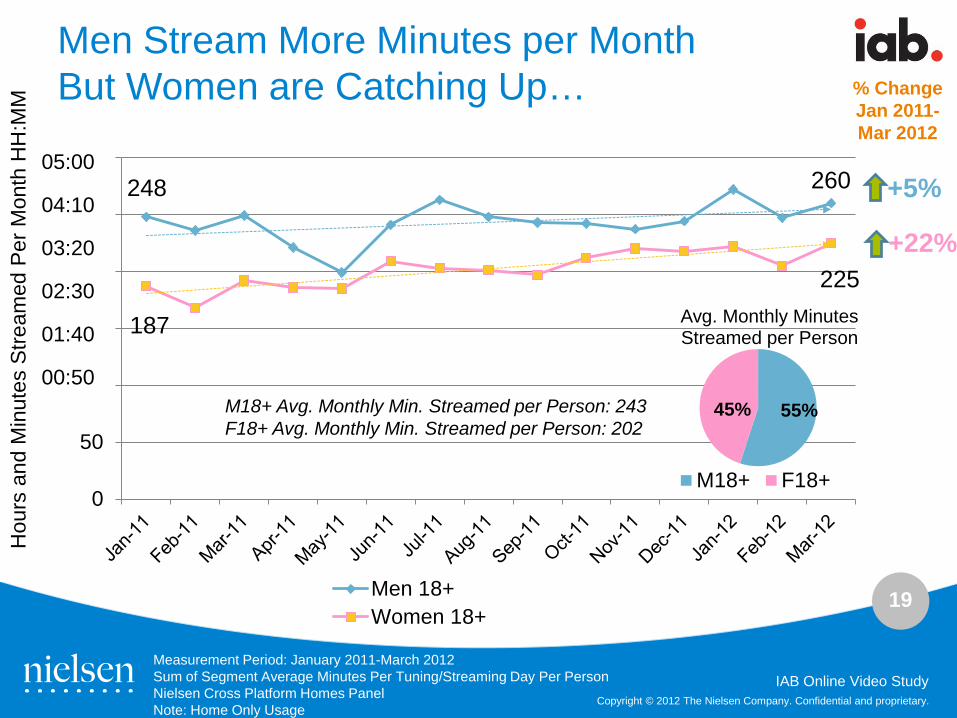
• More women stream online video than men, but men spend more time viewing and watch more streams. The exception is long form videos, of which women stream more than men.
•
3
Copyright © 2012 The Nielsen Company. Confidential and proprietary.
IAB Online Video Study
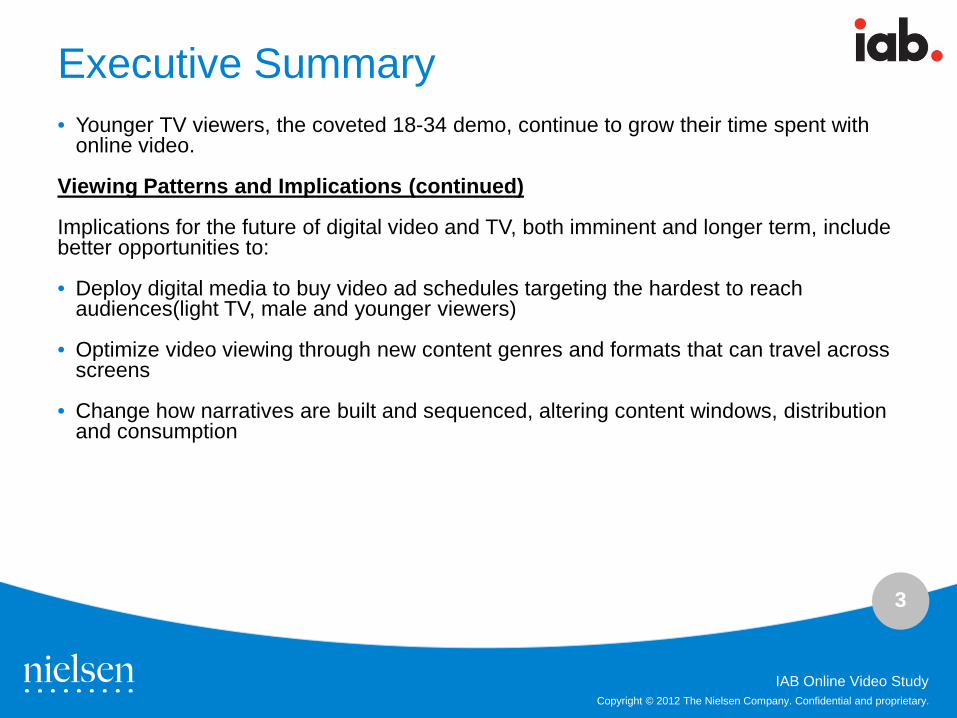
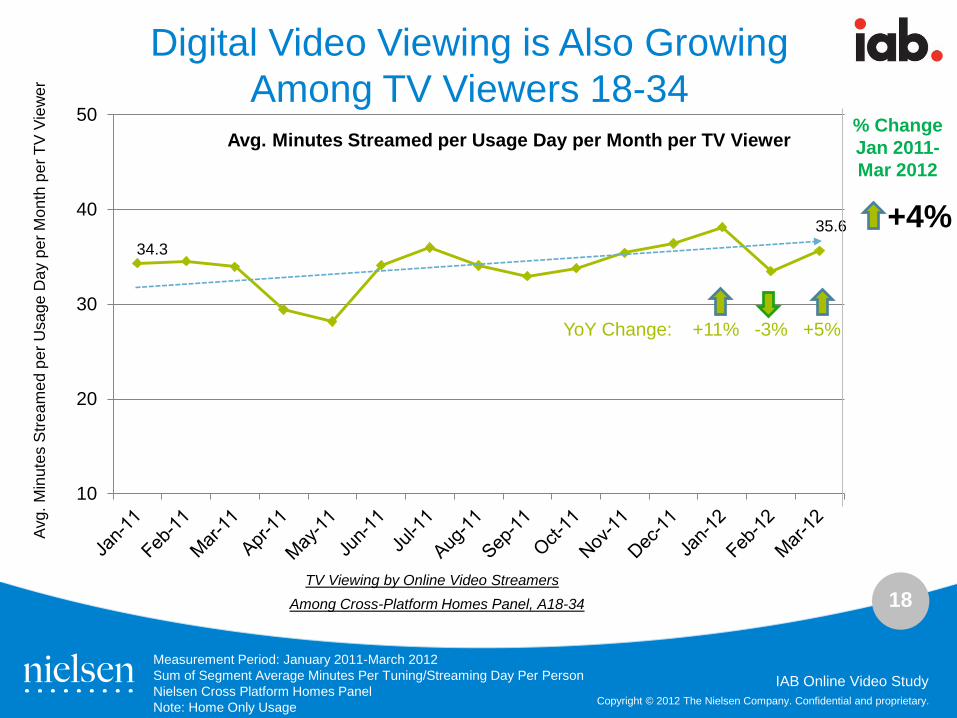
Executive Summary • Younger TV viewers, the coveted 18-34 demo, continue to grow their time spent with
online video. Viewing Patterns and Implications (continued) Implications for the future of digital video and TV, both imminent and longer term, include better opportunities to:
• Deploy digital media to buy video ad schedules targeting the hardest to reach
audiences(light TV, male and younger viewers)
• Optimize video viewing through new content genres and formats that can travel across screens
• Change how narratives are built and sequenced, altering content windows, distribution and consumption
4
Copyright © 2012 The Nielsen Company. Confidential and proprietary.
IAB Online Video Study
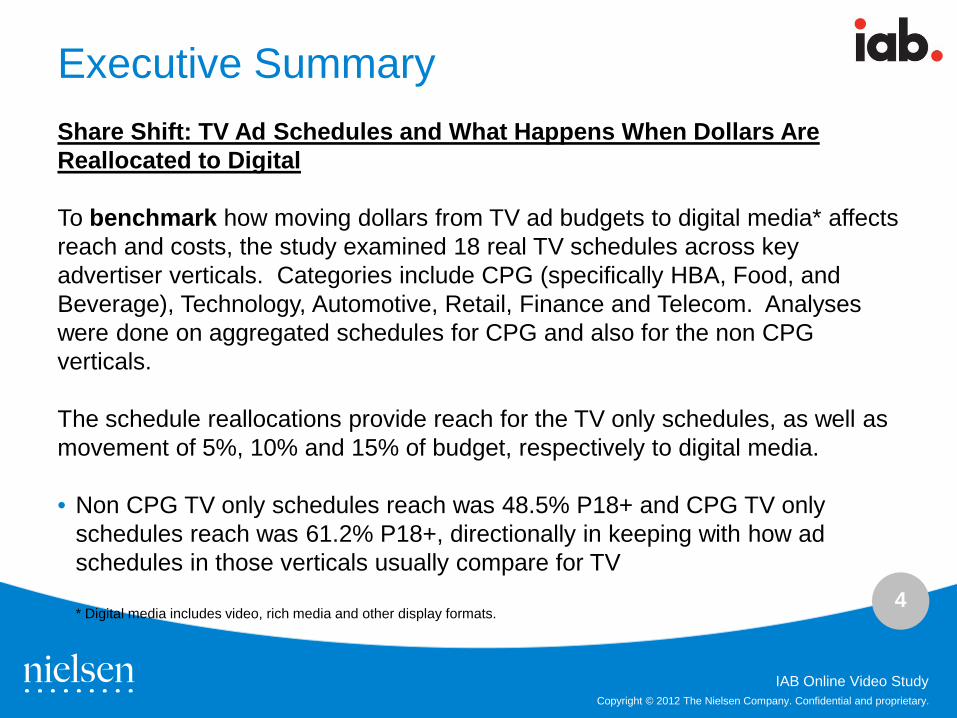
Executive Summary Share Shift: TV Ad Schedules and What Happens When Dollars Are Reallocated to Digital
To benchmark how moving dollars from TV ad budgets to digital media* affects reach and costs, the study examined 18 real TV schedules across key advertiser verticals. Categories include CPG (specifically HBA, Food, and Beverage), Technology, Automotive, Retail, Finance and Telecom. Analyses were done on aggregated schedules for CPG and also for the non CPG verticals. The schedule reallocations provide reach for the TV only schedules, as well as movement of 5%, 10% and 15% of budget, respectively to digital media.
• Non CPG TV only schedules reach was 48.5% P18+ and CPG TV only
schedules reach was 61.2% P18+, directionally in keeping with how ad schedules in those verticals usually compare for TV
• * Digital media includes video, rich media and other display formats.
•
5
Copyright © 2012 The Nielsen Company. Confidential and proprietary.
IAB Online Video Study
Executive Summary Share Shift: TV Ad Schedules and What Happens When Dollars Are Reallocated to Digital
• Across the 18 schedules in the study, budget shifts resulted in incremental
reach for the same spend. The average increase in P18+ reach at a reallocation of 15% of budget was 4.2% or 4.2 reach points.
• Non CPG schedules averaged incremental P18+ reach of 6.2% (or 6.2 reach points) at a reallocation of 15% of budget.
• And on average, CPG P18+ reach grew 3.4% (3.4 reach points) when 15% of dollars moved into digital.
• Across verticals, the 15% share shift results in more reach at lower costs per point, dropping from an average of $67.6K to $63.0K. Corresponding CPM’s go from $13.82 to $12.31
6
Copyright © 2012 The Nielsen Company. Confidential and proprietary.
IAB Online Video Study
Executive Summary Share Shift: TV Ad Schedules and What Happens When Dollars Are Reallocated to Digital • For the reallocated schedules, the portion of reach points that is duplicated
across both web and TV or the cross platform piece is greater than the new online only reach points.
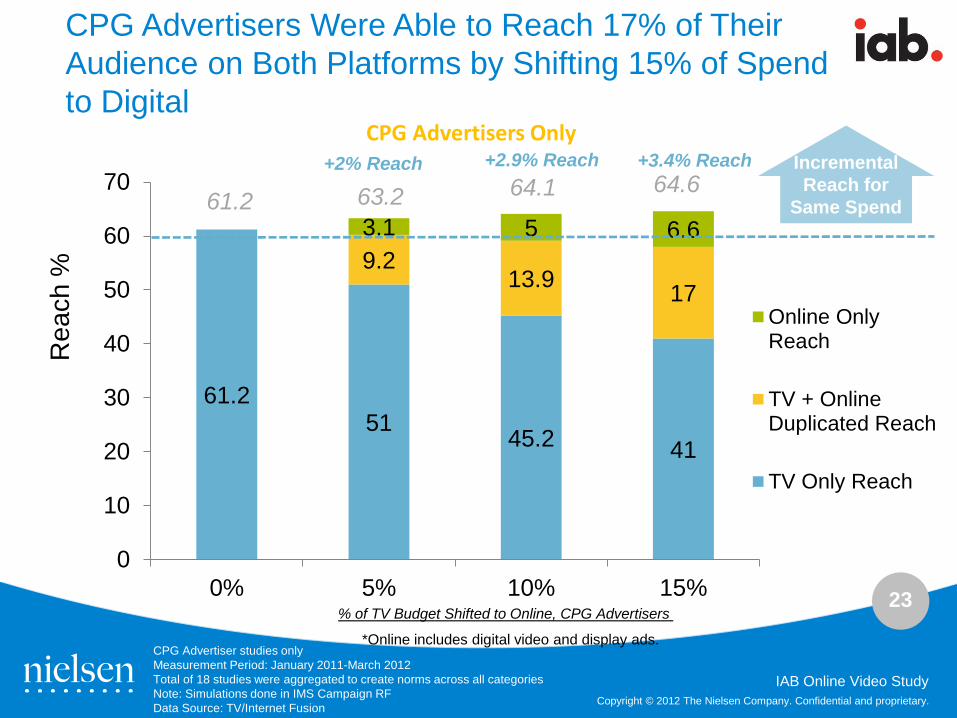
– For example, the TV only CPG schedules started at 61.2% P18+ reach and with 15% of budget shifted grew to 64.6% P18+ reach distributed as follows: 6.6% online only, 17% online + TV and 41% TV only.
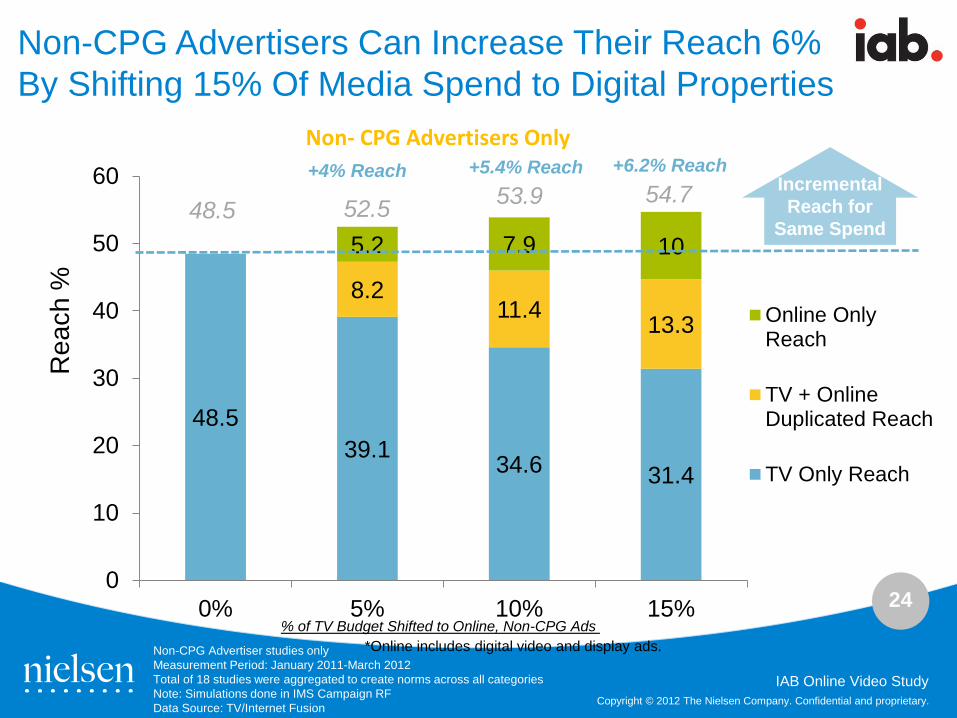
– Similarly, for non CPG schedules at 15% reallocation of budgets, the TV only schedule grows from 48.5% to 54.7% P18+ reach with 31.4 reach points in TV, 13.3 reach points online + TV and 10 reach points in online only
• The duplicated or online + TV reach is shown to be more effective on key
brand effect metrics than either platform alone.
• The sequence of exposure matters: prior exposure to an ad online enhances the impact of the TV exposure.
7
Copyright © 2012 The Nielsen Company. Confidential and proprietary.
IAB Online Video Study
Executive Summary Implications of Reallocated Schedules and Cross Platform Duplication and Ad Effectiveness • In an increasingly digital world, the value of duplicated, as
a function of diverse ad experiences, is likely to increase.
• Frequency across TV and digital by target audience and within ad vertical need to be examined to optimize TV and digital platform schedules.
• Planning and running online video first can boost how well both the online video and TV portions of a campaign work.
8
Copyright © 2012 The Nielsen Company. Confidential and proprietary.
IAB Online Video Study
Executive Summary Video Brand Ad Effectiveness • Online video ads score higher impact than TV ads on Nielsen measured metrics.
Metrics are general recall, brand recall, message recall and ad likeability.
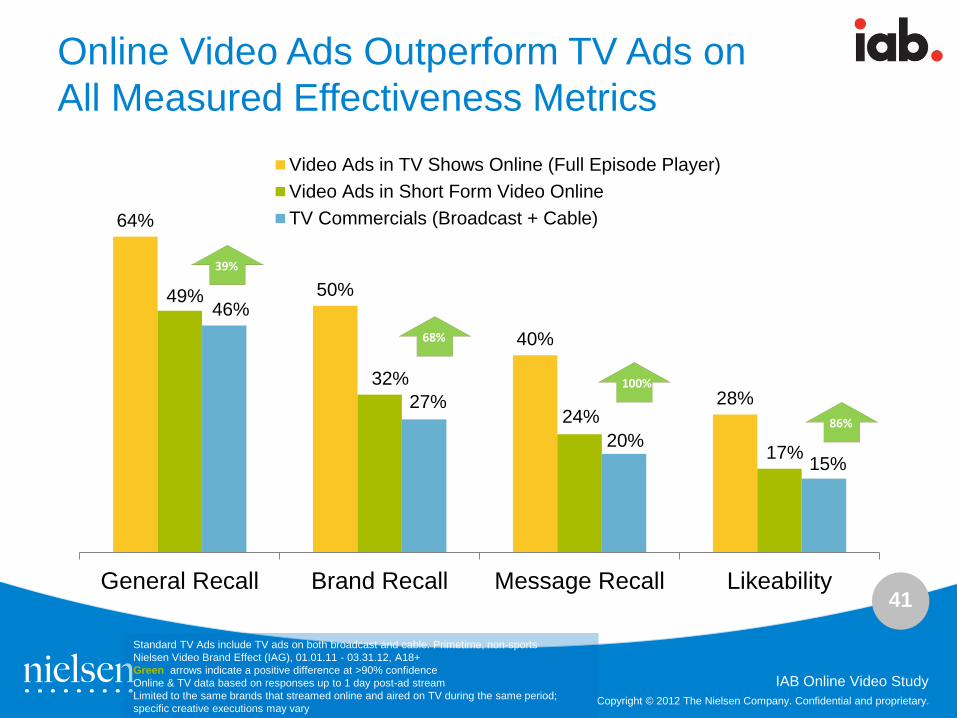
• Greatest differentials on all metrics occur for video ads in full episode players compared to TV, both broadcast and cable. For example, message recall at 40% is double that of TV at 20%. General recall is 64% (vs. 46% on TV), Brand recall is 50% (vs. 27% on TV) and Ad Likeability is 28% (vs. 17% on TV).
• Sequencing Matters. Prior exposure to online ads improves ad impact of TV ads by double digits. This is true across ad formats: Short Form, Full Episode or Display (Non-Video) Ads. Over half recall the ad, roughly one-third recall the brand or message and 20% like the ads online vs. TV.
• Ads are more effective online whether they are later duplicated on TV or as standalone online ads. Full Episodes are the most effective, outperforming TV across metrics, demos, content genres and Ad Verticals. Short form videos are often, but not always, more effective than TV ads.
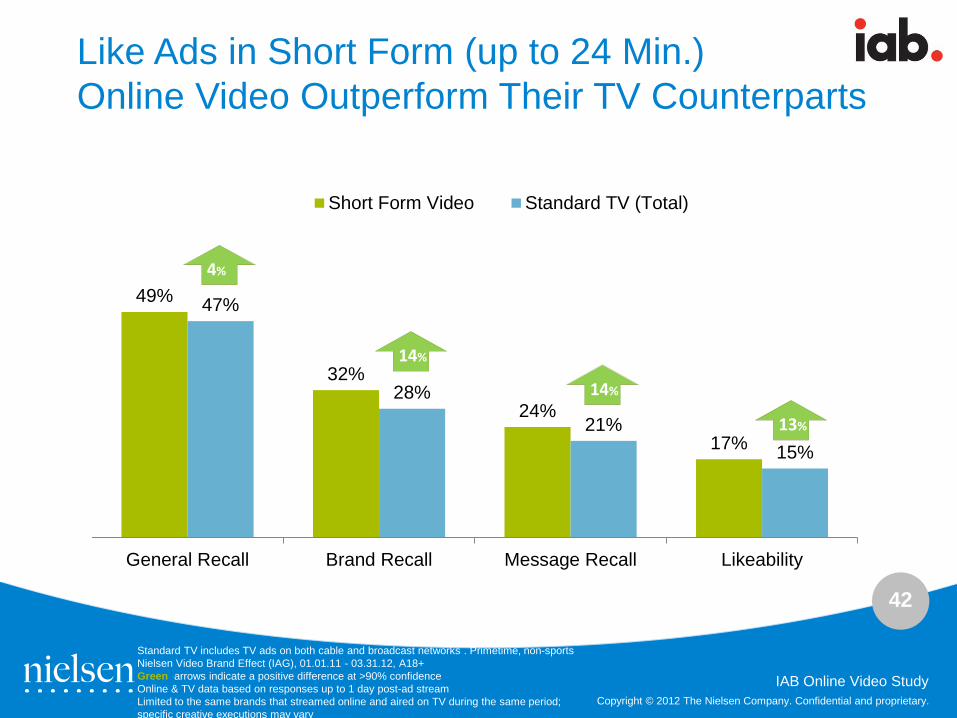
• Superior performance on ad effectiveness for ads in short form online video is evident but the margins relative to TV narrow.
9
Copyright © 2012 The Nielsen Company. Confidential and proprietary.
IAB Online Video Study
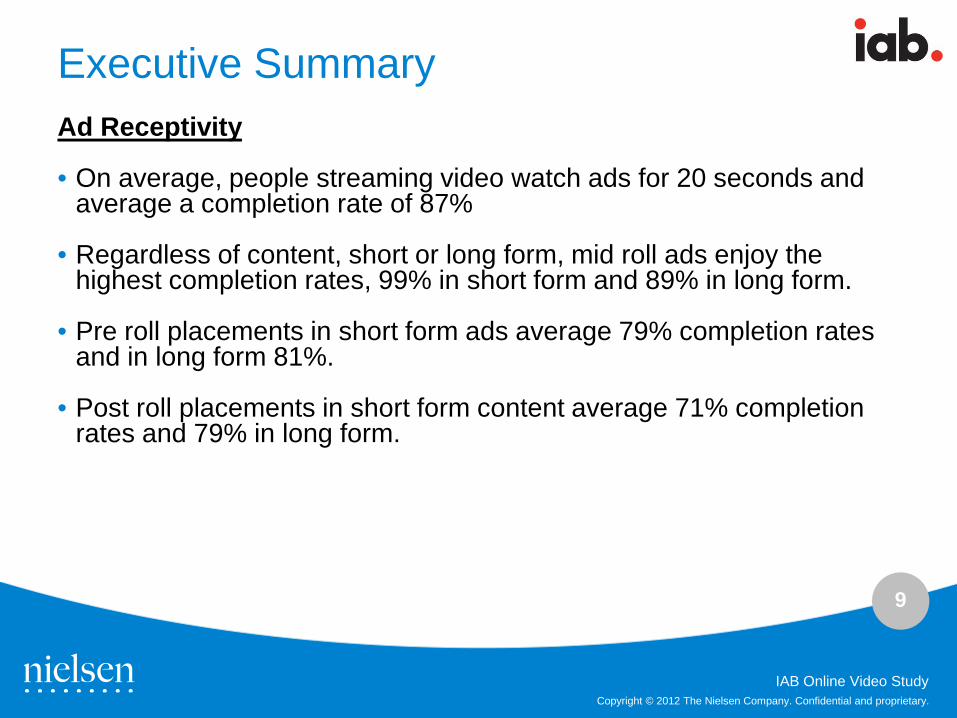
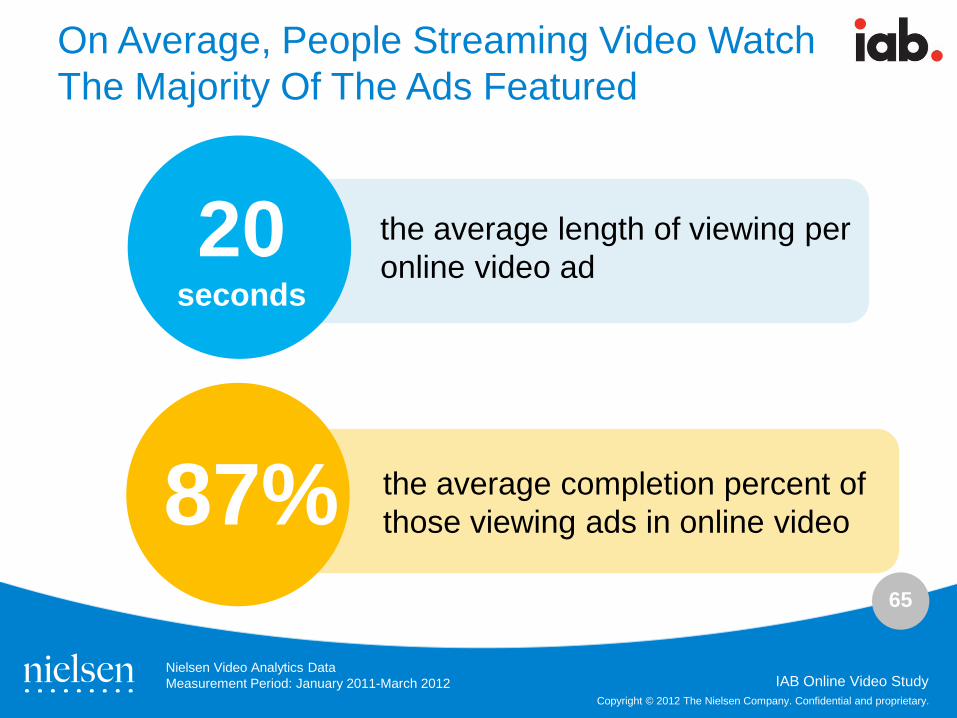
Executive Summary Ad Receptivity • On average, people streaming video watch ads for 20 seconds and
average a completion rate of 87%
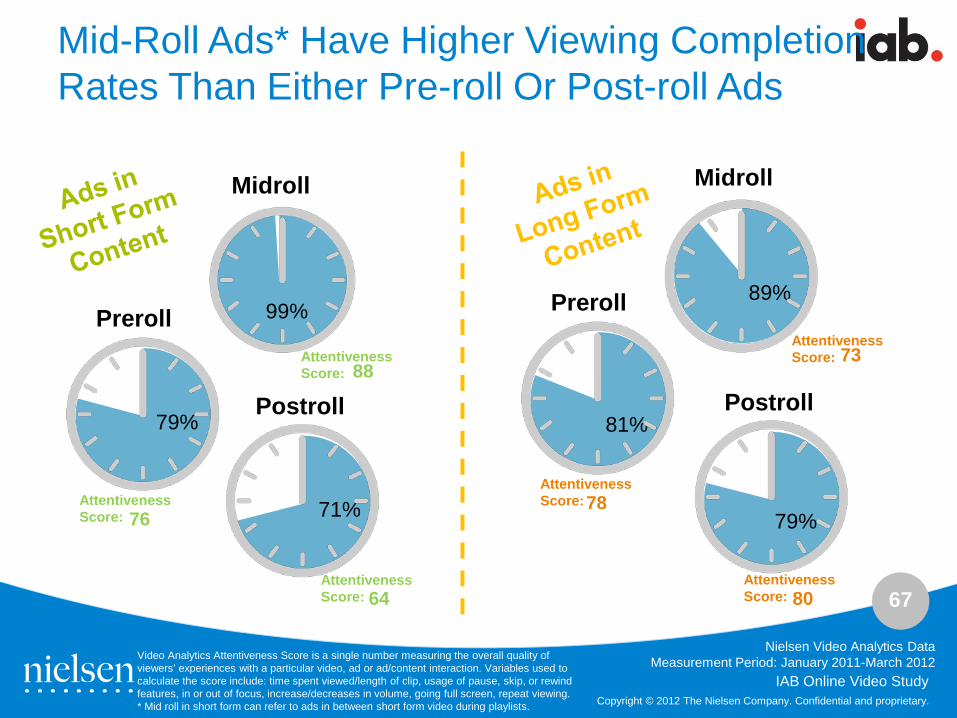
• Regardless of content, short or long form, mid roll ads enjoy the highest completion rates, 99% in short form and 89% in long form.
• Pre roll placements in short form ads average 79% completion rates and in long form 81%.
• Post roll placements in short form content average 71% completion rates and 79% in long form.
10
Copyright © 2012 The Nielsen Company. Confidential and proprietary.
IAB Online Video Study
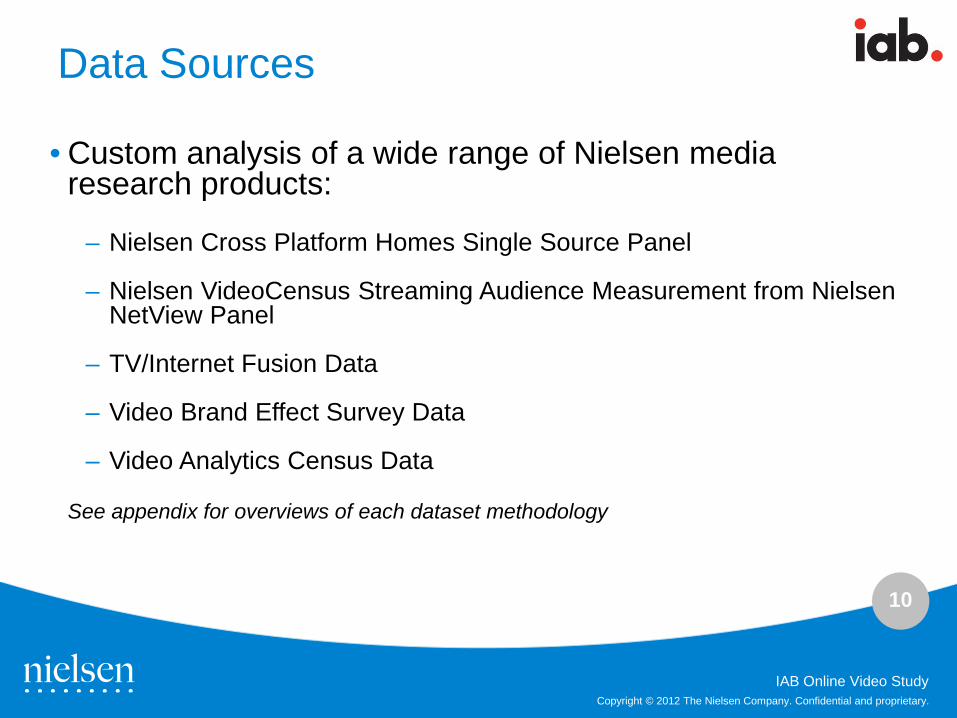
Data Sources
• Custom analysis of a wide range of Nielsen media research products:
– Nielsen Cross Platform Homes Single Source Panel
– Nielsen VideoCensus Streaming Audience Measurement from Nielsen NetView Panel
– TV/Internet Fusion Data
– Video Brand Effect Survey Data
– Video Analytics Census Data
• See appendix for overviews of each dataset methodology
11
Copyright © 2012 The Nielsen Company. Confidential and proprietary.
IAB Online Video Study
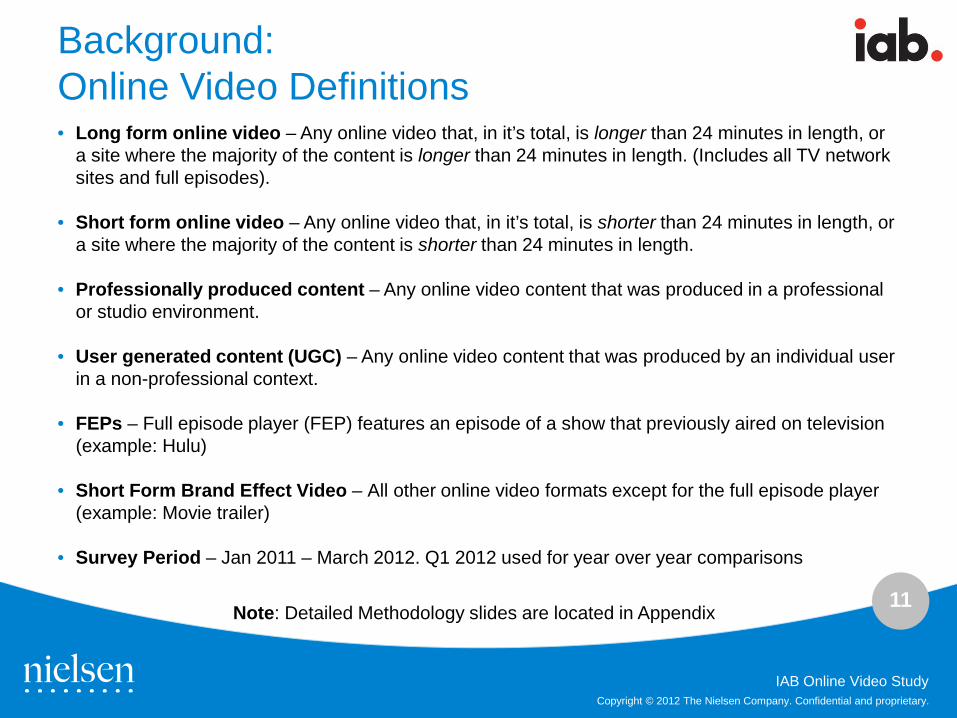
Background: Online Video Definitions • Long form online video – Any online video that, in it’s total, is longer than 24 minutes in length, or
a site where the majority of the content is longer than 24 minutes in length. (Includes all TV network sites and full episodes).
• Short form online video – Any online video that, in it’s total, is shorter than 24 minutes in length, or a site where the majority of the content is shorter than 24 minutes in length.
• Professionally produced content – Any online video content that was produced in a professional or studio environment.
• User generated content (UGC) – Any online video content that was produced by an individual user in a non-professional context.
• FEPs – Full episode player (FEP) features an episode of a show that previously aired on television (example: Hulu)
• Short Form Brand Effect Video – All other online video formats except for the full episode player (example: Movie trailer)
• Survey Period – Jan 2011 – March 2012. Q1 2012 used for year over year comparisons
Note: Detailed Methodology slides are located in Appendix
12
Copyright © 2012 The Nielsen Company. Confidential and proprietary.
IAB Online Video Study Copyright © 2012 The Nielsen Company. Confidential and proprietary.
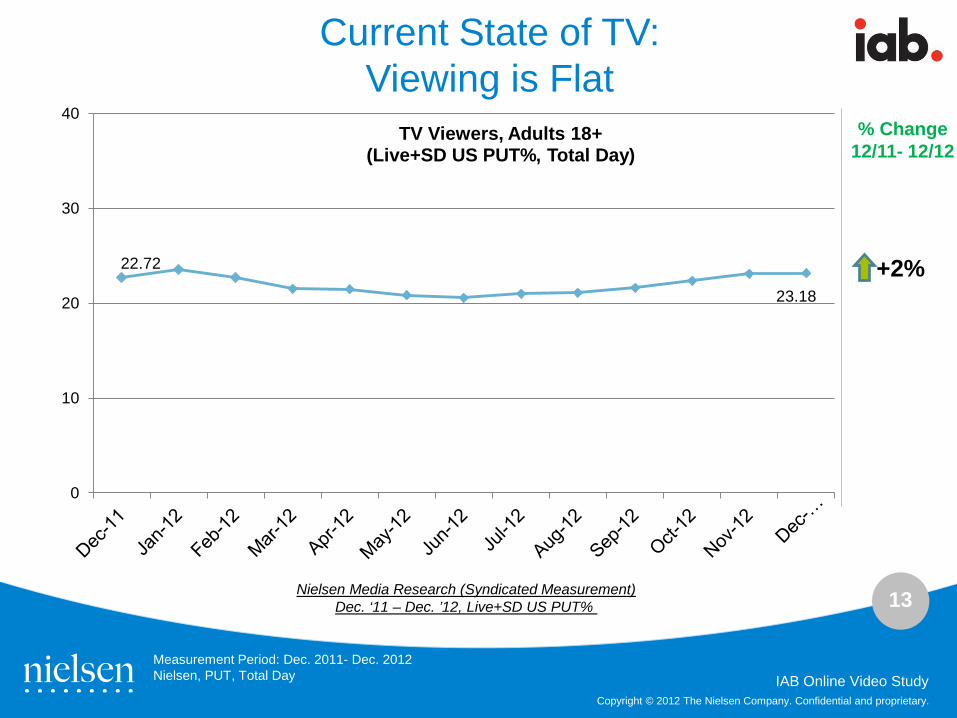
Online Video Usage Landscape: Digital Video is Growing
13
Copyright © 2012 The Nielsen Company. Confidential and proprietary.
IAB Online Video Study
22.72
23.18
0
10
20
30
40TV Viewers, Adults 18+
(Live+SD US PUT%, Total Day)
Current State of TV: Viewing is Flat
% Change 12/11- 12/12
+2%
Measurement Period: Dec. 2011- Dec. 2012 Nielsen, PUT, Total Day
Nielsen Media Research (Syndicated Measurement) Dec. ‘11 – Dec. ’12, Live+SD US PUT%
14
Copyright © 2012 The Nielsen Company. Confidential and proprietary.
IAB Online Video Study
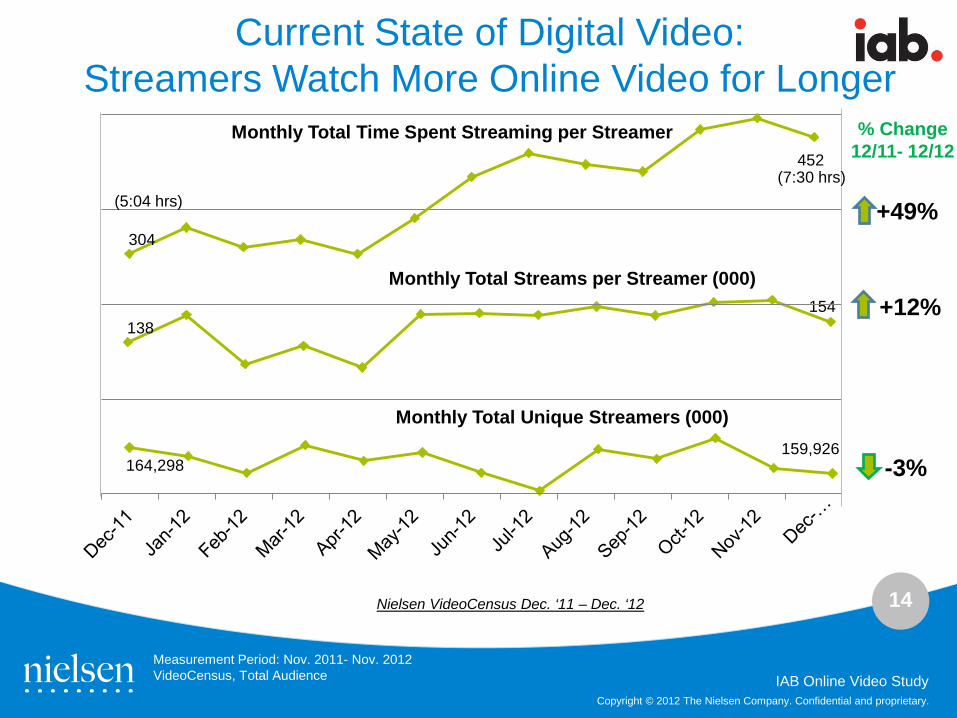
138 154
Monthly Total Streams per Streamer (000)
164,298 159,926
Monthly Total Unique Streamers (000)
304
452
Monthly Total Time Spent Streaming per Streamer
Current State of Digital Video: Streamers Watch More Online Video for Longer
% Change 12/11- 12/12
+49%
Measurement Period: Nov. 2011- Nov. 2012 VideoCensus, Total Audience
Nielsen VideoCensus Dec. ‘11 – Dec. ‘12
+12%
-3%
(7:30 hrs) (5:04 hrs)
15
Copyright © 2012 The Nielsen Company. Confidential and proprietary.
IAB Online Video Study
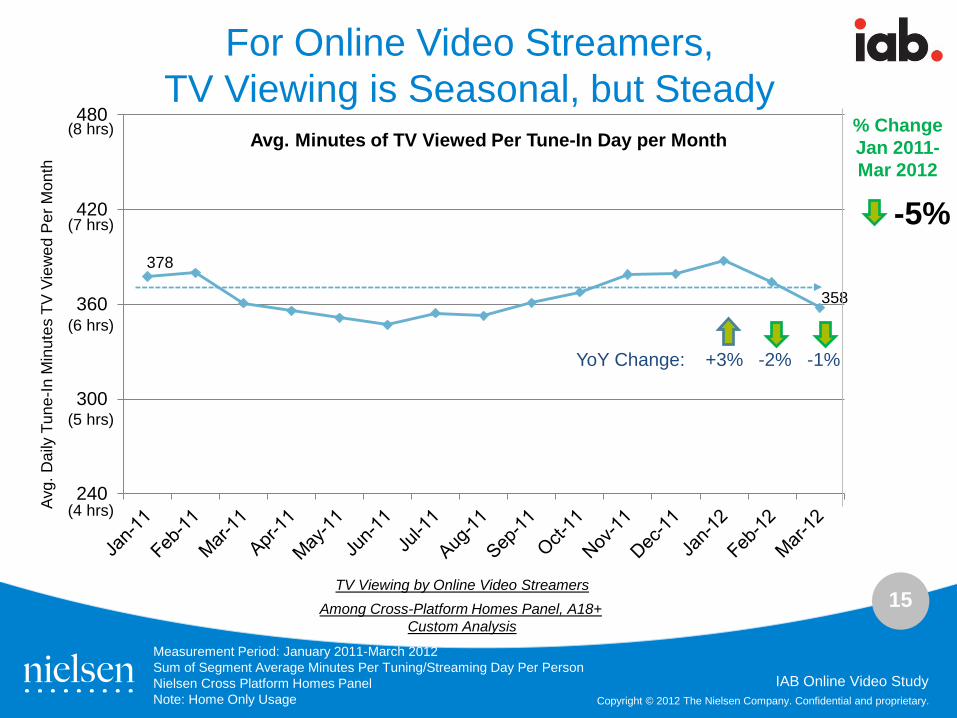
378
358
240
300
360
420
480Avg. Minutes of TV Viewed Per Tune-In Day per Month
For Online Video Streamers, TV Viewing is Seasonal, but Steady
% Change Jan 2011-Mar 2012
Avg.
Dai
ly T
une-
In M
inut
es T
V V
iew
ed P
er M
onth
Measurement Period: January 2011-March 2012 Sum of Segment Average Minutes Per Tuning/Streaming Day Per Person Nielsen Cross Platform Homes Panel Note: Home Only Usage
Among Cross-Platform Homes Panel, A18+ Custom Analysis
(8 hrs) (7 hrs) (6 hrs)
(5 hrs) (4 hrs)
TV Viewing by Online Video Streamers
YoY Change: +3% -2% -1%
-5%
16
Copyright © 2012 The Nielsen Company. Confidential and proprietary.
IAB Online Video Study
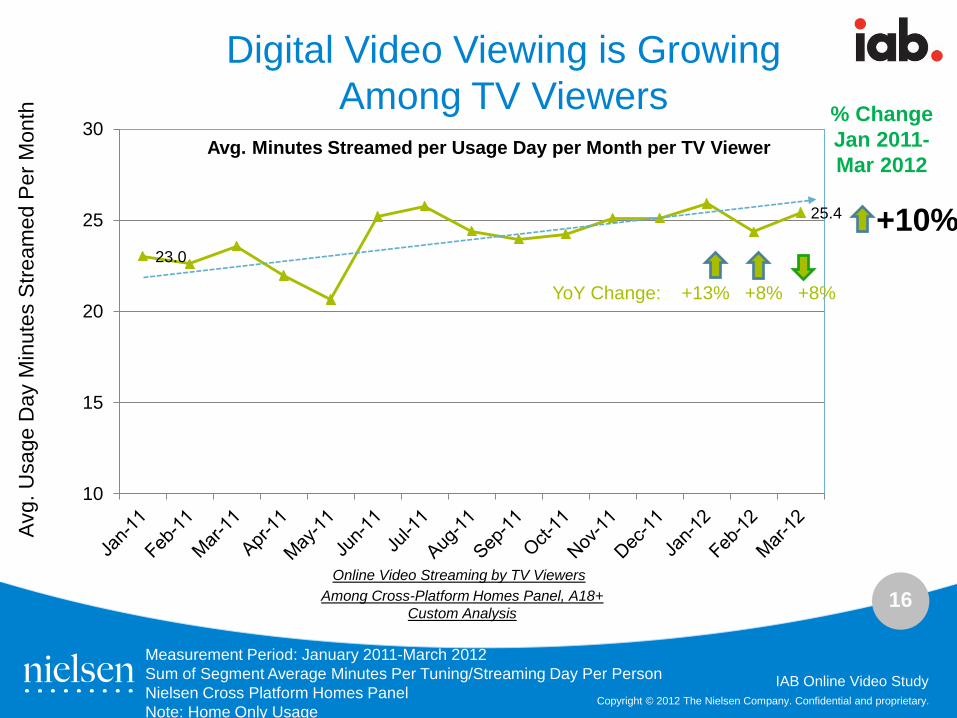
23.0
25.4
10
15
20
25
30Avg. Minutes Streamed per Usage Day per Month per TV Viewer
Digital Video Viewing is Growing Among TV Viewers % Change
Jan 2011-Mar 2012
Avg.
Usa
ge D
ay M
inut
es S
tream
ed P
er M
onth
Measurement Period: January 2011-March 2012 Sum of Segment Average Minutes Per Tuning/Streaming Day Per Person Nielsen Cross Platform Homes Panel Note: Home Only Usage
Among Cross-Platform Homes Panel, A18+ Custom Analysis
Online Video Streaming by TV Viewers
YoY Change: +13% +8% +8%
+10%
17
Copyright © 2012 The Nielsen Company. Confidential and proprietary.
IAB Online Video Study
Lightest TV Viewers are Watching Even More Online Video
143
186
299
425
0
60
120
180
240
300
360
420
480
Heaviest TV Viewers Lightest TV Viewers
Min
utes
Stre
amed
Per
Mon
th
Measurement Period: March 2011-March 2012 Segment Average Minutes Per Tuning/Streaming Day Per Person Nielsen Cross Platform Homes Panel Note: Home Only Usage
+42% Growth
3/11 -3/12
+30%
Growth 3/11 -3/12
Min.
Min.
Min.
Min.
• Lightest TV Viewers Stream TWICE as Much as Heavy TV Viewers
(Top 20% of Viewers) (Bottom 20% of Viewers)
Avg. Monthly Time Spent Streaming Video per TV Viewer 8 hrs
7 hrs
6 hrs
5 hrs 4 hrs 3 hrs 2 hrs
1 hr
18
Copyright © 2012 The Nielsen Company. Confidential and proprietary.
IAB Online Video Study
34.3 35.6
10
20
30
40
50Avg. Minutes Streamed per Usage Day per Month per TV Viewer
Digital Video Viewing is Also Growing Among TV Viewers 18-34
% Change Jan 2011-Mar 2012
Avg.
Min
utes
Stre
amed
per
Usa
ge D
ay p
er M
onth
per
TV
Vie
wer
Measurement Period: January 2011-March 2012 Sum of Segment Average Minutes Per Tuning/Streaming Day Per Person Nielsen Cross Platform Homes Panel Note: Home Only Usage
Among Cross-Platform Homes Panel, A18-34 TV Viewing by Online Video Streamers
YoY Change: +11% -3% +5%
+4%
19
Copyright © 2012 The Nielsen Company. Confidential and proprietary.
IAB Online Video Study
248 260
187
225
0
50
100
150
200
250
300
Men 18+Women 18+
Men Stream More Minutes per Month But Women are Catching Up… % Change
Jan 2011-Mar 2012
+5%
+22%
05:00 04:10 03:20 02:30 01:40 00:50
Hou
rs a
nd M
inut
es S
tream
ed P
er M
onth
HH
:MM
Measurement Period: January 2011-March 2012 Sum of Segment Average Minutes Per Tuning/Streaming Day Per Person Nielsen Cross Platform Homes Panel Note: Home Only Usage
55% 45%
Avg. Monthly Minutes Streamed per Person
M18+ F18+
M18+ Avg. Monthly Min. Streamed per Person: 243 F18+ Avg. Monthly Min. Streamed per Person: 202
20
Copyright © 2012 The Nielsen Company. Confidential and proprietary.
IAB Online Video Study Copyright © 2012 The Nielsen Company. Confidential and proprietary.
Digital Share-Shift: Incremental Reach with Digital
21
Copyright © 2012 The Nielsen Company. Confidential and proprietary.
IAB Online Video Study
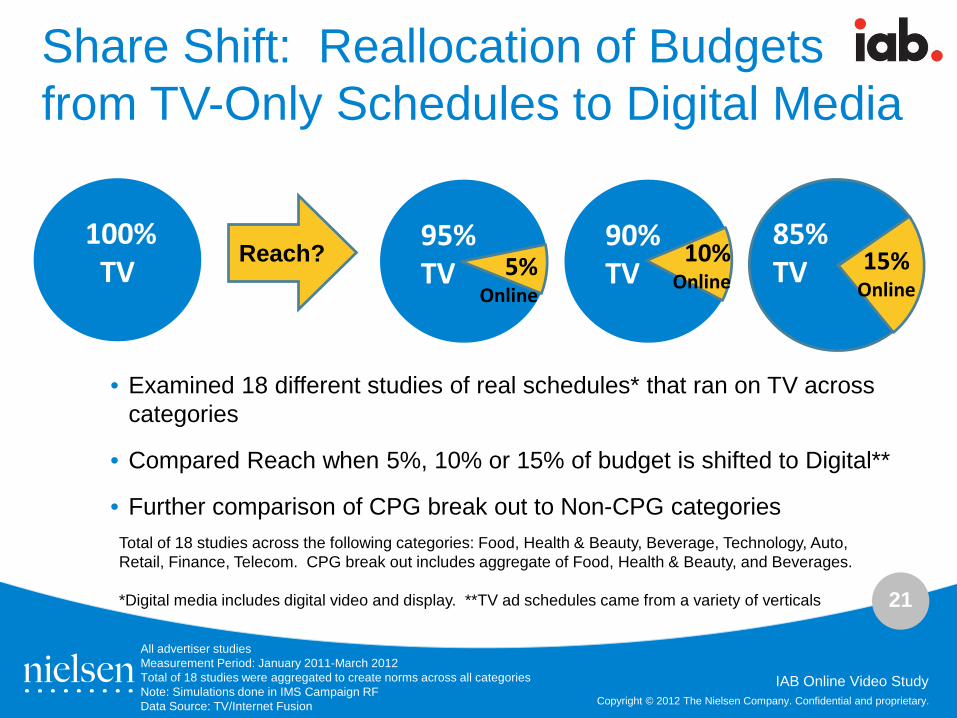
Share Shift: Reallocation of Budgets from TV-Only Schedules to Digital Media
• Examined 18 different studies of real schedules* that ran on TV across categories
• Compared Reach when 5%, 10% or 15% of budget is shifted to Digital**
• Further comparison of CPG break out to Non-CPG categories
100% TV
Reach? 95% TV
90% TV
85% TV 5%
Online
10% Online
15% Online
Total of 18 studies across the following categories: Food, Health & Beauty, Beverage, Technology, Auto, Retail, Finance, Telecom. CPG break out includes aggregate of Food, Health & Beauty, and Beverages. *Digital media includes digital video and display. **TV ad schedules came from a variety of verticals
All advertiser studies Measurement Period: January 2011-March 2012 Total of 18 studies were aggregated to create norms across all categories Note: Simulations done in IMS Campaign RF Data Source: TV/Internet Fusion
22
Copyright © 2012 The Nielsen Company. Confidential and proprietary.
IAB Online Video Study
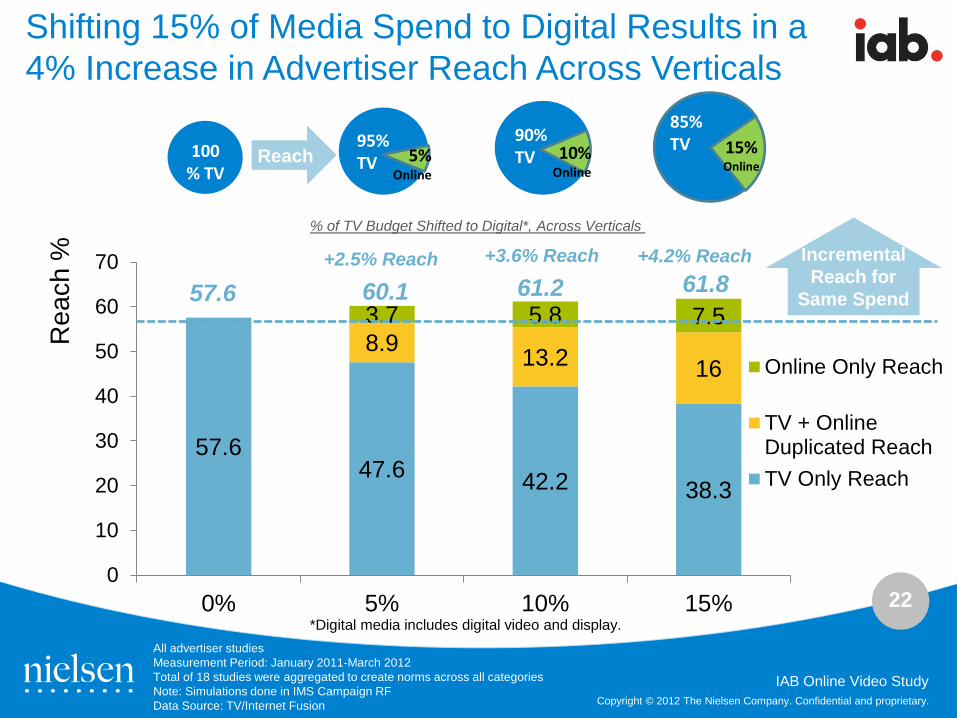
57.6 47.6 42.2 38.3
8.9 13.2 16
3.7 5.8 7.5
0
10
20
30
40
50
60
70
0% 5% 10% 15%
Online Only Reach
TV + OnlineDuplicated ReachTV Only Reach
Rea
ch %
All advertiser studies Measurement Period: January 2011-March 2012 Total of 18 studies were aggregated to create norms across all categories Note: Simulations done in IMS Campaign RF Data Source: TV/Internet Fusion
Shifting 15% of Media Spend to Digital Results in a 4% Increase in Advertiser Reach Across Verticals
Incremental Reach for
Same Spend
100% TV
Reach 95% TV
90% TV 5%
Online 10%
Online
15% Online
57.6 60.1 61.2 61.8 +2.5% Reach +3.6% Reach +4.2% Reach
85% TV
% of TV Budget Shifted to Digital*, Across Verticals
*Digital media includes digital video and display.
23
Copyright © 2012 The Nielsen Company. Confidential and proprietary.
IAB Online Video Study
CPG Advertisers Were Able to Reach 17% of Their Audience on Both Platforms by Shifting 15% of Spend to Digital
61.2 51 45.2 41
9.2 13.9 17
3.1 5 6.6
0
10
20
30
40
50
60
70
0% 5% 10% 15%
Online OnlyReach
TV + OnlineDuplicated Reach
TV Only Reach
Rea
ch %
61.2 63.2 64.1 64.6
CPG Advertiser studies only Measurement Period: January 2011-March 2012 Total of 18 studies were aggregated to create norms across all categories Note: Simulations done in IMS Campaign RF Data Source: TV/Internet Fusion
CPG Advertisers Only Incremental Reach for
Same Spend
+2% Reach +2.9% Reach +3.4% Reach
% of TV Budget Shifted to Online, CPG Advertisers
*Online includes digital video and display ads.
24
Copyright © 2012 The Nielsen Company. Confidential and proprietary.
IAB Online Video Study
Non-CPG Advertisers Can Increase Their Reach 6% By Shifting 15% Of Media Spend to Digital Properties
48.5 39.1 34.6 31.4
8.2 11.4 13.3
5.2 7.9 10
0
10
20
30
40
50
60
0% 5% 10% 15%
Online OnlyReach
TV + OnlineDuplicated Reach
TV Only Reach
Rea
ch %
48.5 52.5 53.9 54.7
Non- CPG Advertisers Only
Non-CPG Advertiser studies only Measurement Period: January 2011-March 2012 Total of 18 studies were aggregated to create norms across all categories Note: Simulations done in IMS Campaign RF Data Source: TV/Internet Fusion
Incremental Reach for
Same Spend
+4% Reach +5.4% Reach +6.2% Reach
% of TV Budget Shifted to Online, Non-CPG Ads *Online includes digital video and display ads.
25
Copyright © 2012 The Nielsen Company. Confidential and proprietary.
IAB Online Video Study
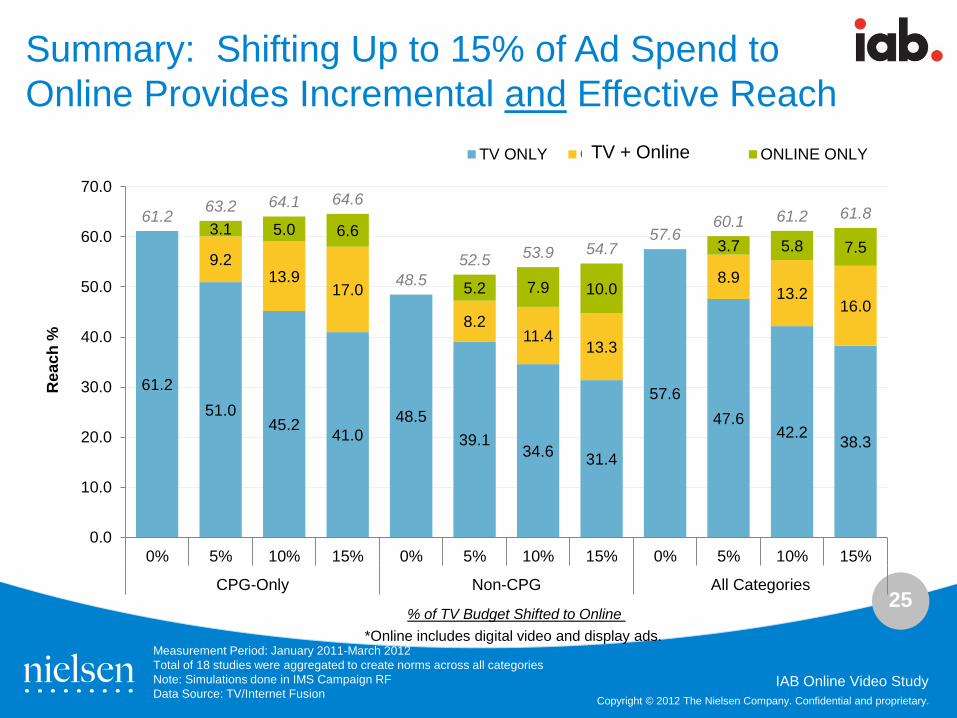
61.2 51.0
45.2 41.0 48.5
39.1 34.6 31.4
57.6 47.6
42.2 38.3
9.2 13.9
17.0
8.2 11.4
13.3
8.9 13.2
16.0
3.1 5.0 6.6
5.2 7.9 10.0
3.7 5.8 7.5
61.2 63.2 64.1 64.6
48.5 52.5 53.9 54.7
57.6 60.1 61.2 61.8
0.0
10.0
20.0
30.0
40.0
50.0
60.0
70.0
0% 5% 10% 15% 0% 5% 10% 15% 0% 5% 10% 15%
CPG-Only Non-CPG All Categories
Rea
ch %
TV ONLY CROSS PLATFORM ONLINE ONLY
Summary: Shifting Up to 15% of Ad Spend to Online Provides Incremental and Effective Reach
Measurement Period: January 2011-March 2012 Total of 18 studies were aggregated to create norms across all categories Note: Simulations done in IMS Campaign RF Data Source: TV/Internet Fusion
% of TV Budget Shifted to Online
TV + Online
*Online includes digital video and display ads.
26
Copyright © 2012 The Nielsen Company. Confidential and proprietary.
IAB Online Video Study
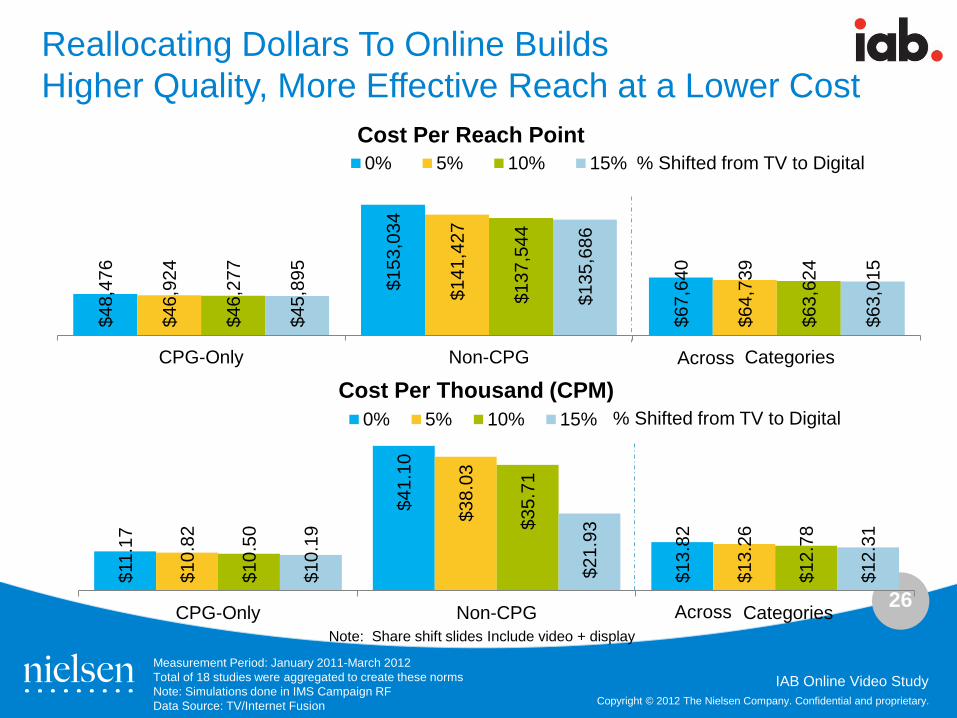
$11.
17
$41.
10
$13.
82
$10.
82 $3
8.03
$13.
26
$10.
50 $3
5.71
$12.
78
$10.
19
$21.
93
$12.
31
CPG-Only Non-CPG All Categories
Cost Per Thousand (CPM) 0% 5% 10% 15%
Reallocating Dollars To Online Builds Higher Quality, More Effective Reach at a Lower Cost
$48,
476
$153
,034
$67,
640
$46,
924
$141
,427
$64,
739
$46,
277
$137
,544
$63,
624
$45,
895
$135
,686
$63,
015
CPG-Only Non-CPG All Categories
Cost Per Reach Point 0% 5% 10% 15%
Measurement Period: January 2011-March 2012 Total of 18 studies were aggregated to create these norms Note: Simulations done in IMS Campaign RF Data Source: TV/Internet Fusion
% Shifted from TV to Digital
% Shifted from TV to Digital
Note: Share shift slides Include video + display
Across
Across
27
Copyright © 2012 The Nielsen Company. Confidential and proprietary.
IAB Online Video Study Copyright © 2012 The Nielsen Company. Confidential and proprietary.
Video Brand Effect and the Digital Multiplier: Driving Effectiveness With Duplication
28
Copyright © 2012 The Nielsen Company. Confidential and proprietary.
IAB Online Video Study
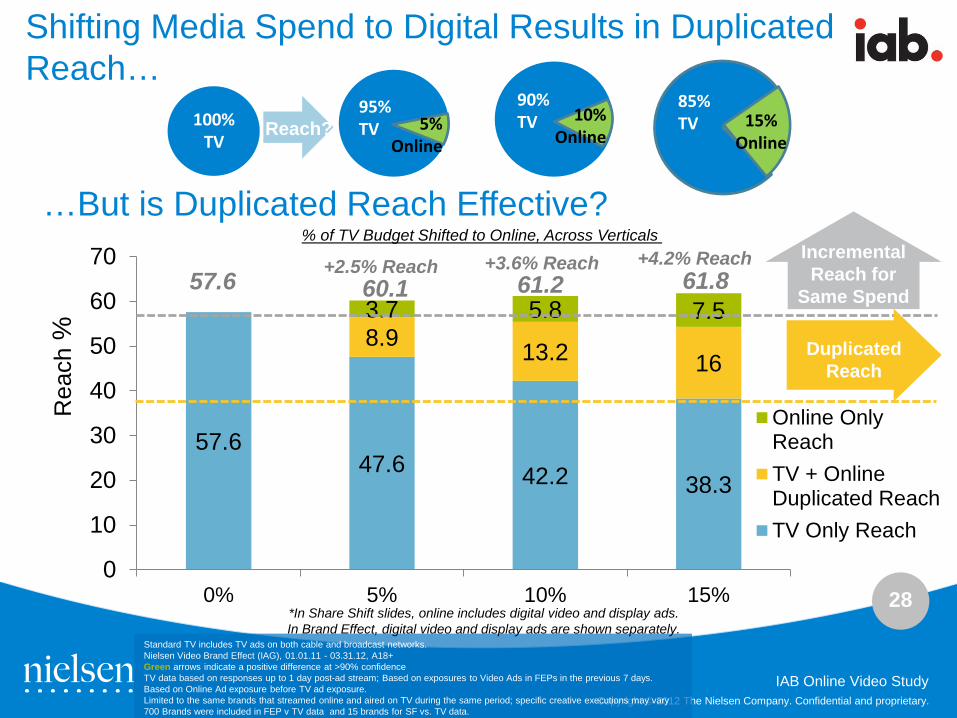
57.6 47.6 42.2 38.3
8.9 13.2 16
3.7 5.8 7.5
0
10
20
30
40
50
60
70
0% 5% 10% 15%
Online OnlyReachTV + OnlineDuplicated ReachTV Only Reach
Rea
ch %
Shifting Media Spend to Digital Results in Duplicated Reach…
Incremental Reach for
Same Spend
100% TV
Reach? 95% TV
90% TV 5%
Online
10% Online
15% Online
57.6 60.1 61.2 61.8 +2.5% Reach +3.6% Reach +4.2% Reach
85% TV
% of TV Budget Shifted to Online, Across Verticals
Duplicated Reach
…But is Duplicated Reach Effective?
Standard TV includes TV ads on both cable and broadcast networks. Nielsen Video Brand Effect (IAG), 01.01.11 - 03.31.12, A18+ Green arrows indicate a positive difference at >90% confidence TV data based on responses up to 1 day post-ad stream; Based on exposures to Video Ads in FEPs in the previous 7 days. Based on Online Ad exposure before TV ad exposure. Limited to the same brands that streamed online and aired on TV during the same period; specific creative executions may vary 700 Brands were included in FEP v TV data and 15 brands for SF vs. TV data.
*In Share Shift slides, online includes digital video and display ads. In Brand Effect, digital video and display ads are shown separately.
29
Copyright © 2012 The Nielsen Company. Confidential and proprietary.
IAB Online Video Study
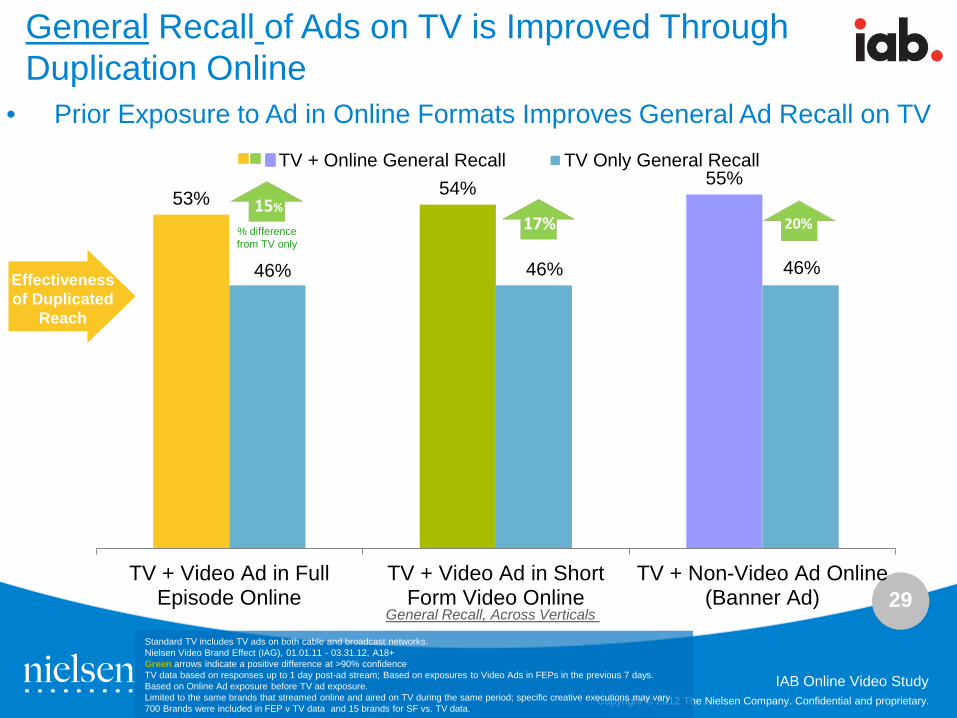
53% 54% 55%
46% 46% 46%
TV + Video Ad in FullEpisode Online
TV + Video Ad in ShortForm Video Online
TV + Non-Video Ad Online(Banner Ad)
TV + Online General Recall TV Only General Recall
General Recall of Ads on TV is Improved Through Duplication Online
General Recall, Across Verticals
• Prior Exposure to Ad in Online Formats Improves General Ad Recall on TV
20% 17% 15%
Effectiveness of Duplicated
Reach
% difference from TV only
Standard TV includes TV ads on both cable and broadcast networks. Nielsen Video Brand Effect (IAG), 01.01.11 - 03.31.12, A18+ Green arrows indicate a positive difference at >90% confidence TV data based on responses up to 1 day post-ad stream; Based on exposures to Video Ads in FEPs in the previous 7 days. Based on Online Ad exposure before TV ad exposure. Limited to the same brands that streamed online and aired on TV during the same period; specific creative executions may vary 700 Brands were included in FEP v TV data and 15 brands for SF vs. TV data.
30
Copyright © 2012 The Nielsen Company. Confidential and proprietary.
IAB Online Video Study
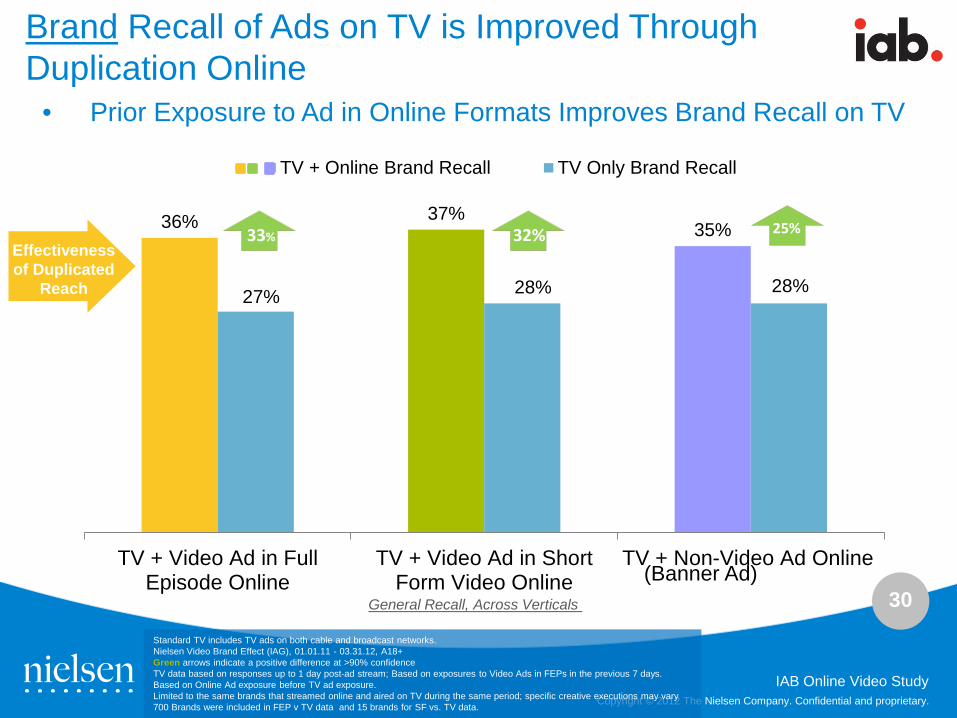
36% 37% 35%
27% 28% 28%
TV + Video Ad in FullEpisode Online
TV + Video Ad in ShortForm Video Online
TV + Non-Video Ad Online
TV + Online Brand Recall TV Only Brand Recall
Brand Recall of Ads on TV is Improved Through Duplication Online
• Prior Exposure to Ad in Online Formats Improves Brand Recall on TV
25%
(Banner Ad)
32% 33%
General Recall, Across Verticals
Effectiveness of Duplicated
Reach
Standard TV includes TV ads on both cable and broadcast networks. Nielsen Video Brand Effect (IAG), 01.01.11 - 03.31.12, A18+ Green arrows indicate a positive difference at >90% confidence TV data based on responses up to 1 day post-ad stream; Based on exposures to Video Ads in FEPs in the previous 7 days. Based on Online Ad exposure before TV ad exposure. Limited to the same brands that streamed online and aired on TV during the same period; specific creative executions may vary 700 Brands were included in FEP v TV data and 15 brands for SF vs. TV data.
31
Copyright © 2012 The Nielsen Company. Confidential and proprietary.
IAB Online Video Study
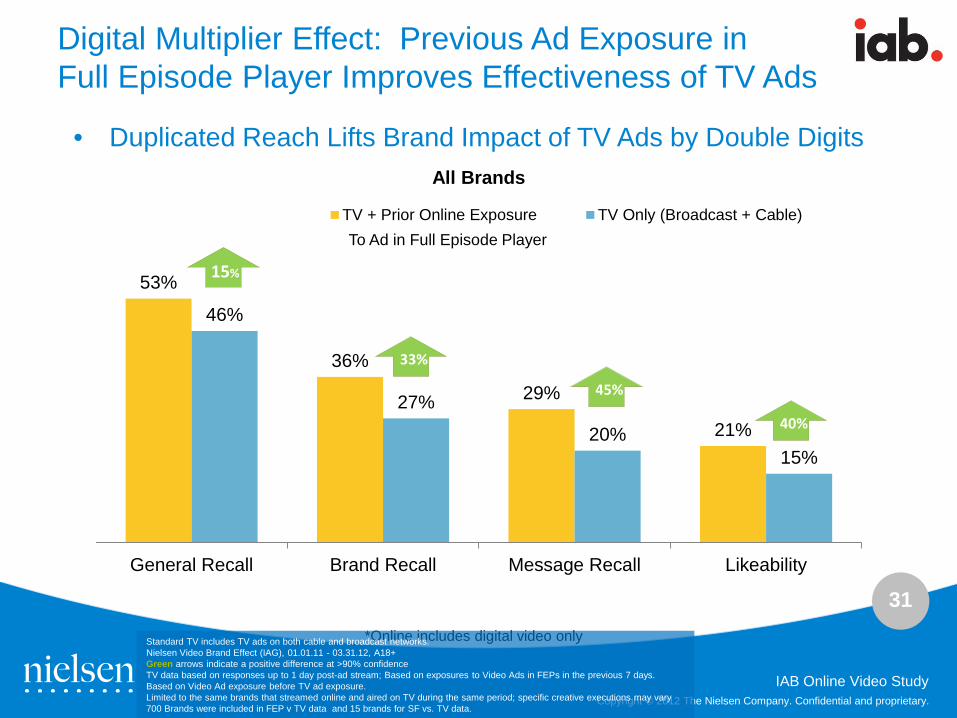
Digital Multiplier Effect: Previous Ad Exposure in Full Episode Player Improves Effectiveness of TV Ads
53%
36%
29%
21%
46%
27%
20% 15%
General Recall Brand Recall Message Recall Likeability
All Brands
TV + Prior Online Exposure TV Only (Broadcast + Cable)
33%
45%
40%
15%
To Ad in Full Episode Player
• Duplicated Reach Lifts Brand Impact of TV Ads by Double Digits
*Online includes digital video only Standard TV includes TV ads on both cable and broadcast networks. Nielsen Video Brand Effect (IAG), 01.01.11 - 03.31.12, A18+ Green arrows indicate a positive difference at >90% confidence TV data based on responses up to 1 day post-ad stream; Based on exposures to Video Ads in FEPs in the previous 7 days. Based on Video Ad exposure before TV ad exposure. Limited to the same brands that streamed online and aired on TV during the same period; specific creative executions may vary 700 Brands were included in FEP v TV data and 15 brands for SF vs. TV data.
32
Copyright © 2012 The Nielsen Company. Confidential and proprietary.
IAB Online Video Study
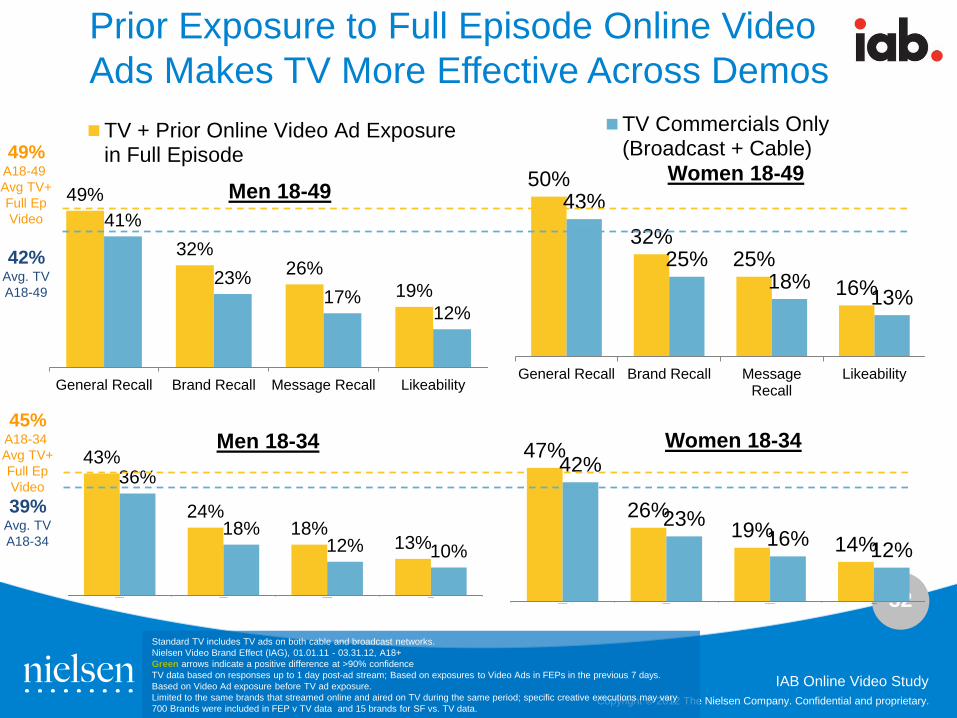
49%
32% 26%
19%
41%
23% 17%
12%
General Recall Brand Recall Message Recall Likeability
TV + Prior Online Video Ad Exposurein Full Episode
50%
32% 25%
16%
43%
25% 18%
13%
General Recall Brand Recall MessageRecall
Likeability
TV Commercials Only(Broadcast + Cable)
Prior Exposure to Full Episode Online Video Ads Makes TV More Effective Across Demos
47%
26% 19%
14%
42%
23% 16% 12%
General Recall Brand Recall Message Recall Likeability
Men 18-49 Women 18-49
Men 18-34 Women 18-34
49% A18-49 Avg TV+ Full Ep Video
42%
Avg. TV A18-49
43%
24% 18%
13%
36%
18% 12% 10%
General Recall Brand Recall Message Recall Likeability
45% A18-34 Avg TV+ Full Ep Video 39%
Avg. TV A18-34
Standard TV includes TV ads on both cable and broadcast networks. Nielsen Video Brand Effect (IAG), 01.01.11 - 03.31.12, A18+ Green arrows indicate a positive difference at >90% confidence TV data based on responses up to 1 day post-ad stream; Based on exposures to Video Ads in FEPs in the previous 7 days. Based on Video Ad exposure before TV ad exposure. Limited to the same brands that streamed online and aired on TV during the same period; specific creative executions may vary 700 Brands were included in FEP v TV data and 15 brands for SF vs. TV data.
33
Copyright © 2012 The Nielsen Company. Confidential and proprietary.
IAB Online Video Study
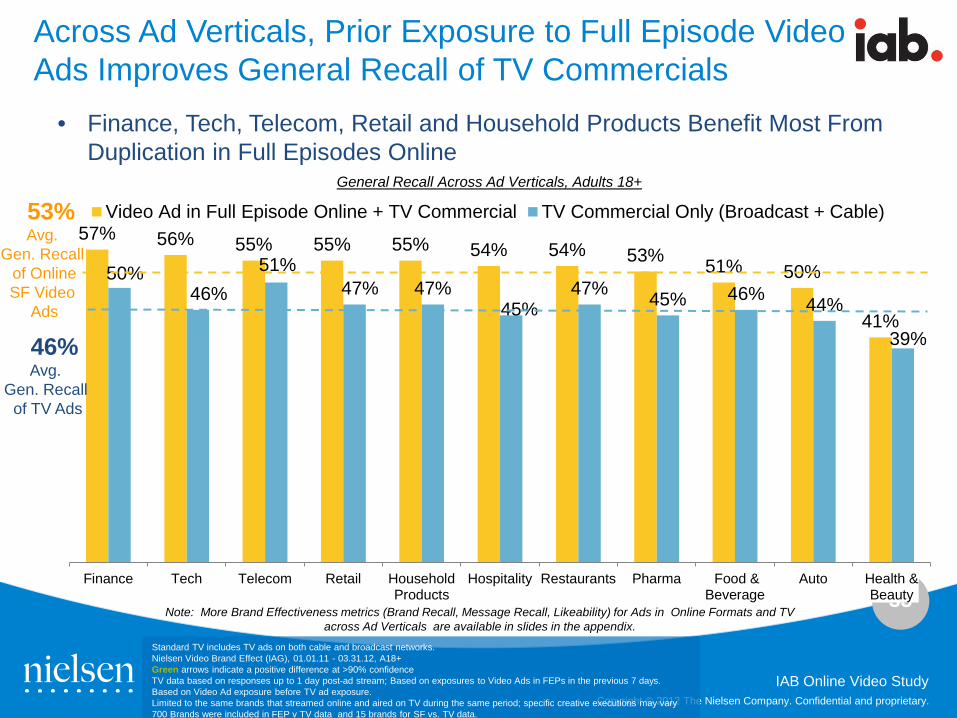
• Finance, Tech, Telecom, Retail and Household Products Benefit Most From Duplication in Full Episodes Online
Across Ad Verticals, Prior Exposure to Full Episode Video Ads Improves General Recall of TV Commercials
57% 56% 55% 55% 55% 54% 54% 53% 51% 50%
41%
50% 46%
51% 47% 47%
45% 47% 45% 46% 44%
39%
Finance Tech Telecom Retail HouseholdProducts
Hospitality Restaurants Pharma Food &Beverage
Auto Health &Beauty
Video Ad in Full Episode Online + TV Commercial TV Commercial Only (Broadcast + Cable)General Recall Across Ad Verticals, Adults 18+
53% Avg.
Gen. Recall of Online SF Video
Ads
46% Avg.
Gen. Recall of TV Ads
Note: More Brand Effectiveness metrics (Brand Recall, Message Recall, Likeability) for Ads in Online Formats and TV across Ad Verticals are available in slides in the appendix.
Standard TV includes TV ads on both cable and broadcast networks. Nielsen Video Brand Effect (IAG), 01.01.11 - 03.31.12, A18+ Green arrows indicate a positive difference at >90% confidence TV data based on responses up to 1 day post-ad stream; Based on exposures to Video Ads in FEPs in the previous 7 days. Based on Video Ad exposure before TV ad exposure. Limited to the same brands that streamed online and aired on TV during the same period; specific creative executions may vary 700 Brands were included in FEP v TV data and 15 brands for SF vs. TV data.
34
Copyright © 2012 The Nielsen Company. Confidential and proprietary.
IAB Online Video Study
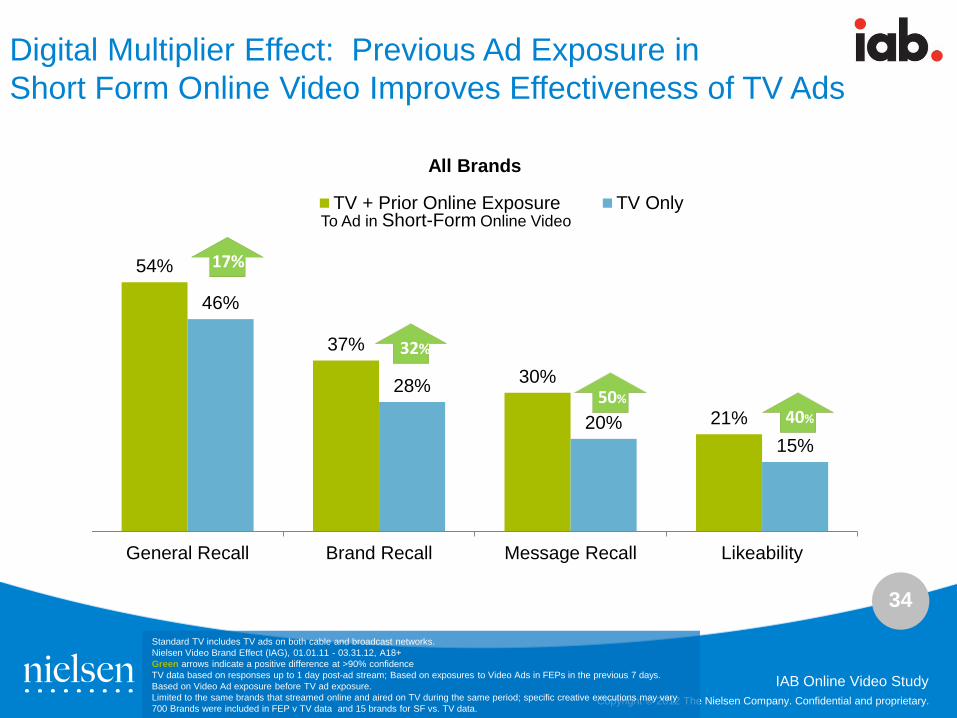
Digital Multiplier Effect: Previous Ad Exposure in Short Form Online Video Improves Effectiveness of TV Ads
54%
37%
30%
21%
46%
28%
20% 15%
General Recall Brand Recall Message Recall Likeability
All Brands
TV + Prior Online Exposure TV Only
17%
32%
50% 40%
To Ad in Short-Form Online Video
Standard TV includes TV ads on both cable and broadcast networks. Nielsen Video Brand Effect (IAG), 01.01.11 - 03.31.12, A18+ Green arrows indicate a positive difference at >90% confidence TV data based on responses up to 1 day post-ad stream; Based on exposures to Video Ads in FEPs in the previous 7 days. Based on Video Ad exposure before TV ad exposure. Limited to the same brands that streamed online and aired on TV during the same period; specific creative executions may vary 700 Brands were included in FEP v TV data and 15 brands for SF vs. TV data.
35
Copyright © 2012 The Nielsen Company. Confidential and proprietary.
IAB Online Video Study
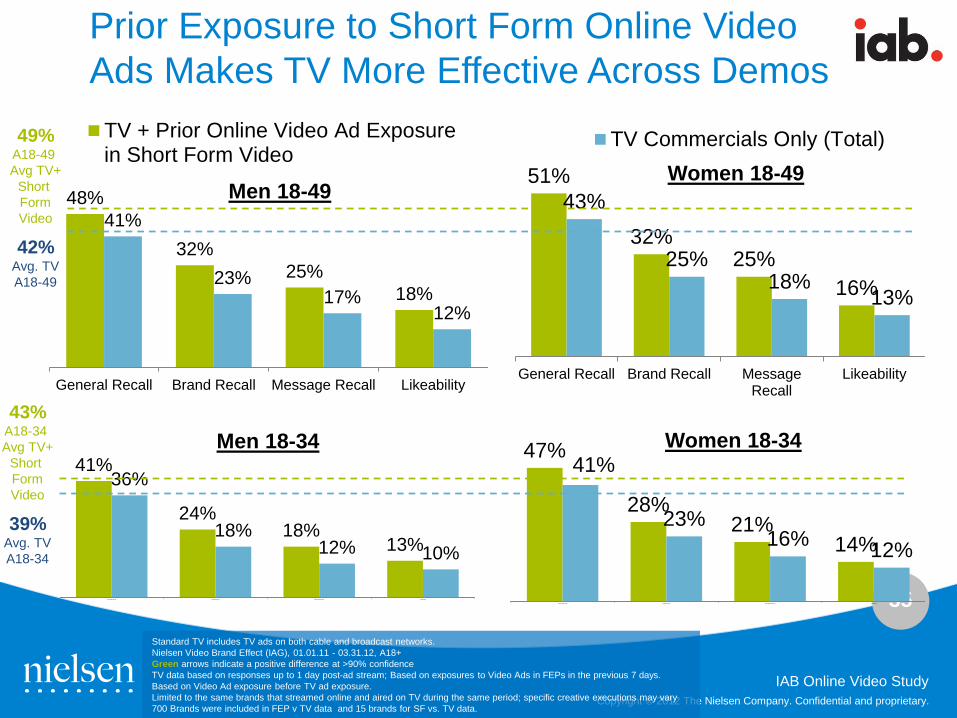
48%
32% 25%
18%
41%
23% 17%
12%
General Recall Brand Recall Message Recall Likeability
TV + Prior Online Video Ad Exposurein Short Form Video
51%
32% 25%
16%
43%
25% 18%
13%
General Recall Brand Recall MessageRecall
Likeability
TV Commercials Only (Total)
Prior Exposure to Short Form Online Video Ads Makes TV More Effective Across Demos
41%
24% 18%
13%
36%
18% 12% 10%
General Recall Brand Recall Message Recall Likeability
47%
28% 21%
14%
41%
23% 16% 12%
General Recall Brand Recall Message Recall Likeability
Men 18-49 Women 18-49
Men 18-34 Women 18-34
49% A18-49 Avg TV+
Short Form Video
42% Avg. TV A18-49
43% A18-34 Avg TV+
Short Form Video
39% Avg. TV A18-34
Standard TV includes TV ads on both cable and broadcast networks. Nielsen Video Brand Effect (IAG), 01.01.11 - 03.31.12, A18+ Green arrows indicate a positive difference at >90% confidence TV data based on responses up to 1 day post-ad stream; Based on exposures to Video Ads in FEPs in the previous 7 days. Based on Video Ad exposure before TV ad exposure. Limited to the same brands that streamed online and aired on TV during the same period; specific creative executions may vary 700 Brands were included in FEP v TV data and 15 brands for SF vs. TV data.
36
Copyright © 2012 The Nielsen Company. Confidential and proprietary.
IAB Online Video Study
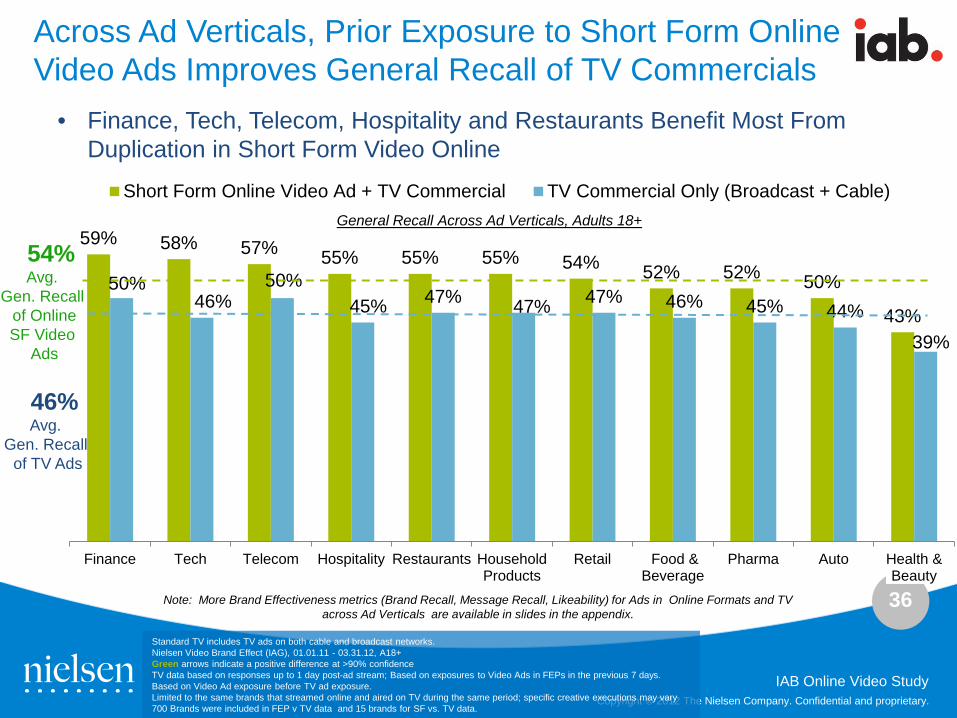
Across Ad Verticals, Prior Exposure to Short Form Online Video Ads Improves General Recall of TV Commercials
59% 58% 57% 55% 55% 55% 54% 52% 52% 50%
43%
50% 46%
50% 45% 47% 47% 47% 46% 45% 44%
39%
Finance Tech Telecom Hospitality Restaurants HouseholdProducts
Retail Food &Beverage
Pharma Auto Health &Beauty
Short Form Online Video Ad + TV Commercial TV Commercial Only (Broadcast + Cable)General Recall Across Ad Verticals, Adults 18+
54% Avg.
Gen. Recall of Online SF Video
Ads
46% Avg.
Gen. Recall of TV Ads
• Finance, Tech, Telecom, Hospitality and Restaurants Benefit Most From Duplication in Short Form Video Online
Note: More Brand Effectiveness metrics (Brand Recall, Message Recall, Likeability) for Ads in Online Formats and TV across Ad Verticals are available in slides in the appendix.
Standard TV includes TV ads on both cable and broadcast networks. Nielsen Video Brand Effect (IAG), 01.01.11 - 03.31.12, A18+ Green arrows indicate a positive difference at >90% confidence TV data based on responses up to 1 day post-ad stream; Based on exposures to Video Ads in FEPs in the previous 7 days. Based on Video Ad exposure before TV ad exposure. Limited to the same brands that streamed online and aired on TV during the same period; specific creative executions may vary 700 Brands were included in FEP v TV data and 15 brands for SF vs. TV data.
37
Copyright © 2012 The Nielsen Company. Confidential and proprietary.
IAB Online Video Study
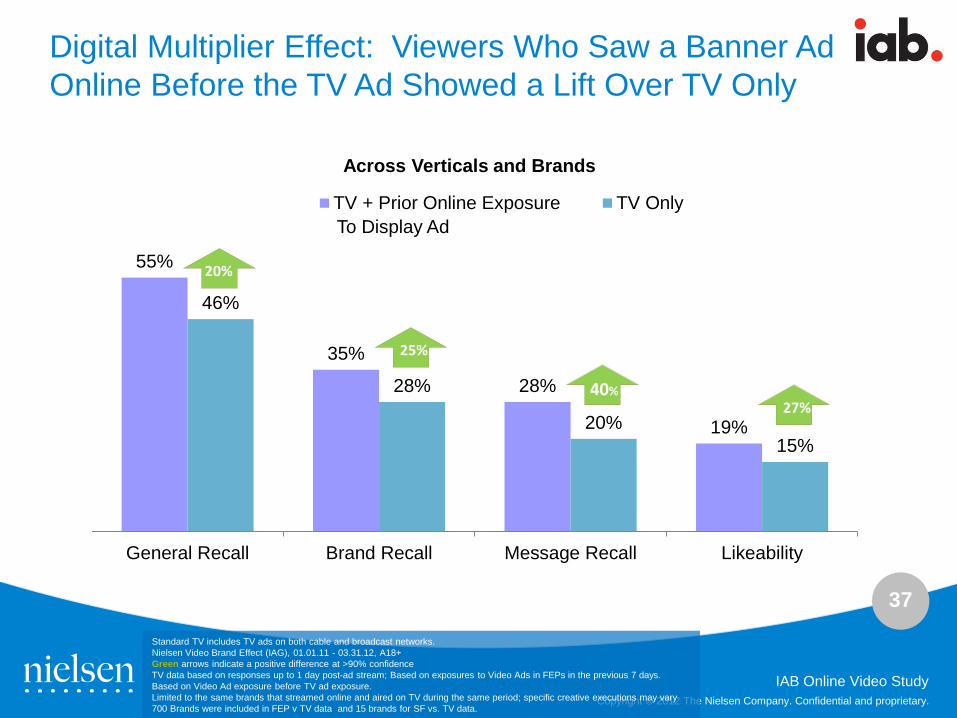
Digital Multiplier Effect: Viewers Who Saw a Banner Ad Online Before the TV Ad Showed a Lift Over TV Only
55%
35%
28%
19%
46%
28%
20% 15%
General Recall Brand Recall Message Recall Likeability
Across Verticals and Brands
TV + Prior Online Exposure TV Only
20%
25%
40% 27%
To Display Ad
Standard TV includes TV ads on both cable and broadcast networks. Nielsen Video Brand Effect (IAG), 01.01.11 - 03.31.12, A18+ Green arrows indicate a positive difference at >90% confidence TV data based on responses up to 1 day post-ad stream; Based on exposures to Video Ads in FEPs in the previous 7 days. Based on Video Ad exposure before TV ad exposure. Limited to the same brands that streamed online and aired on TV during the same period; specific creative executions may vary 700 Brands were included in FEP v TV data and 15 brands for SF vs. TV data.
38
Copyright © 2012 The Nielsen Company. Confidential and proprietary.
IAB Online Video Study
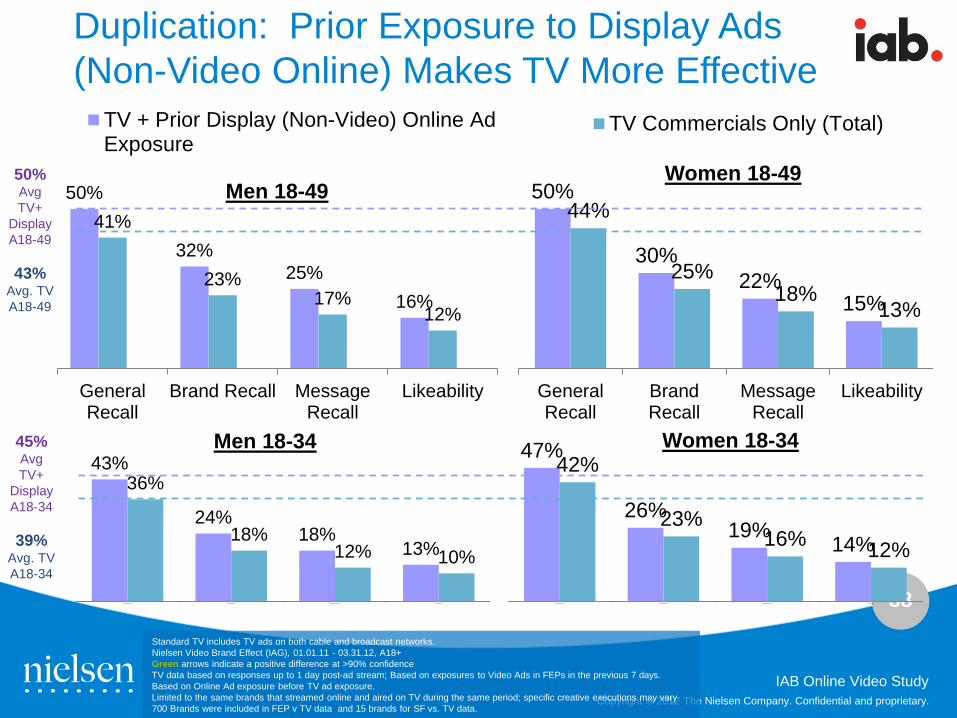
43%
24% 18%
13%
36%
18% 12% 10%
General Recall Brand Recall Message Recall Likeability
47%
26% 19%
14%
42%
23% 16% 12%
General Recall Brand Recall Message Recall Likeability
50%
32% 25%
16%
41%
23% 17%
12%
GeneralRecall
Brand Recall MessageRecall
Likeability
TV + Prior Display (Non-Video) Online AdExposure
50%
30% 22%
15%
44%
25% 18%
13%
GeneralRecall
BrandRecall
MessageRecall
Likeability
TV Commercials Only (Total)
Duplication: Prior Exposure to Display Ads (Non-Video Online) Makes TV More Effective
Men 18-49 Women 18-49
Men 18-34 Women 18-34
50% Avg TV+
Display A18-49
43%
Avg. TV A18-49
45% Avg TV+
Display A18-34
39%
Avg. TV A18-34
Standard TV includes TV ads on both cable and broadcast networks. Nielsen Video Brand Effect (IAG), 01.01.11 - 03.31.12, A18+ Green arrows indicate a positive difference at >90% confidence TV data based on responses up to 1 day post-ad stream; Based on exposures to Video Ads in FEPs in the previous 7 days. Based on Online Ad exposure before TV ad exposure. Limited to the same brands that streamed online and aired on TV during the same period; specific creative executions may vary 700 Brands were included in FEP v TV data and 15 brands for SF vs. TV data.
39
Copyright © 2012 The Nielsen Company. Confidential and proprietary.
IAB Online Video Study
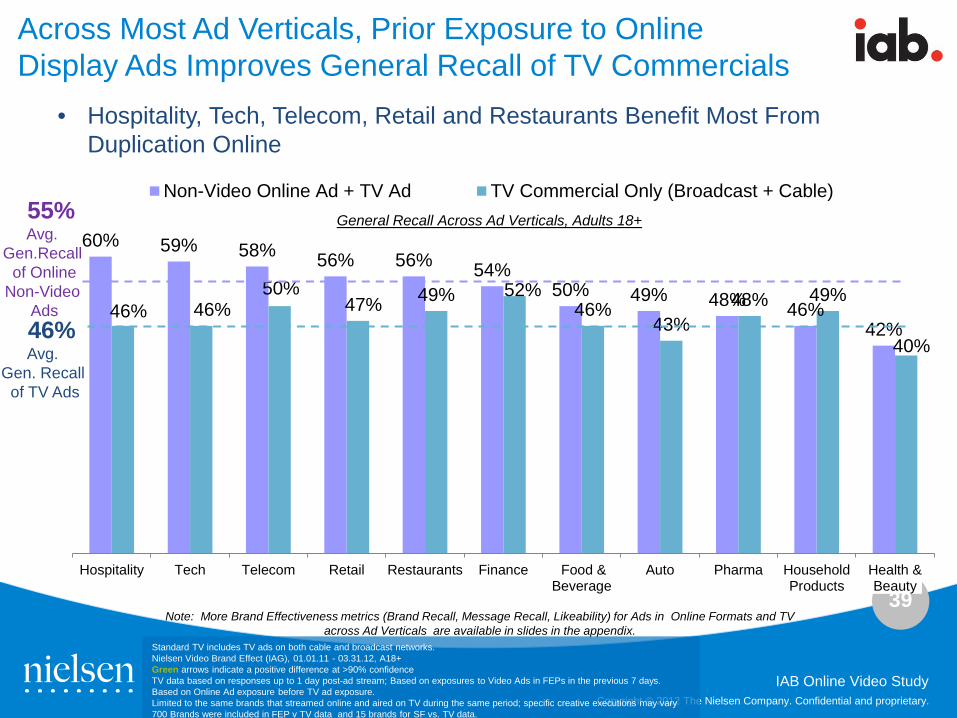
Across Most Ad Verticals, Prior Exposure to Online Display Ads Improves General Recall of TV Commercials
60% 59% 58% 56% 56% 54% 50% 49% 48% 46%
42% 46% 46%
50% 47% 49% 52%
46% 43%
48% 49%
40%
Hospitality Tech Telecom Retail Restaurants Finance Food &Beverage
Auto Pharma HouseholdProducts
Health &Beauty
Non-Video Online Ad + TV Ad TV Commercial Only (Broadcast + Cable)General Recall Across Ad Verticals, Adults 18+ 55%
Avg. Gen.Recall
of Online Non-Video
Ads 46%
Avg. Gen. Recall
of TV Ads
• Hospitality, Tech, Telecom, Retail and Restaurants Benefit Most From Duplication Online
Note: More Brand Effectiveness metrics (Brand Recall, Message Recall, Likeability) for Ads in Online Formats and TV across Ad Verticals are available in slides in the appendix.
Standard TV includes TV ads on both cable and broadcast networks. Nielsen Video Brand Effect (IAG), 01.01.11 - 03.31.12, A18+ Green arrows indicate a positive difference at >90% confidence TV data based on responses up to 1 day post-ad stream; Based on exposures to Video Ads in FEPs in the previous 7 days. Based on Online Ad exposure before TV ad exposure. Limited to the same brands that streamed online and aired on TV during the same period; specific creative executions may vary 700 Brands were included in FEP v TV data and 15 brands for SF vs. TV data.
40
Copyright © 2012 The Nielsen Company. Confidential and proprietary.
IAB Online Video Study Copyright © 2012 The Nielsen Company. Confidential and proprietary.
Video Brand Effect Digital is More Effective
41
Copyright © 2012 The Nielsen Company. Confidential and proprietary.
IAB Online Video Study
Online Video Ads Outperform TV Ads on All Measured Effectiveness Metrics
64%
50%
40%
28%
49%
32%
24%
17%
46%
27%
20% 15%
General Recall Brand Recall Message Recall Likeability
Video Ads in TV Shows Online (Full Episode Player)Video Ads in Short Form Video OnlineTV Commercials (Broadcast + Cable)
39%
86%
100%
68%
Standard TV Ads include TV ads on both broadcast and cable. Primetime, non-sports Nielsen Video Brand Effect (IAG), 01.01.11 - 03.31.12, A18+ Green arrows indicate a positive difference at >90% confidence Online & TV data based on responses up to 1 day post-ad stream Limited to the same brands that streamed online and aired on TV during the same period; specific creative executions may vary
42
Copyright © 2012 The Nielsen Company. Confidential and proprietary.
IAB Online Video Study
Like Ads in Short Form (up to 24 Min.) Online Video Outperform Their TV Counterparts
49%
32%
24%
17%
47%
28%
21% 15%
General Recall Brand Recall Message Recall Likeability
Short Form Video Standard TV (Total)
Standard TV includes TV ads on both cable and broadcast networks . Primetime, non-sports Nielsen Video Brand Effect (IAG), 01.01.11 - 03.31.12, A18+ Green arrows indicate a positive difference at >90% confidence Online & TV data based on responses up to 1 day post-ad stream Limited to the same brands that streamed online and aired on TV during the same period; specific creative executions may vary
14%
14%
13%
4%
43
Copyright © 2012 The Nielsen Company. Confidential and proprietary.
IAB Online Video Study
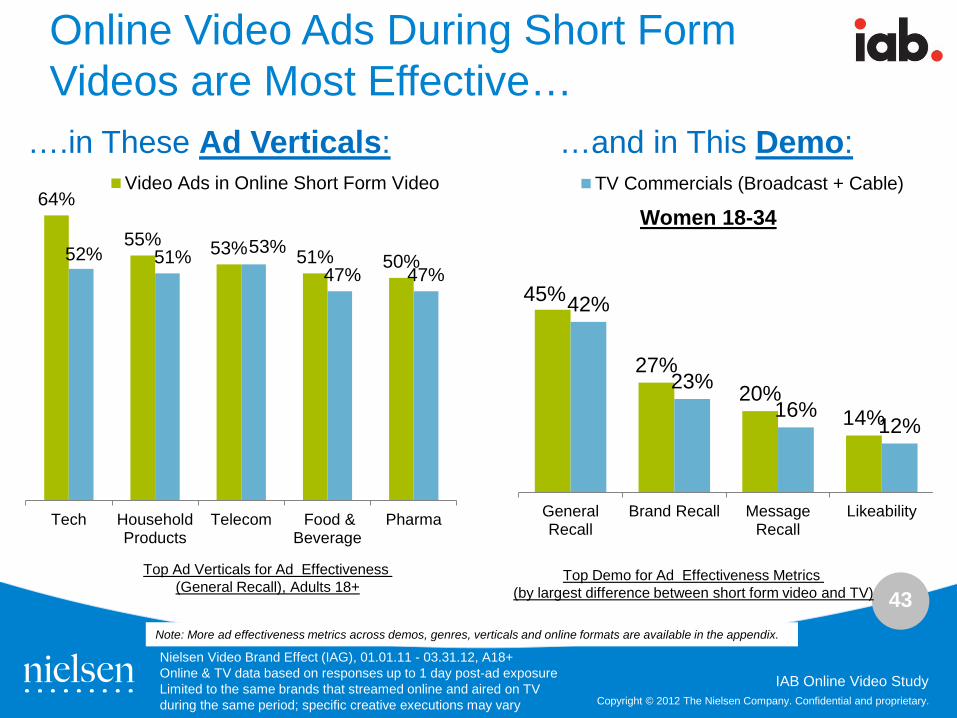
64%
55% 53% 51% 50% 52% 51% 53% 47% 47%
Tech HouseholdProducts
Telecom Food &Beverage
Pharma
Video Ads in Online Short Form Video
Online Video Ads During Short Form Videos are Most Effective…
Nielsen Video Brand Effect (IAG), 01.01.11 - 03.31.12, A18+ Online & TV data based on responses up to 1 day post-ad exposure Limited to the same brands that streamed online and aired on TV during the same period; specific creative executions may vary
Top Demo for Ad Effectiveness Metrics (by largest difference between short form video and TV)
Top Ad Verticals for Ad Effectiveness (General Recall), Adults 18+
….in These Ad Verticals: …and in This Demo:
Note: More ad effectiveness metrics across demos, genres, verticals and online formats are available in the appendix.
45%
27% 20%
14%
42%
23% 16%
12%
GeneralRecall
Brand Recall MessageRecall
Likeability
TV Commercials (Broadcast + Cable)
Women 18-34
44
Copyright © 2012 The Nielsen Company. Confidential and proprietary.
IAB Online Video Study
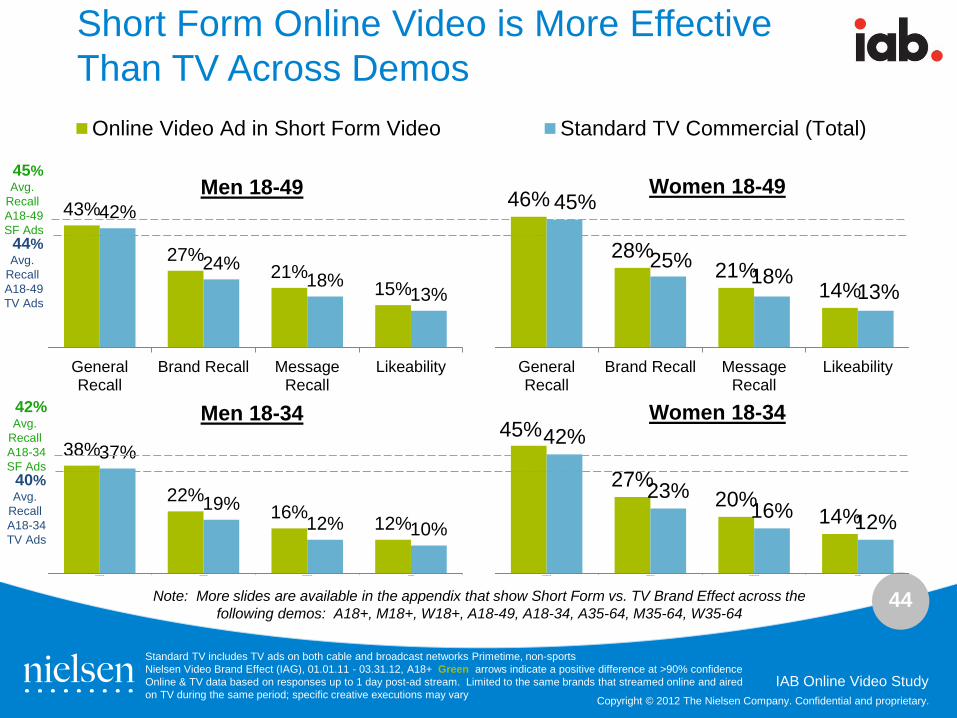
Short Form Online Video is More Effective Than TV Across Demos
Standard TV includes TV ads on both cable and broadcast networks Primetime, non-sports Nielsen Video Brand Effect (IAG), 01.01.11 - 03.31.12, A18+ Green arrows indicate a positive difference at >90% confidence Online & TV data based on responses up to 1 day post-ad stream. Limited to the same brands that streamed online and aired on TV during the same period; specific creative executions may vary
38%
22% 16% 12%
37%
19% 12% 10%
General Recall Brand Recall Message Recall Likeability
45%
27% 20%
14%
42%
23% 16% 12%
General Recall Brand Recall Message Recall Likeability
Men 18-34 Women 18-34
43%
27% 21%
15%
42%
24% 18%
13%
GeneralRecall
Brand Recall MessageRecall
Likeability
Online Video Ad in Short Form Video
46%
28% 21%
14%
45%
25% 18%
13%
GeneralRecall
Brand Recall MessageRecall
Likeability
Standard TV Commercial (Total)
Men 18-49 Women 18-49 45% Avg.
Recall A18-49 SF Ads 44% Avg.
Recall A18-49 TV Ads
Note: More slides are available in the appendix that show Short Form vs. TV Brand Effect across the following demos: A18+, M18+, W18+, A18-49, A18-34, A35-64, M35-64, W35-64
42% Avg.
Recall A18-34 SF Ads 40% Avg.
Recall A18-34 TV Ads
45
Copyright © 2012 The Nielsen Company. Confidential and proprietary.
IAB Online Video Study
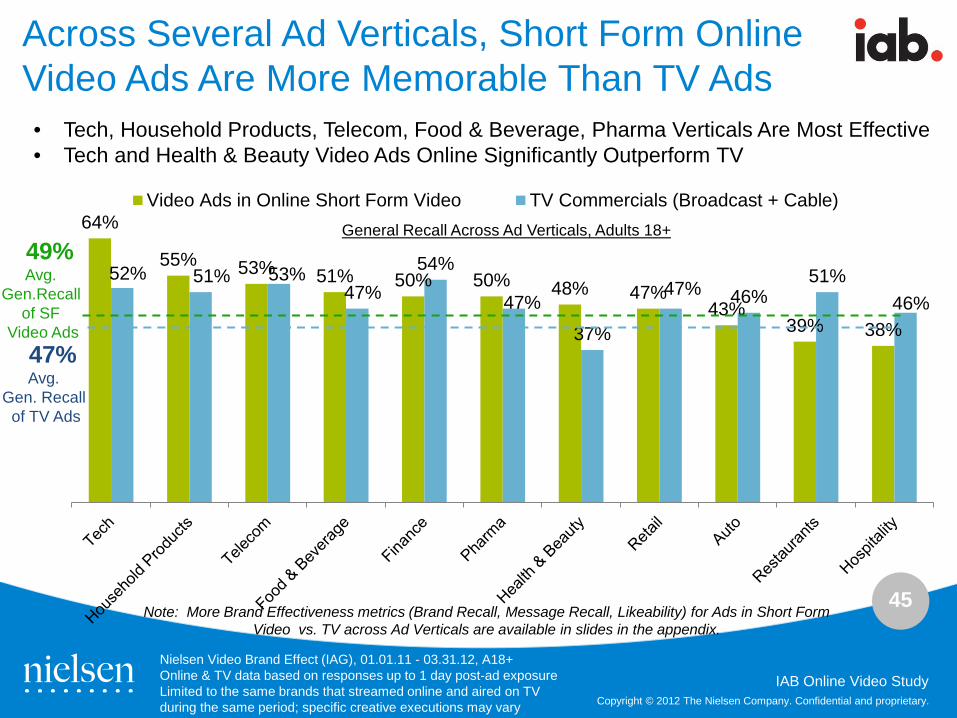
Across Several Ad Verticals, Short Form Online Video Ads Are More Memorable Than TV Ads
64%
55% 53% 51% 50% 50% 48% 47% 43%
39% 38%
52% 51% 53% 47%
54%
47%
37%
47% 46% 51%
46%
Video Ads in Online Short Form Video TV Commercials (Broadcast + Cable)
Nielsen Video Brand Effect (IAG), 01.01.11 - 03.31.12, A18+ Online & TV data based on responses up to 1 day post-ad exposure Limited to the same brands that streamed online and aired on TV during the same period; specific creative executions may vary
General Recall Across Ad Verticals, Adults 18+ 49%
Avg. Gen.Recall
of SF Video Ads 47%
Avg. Gen. Recall
of TV Ads
• Tech, Household Products, Telecom, Food & Beverage, Pharma Verticals Are Most Effective • Tech and Health & Beauty Video Ads Online Significantly Outperform TV
Note: More Brand Effectiveness metrics (Brand Recall, Message Recall, Likeability) for Ads in Short Form Video vs. TV across Ad Verticals are available in slides in the appendix.
46
Copyright © 2012 The Nielsen Company. Confidential and proprietary.
IAB Online Video Study
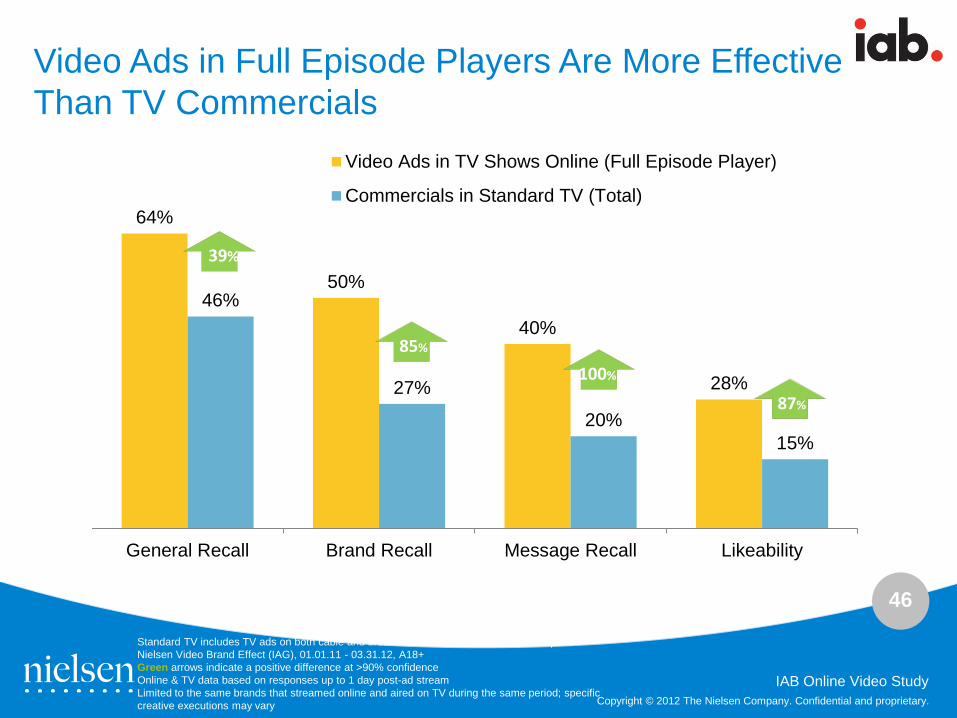
Video Ads in Full Episode Players Are More Effective Than TV Commercials
64%
50%
40%
28%
46%
27%
20% 15%
General Recall Brand Recall Message Recall Likeability
Video Ads in TV Shows Online (Full Episode Player)
Commercials in Standard TV (Total)
Standard TV includes TV ads on both cable and broadcast networks . Primetime, non-sports Nielsen Video Brand Effect (IAG), 01.01.11 - 03.31.12, A18+ Green arrows indicate a positive difference at >90% confidence Online & TV data based on responses up to 1 day post-ad stream Limited to the same brands that streamed online and aired on TV during the same period; specific creative executions may vary
85%
100%
87%
39%
47
Copyright © 2012 The Nielsen Company. Confidential and proprietary.
IAB Online Video Study
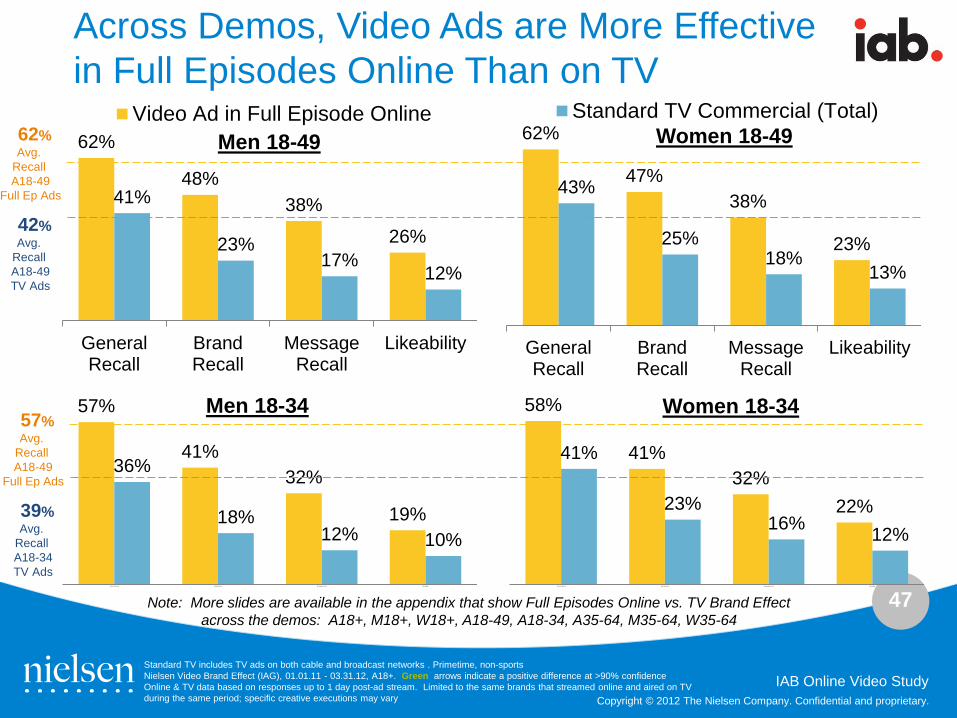
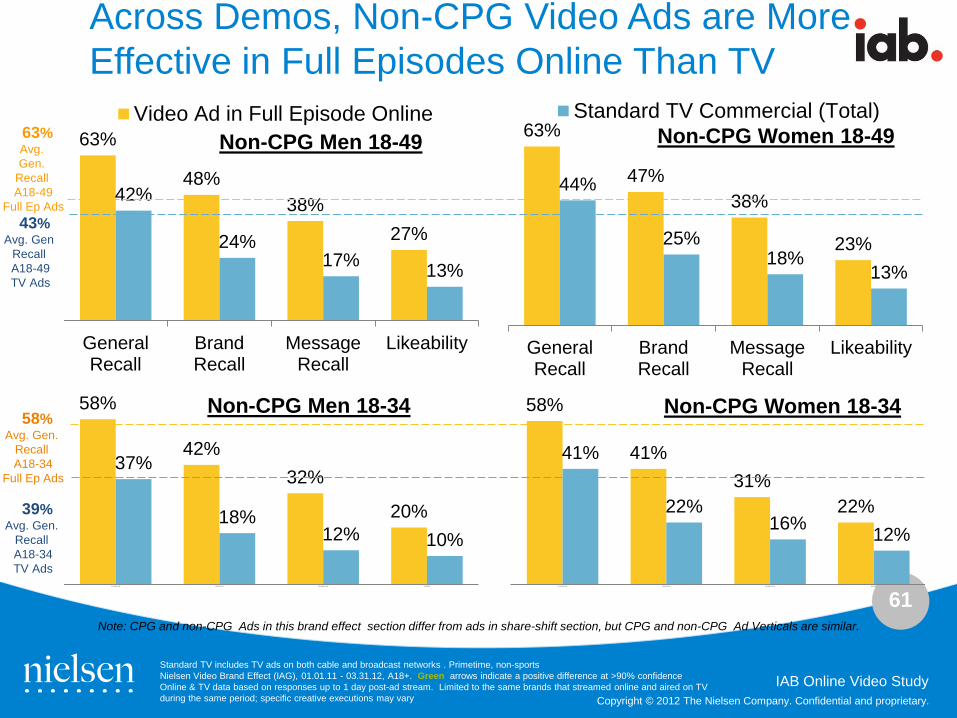
Across Demos, Video Ads are More Effective in Full Episodes Online Than on TV
Standard TV includes TV ads on both cable and broadcast networks . Primetime, non-sports Nielsen Video Brand Effect (IAG), 01.01.11 - 03.31.12, A18+. Green arrows indicate a positive difference at >90% confidence Online & TV data based on responses up to 1 day post-ad stream. Limited to the same brands that streamed online and aired on TV during the same period; specific creative executions may vary
57%
41% 32%
19%
36%
18% 12% 10%
General Recall Brand Recall Message Recall Likeability
58%
41% 32%
22%
41%
23% 16% 12%
General Recall Brand Recall Message Recall Likeability
Men 18-34 Women 18-34
62%
48% 38%
26%
41%
23% 17%
12%
GeneralRecall
BrandRecall
MessageRecall
Likeability
Video Ad in Full Episode Online62%
47% 38%
23%
43%
25% 18%
13%
GeneralRecall
BrandRecall
MessageRecall
Likeability
Standard TV Commercial (Total)Men 18-49 Women 18-49 62%
Avg. Recall A18-49
Full Ep Ads
42% Avg.
Recall A18-49 TV Ads
57% Avg.
Recall A18-49
Full Ep Ads
39% Avg.
Recall A18-34 TV Ads
Note: More slides are available in the appendix that show Full Episodes Online vs. TV Brand Effect across the demos: A18+, M18+, W18+, A18-49, A18-34, A35-64, M35-64, W35-64
48
Copyright © 2012 The Nielsen Company. Confidential and proprietary.
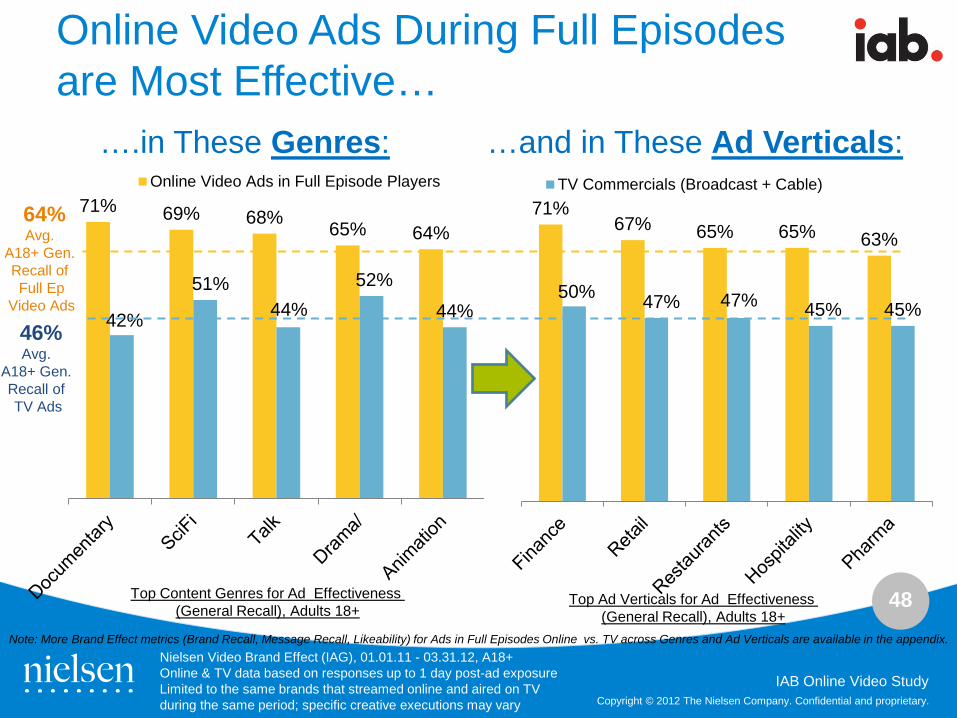
IAB Online Video Study
71% 69% 68% 65% 64%
42%
51% 44%
52%
44%
Online Video Ads in Full Episode Players
Online Video Ads During Full Episodes are Most Effective…
71% 67% 65% 65% 63%
50% 47% 47% 45% 45%
TV Commercials (Broadcast + Cable)
Nielsen Video Brand Effect (IAG), 01.01.11 - 03.31.12, A18+ Online & TV data based on responses up to 1 day post-ad exposure Limited to the same brands that streamed online and aired on TV during the same period; specific creative executions may vary
Top Ad Verticals for Ad Effectiveness (General Recall), Adults 18+
64% Avg.
A18+ Gen. Recall of Full Ep
Video Ads
46% Avg.
A18+ Gen. Recall of TV Ads
Top Content Genres for Ad Effectiveness (General Recall), Adults 18+
….in These Genres: …and in These Ad Verticals:
Note: More Brand Effect metrics (Brand Recall, Message Recall, Likeability) for Ads in Full Episodes Online vs. TV across Genres and Ad Verticals are available in the appendix.
49
Copyright © 2012 The Nielsen Company. Confidential and proprietary.
IAB Online Video Study
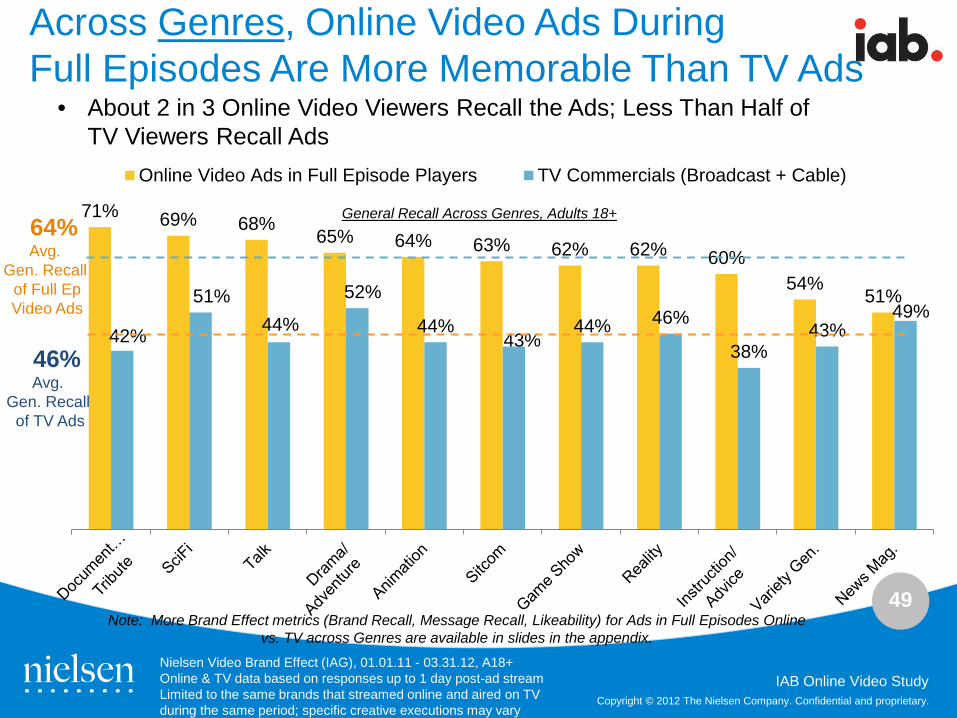
Across Genres, Online Video Ads During Full Episodes Are More Memorable Than TV Ads
71% 69% 68% 65% 64% 63% 62% 62% 60%
54% 51%
42%
51% 44%
52%
44% 43%
44% 46%
38% 43%
49%
Online Video Ads in Full Episode Players TV Commercials (Broadcast + Cable)
Nielsen Video Brand Effect (IAG), 01.01.11 - 03.31.12, A18+ Online & TV data based on responses up to 1 day post-ad stream Limited to the same brands that streamed online and aired on TV during the same period; specific creative executions may vary
General Recall Across Genres, Adults 18+ 64%
Avg. Gen. Recall
of Full Ep Video Ads
46% Avg.
Gen. Recall of TV Ads
• About 2 in 3 Online Video Viewers Recall the Ads; Less Than Half of TV Viewers Recall Ads
Note: More Brand Effect metrics (Brand Recall, Message Recall, Likeability) for Ads in Full Episodes Online vs. TV across Genres are available in slides in the appendix.
50
Copyright © 2012 The Nielsen Company. Confidential and proprietary.
IAB Online Video Study
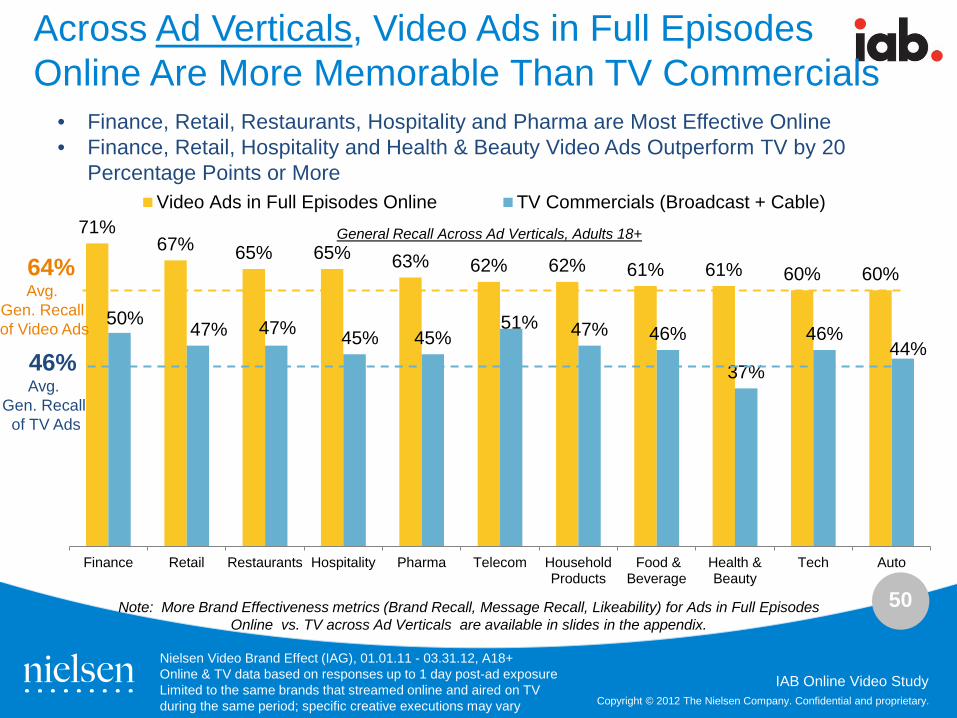
Across Ad Verticals, Video Ads in Full Episodes Online Are More Memorable Than TV Commercials
71% 67% 65% 65% 63% 62% 62% 61% 61% 60% 60%
50% 47% 47% 45% 45% 51% 47% 46%
37%
46% 44%
Finance Retail Restaurants Hospitality Pharma Telecom HouseholdProducts
Food &Beverage
Health &Beauty
Tech Auto
Video Ads in Full Episodes Online TV Commercials (Broadcast + Cable)
Nielsen Video Brand Effect (IAG), 01.01.11 - 03.31.12, A18+ Online & TV data based on responses up to 1 day post-ad exposure Limited to the same brands that streamed online and aired on TV during the same period; specific creative executions may vary
General Recall Across Ad Verticals, Adults 18+
64% Avg.
Gen. Recall of Video Ads
46% Avg.
Gen. Recall of TV Ads
• Finance, Retail, Restaurants, Hospitality and Pharma are Most Effective Online • Finance, Retail, Hospitality and Health & Beauty Video Ads Outperform TV by 20
Percentage Points or More
Note: More Brand Effectiveness metrics (Brand Recall, Message Recall, Likeability) for Ads in Full Episodes Online vs. TV across Ad Verticals are available in slides in the appendix.
51
Copyright © 2012 The Nielsen Company. Confidential and proprietary.
IAB Online Video Study
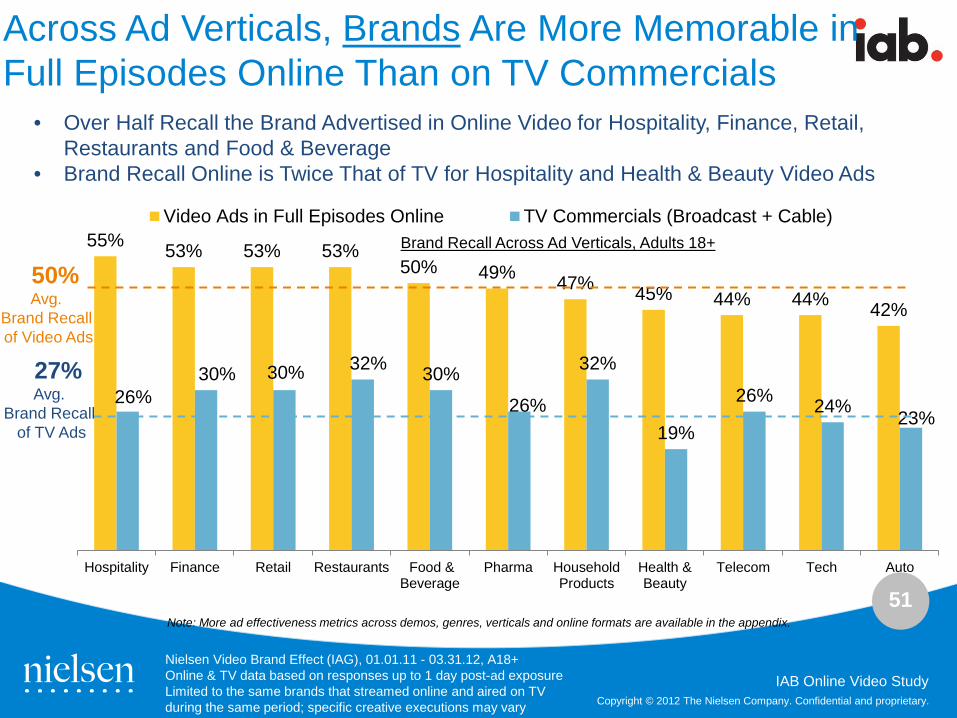
Across Ad Verticals, Brands Are More Memorable in Full Episodes Online Than on TV Commercials
55% 53% 53% 53% 50% 49% 47% 45% 44% 44% 42%
26% 30% 30% 32% 30%
26%
32%
19%
26% 24% 23%
Hospitality Finance Retail Restaurants Food &Beverage
Pharma HouseholdProducts
Health &Beauty
Telecom Tech Auto
Video Ads in Full Episodes Online TV Commercials (Broadcast + Cable)
Nielsen Video Brand Effect (IAG), 01.01.11 - 03.31.12, A18+ Online & TV data based on responses up to 1 day post-ad exposure Limited to the same brands that streamed online and aired on TV during the same period; specific creative executions may vary
Brand Recall Across Ad Verticals, Adults 18+
50% Avg.
Brand Recall of Video Ads
27% Avg.
Brand Recall of TV Ads
• Over Half Recall the Brand Advertised in Online Video for Hospitality, Finance, Retail, Restaurants and Food & Beverage
• Brand Recall Online is Twice That of TV for Hospitality and Health & Beauty Video Ads
Note: More ad effectiveness metrics across demos, genres, verticals and online formats are available in the appendix.
52
Copyright © 2012 The Nielsen Company. Confidential and proprietary.
IAB Online Video Study
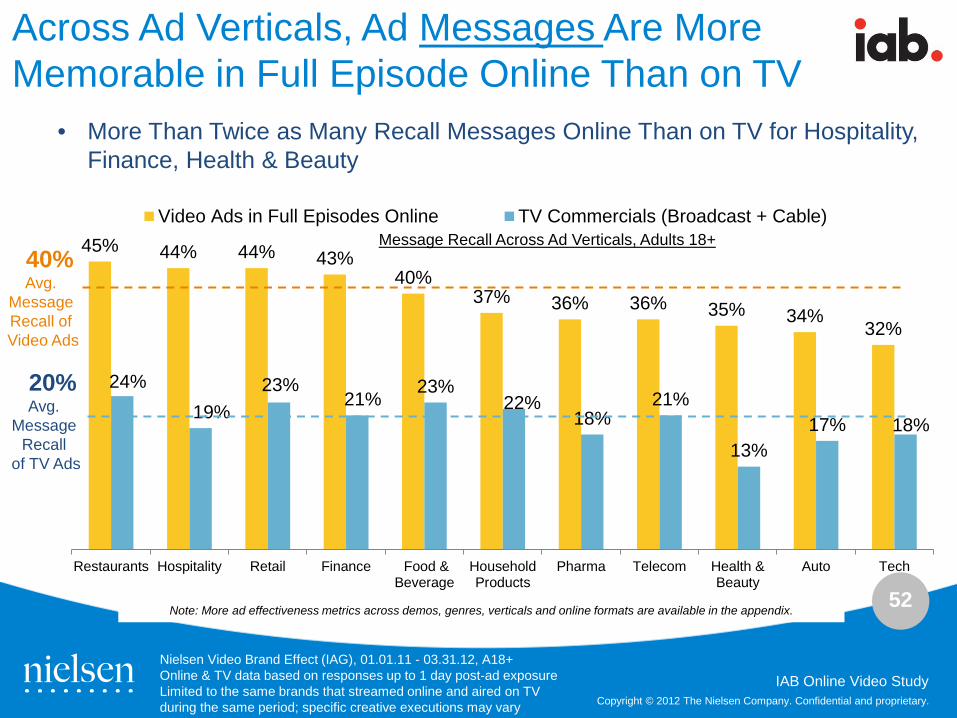
Across Ad Verticals, Ad Messages Are More Memorable in Full Episode Online Than on TV
45% 44% 44% 43% 40%
37% 36% 36% 35% 34% 32%
24% 19%
23% 21%
23% 22%
18% 21%
13% 17% 18%
Restaurants Hospitality Retail Finance Food &Beverage
HouseholdProducts
Pharma Telecom Health &Beauty
Auto Tech
Video Ads in Full Episodes Online TV Commercials (Broadcast + Cable)
Nielsen Video Brand Effect (IAG), 01.01.11 - 03.31.12, A18+ Online & TV data based on responses up to 1 day post-ad exposure Limited to the same brands that streamed online and aired on TV during the same period; specific creative executions may vary
Message Recall Across Ad Verticals, Adults 18+ 40%
Avg. Message Recall of Video Ads
20% Avg.
Message Recall
of TV Ads
• More Than Twice as Many Recall Messages Online Than on TV for Hospitality, Finance, Health & Beauty
Note: More ad effectiveness metrics across demos, genres, verticals and online formats are available in the appendix.
53
Copyright © 2012 The Nielsen Company. Confidential and proprietary.
IAB Online Video Study
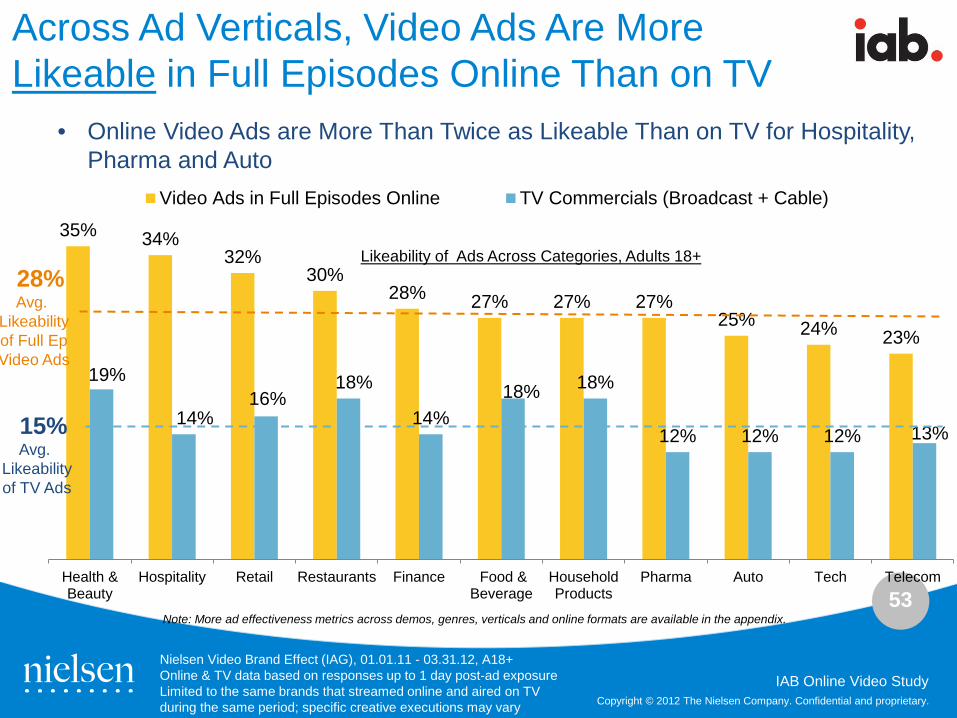
Across Ad Verticals, Video Ads Are More Likeable in Full Episodes Online Than on TV
35% 34% 32%
30% 28% 27% 27% 27%
25% 24% 23%
19%
14% 16%
18%
14% 18% 18%
12% 12% 12% 13%
Health &Beauty
Hospitality Retail Restaurants Finance Food &Beverage
HouseholdProducts
Pharma Auto Tech Telecom
Video Ads in Full Episodes Online TV Commercials (Broadcast + Cable)
Nielsen Video Brand Effect (IAG), 01.01.11 - 03.31.12, A18+ Online & TV data based on responses up to 1 day post-ad exposure Limited to the same brands that streamed online and aired on TV during the same period; specific creative executions may vary
Likeability of Ads Across Categories, Adults 18+ 28%
Avg. Likeability of Full Ep Video Ads
15% Avg.
Likeability of TV Ads
• Online Video Ads are More Than Twice as Likeable Than on TV for Hospitality, Pharma and Auto
Note: More ad effectiveness metrics across demos, genres, verticals and online formats are available in the appendix.
54
Copyright © 2012 The Nielsen Company. Confidential and proprietary.
IAB Online Video Study Copyright © 2012 The Nielsen Company. Confidential and proprietary.
Video Brand Effect by Vertical CPG and Non-CPG
55
Copyright © 2012 The Nielsen Company. Confidential and proprietary.
IAB Online Video Study
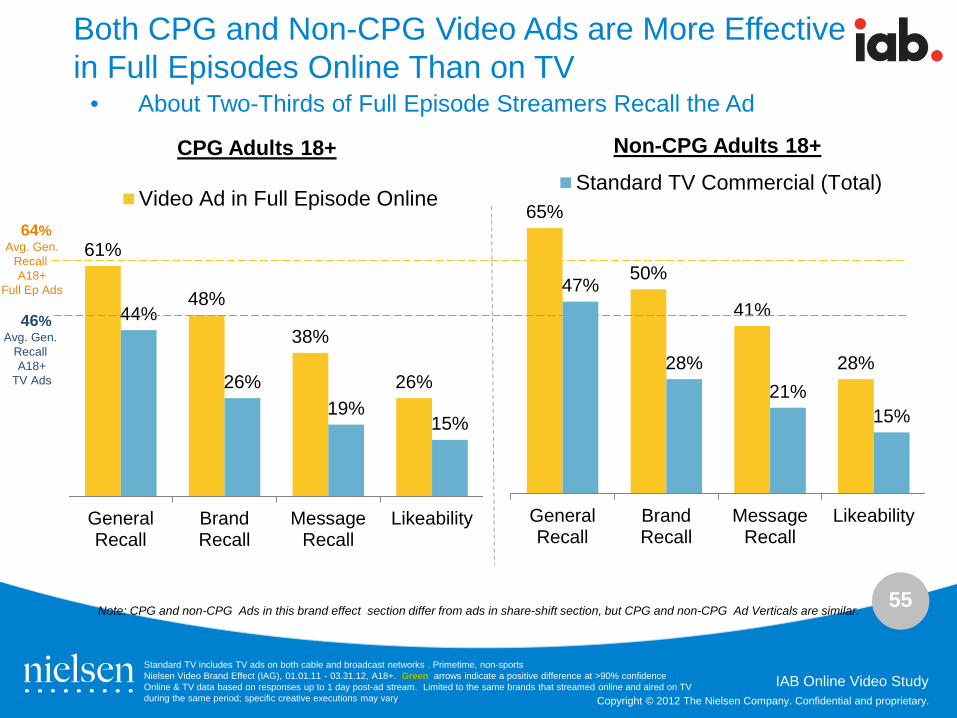
Both CPG and Non-CPG Video Ads are More Effective in Full Episodes Online Than on TV
Standard TV includes TV ads on both cable and broadcast networks . Primetime, non-sports Nielsen Video Brand Effect (IAG), 01.01.11 - 03.31.12, A18+. Green arrows indicate a positive difference at >90% confidence Online & TV data based on responses up to 1 day post-ad stream. Limited to the same brands that streamed online and aired on TV during the same period; specific creative executions may vary
61%
48%
38%
26%
44%
26% 19%
15%
GeneralRecall
BrandRecall
MessageRecall
Likeability
Video Ad in Full Episode Online 65%
50%
41%
28%
47%
28% 21%
15%
GeneralRecall
BrandRecall
MessageRecall
Likeability
Standard TV Commercial (Total)CPG Adults 18+ Non-CPG Adults 18+
64% Avg. Gen.
Recall A18+
Full Ep Ads
46% Avg. Gen.
Recall A18+
TV Ads
• About Two-Thirds of Full Episode Streamers Recall the Ad
Note: CPG and non-CPG Ads in this brand effect section differ from ads in share-shift section, but CPG and non-CPG Ad Verticals are similar.
56
Copyright © 2012 The Nielsen Company. Confidential and proprietary.
IAB Online Video Study
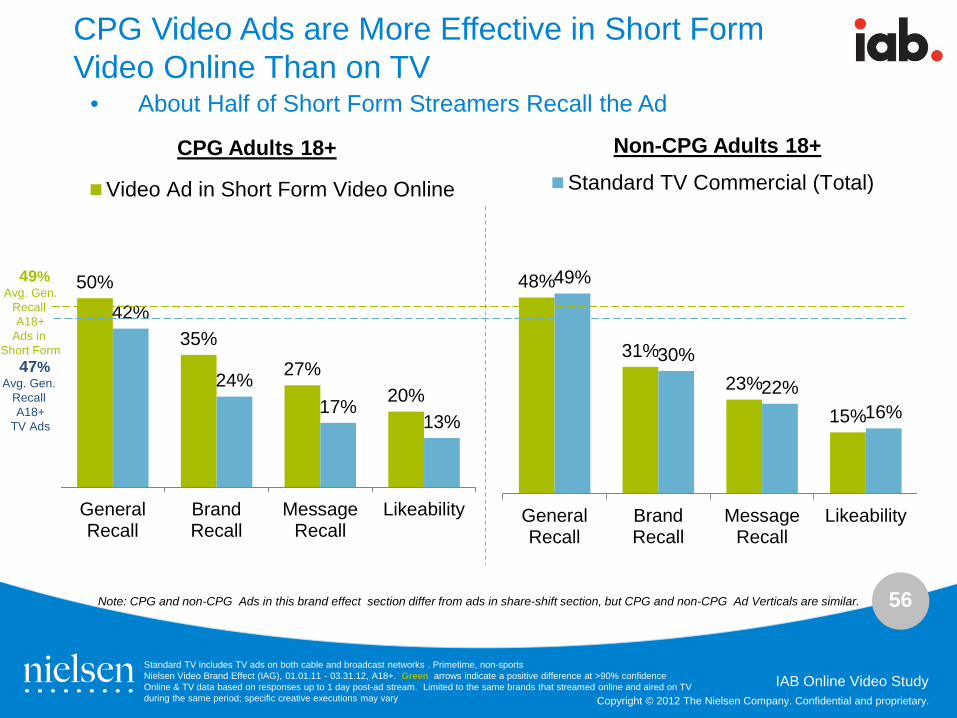
CPG Video Ads are More Effective in Short Form Video Online Than on TV
Standard TV includes TV ads on both cable and broadcast networks . Primetime, non-sports Nielsen Video Brand Effect (IAG), 01.01.11 - 03.31.12, A18+. Green arrows indicate a positive difference at >90% confidence Online & TV data based on responses up to 1 day post-ad stream. Limited to the same brands that streamed online and aired on TV during the same period; specific creative executions may vary
50%
35% 27%
20%
42%
24% 17%
13%
GeneralRecall
BrandRecall
MessageRecall
Likeability
Video Ad in Short Form Video Online
48%
31%
23%
15%
49%
30%
22% 16%
GeneralRecall
BrandRecall
MessageRecall
Likeability
Standard TV Commercial (Total)CPG Adults 18+ Non-CPG Adults 18+
49% Avg. Gen.
Recall A18+
Ads in Short Form
47% Avg. Gen.
Recall A18+
TV Ads
• About Half of Short Form Streamers Recall the Ad
Note: CPG and non-CPG Ads in this brand effect section differ from ads in share-shift section, but CPG and non-CPG Ad Verticals are similar.
57
Copyright © 2012 The Nielsen Company. Confidential and proprietary.
IAB Online Video Study
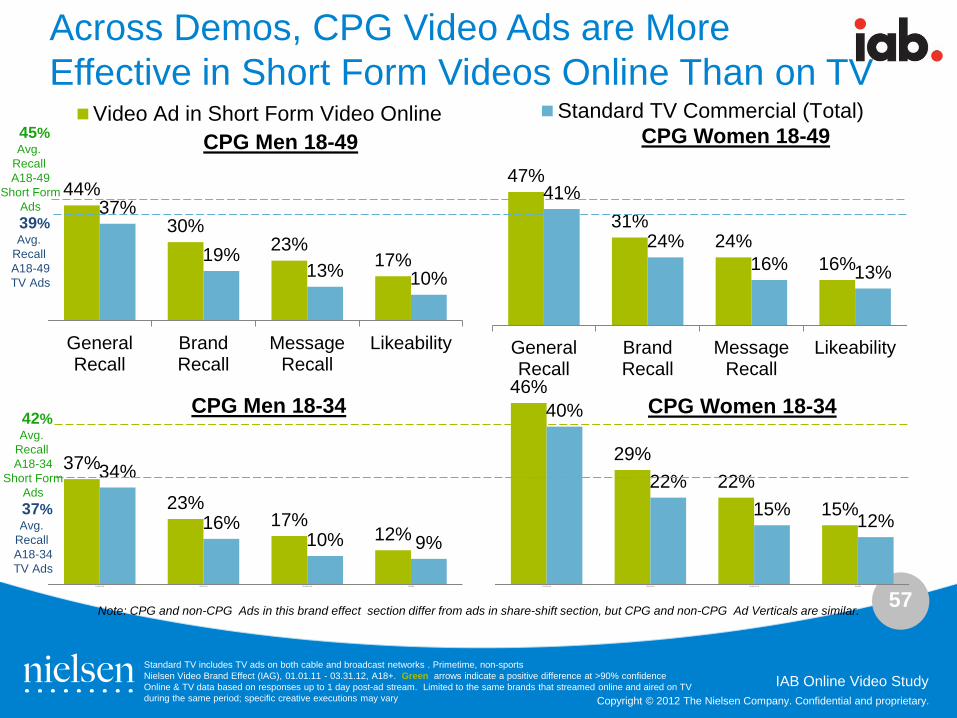
Across Demos, CPG Video Ads are More Effective in Short Form Videos Online Than on TV
Standard TV includes TV ads on both cable and broadcast networks . Primetime, non-sports Nielsen Video Brand Effect (IAG), 01.01.11 - 03.31.12, A18+. Green arrows indicate a positive difference at >90% confidence Online & TV data based on responses up to 1 day post-ad stream. Limited to the same brands that streamed online and aired on TV during the same period; specific creative executions may vary
37%
23% 17%
12%
34%
16% 10% 9%
General Recall Brand Recall Message Recall Likeability
46%
29% 22%
15%
40%
22% 15% 12%
General Recall Brand Recall Message Recall Likeability
CPG Men 18-34 CPG Women 18-34
44%
30% 23%
17%
37%
19% 13% 10%
GeneralRecall
BrandRecall
MessageRecall
Likeability
Video Ad in Short Form Video Online
47%
31% 24%
16%
41%
24% 16% 13%
GeneralRecall
BrandRecall
MessageRecall
Likeability
Standard TV Commercial (Total)CPG Men 18-49 CPG Women 18-49 45%
Avg. Recall A18-49
Short Form Ads
39% Avg.
Recall A18-49 TV Ads
42% Avg.
Recall A18-34
Short Form Ads
37% Avg.
Recall A18-34 TV Ads
Note: CPG and non-CPG Ads in this brand effect section differ from ads in share-shift section, but CPG and non-CPG Ad Verticals are similar.
58
Copyright © 2012 The Nielsen Company. Confidential and proprietary.
IAB Online Video Study
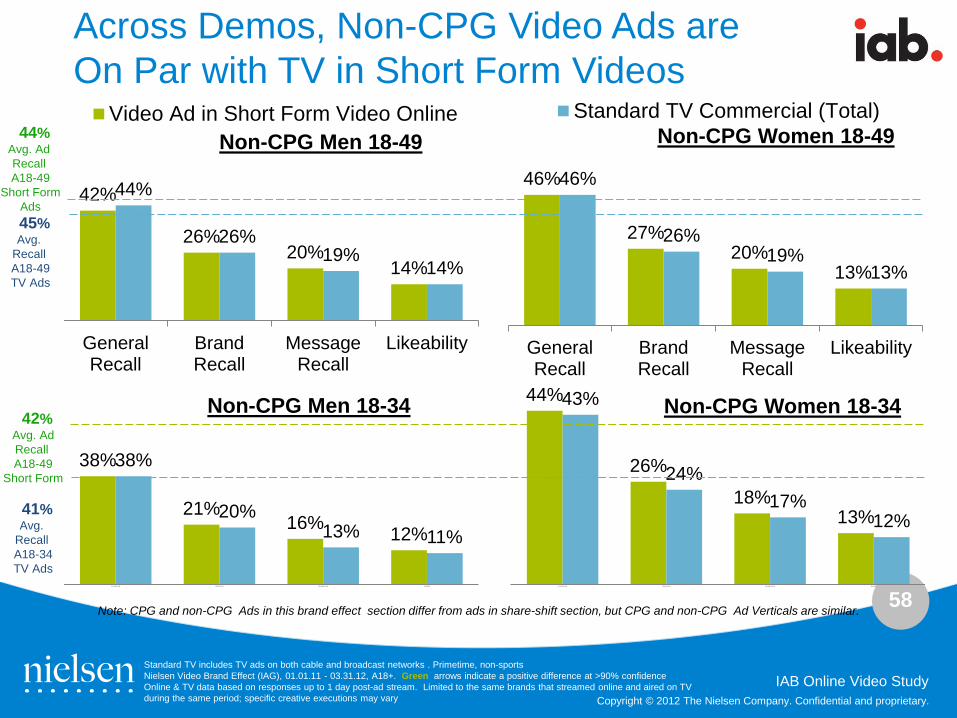
Across Demos, Non-CPG Video Ads are On Par with TV in Short Form Videos
Standard TV includes TV ads on both cable and broadcast networks . Primetime, non-sports Nielsen Video Brand Effect (IAG), 01.01.11 - 03.31.12, A18+. Green arrows indicate a positive difference at >90% confidence Online & TV data based on responses up to 1 day post-ad stream. Limited to the same brands that streamed online and aired on TV during the same period; specific creative executions may vary
38%
21% 16% 12%
38%
20% 13% 11%
General Recall Brand Recall Message Recall Likeability
44%
26%
18% 13%
43%
24% 17%
12%
General Recall Brand Recall Message Recall Likeability
Non-CPG Men 18-34 Non-CPG Women 18-34
42%
26% 20%
14%
44%
26% 19%
14%
GeneralRecall
BrandRecall
MessageRecall
Likeability
Video Ad in Short Form Video Online
46%
27% 20%
13%
46%
26% 19%
13%
GeneralRecall
BrandRecall
MessageRecall
Likeability
Standard TV Commercial (Total)Non-CPG Men 18-49 Non-CPG Women 18-49 44%
Avg. Ad Recall A18-49
Short Form Ads
45% Avg.
Recall A18-49 TV Ads
42% Avg. Ad Recall A18-49
Short Form
41% Avg.
Recall A18-34 TV Ads
Note: CPG and non-CPG Ads in this brand effect section differ from ads in share-shift section, but CPG and non-CPG Ad Verticals are similar.
59
Copyright © 2012 The Nielsen Company. Confidential and proprietary.
IAB Online Video Study
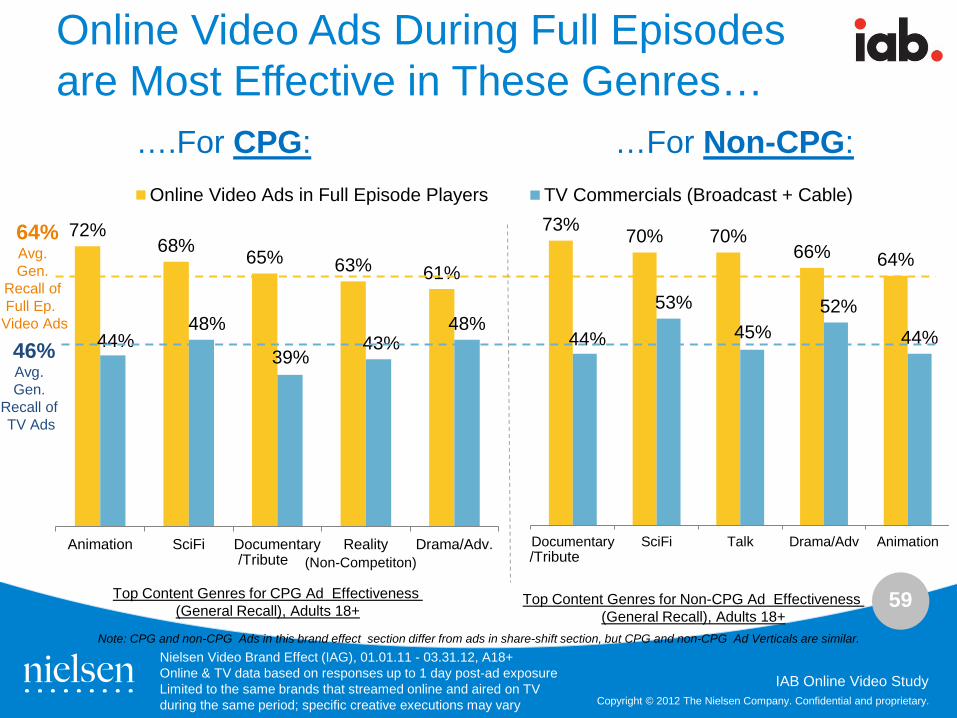
72% 68% 65% 63% 61%
44% 48%
39% 43%
48%
Animation SciFi Documentary Reality Drama/Adv.
Online Video Ads in Full Episode Players
Online Video Ads During Full Episodes are Most Effective in These Genres…
73% 70% 70% 66% 64%
44%
53% 45%
52%
44%
Documentary SciFi Talk Drama/Adv Animation
TV Commercials (Broadcast + Cable)
Nielsen Video Brand Effect (IAG), 01.01.11 - 03.31.12, A18+ Online & TV data based on responses up to 1 day post-ad exposure Limited to the same brands that streamed online and aired on TV during the same period; specific creative executions may vary
Top Content Genres for Non-CPG Ad Effectiveness (General Recall), Adults 18+
64% Avg. Gen.
Recall of Full Ep.
Video Ads
46% Avg. Gen.
Recall of TV Ads
Top Content Genres for CPG Ad Effectiveness (General Recall), Adults 18+
….For CPG: …For Non-CPG:
/Tribute /Tribute (Non-Competiton)
Note: CPG and non-CPG Ads in this brand effect section differ from ads in share-shift section, but CPG and non-CPG Ad Verticals are similar.
60
Copyright © 2012 The Nielsen Company. Confidential and proprietary.
IAB Online Video Study
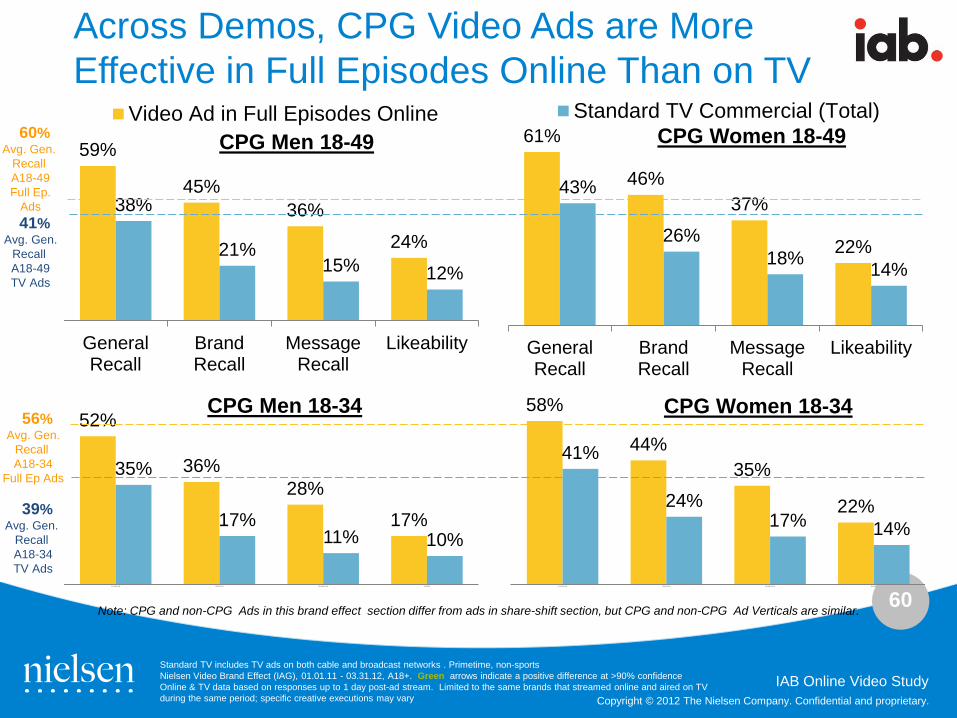
Across Demos, CPG Video Ads are More Effective in Full Episodes Online Than on TV
Standard TV includes TV ads on both cable and broadcast networks . Primetime, non-sports Nielsen Video Brand Effect (IAG), 01.01.11 - 03.31.12, A18+. Green arrows indicate a positive difference at >90% confidence Online & TV data based on responses up to 1 day post-ad stream. Limited to the same brands that streamed online and aired on TV during the same period; specific creative executions may vary
52%
36% 28%
17%
35%
17% 11% 10%
General Recall Brand Recall Message Recall Likeability
58%
44% 35%
22%
41%
24% 17% 14%
General Recall Brand Recall Message Recall Likeability
CPG Men 18-34 CPG Women 18-34
59%
45% 36%
24%
38%
21% 15% 12%
GeneralRecall
BrandRecall
MessageRecall
Likeability
Video Ad in Full Episodes Online61%
46% 37%
22%
43%
26% 18% 14%
GeneralRecall
BrandRecall
MessageRecall
Likeability
Standard TV Commercial (Total)CPG Men 18-49 CPG Women 18-49 60%
Avg. Gen. Recall A18-49 Full Ep.
Ads 41%
Avg. Gen. Recall A18-49 TV Ads
56% Avg. Gen.
Recall A18-34
Full Ep Ads
39% Avg. Gen.
Recall A18-34 TV Ads
Note: CPG and non-CPG Ads in this brand effect section differ from ads in share-shift section, but CPG and non-CPG Ad Verticals are similar.
61
Copyright © 2012 The Nielsen Company. Confidential and proprietary.
IAB Online Video Study
Across Demos, Non-CPG Video Ads are More Effective in Full Episodes Online Than TV
Standard TV includes TV ads on both cable and broadcast networks . Primetime, non-sports Nielsen Video Brand Effect (IAG), 01.01.11 - 03.31.12, A18+. Green arrows indicate a positive difference at >90% confidence Online & TV data based on responses up to 1 day post-ad stream. Limited to the same brands that streamed online and aired on TV during the same period; specific creative executions may vary
58%
42% 32%
20%
37%
18% 12% 10%
General Recall Brand Recall Message Recall Likeability
58%
41% 31%
22%
41%
22% 16% 12%
General Recall Brand Recall Message Recall Likeability
Non-CPG Men 18-34 Non-CPG Women 18-34
63%
48% 38%
27%
42%
24% 17% 13%
GeneralRecall
BrandRecall
MessageRecall
Likeability
Video Ad in Full Episode Online63%
47% 38%
23%
44%
25% 18%
13%
GeneralRecall
BrandRecall
MessageRecall
Likeability
Standard TV Commercial (Total)Non-CPG Men 18-49 Non-CPG Women 18-49 63%
Avg. Gen.
Recall A18-49
Full Ep Ads 43%
Avg. Gen Recall A18-49 TV Ads
58% Avg. Gen.
Recall A18-34
Full Ep Ads
39% Avg. Gen.
Recall A18-34 TV Ads
Note: CPG and non-CPG Ads in this brand effect section differ from ads in share-shift section, but CPG and non-CPG Ad Verticals are similar.
62
Copyright © 2012 The Nielsen Company. Confidential and proprietary.
IAB Online Video Study
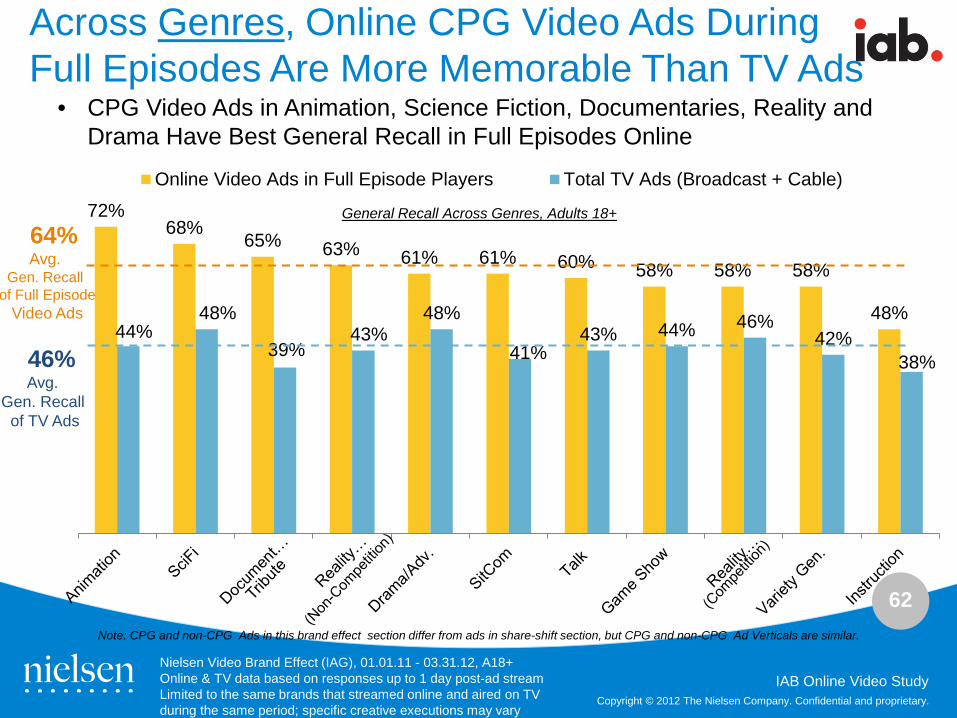
Across Genres, Online CPG Video Ads During Full Episodes Are More Memorable Than TV Ads
72% 68%
65% 63% 61% 61% 60% 58% 58% 58%
48% 44%
48%
39% 43%
48%
41% 43% 44% 46%
42% 38%
Online Video Ads in Full Episode Players Total TV Ads (Broadcast + Cable)
Nielsen Video Brand Effect (IAG), 01.01.11 - 03.31.12, A18+ Online & TV data based on responses up to 1 day post-ad stream Limited to the same brands that streamed online and aired on TV during the same period; specific creative executions may vary
General Recall Across Genres, Adults 18+
64% Avg.
Gen. Recall of Full Episode
Video Ads
46% Avg.
Gen. Recall of TV Ads
• CPG Video Ads in Animation, Science Fiction, Documentaries, Reality and Drama Have Best General Recall in Full Episodes Online
Note: CPG and non-CPG Ads in this brand effect section differ from ads in share-shift section, but CPG and non-CPG Ad Verticals are similar.
63
Copyright © 2012 The Nielsen Company. Confidential and proprietary.
IAB Online Video Study
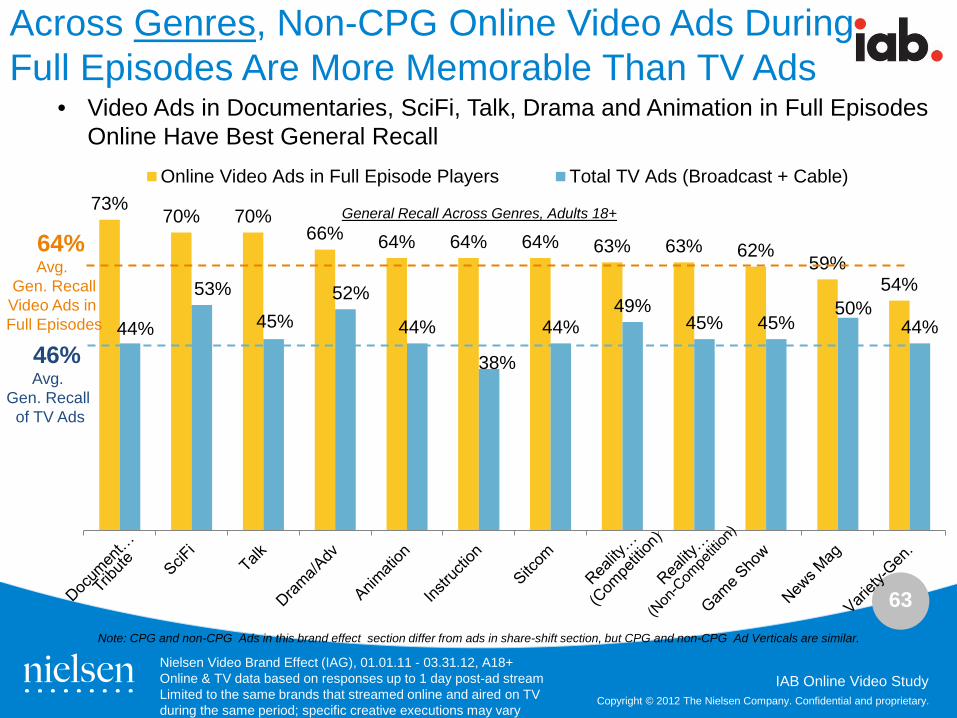
Across Genres, Non-CPG Online Video Ads During Full Episodes Are More Memorable Than TV Ads
73% 70% 70%
66% 64% 64% 64% 63% 63% 62% 59%
54%
44%
53%
45% 52%
44%
38%
44% 49%
45% 45% 50%
44%
Online Video Ads in Full Episode Players Total TV Ads (Broadcast + Cable)
Nielsen Video Brand Effect (IAG), 01.01.11 - 03.31.12, A18+ Online & TV data based on responses up to 1 day post-ad stream Limited to the same brands that streamed online and aired on TV during the same period; specific creative executions may vary
General Recall Across Genres, Adults 18+
64% Avg.
Gen. Recall Video Ads in Full Episodes
46% Avg.
Gen. Recall of TV Ads
• Video Ads in Documentaries, SciFi, Talk, Drama and Animation in Full Episodes Online Have Best General Recall
Note: CPG and non-CPG Ads in this brand effect section differ from ads in share-shift section, but CPG and non-CPG Ad Verticals are similar.
64
Copyright © 2012 The Nielsen Company. Confidential and proprietary.
IAB Online Video Study Copyright © 2012 The Nielsen Company. Confidential and proprietary.
Digital Video Ad Behaviors
65
Copyright © 2012 The Nielsen Company. Confidential and proprietary.
IAB Online Video Study
On Average, People Streaming Video Watch The Majority Of The Ads Featured
20 seconds
87%
the average length of viewing per online video ad
the average completion percent of those viewing ads in online video
Nielsen Video Analytics Data Measurement Period: January 2011-March 2012
66
Copyright © 2012 The Nielsen Company. Confidential and proprietary.
IAB Online Video Study
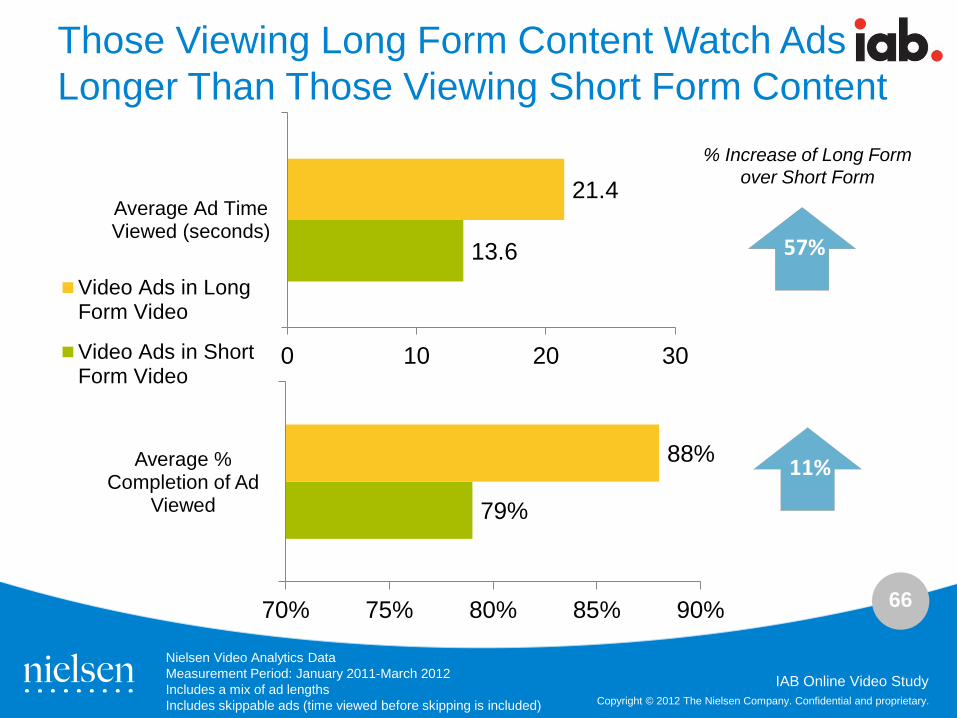
Those Viewing Long Form Content Watch Ads Longer Than Those Viewing Short Form Content
13.6
21.4
0 10 20 30
Average Ad TimeViewed (seconds)
Video Ads in LongForm Video
Video Ads in ShortForm Video
79%
88%
70% 75% 80% 85% 90%
Average % Completion of Ad
Viewed
11%
% Increase of Long Form over Short Form
57%
Nielsen Video Analytics Data Measurement Period: January 2011-March 2012 Includes a mix of ad lengths Includes skippable ads (time viewed before skipping is included)
67
Copyright © 2012 The Nielsen Company. Confidential and proprietary.
IAB Online Video Study
Attentiveness Score:
Attentiveness Score:
Attentiveness Score:
Mid-Roll Ads* Have Higher Viewing Completion Rates Than Either Pre-roll Or Post-roll Ads
79%
Preroll
Nielsen Video Analytics Data Measurement Period: January 2011-March 2012
71%
Postroll
89%
Midroll
99%
Midroll
79%
Postroll 81%
Preroll
76
88
64
78
80
73
Attentiveness Score:
Attentiveness Score:
Attentiveness Score:
Video Analytics Attentiveness Score is a single number measuring the overall quality of viewers’ experiences with a particular video, ad or ad/content interaction. Variables used to calculate the score include: time spent viewed/length of clip, usage of pause, skip, or rewind features, in or out of focus, increase/decreases in volume, going full screen, repeat viewing. * Mid roll in short form can refer to ads in between short form video during playlists.
68
Copyright © 2012 The Nielsen Company. Confidential and proprietary.
IAB Online Video Study Copyright © 2012 The Nielsen Company. Confidential and proprietary.
Different Types of Video Viewing: - Short Form Video vs. Long Form - Professional Video vs. UGC - Viewing Trends Across Categories
69
Copyright © 2012 The Nielsen Company. Confidential and proprietary.
IAB Online Video Study
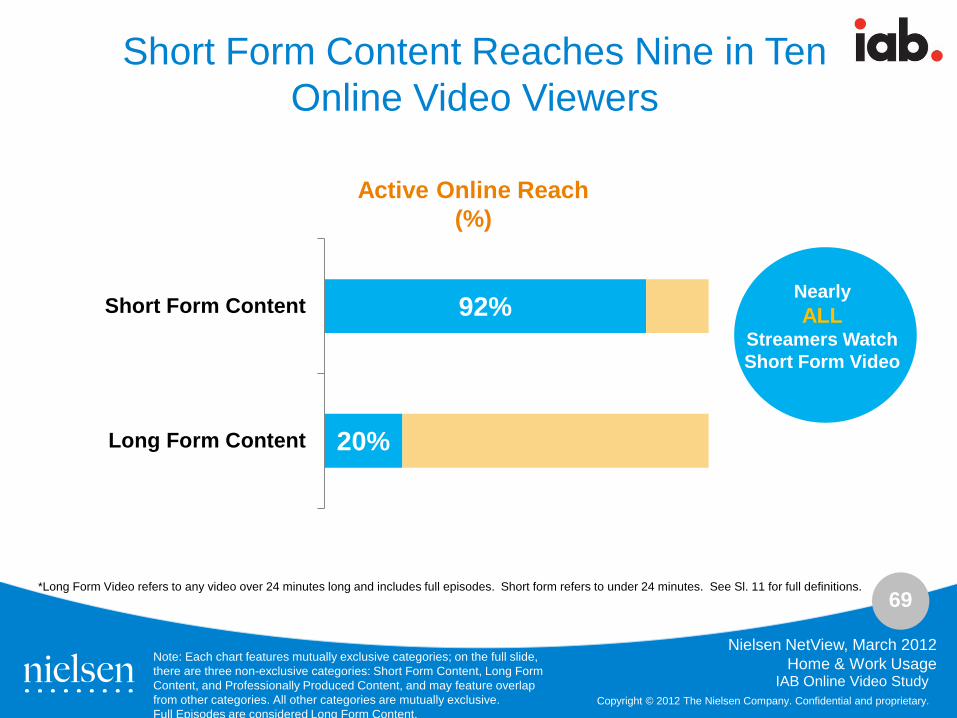
Active Online Reach (%)
Note: Each chart features mutually exclusive categories; on the full slide, there are three non-exclusive categories: Short Form Content, Long Form Content, and Professionally Produced Content, and may feature overlap from other categories. All other categories are mutually exclusive. Full Episodes are considered Long Form Content.
Nielsen NetView, March 2012 Home & Work Usage
20%
92%
Long Form Content
Short Form ContentNearly ALL
Streamers Watch Short Form Video
Short Form Content Reaches Nine in Ten Online Video Viewers
*Long Form Video refers to any video over 24 minutes long and includes full episodes. Short form refers to under 24 minutes. See Sl. 11 for full definitions.
70
Copyright © 2012 The Nielsen Company. Confidential and proprietary.
IAB Online Video Study
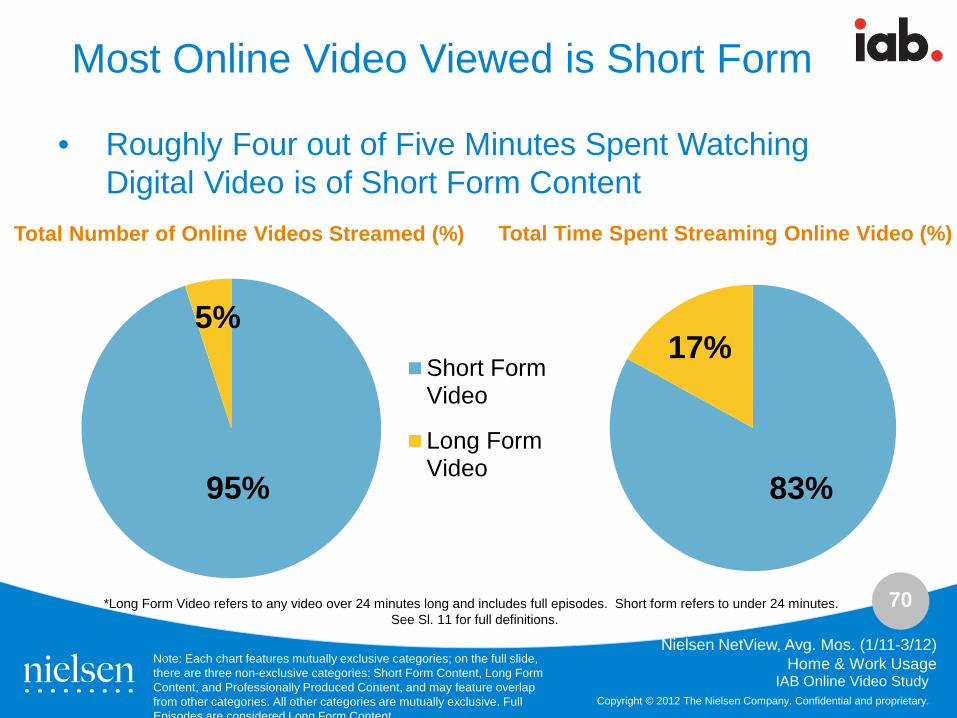
Most Online Video Viewed is Short Form
Total Number of Online Videos Streamed (%)
Note: Each chart features mutually exclusive categories; on the full slide, there are three non-exclusive categories: Short Form Content, Long Form Content, and Professionally Produced Content, and may feature overlap from other categories. All other categories are mutually exclusive. Full Episodes are considered Long Form Content
Nielsen NetView, Avg. Mos. (1/11-3/12) Home & Work Usage
• Roughly Four out of Five Minutes Spent Watching Digital Video is of Short Form Content
95%
5% Short FormVideo
Long FormVideo
83%
17%
Total Time Spent Streaming Online Video (%)
*Long Form Video refers to any video over 24 minutes long and includes full episodes. Short form refers to under 24 minutes. See Sl. 11 for full definitions.
71
Copyright © 2012 The Nielsen Company. Confidential and proprietary.
IAB Online Video Study
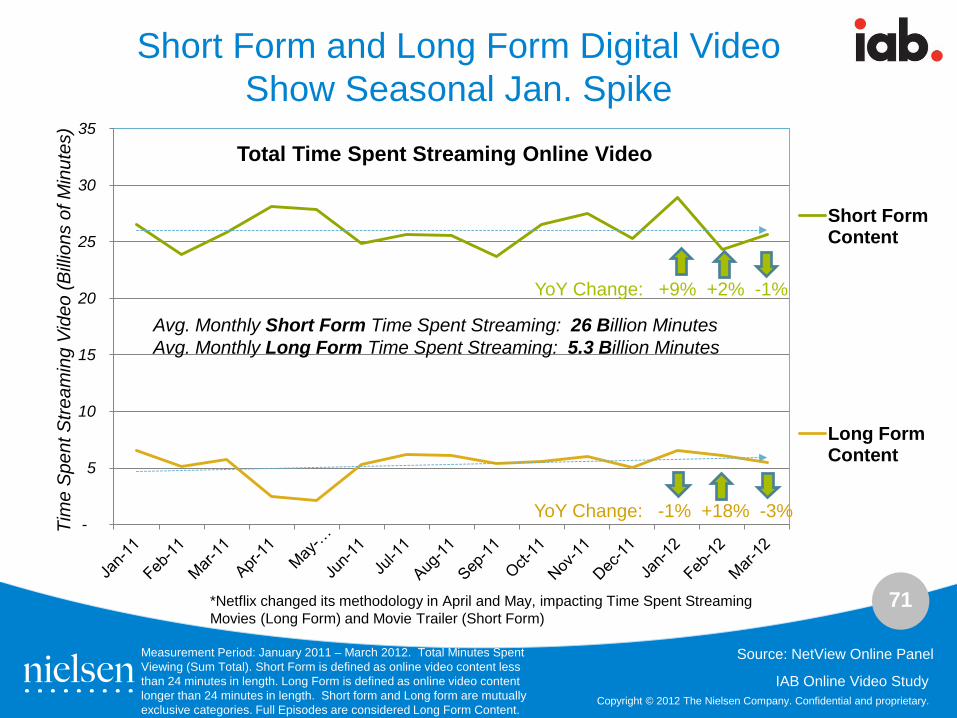
Short Form and Long Form Digital Video Show Seasonal Jan. Spike
-
5
10
15
20
25
30
35
Short FormContent
Long FormContent
*Netflix changed its methodology in April and May, impacting Time Spent Streaming Movies (Long Form) and Movie Trailer (Short Form)
Avg. Monthly Short Form Time Spent Streaming: 26 Billion Minutes Avg. Monthly Long Form Time Spent Streaming: 5.3 Billion Minutes
Tim
e S
pent
Stre
amin
g Vi
deo
(Bill
ions
of M
inut
es)
Total Time Spent Streaming Online Video
YoY Change: +9% +2% -1%
YoY Change: -1% +18% -3%
Source: NetView Online Panel Measurement Period: January 2011 – March 2012. Total Minutes Spent Viewing (Sum Total). Short Form is defined as online video content less than 24 minutes in length. Long Form is defined as online video content longer than 24 minutes in length. Short form and Long form are mutually exclusive categories. Full Episodes are considered Long Form Content.
72
Copyright © 2012 The Nielsen Company. Confidential and proprietary.
IAB Online Video Study
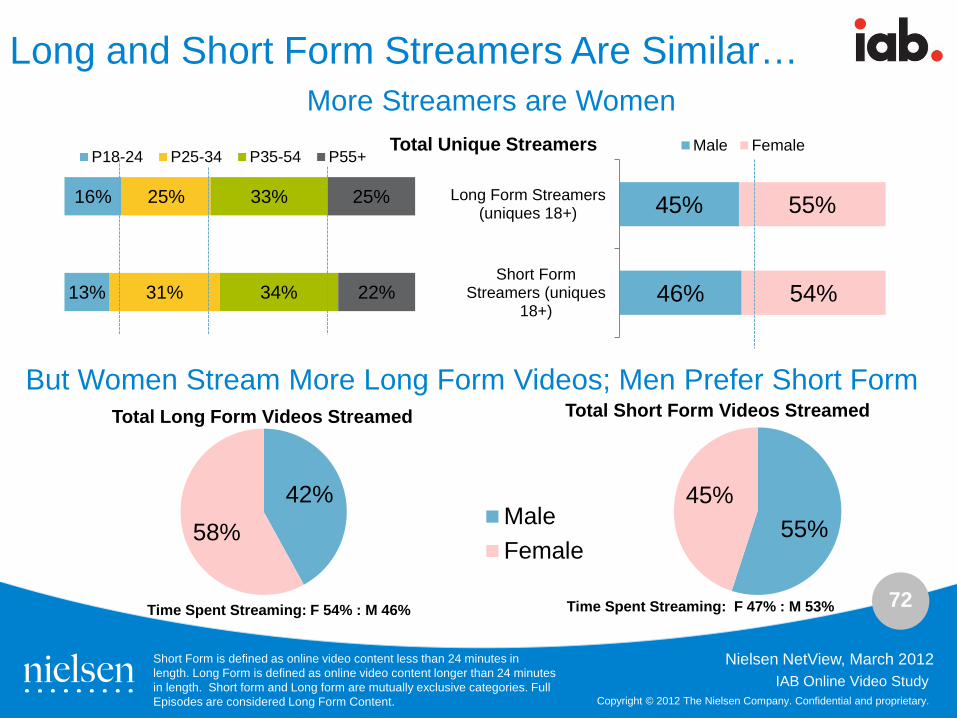
Long and Short Form Streamers Are Similar…
Nielsen NetView, March 2012 Short Form is defined as online video content less than 24 minutes in length. Long Form is defined as online video content longer than 24 minutes in length. Short form and Long form are mutually exclusive categories. Full Episodes are considered Long Form Content.
55% 45%
Total Short Form Videos Streamed
MaleFemale
42% 58%
13%
16%
31%
25%
34%
33%
22%
25%
P18-24 P25-34 P35-54 P55+
Total Long Form Videos Streamed
46%
45%
54%
55%
Short FormStreamers (uniques
18+)
Long Form Streamers(uniques 18+)
Male Female
But Women Stream More Long Form Videos; Men Prefer Short Form
More Streamers are Women Total Unique Streamers
Time Spent Streaming: F 54% : M 46% Time Spent Streaming: F 47% : M 53%
73
Copyright © 2012 The Nielsen Company. Confidential and proprietary.
IAB Online Video Study
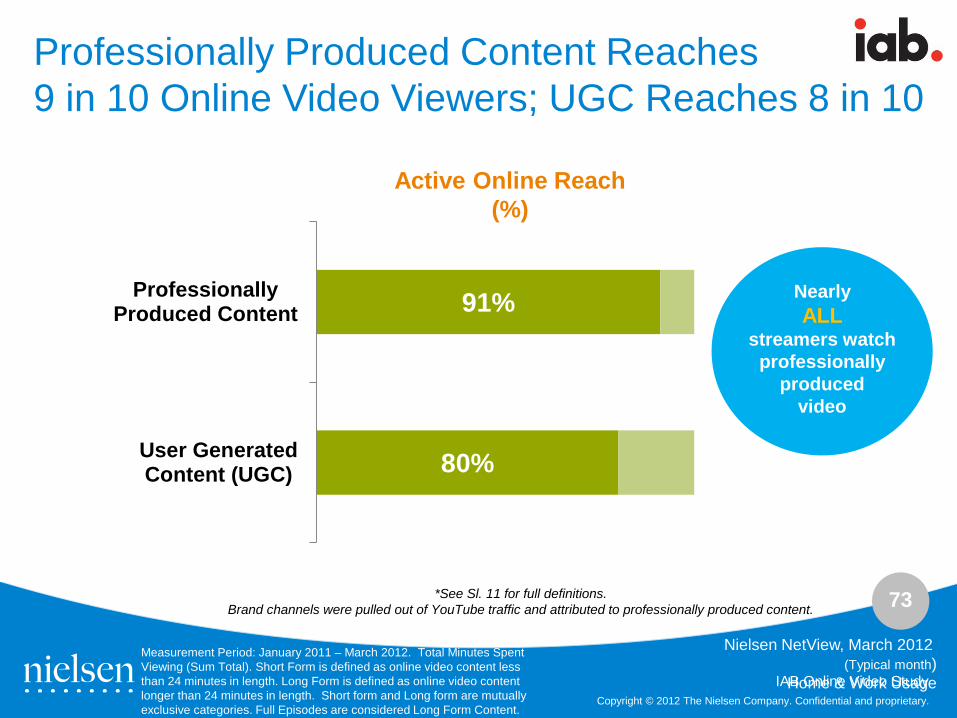
Active Online Reach (%)
Nielsen NetView, March 2012 (Typical month)
Home & Work Usage
80%
91%
User GeneratedContent (UGC)
ProfessionallyProduced Content
Nearly ALL
streamers watch professionally
produced video
Professionally Produced Content Reaches 9 in 10 Online Video Viewers; UGC Reaches 8 in 10
*See Sl. 11 for full definitions. Brand channels were pulled out of YouTube traffic and attributed to professionally produced content.
Measurement Period: January 2011 – March 2012. Total Minutes Spent Viewing (Sum Total). Short Form is defined as online video content less than 24 minutes in length. Long Form is defined as online video content longer than 24 minutes in length. Short form and Long form are mutually exclusive categories. Full Episodes are considered Long Form Content.
74
Copyright © 2012 The Nielsen Company. Confidential and proprietary.
IAB Online Video Study
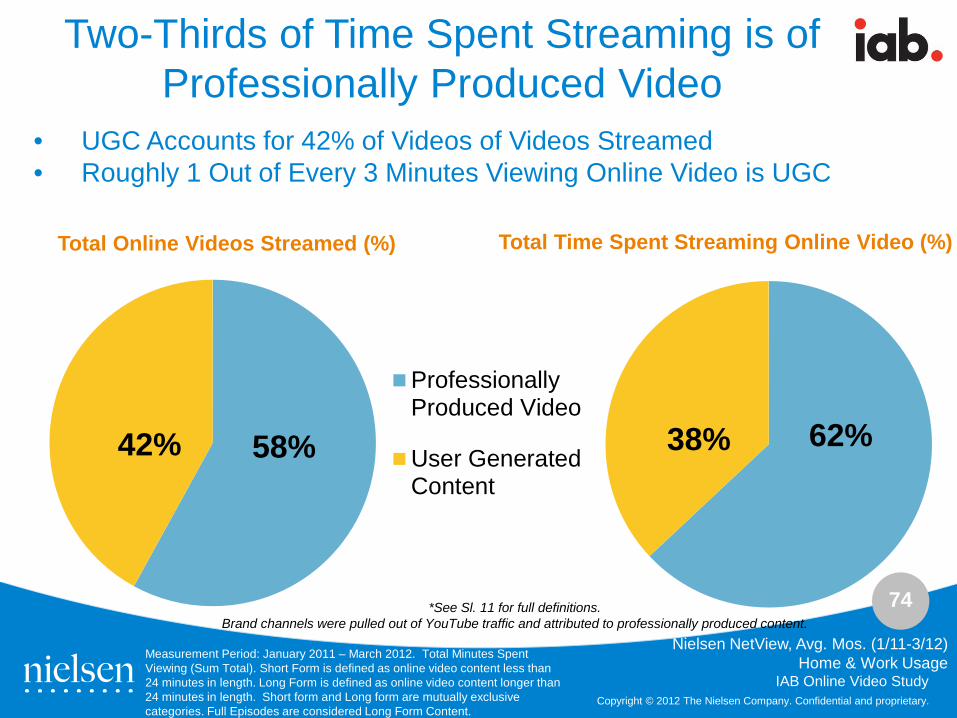
Two-Thirds of Time Spent Streaming is of Professionally Produced Video
Total Time Spent Streaming Online Video (%)
Nielsen NetView, Avg. Mos. (1/11-3/12) Home & Work Usage
• UGC Accounts for 42% of Videos of Videos Streamed • Roughly 1 Out of Every 3 Minutes Viewing Online Video is UGC
62% 38% 58% 42%
ProfessionallyProduced Video
User GeneratedContent
Total Online Videos Streamed (%)
Measurement Period: January 2011 – March 2012. Total Minutes Spent Viewing (Sum Total). Short Form is defined as online video content less than 24 minutes in length. Long Form is defined as online video content longer than 24 minutes in length. Short form and Long form are mutually exclusive categories. Full Episodes are considered Long Form Content.
*See Sl. 11 for full definitions. Brand channels were pulled out of YouTube traffic and attributed to professionally produced content.
75
Copyright © 2012 The Nielsen Company. Confidential and proprietary.
IAB Online Video Study
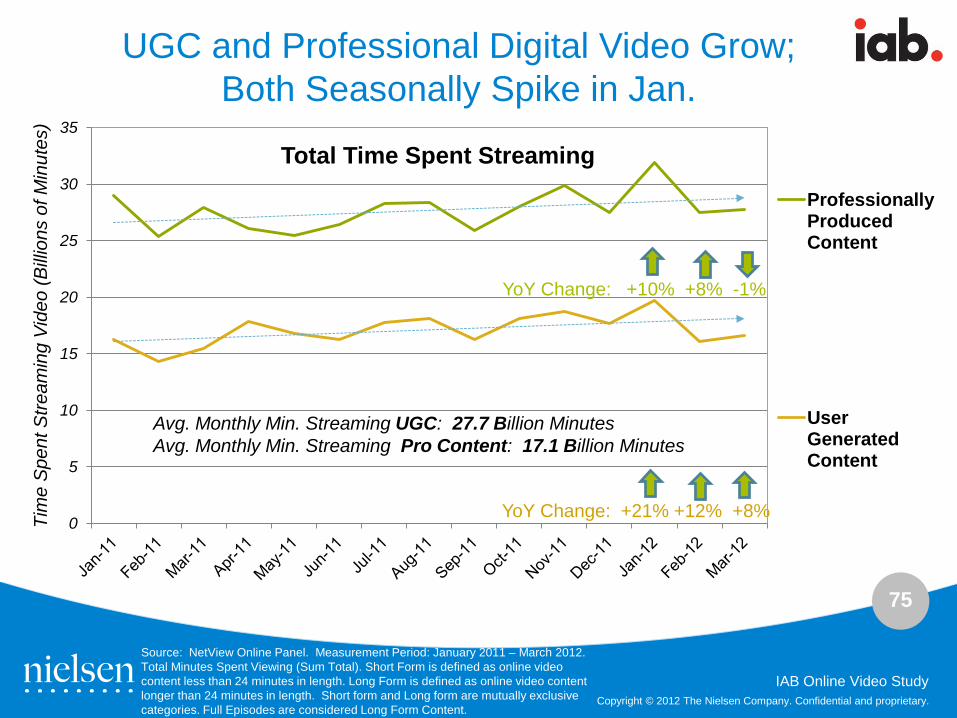
UGC and Professional Digital Video Grow; Both Seasonally Spike in Jan.
0
5
10
15
20
25
30
35
ProfessionallyProducedContent
UserGeneratedContent
Avg. Monthly Min. Streaming UGC: 27.7 Billion Minutes Avg. Monthly Min. Streaming Pro Content: 17.1 Billion Minutes
Tim
e S
pent
Stre
amin
g Vi
deo
(Bill
ions
of M
inut
es)
Total Time Spent Streaming
YoY Change: +10% +8% -1%
YoY Change: +21% +12% +8%
Source: NetView Online Panel. Measurement Period: January 2011 – March 2012. Total Minutes Spent Viewing (Sum Total). Short Form is defined as online video content less than 24 minutes in length. Long Form is defined as online video content longer than 24 minutes in length. Short form and Long form are mutually exclusive categories. Full Episodes are considered Long Form Content.
76
Copyright © 2012 The Nielsen Company. Confidential and proprietary.
IAB Online Video Study
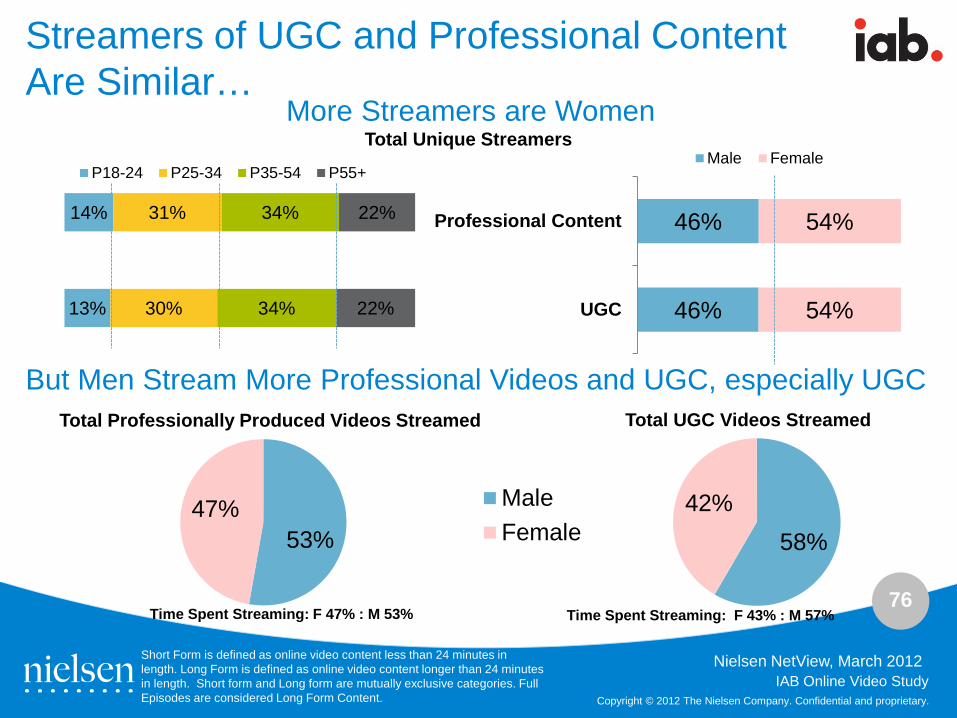
Streamers of UGC and Professional Content Are Similar…
Nielsen NetView, March 2012
58% 42%
Total UGC Videos Streamed
MaleFemale53%
47%
13%
14%
30%
31%
34%
34%
22%
22%
P18-24 P25-34 P35-54 P55+
Total Professionally Produced Videos Streamed
46%
46%
54%
54%
UGC
Professional Content
Male Female
But Men Stream More Professional Videos and UGC, especially UGC
More Streamers are Women Total Unique Streamers
Time Spent Streaming: F 47% : M 53% Time Spent Streaming: F 43% : M 57%
Short Form is defined as online video content less than 24 minutes in length. Long Form is defined as online video content longer than 24 minutes in length. Short form and Long form are mutually exclusive categories. Full Episodes are considered Long Form Content.
77
Copyright © 2012 The Nielsen Company. Confidential and proprietary.
IAB Online Video Study
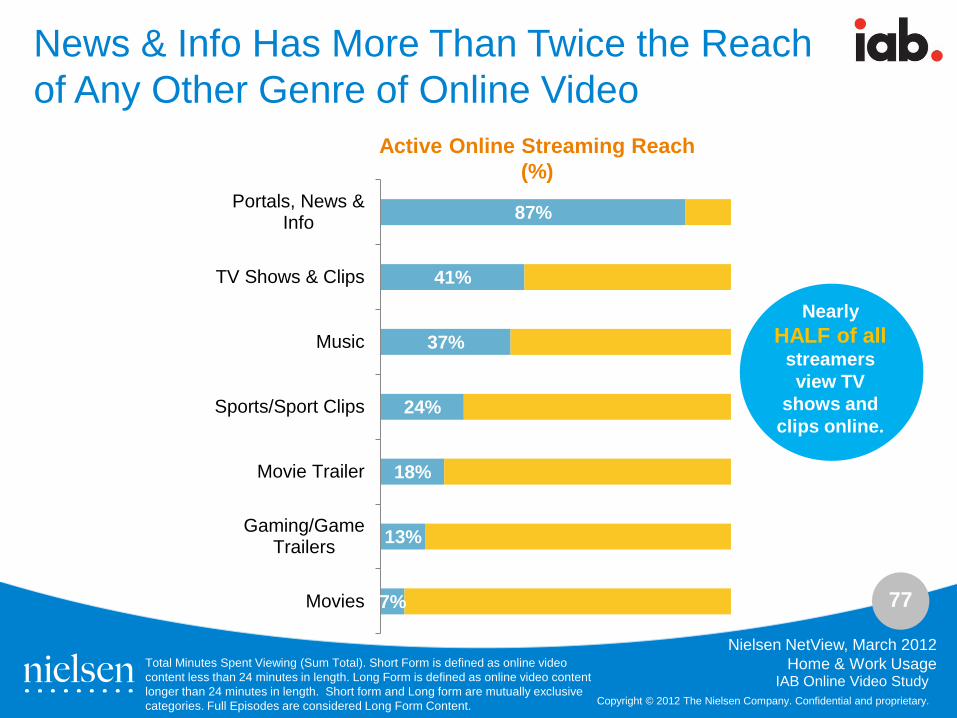
Active Online Streaming Reach (%)
Nielsen NetView, March 2012 Home & Work Usage
7%
13%
18%
24%
37%
41%
87%
Movies
Gaming/GameTrailers
Movie Trailer
Sports/Sport Clips
Music
TV Shows & Clips
Portals, News &Info
Nearly HALF of all
streamers view TV
shows and clips online.
News & Info Has More Than Twice the Reach of Any Other Genre of Online Video
Total Minutes Spent Viewing (Sum Total). Short Form is defined as online video content less than 24 minutes in length. Long Form is defined as online video content longer than 24 minutes in length. Short form and Long form are mutually exclusive categories. Full Episodes are considered Long Form Content.
78
Copyright © 2012 The Nielsen Company. Confidential and proprietary.
IAB Online Video Study
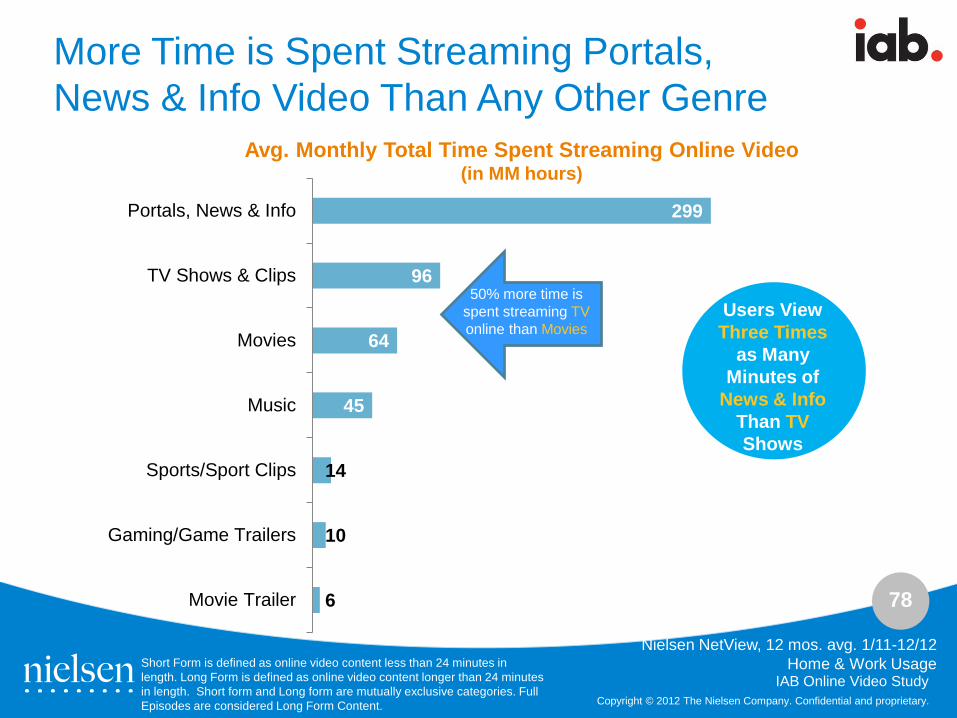
Avg. Monthly Total Time Spent Streaming Online Video (in MM hours)
Nielsen NetView, 12 mos. avg. 1/11-12/12 Home & Work Usage
6
10
14
45
64
96
299
Movie Trailer
Gaming/Game Trailers
Sports/Sport Clips
Music
Movies
TV Shows & Clips
Portals, News & Info
Users View Three Times
as Many Minutes of
News & Info Than TV Shows
More Time is Spent Streaming Portals, News & Info Video Than Any Other Genre
50% more time is spent streaming TV online than Movies
Short Form is defined as online video content less than 24 minutes in length. Long Form is defined as online video content longer than 24 minutes in length. Short form and Long form are mutually exclusive categories. Full Episodes are considered Long Form Content.
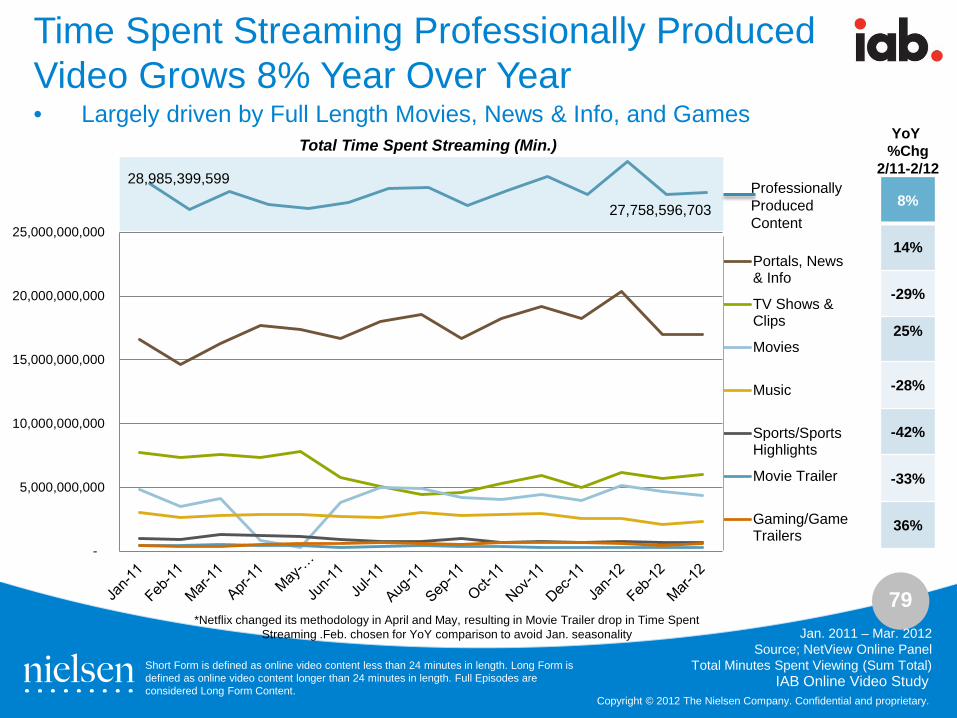
79
Copyright © 2012 The Nielsen Company. Confidential and proprietary.
IAB Online Video Study
-
5,000,000,000
10,000,000,000
15,000,000,000
20,000,000,000
25,000,000,000
Portals, News& Info
TV Shows &Clips
Movies
Music
Sports/SportsHighlights
Movie Trailer
Gaming/GameTrailers
Time Spent Streaming Professionally Produced Video Grows 8% Year Over Year
Short Form is defined as online video content less than 24 minutes in length. Long Form is defined as online video content longer than 24 minutes in length. Full Episodes are considered Long Form Content.
*Netflix changed its methodology in April and May, resulting in Movie Trailer drop in Time Spent Streaming .Feb. chosen for YoY comparison to avoid Jan. seasonality
• Largely driven by Full Length Movies, News & Info, and Games
28,985,399,599
27,758,596,703
YoY %Chg
2/11-2/12
8%
14%
-29%
25%
-28%
-42%
-33%
36%
Professionally Produced Content
Total Time Spent Streaming (Min.)
Jan. 2011 – Mar. 2012 Source; NetView Online Panel
Total Minutes Spent Viewing (Sum Total)
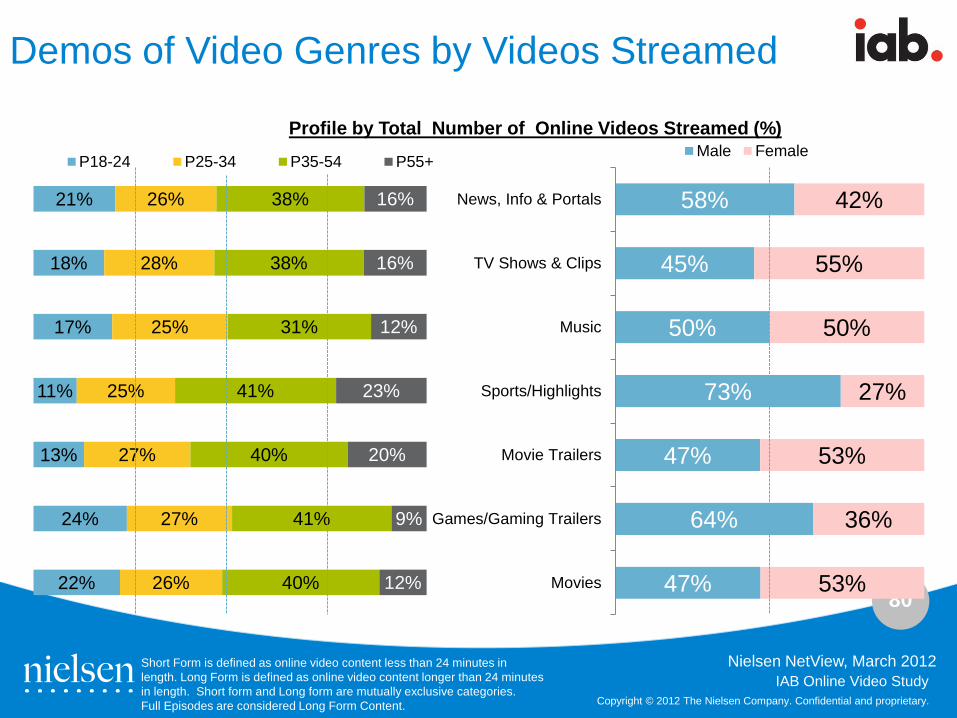
80
Copyright © 2012 The Nielsen Company. Confidential and proprietary.
IAB Online Video Study
Demos of Video Genres by Videos Streamed
Nielsen NetView, March 2012
22%
24%
13%
11%
17%
18%
21%
26%
27%
27%
25%
25%
28%
26%
40%
41%
40%
41%
31%
38%
38%
12%
9%
20%
23%
12%
16%
16%
P18-24 P25-34 P35-54 P55+
47%
64%
47%
73%
50%
45%
58%
53%
36%
53%
27%
50%
55%
42%
Movies
Games/Gaming Trailers
Movie Trailers
Sports/Highlights
Music
TV Shows & Clips
News, Info & Portals
Male FemaleProfile by Total Number of Online Videos Streamed (%)
Short Form is defined as online video content less than 24 minutes in length. Long Form is defined as online video content longer than 24 minutes in length. Short form and Long form are mutually exclusive categories. Full Episodes are considered Long Form Content.
81
Copyright © 2012 The Nielsen Company. Confidential and proprietary.
IAB Online Video Study Copyright © 2012 The Nielsen Company. Confidential and proprietary.
Appendix
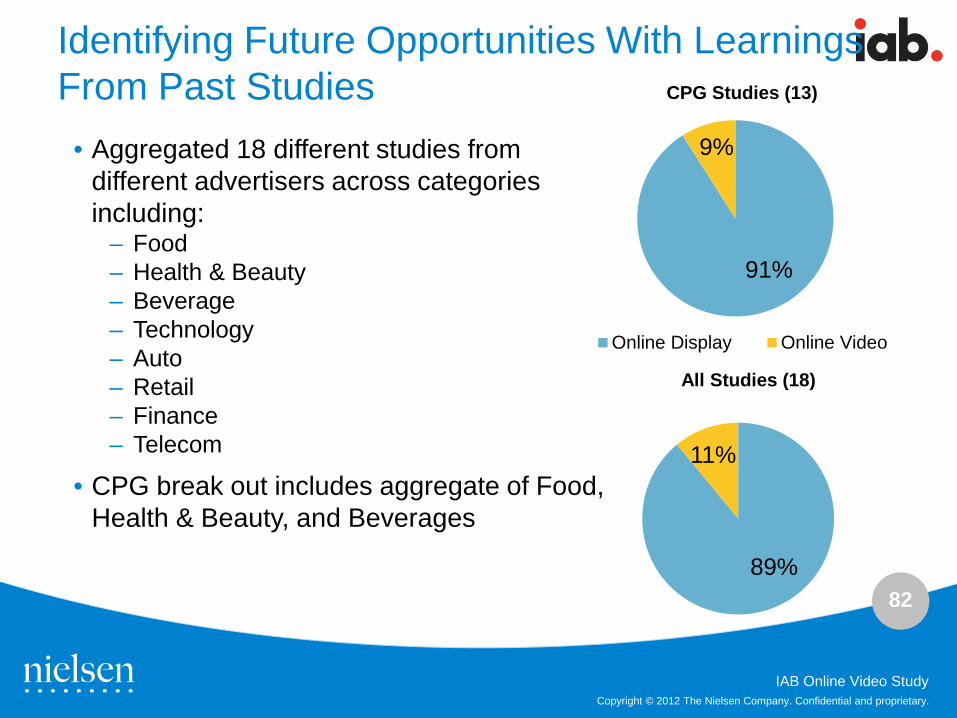
82
Copyright © 2012 The Nielsen Company. Confidential and proprietary.
IAB Online Video Study
Identifying Future Opportunities With Learnings From Past Studies
• Aggregated 18 different studies from different advertisers across categories including:
– Food – Health & Beauty – Beverage – Technology – Auto – Retail – Finance – Telecom
• CPG break out includes aggregate of Food, Health & Beauty, and Beverages
91%
9%
CPG Studies (13)
Online Display Online Video
89%
11%
All Studies (18)
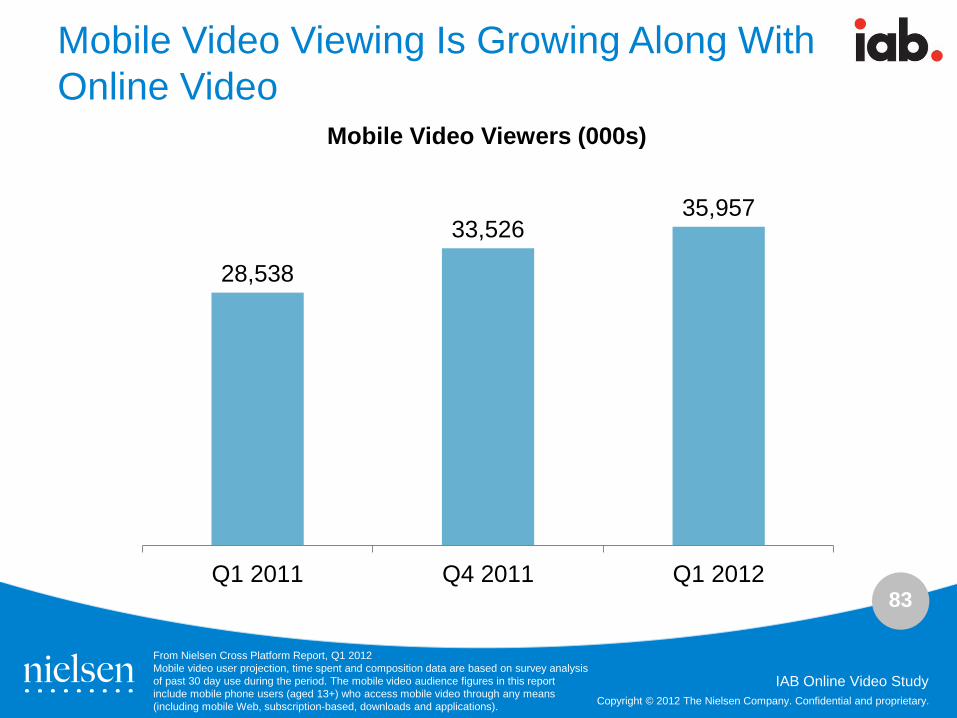
83
Copyright © 2012 The Nielsen Company. Confidential and proprietary.
IAB Online Video Study
Mobile Video Viewing Is Growing Along With Online Video
28,538
33,526 35,957
Q1 2011 Q4 2011 Q1 2012
Mobile Video Viewers (000s)
From Nielsen Cross Platform Report, Q1 2012 Mobile video user projection, time spent and composition data are based on survey analysis of past 30 day use during the period. The mobile video audience figures in this report include mobile phone users (aged 13+) who access mobile video through any means (including mobile Web, subscription-based, downloads and applications).
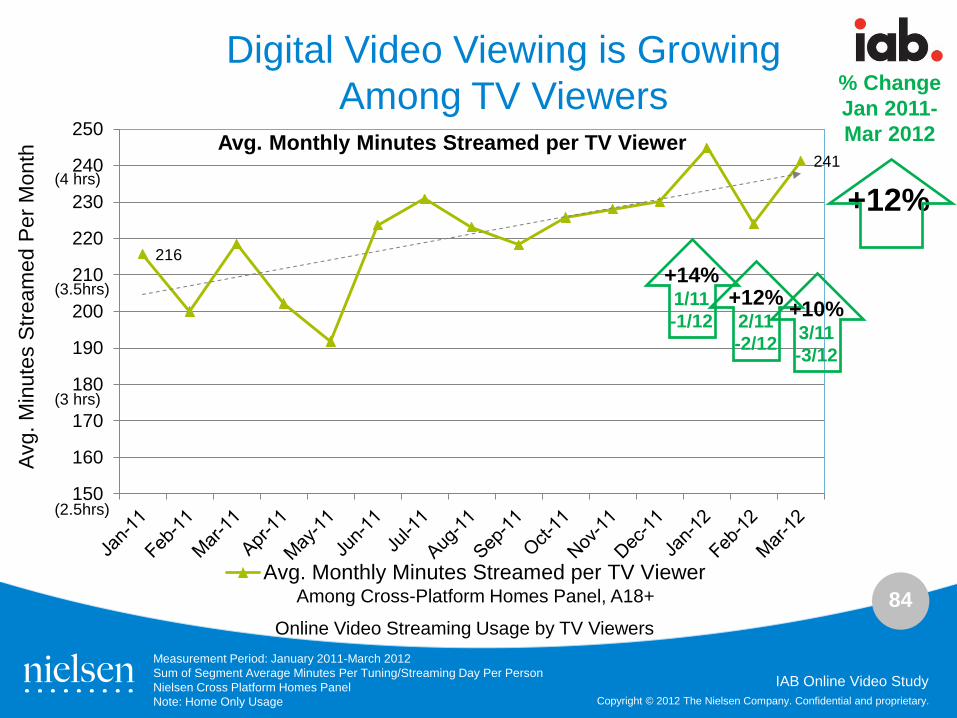
84
Copyright © 2012 The Nielsen Company. Confidential and proprietary.
IAB Online Video Study
216
241
150
160
170
180
190
200
210
220
230
240
250 Avg. Monthly Minutes Streamed per TV Viewer
Avg. Monthly Minutes Streamed per TV Viewer
Digital Video Viewing is Growing Among TV Viewers % Change
Jan 2011-Mar 2012
+12%
Avg.
Min
utes
Stre
amed
Per
Mon
th
Measurement Period: January 2011-March 2012 Sum of Segment Average Minutes Per Tuning/Streaming Day Per Person Nielsen Cross Platform Homes Panel Note: Home Only Usage
+14% 1/11 -1/12
+12% 2/11 -2/12
+10% 3/11 -3/12
Among Cross-Platform Homes Panel, A18+
Online Video Streaming Usage by TV Viewers
(4 hrs) (3.5hrs) (3 hrs) (2.5hrs)
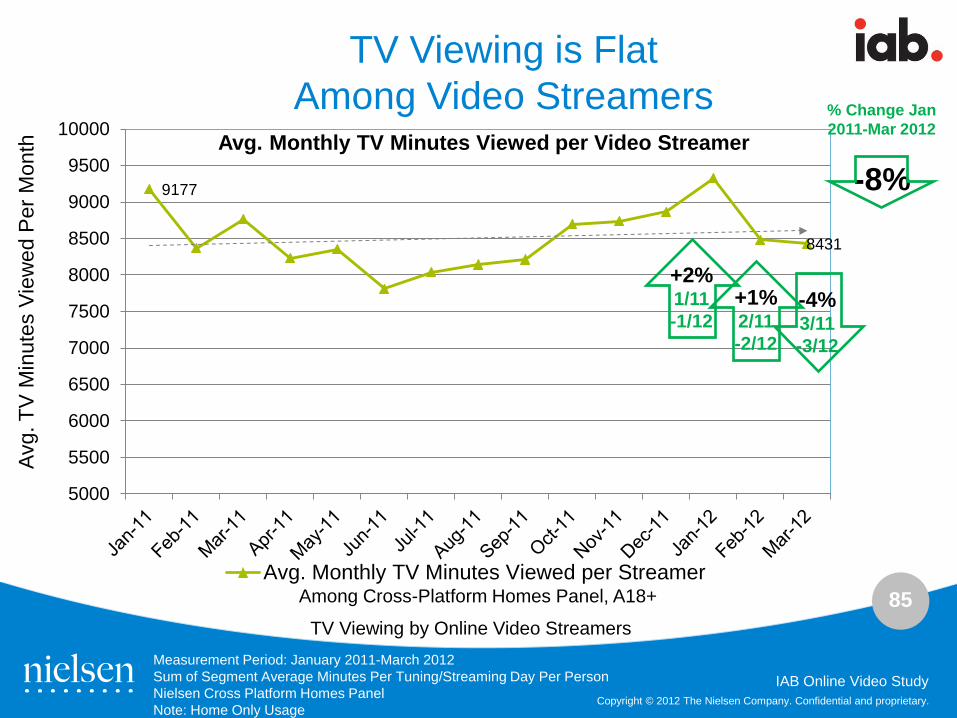
85
Copyright © 2012 The Nielsen Company. Confidential and proprietary.
IAB Online Video Study
9177
8431
5000
5500
6000
6500
7000
7500
8000
8500
9000
9500
10000 Avg. Monthly TV Minutes Viewed per Video Streamer
Avg. Monthly TV Minutes Viewed per Streamer
TV Viewing is Flat Among Video Streamers % Change Jan
2011-Mar 2012
-8%
Avg.
TV
Min
utes
Vie
wed
Per
Mon
th
Measurement Period: January 2011-March 2012 Sum of Segment Average Minutes Per Tuning/Streaming Day Per Person Nielsen Cross Platform Homes Panel Note: Home Only Usage
+2% 1/11 -1/12
+1% 2/11 -2/12
-4% 3/11 -3/12
Among Cross-Platform Homes Panel, A18+
TV Viewing by Online Video Streamers
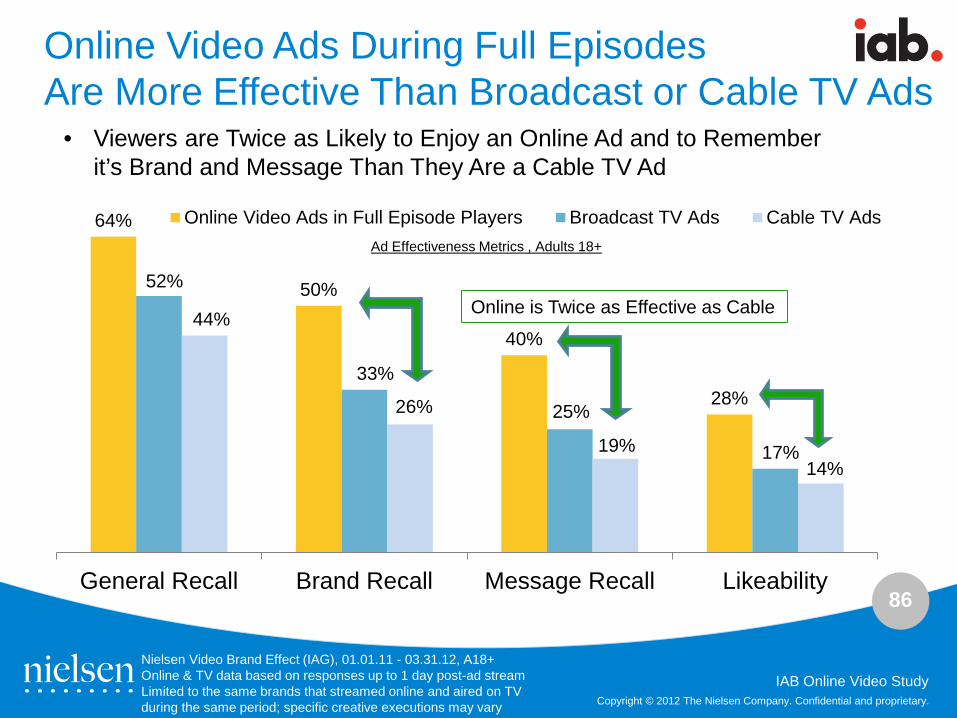
86
Copyright © 2012 The Nielsen Company. Confidential and proprietary.
IAB Online Video Study
Online Video Ads During Full Episodes Are More Effective Than Broadcast or Cable TV Ads
64%
50%
40%
28%
52%
33%
25%
17%
44%
26%
19% 14%
General Recall Brand Recall Message Recall Likeability
Online Video Ads in Full Episode Players Broadcast TV Ads Cable TV Ads
Nielsen Video Brand Effect (IAG), 01.01.11 - 03.31.12, A18+ Online & TV data based on responses up to 1 day post-ad stream Limited to the same brands that streamed online and aired on TV during the same period; specific creative executions may vary
Ad Effectiveness Metrics , Adults 18+
• Viewers are Twice as Likely to Enjoy an Online Ad and to Remember it’s Brand and Message Than They Are a Cable TV Ad
Online is Twice as Effective as Cable
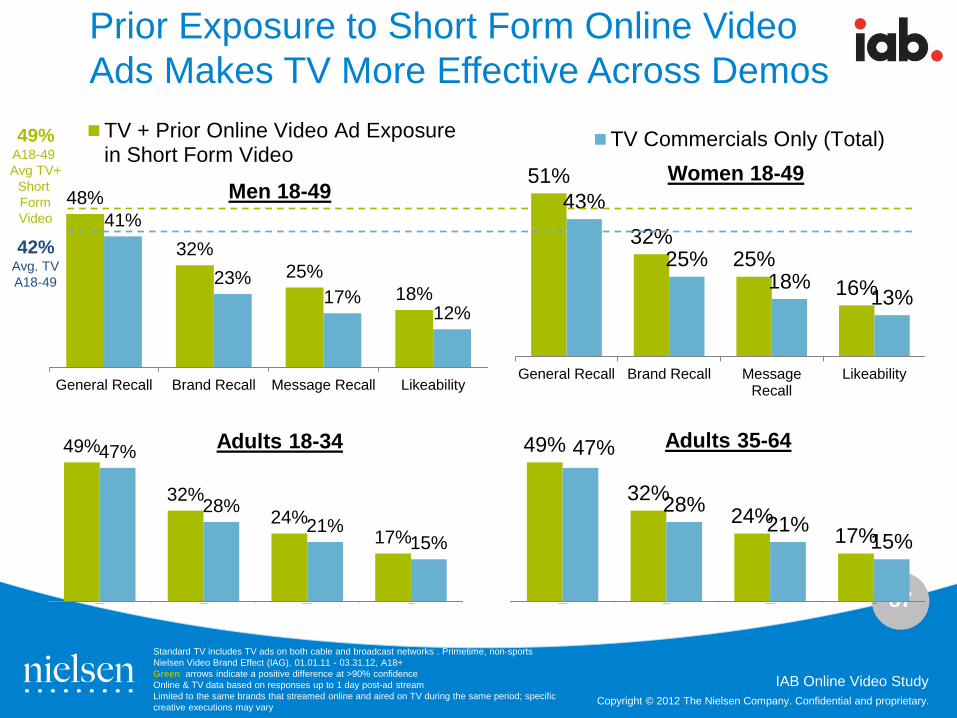
87
Copyright © 2012 The Nielsen Company. Confidential and proprietary.
IAB Online Video Study
48%
32% 25%
18%
41%
23% 17%
12%
General Recall Brand Recall Message Recall Likeability
TV + Prior Online Video Ad Exposurein Short Form Video
51%
32% 25%
16%
43%
25% 18%
13%
General Recall Brand Recall MessageRecall
Likeability
TV Commercials Only (Total)
Prior Exposure to Short Form Online Video Ads Makes TV More Effective Across Demos
Standard TV includes TV ads on both cable and broadcast networks . Primetime, non-sports Nielsen Video Brand Effect (IAG), 01.01.11 - 03.31.12, A18+ Green arrows indicate a positive difference at >90% confidence Online & TV data based on responses up to 1 day post-ad stream Limited to the same brands that streamed online and aired on TV during the same period; specific creative executions may vary
49%
32% 24%
17%
47%
28% 21%
15%
General Recall Brand Recall Message Recall Likeability
49%
32% 24%
17%
47%
28% 21%
15%
General Recall Brand Recall Message Recall Likeability
Men 18-49 Women 18-49
Adults 18-34 Adults 35-64
49% A18-49 Avg TV+
Short Form Video
42% Avg. TV A18-49
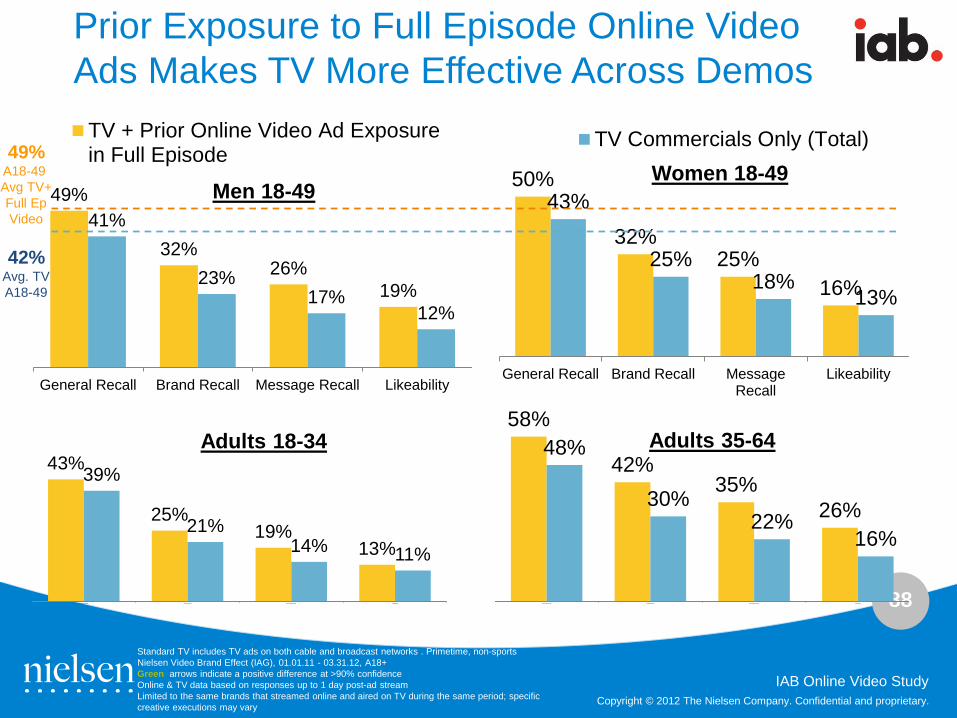
88
Copyright © 2012 The Nielsen Company. Confidential and proprietary.
IAB Online Video Study
49%
32% 26%
19%
41%
23% 17%
12%
General Recall Brand Recall Message Recall Likeability
TV + Prior Online Video Ad Exposurein Full Episode
50%
32% 25%
16%
43%
25% 18%
13%
General Recall Brand Recall MessageRecall
Likeability
TV Commercials Only (Total)
Prior Exposure to Full Episode Online Video Ads Makes TV More Effective Across Demos
Standard TV includes TV ads on both cable and broadcast networks . Primetime, non-sports Nielsen Video Brand Effect (IAG), 01.01.11 - 03.31.12, A18+ Green arrows indicate a positive difference at >90% confidence Online & TV data based on responses up to 1 day post-ad stream Limited to the same brands that streamed online and aired on TV during the same period; specific creative executions may vary
43%
25% 19%
13%
39%
21% 14% 11%
General Recall Brand Recall Message Recall Likeability
58%
42% 35%
26%
48%
30% 22%
16%
General Recall Brand Recall Message Recall Likeability
Men 18-49 Women 18-49
Adults 18-34 Adults 35-64
49% A18-49 Avg TV+ Full Ep Video
42%
Avg. TV A18-49
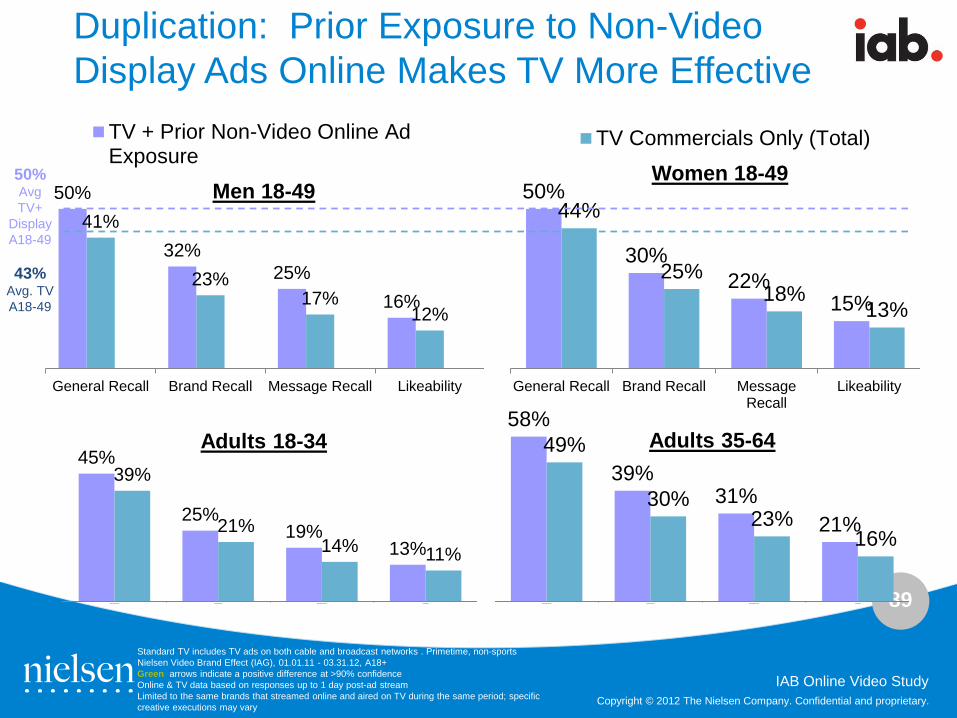
89
Copyright © 2012 The Nielsen Company. Confidential and proprietary.
IAB Online Video Study
50%
32% 25%
16%
41%
23% 17%
12%
General Recall Brand Recall Message Recall Likeability
TV + Prior Non-Video Online AdExposure
50%
30% 22%
15%
44%
25% 18%
13%
General Recall Brand Recall MessageRecall
Likeability
TV Commercials Only (Total)
Duplication: Prior Exposure to Non-Video Display Ads Online Makes TV More Effective
Standard TV includes TV ads on both cable and broadcast networks . Primetime, non-sports Nielsen Video Brand Effect (IAG), 01.01.11 - 03.31.12, A18+ Green arrows indicate a positive difference at >90% confidence Online & TV data based on responses up to 1 day post-ad stream Limited to the same brands that streamed online and aired on TV during the same period; specific creative executions may vary
45%
25% 19%
13%
39%
21% 14% 11%
General Recall Brand Recall Message Recall Likeability
58%
39% 31%
21%
49%
30% 23%
16%
General Recall Brand Recall Message Recall Likeability
Men 18-49 Women 18-49
Adults 18-34 Adults 35-64
50% Avg TV+
Display A18-49
43%
Avg. TV A18-49
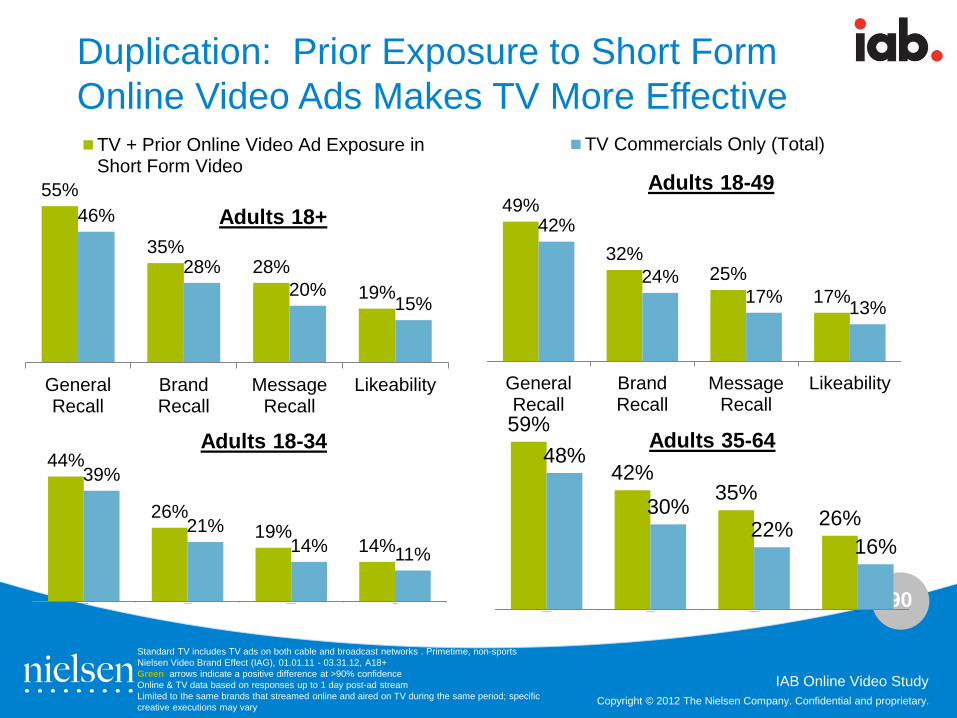
90
Copyright © 2012 The Nielsen Company. Confidential and proprietary.
IAB Online Video Study
Duplication: Prior Exposure to Short Form Online Video Ads Makes TV More Effective
Standard TV includes TV ads on both cable and broadcast networks . Primetime, non-sports Nielsen Video Brand Effect (IAG), 01.01.11 - 03.31.12, A18+ Green arrows indicate a positive difference at >90% confidence Online & TV data based on responses up to 1 day post-ad stream Limited to the same brands that streamed online and aired on TV during the same period; specific creative executions may vary
55%
35% 28%
19%
46%
28% 20%
15%
GeneralRecall
BrandRecall
MessageRecall
Likeability
TV + Prior Online Video Ad Exposure inShort Form Video
49%
32% 25%
17%
42%
24% 17% 13%
GeneralRecall
BrandRecall
MessageRecall
Likeability
TV Commercials Only (Total)
44%
26% 19%
14%
39%
21% 14% 11%
General Recall Brand Recall Message Recall Likeability
59%
42% 35%
26%
48%
30% 22%
16%
General Recall Brand Recall Message Recall Likeability
Adults 18+ Adults 18-49
Adults 18-34 Adults 35-64
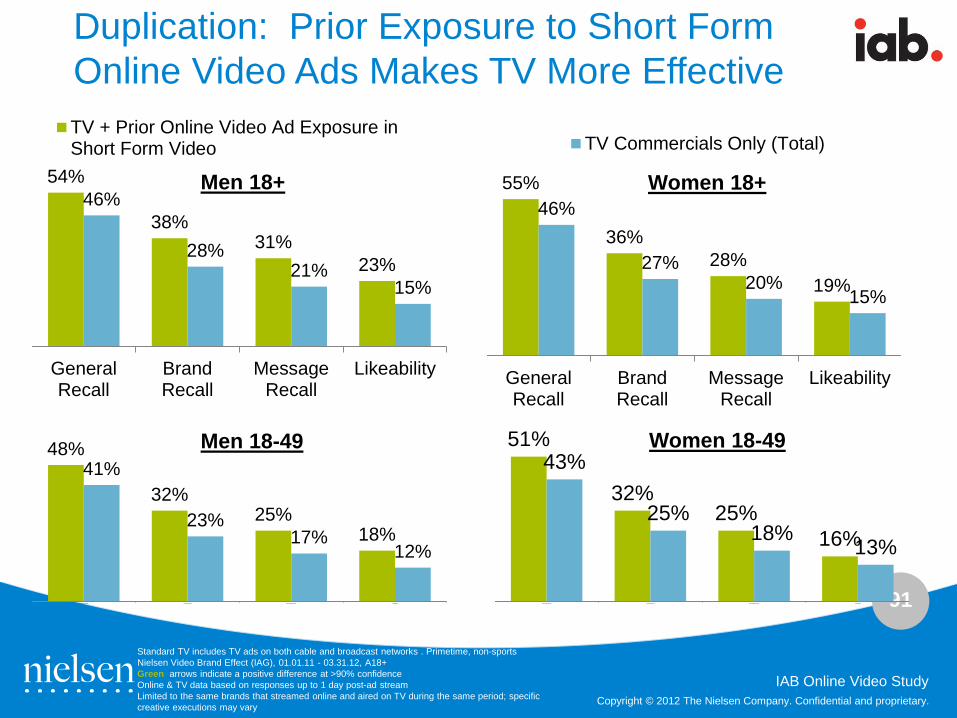
91
Copyright © 2012 The Nielsen Company. Confidential and proprietary.
IAB Online Video Study
Duplication: Prior Exposure to Short Form Online Video Ads Makes TV More Effective
Standard TV includes TV ads on both cable and broadcast networks . Primetime, non-sports Nielsen Video Brand Effect (IAG), 01.01.11 - 03.31.12, A18+ Green arrows indicate a positive difference at >90% confidence Online & TV data based on responses up to 1 day post-ad stream Limited to the same brands that streamed online and aired on TV during the same period; specific creative executions may vary
54%
38% 31%
23%
46%
28% 21%
15%
GeneralRecall
BrandRecall
MessageRecall
Likeability
TV + Prior Online Video Ad Exposure inShort Form Video
55%
36% 28%
19%
46%
27% 20%
15%
GeneralRecall
BrandRecall
MessageRecall
Likeability
TV Commercials Only (Total)
48%
32% 25%
18%
41%
23% 17%
12%
General Recall Brand Recall Message Recall Likeability
51%
32% 25%
16%
43%
25% 18%
13%
General Recall Brand Recall Message Recall Likeability
Men 18+ Women 18+
Men 18-49 Women 18-49
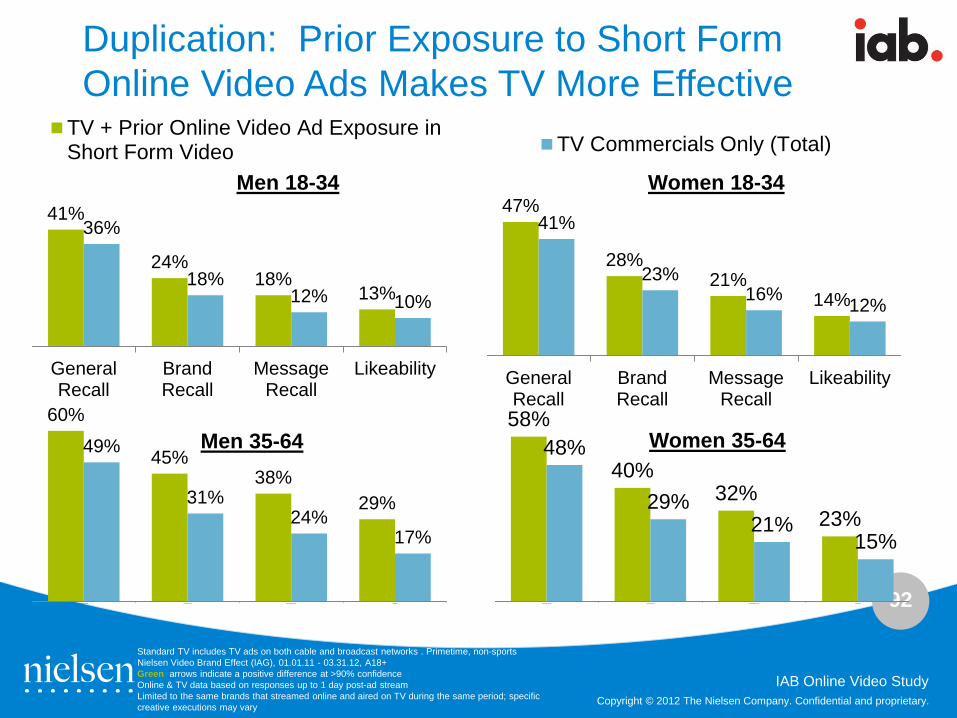
92
Copyright © 2012 The Nielsen Company. Confidential and proprietary.
IAB Online Video Study
Duplication: Prior Exposure to Short Form Online Video Ads Makes TV More Effective
Standard TV includes TV ads on both cable and broadcast networks . Primetime, non-sports Nielsen Video Brand Effect (IAG), 01.01.11 - 03.31.12, A18+ Green arrows indicate a positive difference at >90% confidence Online & TV data based on responses up to 1 day post-ad stream Limited to the same brands that streamed online and aired on TV during the same period; specific creative executions may vary
41%
24% 18%
13%
36%
18% 12% 10%
GeneralRecall
BrandRecall
MessageRecall
Likeability
TV + Prior Online Video Ad Exposure inShort Form Video
47%
28% 21%
14%
41%
23% 16% 12%
GeneralRecall
BrandRecall
MessageRecall
Likeability
TV Commercials Only (Total)
60%
45% 38%
29%
49%
31% 24%
17%
General Recall Brand Recall Message Recall Likeability
58%
40% 32%
23%
48%
29% 21%
15%
General Recall Brand Recall Message Recall Likeability
Men 18-34 Women 18-34
Men 35-64 Women 35-64
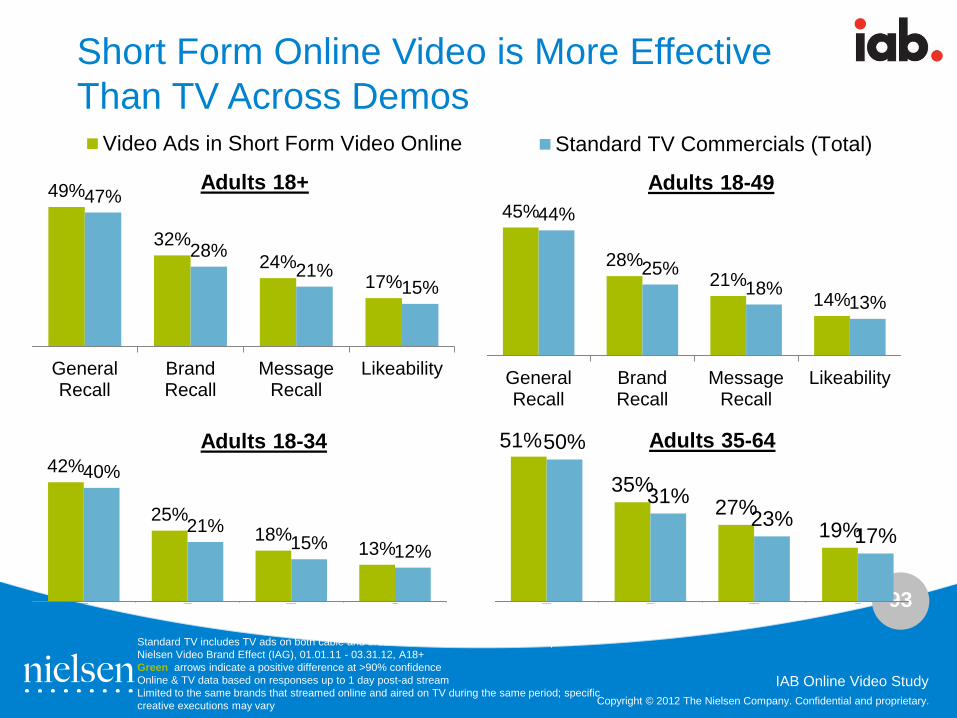
93
Copyright © 2012 The Nielsen Company. Confidential and proprietary.
IAB Online Video Study
Short Form Online Video is More Effective Than TV Across Demos
Standard TV includes TV ads on both cable and broadcast networks . Primetime, non-sports Nielsen Video Brand Effect (IAG), 01.01.11 - 03.31.12, A18+ Green arrows indicate a positive difference at >90% confidence Online & TV data based on responses up to 1 day post-ad stream Limited to the same brands that streamed online and aired on TV during the same period; specific creative executions may vary
49%
32% 24%
17%
47%
28% 21%
15%
GeneralRecall
BrandRecall
MessageRecall
Likeability
Video Ads in Short Form Video Online
45%
28% 21%
14%
44%
25% 18%
13%
GeneralRecall
BrandRecall
MessageRecall
Likeability
Standard TV Commercials (Total)
42%
25% 18%
13%
40%
21% 15% 12%
General Recall Brand Recall Message Recall Likeability
51%
35% 27%
19%
50%
31% 23%
17%
General Recall Brand Recall Message Recall Likeability
Adults 18+ Adults 18-49
Adults 18-34 Adults 35-64
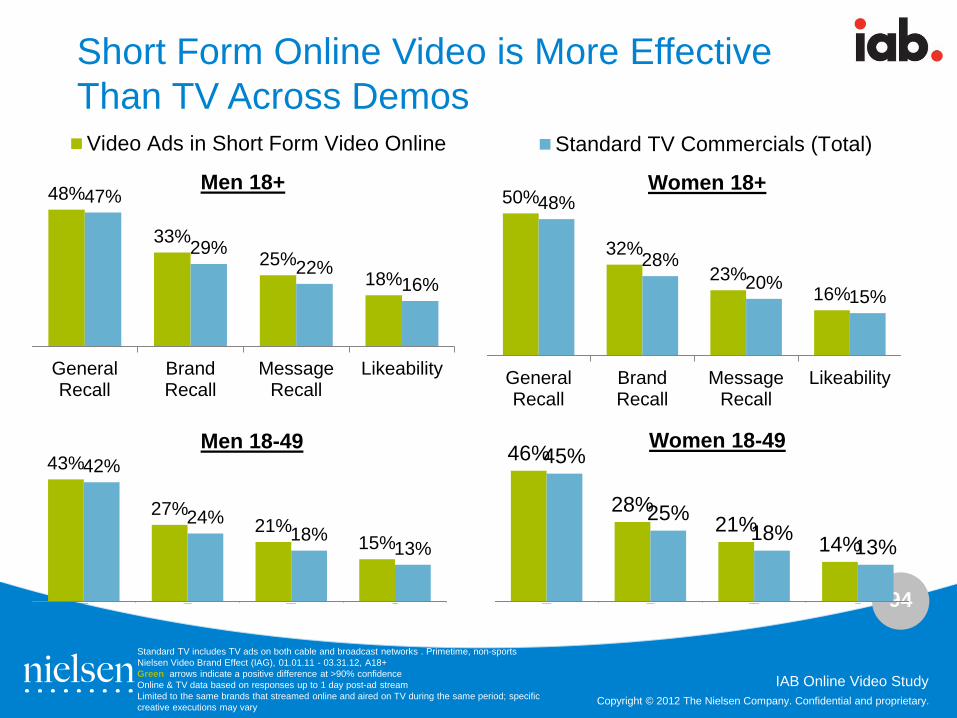
94
Copyright © 2012 The Nielsen Company. Confidential and proprietary.
IAB Online Video Study
Short Form Online Video is More Effective Than TV Across Demos
Standard TV includes TV ads on both cable and broadcast networks . Primetime, non-sports Nielsen Video Brand Effect (IAG), 01.01.11 - 03.31.12, A18+ Green arrows indicate a positive difference at >90% confidence Online & TV data based on responses up to 1 day post-ad stream Limited to the same brands that streamed online and aired on TV during the same period; specific creative executions may vary
48%
33% 25%
18%
47%
29% 22%
16%
GeneralRecall
BrandRecall
MessageRecall
Likeability
Video Ads in Short Form Video Online
50%
32% 23%
16%
48%
28% 20%
15%
GeneralRecall
BrandRecall
MessageRecall
Likeability
Standard TV Commercials (Total)
43%
27% 21%
15%
42%
24% 18%
13%
General Recall Brand Recall Message Recall Likeability
46%
28% 21%
14%
45%
25% 18%
13%
General Recall Brand Recall Message Recall Likeability
Men 18+ Women 18+
Men 18-49 Women 18-49
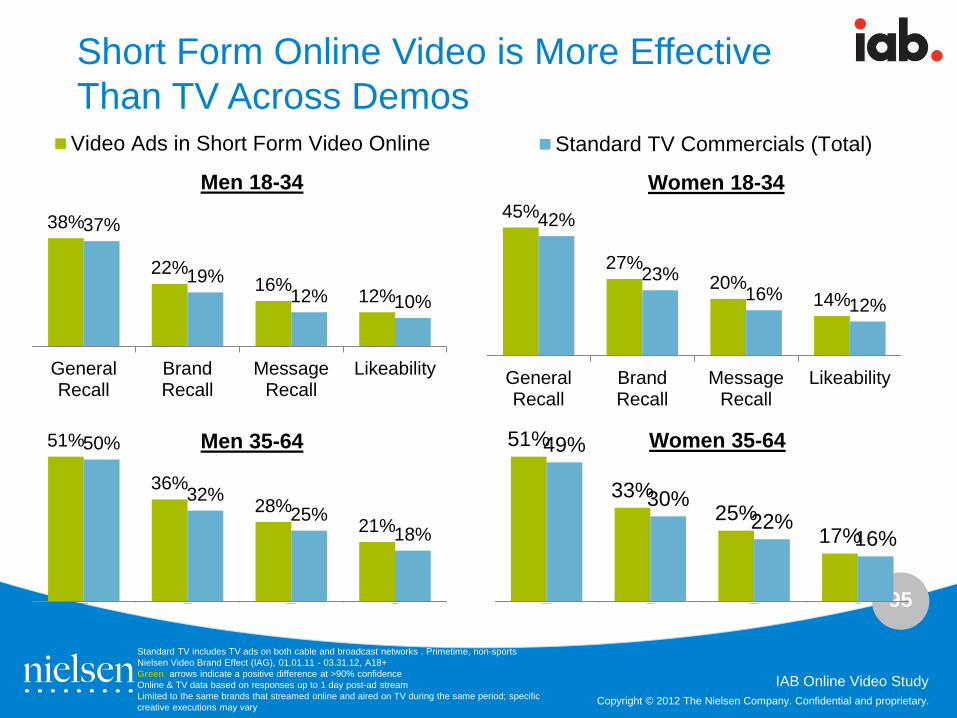
95
Copyright © 2012 The Nielsen Company. Confidential and proprietary.
IAB Online Video Study
Short Form Online Video is More Effective Than TV Across Demos
Standard TV includes TV ads on both cable and broadcast networks . Primetime, non-sports Nielsen Video Brand Effect (IAG), 01.01.11 - 03.31.12, A18+ Green arrows indicate a positive difference at >90% confidence Online & TV data based on responses up to 1 day post-ad stream Limited to the same brands that streamed online and aired on TV during the same period; specific creative executions may vary
38%
22% 16% 12%
37%
19% 12% 10%
GeneralRecall
BrandRecall
MessageRecall
Likeability
Video Ads in Short Form Video Online
45%
27% 20%
14%
42%
23% 16% 12%
GeneralRecall
BrandRecall
MessageRecall
Likeability
Standard TV Commercials (Total)
51%
36% 28%
21%
50%
32% 25%
18%
General Recall Brand Recall Message Recall Likeability
51%
33% 25%
17%
49%
30% 22%
16%
General Recall Brand Recall Message Recall Likeability
Men 18-34 Women 18-34
Men 35-64 Women 35-64
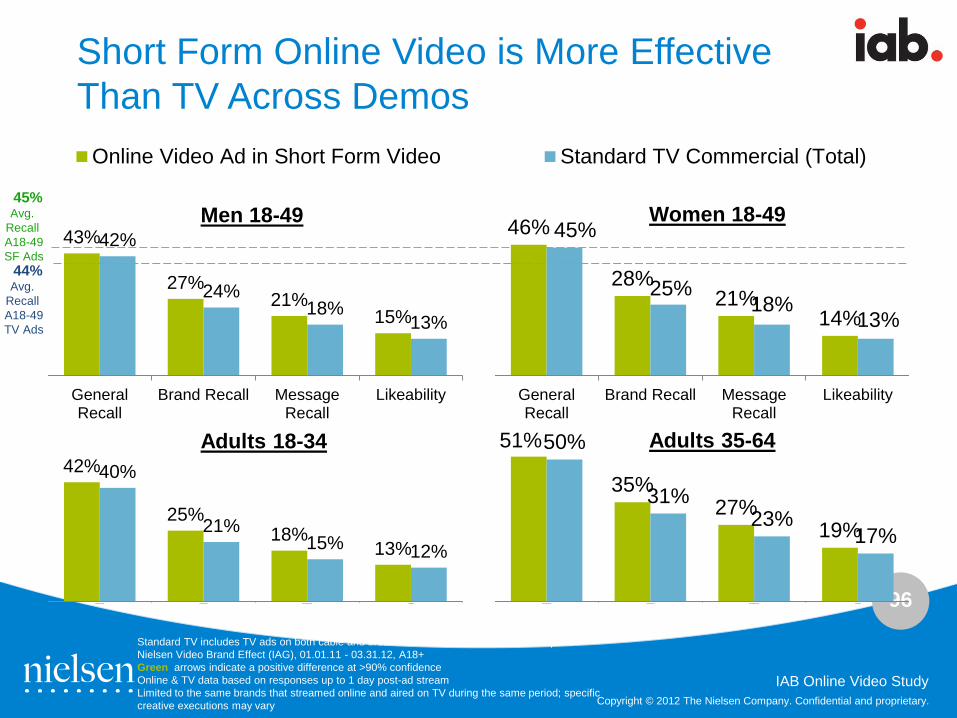
96
Copyright © 2012 The Nielsen Company. Confidential and proprietary.
IAB Online Video Study
Short Form Online Video is More Effective Than TV Across Demos
Standard TV includes TV ads on both cable and broadcast networks . Primetime, non-sports Nielsen Video Brand Effect (IAG), 01.01.11 - 03.31.12, A18+ Green arrows indicate a positive difference at >90% confidence Online & TV data based on responses up to 1 day post-ad stream Limited to the same brands that streamed online and aired on TV during the same period; specific creative executions may vary
42%
25% 18%
13%
40%
21% 15% 12%
General Recall Brand Recall Message Recall Likeability
51%
35% 27%
19%
50%
31% 23%
17%
General Recall Brand Recall Message Recall Likeability
Adults 18-34 Adults 35-64
43%
27% 21%
15%
42%
24% 18%
13%
GeneralRecall
Brand Recall MessageRecall
Likeability
Online Video Ad in Short Form Video
46%
28% 21%
14%
45%
25% 18%
13%
GeneralRecall
Brand Recall MessageRecall
Likeability
Standard TV Commercial (Total)
Men 18-49 Women 18-49 45% Avg.
Recall A18-49 SF Ads 44% Avg.
Recall A18-49 TV Ads
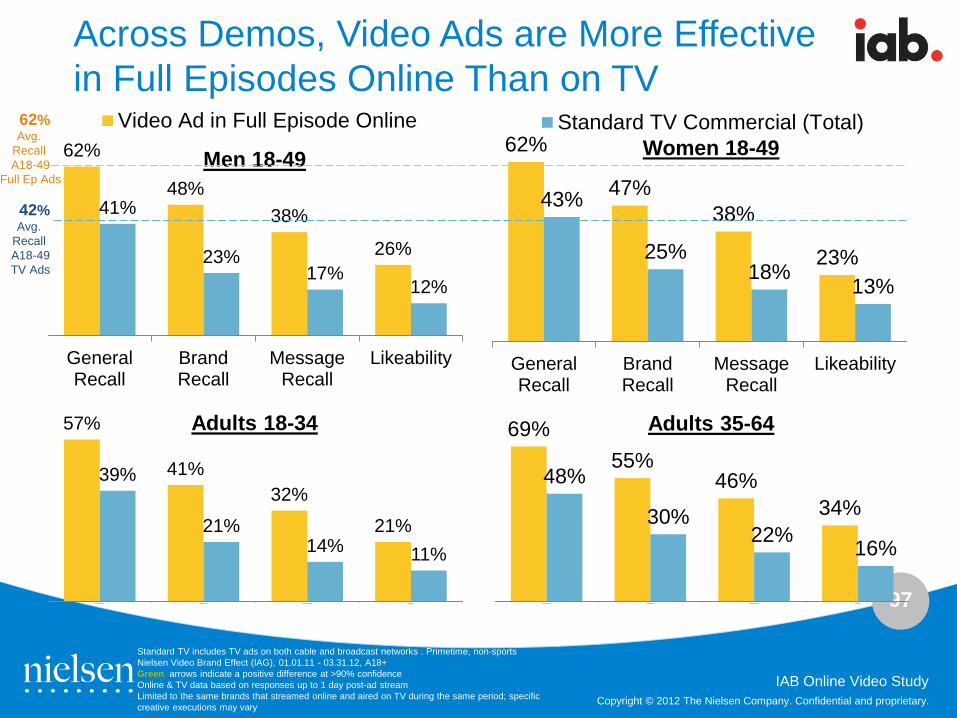
97
Copyright © 2012 The Nielsen Company. Confidential and proprietary.
IAB Online Video Study
Across Demos, Video Ads are More Effective in Full Episodes Online Than on TV
Standard TV includes TV ads on both cable and broadcast networks . Primetime, non-sports Nielsen Video Brand Effect (IAG), 01.01.11 - 03.31.12, A18+ Green arrows indicate a positive difference at >90% confidence Online & TV data based on responses up to 1 day post-ad stream Limited to the same brands that streamed online and aired on TV during the same period; specific creative executions may vary
57%
41% 32%
21%
39%
21% 14% 11%
General Recall Brand Recall Message Recall Likeability
69% 55%
46% 34%
48%
30% 22% 16%
General Recall Brand Recall Message Recall Likeability
Adults 18-34 Adults 35-64
62%
48% 38%
26%
41%
23% 17%
12%
GeneralRecall
BrandRecall
MessageRecall
Likeability
Video Ad in Full Episode Online62%
47% 38%
23%
43%
25% 18%
13%
GeneralRecall
BrandRecall
MessageRecall
Likeability
Standard TV Commercial (Total)
Men 18-49 Women 18-49 62% Avg.
Recall A18-49
Full Ep Ads
42% Avg.
Recall A18-49 TV Ads
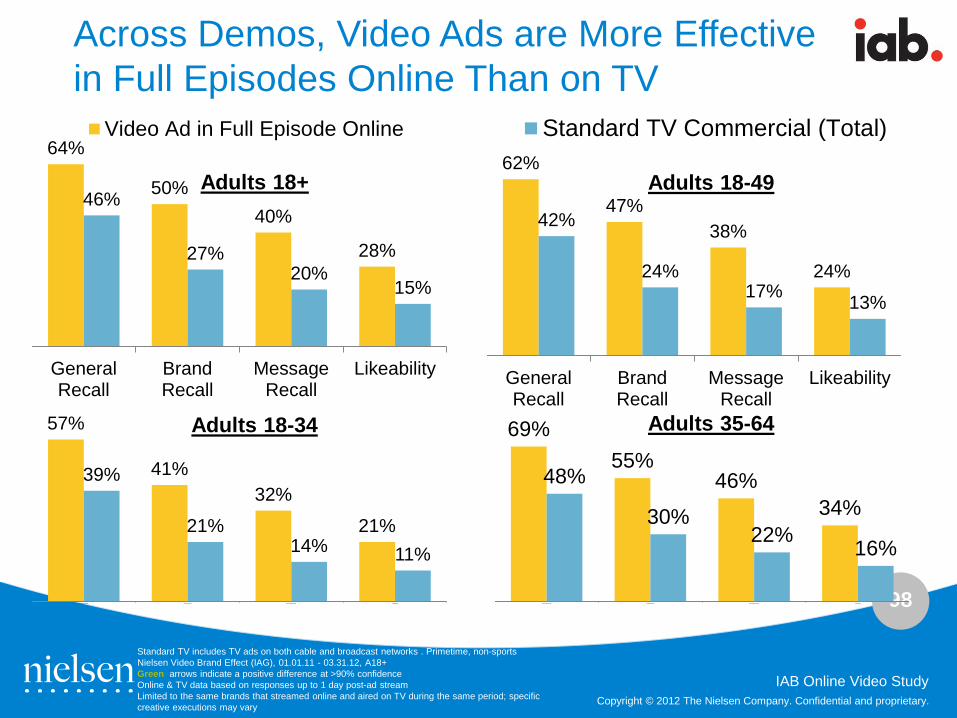
98
Copyright © 2012 The Nielsen Company. Confidential and proprietary.
IAB Online Video Study
Across Demos, Video Ads are More Effective in Full Episodes Online Than on TV
Standard TV includes TV ads on both cable and broadcast networks . Primetime, non-sports Nielsen Video Brand Effect (IAG), 01.01.11 - 03.31.12, A18+ Green arrows indicate a positive difference at >90% confidence Online & TV data based on responses up to 1 day post-ad stream Limited to the same brands that streamed online and aired on TV during the same period; specific creative executions may vary
64%
50% 40%
28%
46%
27% 20%
15%
GeneralRecall
BrandRecall
MessageRecall
Likeability
Video Ad in Full Episode Online62%
47% 38%
24%
42%
24% 17% 13%
GeneralRecall
BrandRecall
MessageRecall
Likeability
Standard TV Commercial (Total)
57%
41% 32%
21%
39%
21% 14% 11%
General Recall Brand Recall Message Recall Likeability
69% 55%
46% 34%
48%
30% 22% 16%
General Recall Brand Recall Message Recall Likeability
Adults 18+ Adults 18-49
Adults 18-34 Adults 35-64
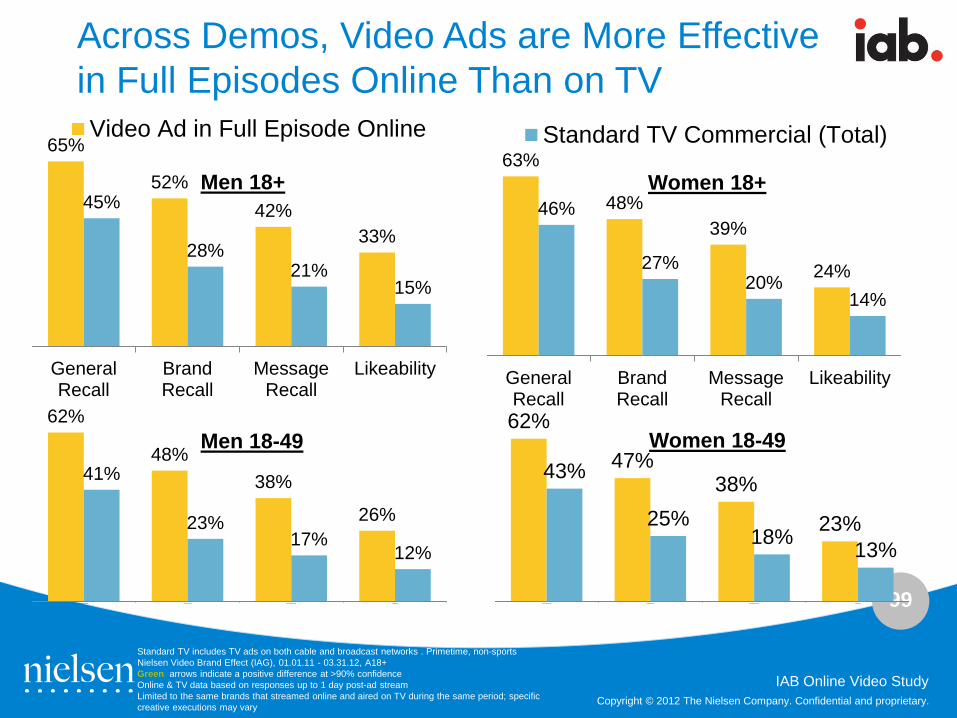
99
Copyright © 2012 The Nielsen Company. Confidential and proprietary.
IAB Online Video Study
Across Demos, Video Ads are More Effective in Full Episodes Online Than on TV
Standard TV includes TV ads on both cable and broadcast networks . Primetime, non-sports Nielsen Video Brand Effect (IAG), 01.01.11 - 03.31.12, A18+ Green arrows indicate a positive difference at >90% confidence Online & TV data based on responses up to 1 day post-ad stream Limited to the same brands that streamed online and aired on TV during the same period; specific creative executions may vary
65%
52% 42%
33%
45%
28% 21%
15%
GeneralRecall
BrandRecall
MessageRecall
Likeability
Video Ad in Full Episode Online63%
48% 39%
24%
46%
27% 20%
14%
GeneralRecall
BrandRecall
MessageRecall
Likeability
Standard TV Commercial (Total)
62%
48% 38%
26%
41%
23% 17%
12%
General Recall Brand Recall Message Recall Likeability
62%
47% 38%
23%
43%
25% 18% 13%
General Recall Brand Recall Message Recall Likeability
Men 18+ Women 18+
Men 18-49 Women 18-49
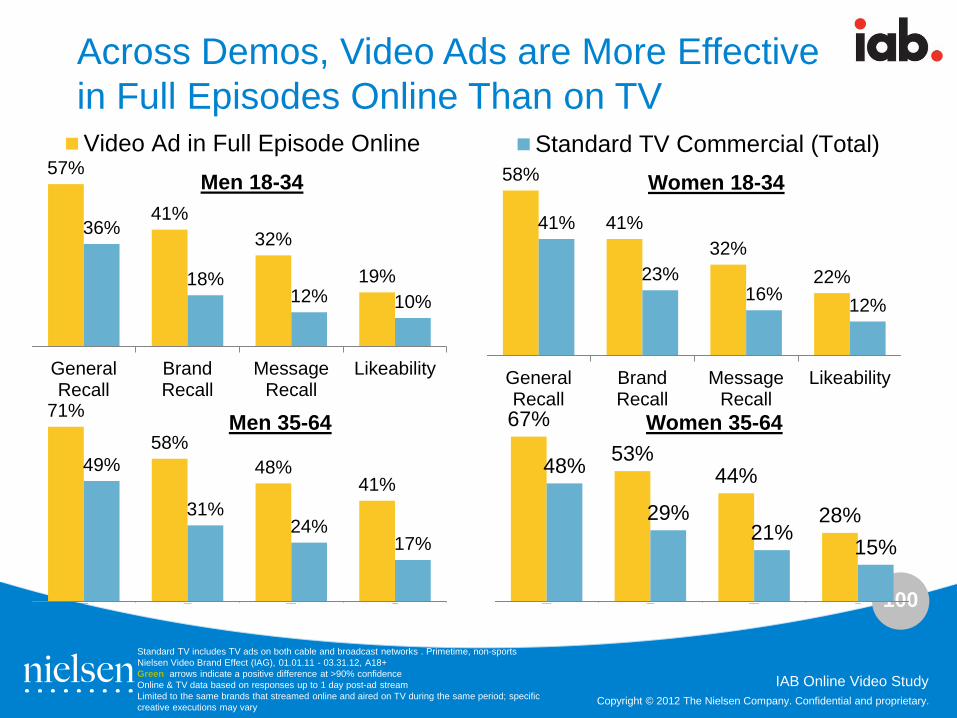
100
Copyright © 2012 The Nielsen Company. Confidential and proprietary.
IAB Online Video Study
Across Demos, Video Ads are More Effective in Full Episodes Online Than on TV
Standard TV includes TV ads on both cable and broadcast networks . Primetime, non-sports Nielsen Video Brand Effect (IAG), 01.01.11 - 03.31.12, A18+ Green arrows indicate a positive difference at >90% confidence Online & TV data based on responses up to 1 day post-ad stream Limited to the same brands that streamed online and aired on TV during the same period; specific creative executions may vary
57%
41% 32%
19%
36%
18% 12% 10%
GeneralRecall
BrandRecall
MessageRecall
Likeability
Video Ad in Full Episode Online58%
41% 32%
22%
41%
23% 16% 12%
GeneralRecall
BrandRecall
MessageRecall
Likeability
Standard TV Commercial (Total)
71%
58% 48%
41% 49%
31% 24%
17%
General Recall Brand Recall Message Recall Likeability
67% 53%
44%
28%
48%
29% 21%
15%
General Recall Brand Recall Message Recall Likeability
Men 18-34 Women 18-34
Men 35-64 Women 35-64
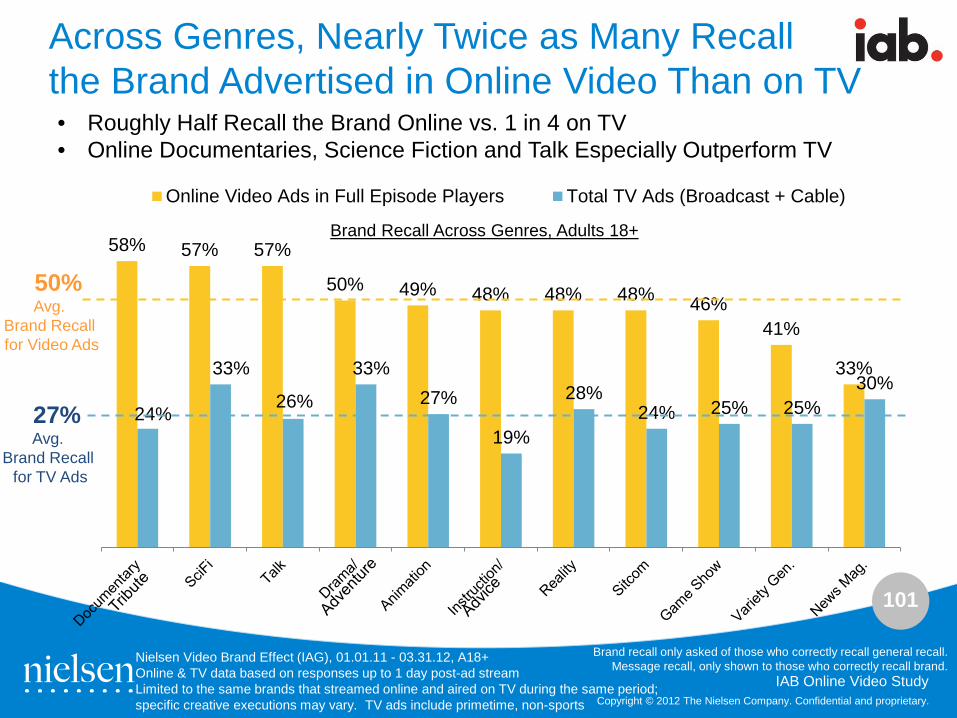
101
Copyright © 2012 The Nielsen Company. Confidential and proprietary.
IAB Online Video Study
Across Genres, Nearly Twice as Many Recall the Brand Advertised in Online Video Than on TV
58% 57% 57%
50% 49% 48% 48% 48% 46% 41%
33%
24%
33%
26%
33% 27%
19%
28% 24% 25% 25%
30%
Online Video Ads in Full Episode Players Total TV Ads (Broadcast + Cable)
Nielsen Video Brand Effect (IAG), 01.01.11 - 03.31.12, A18+ Online & TV data based on responses up to 1 day post-ad stream Limited to the same brands that streamed online and aired on TV during the same period; specific creative executions may vary. TV ads include primetime, non-sports
Brand Recall Across Genres, Adults 18+
50% Avg.
Brand Recall for Video Ads
27% Avg.
Brand Recall for TV Ads
• Roughly Half Recall the Brand Online vs. 1 in 4 on TV • Online Documentaries, Science Fiction and Talk Especially Outperform TV
Brand recall only asked of those who correctly recall general recall. Message recall, only shown to those who correctly recall brand.
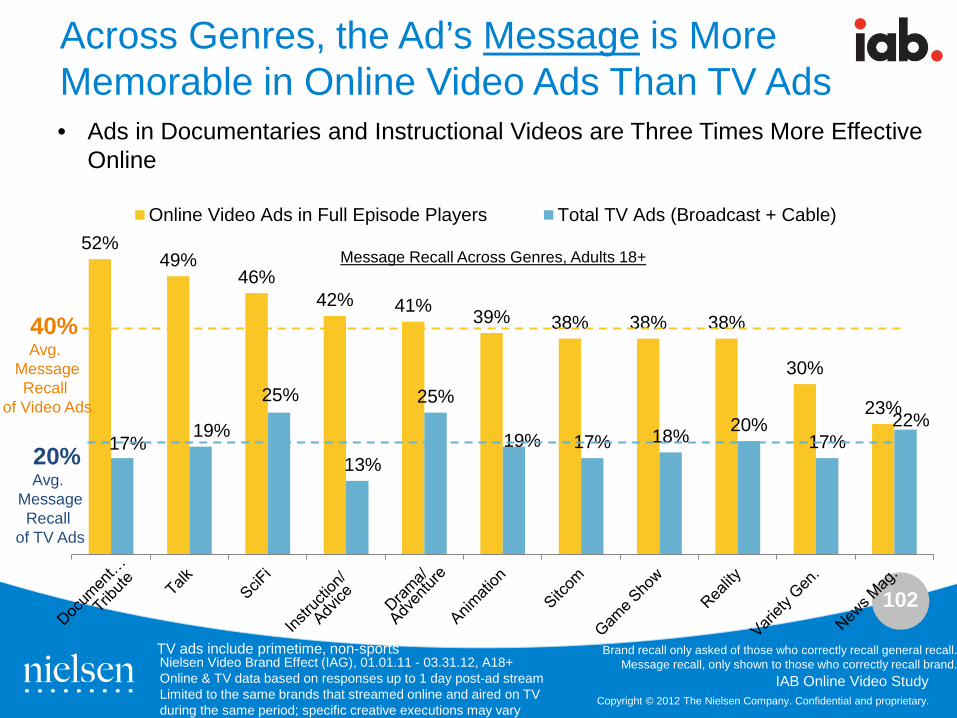
102
Copyright © 2012 The Nielsen Company. Confidential and proprietary.
IAB Online Video Study
Across Genres, the Ad’s Message is More Memorable in Online Video Ads Than TV Ads
52% 49%
46% 42% 41% 39% 38% 38% 38%
30%
23%
17% 19%
25%
13%
25%
19% 17% 18% 20% 17%
22%
Online Video Ads in Full Episode Players Total TV Ads (Broadcast + Cable)
Nielsen Video Brand Effect (IAG), 01.01.11 - 03.31.12, A18+ Online & TV data based on responses up to 1 day post-ad stream Limited to the same brands that streamed online and aired on TV during the same period; specific creative executions may vary
Message Recall Across Genres, Adults 18+
40% Avg.
Message Recall
of Video Ads
20% Avg.
Message Recall
of TV Ads
• Ads in Documentaries and Instructional Videos are Three Times More Effective Online
TV ads include primetime, non-sports Brand recall only asked of those who correctly recall general recall. Message recall, only shown to those who correctly recall brand.
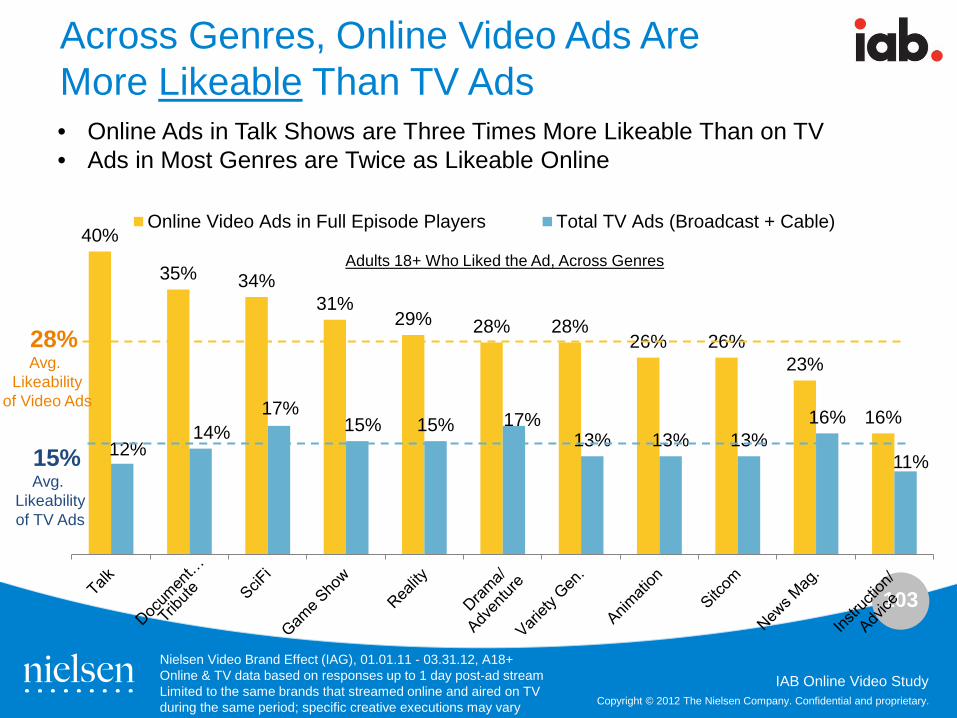
103
Copyright © 2012 The Nielsen Company. Confidential and proprietary.
IAB Online Video Study
Across Genres, Online Video Ads Are More Likeable Than TV Ads
40%
35% 34% 31%
29% 28% 28% 26% 26%
23%
16%
12% 14%
17% 15% 15% 17%
13% 13% 13% 16%
11%
Online Video Ads in Full Episode Players Total TV Ads (Broadcast + Cable)
Nielsen Video Brand Effect (IAG), 01.01.11 - 03.31.12, A18+ Online & TV data based on responses up to 1 day post-ad stream Limited to the same brands that streamed online and aired on TV during the same period; specific creative executions may vary
Adults 18+ Who Liked the Ad, Across Genres
28% Avg.
Likeability of Video Ads
15% Avg.
Likeability of TV Ads
• Online Ads in Talk Shows are Three Times More Likeable Than on TV • Ads in Most Genres are Twice as Likeable Online
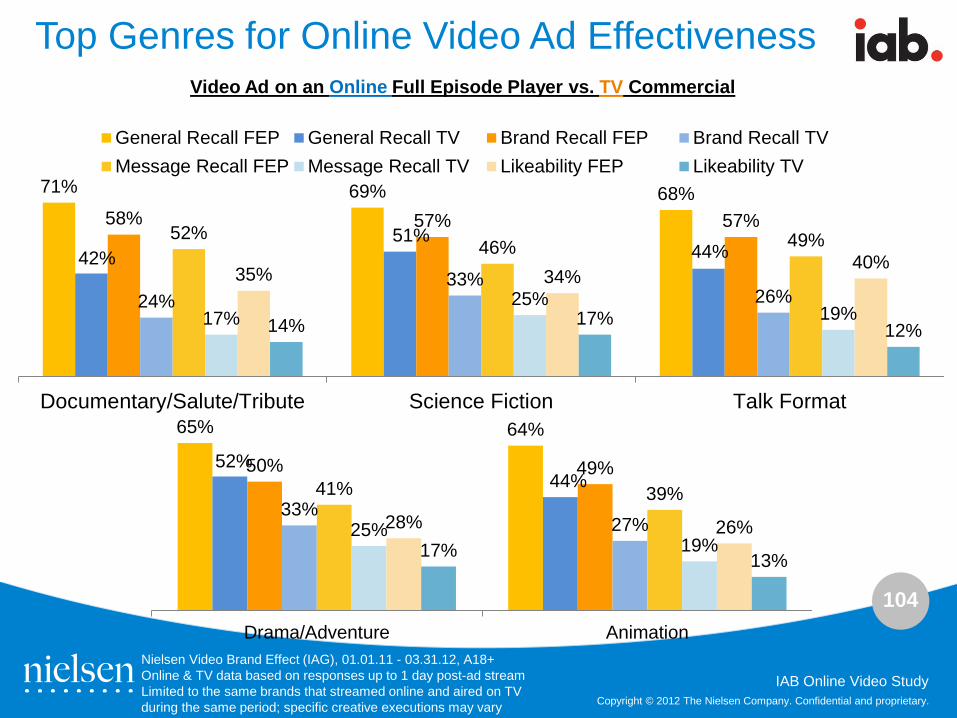
104
Copyright © 2012 The Nielsen Company. Confidential and proprietary.
IAB Online Video Study
Top Genres for Online Video Ad Effectiveness
Nielsen Video Brand Effect (IAG), 01.01.11 - 03.31.12, A18+ Online & TV data based on responses up to 1 day post-ad stream Limited to the same brands that streamed online and aired on TV during the same period; specific creative executions may vary
71% 69% 68%
42% 51%
44%
58% 57% 57%
24% 33%
26%
52% 46% 49%
17% 25%
19%
35% 34% 40%
14% 17% 12%
Documentary/Salute/Tribute Science Fiction Talk Format
General Recall FEP General Recall TV Brand Recall FEP Brand Recall TVMessage Recall FEP Message Recall TV Likeability FEP Likeability TV
Video Ad on an Online Full Episode Player vs. TV Commercial
65% 64%
52% 44%
50% 49%
33% 27%
41% 39%
25% 19%
28% 26% 17% 13%
Drama/Adventure Animation
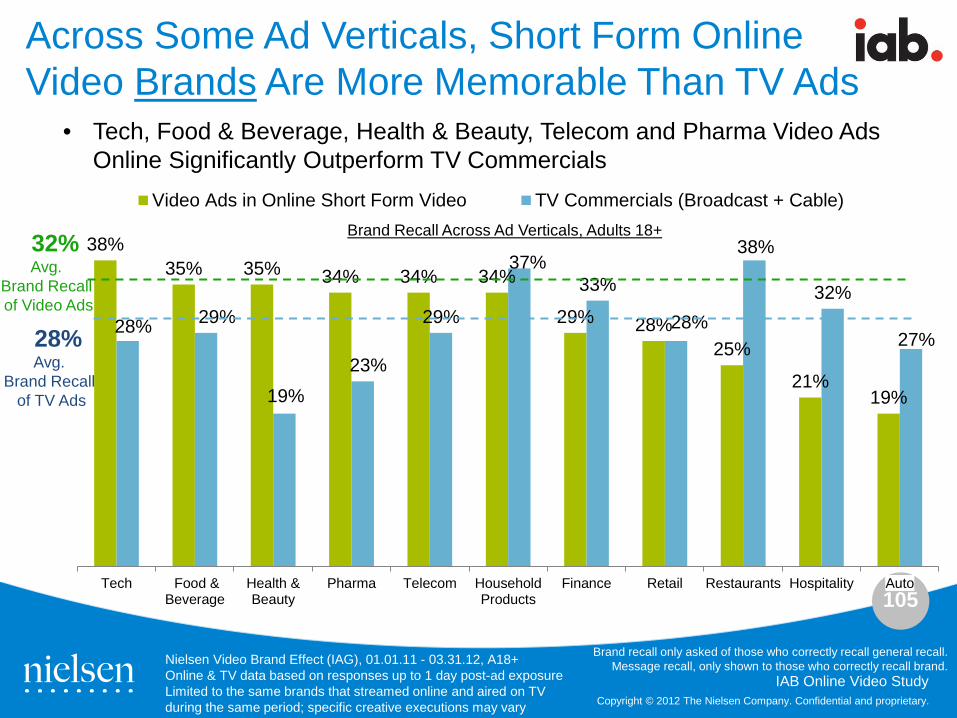
105
Copyright © 2012 The Nielsen Company. Confidential and proprietary.
IAB Online Video Study
Across Some Ad Verticals, Short Form Online Video Brands Are More Memorable Than TV Ads
38% 35% 35% 34% 34% 34%
29% 28% 25%
21% 19%
28% 29%
19% 23%
29%
37% 33%
28%
38%
32%
27%
Tech Food &Beverage
Health &Beauty
Pharma Telecom HouseholdProducts
Finance Retail Restaurants Hospitality Auto
Video Ads in Online Short Form Video TV Commercials (Broadcast + Cable)
Nielsen Video Brand Effect (IAG), 01.01.11 - 03.31.12, A18+ Online & TV data based on responses up to 1 day post-ad exposure Limited to the same brands that streamed online and aired on TV during the same period; specific creative executions may vary
Brand Recall Across Ad Verticals, Adults 18+ 32% Avg.
Brand Recall of Video Ads
28% Avg.
Brand Recall of TV Ads
• Tech, Food & Beverage, Health & Beauty, Telecom and Pharma Video Ads Online Significantly Outperform TV Commercials
Brand recall only asked of those who correctly recall general recall. Message recall, only shown to those who correctly recall brand.
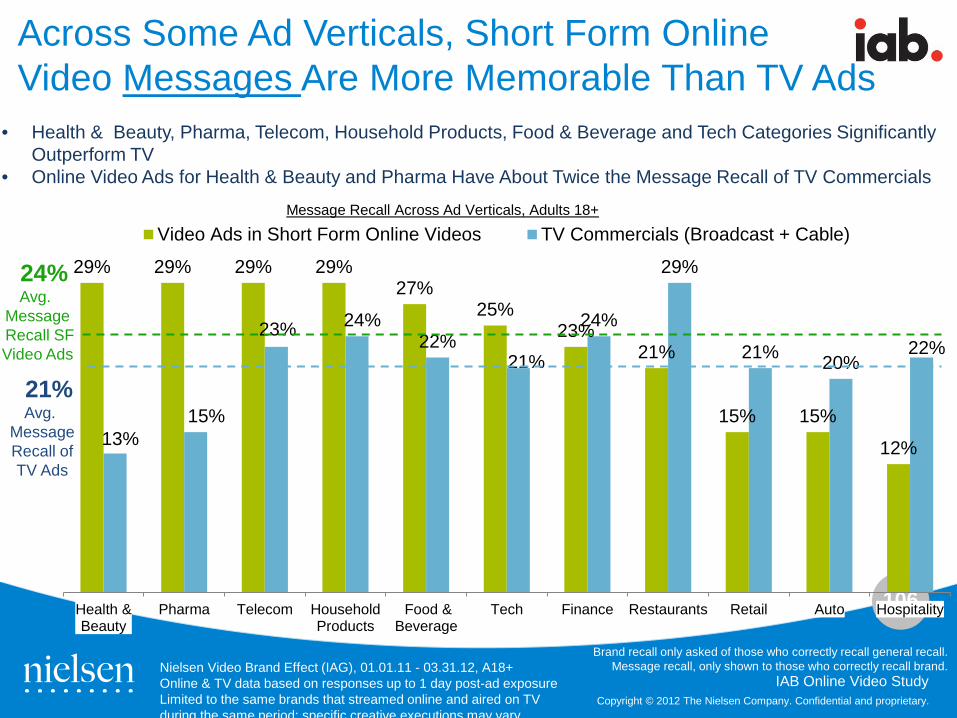
106
Copyright © 2012 The Nielsen Company. Confidential and proprietary.
IAB Online Video Study
Across Some Ad Verticals, Short Form Online Video Messages Are More Memorable Than TV Ads
29% 29% 29% 29% 27%
25% 23%
21%
15% 15%
12% 13% 15%
23% 24% 22%
21%
24%
29%
21% 20% 22%
Health &Beauty
Pharma Telecom HouseholdProducts
Food &Beverage
Tech Finance Restaurants Retail Auto Hospitality
Video Ads in Short Form Online Videos TV Commercials (Broadcast + Cable)
Nielsen Video Brand Effect (IAG), 01.01.11 - 03.31.12, A18+ Online & TV data based on responses up to 1 day post-ad exposure Limited to the same brands that streamed online and aired on TV during the same period; specific creative executions may vary
Message Recall Across Ad Verticals, Adults 18+
24% Avg.
Message Recall SF Video Ads
21% Avg.
Message Recall of
TV Ads
• Health & Beauty, Pharma, Telecom, Household Products, Food & Beverage and Tech Categories Significantly Outperform TV
• Online Video Ads for Health & Beauty and Pharma Have About Twice the Message Recall of TV Commercials
Brand recall only asked of those who correctly recall general recall. Message recall, only shown to those who correctly recall brand.
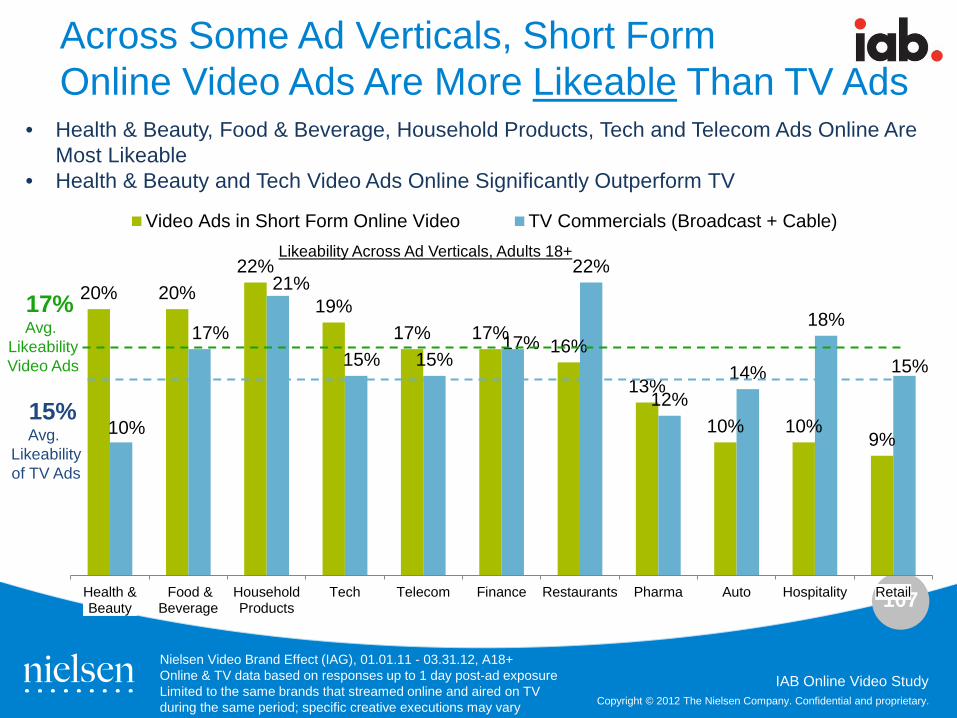
107
Copyright © 2012 The Nielsen Company. Confidential and proprietary.
IAB Online Video Study
Across Some Ad Verticals, Short Form Online Video Ads Are More Likeable Than TV Ads
20% 20% 22%
19% 17% 17%
16%
13%
10% 10% 9% 10%
17%
21%
15% 15% 17%
22%
12% 14%
18%
15%
Health &Beauty
Food &Beverage
HouseholdProducts
Tech Telecom Finance Restaurants Pharma Auto Hospitality Retail
Video Ads in Short Form Online Video TV Commercials (Broadcast + Cable)
Nielsen Video Brand Effect (IAG), 01.01.11 - 03.31.12, A18+ Online & TV data based on responses up to 1 day post-ad exposure Limited to the same brands that streamed online and aired on TV during the same period; specific creative executions may vary
Likeability Across Ad Verticals, Adults 18+
17% Avg.
Likeability Video Ads
15% Avg.
Likeability of TV Ads
• Health & Beauty, Food & Beverage, Household Products, Tech and Telecom Ads Online Are Most Likeable
• Health & Beauty and Tech Video Ads Online Significantly Outperform TV
108
Copyright © 2012 The Nielsen Company. Confidential and proprietary.
IAB Online Video Study Copyright © 2012 The Nielsen Company. Confidential and proprietary.
Methodology Overviews
109
Copyright © 2012 The Nielsen Company. Confidential and proprietary.
IAB Online Video Study
Nielsen Panel Methodologies
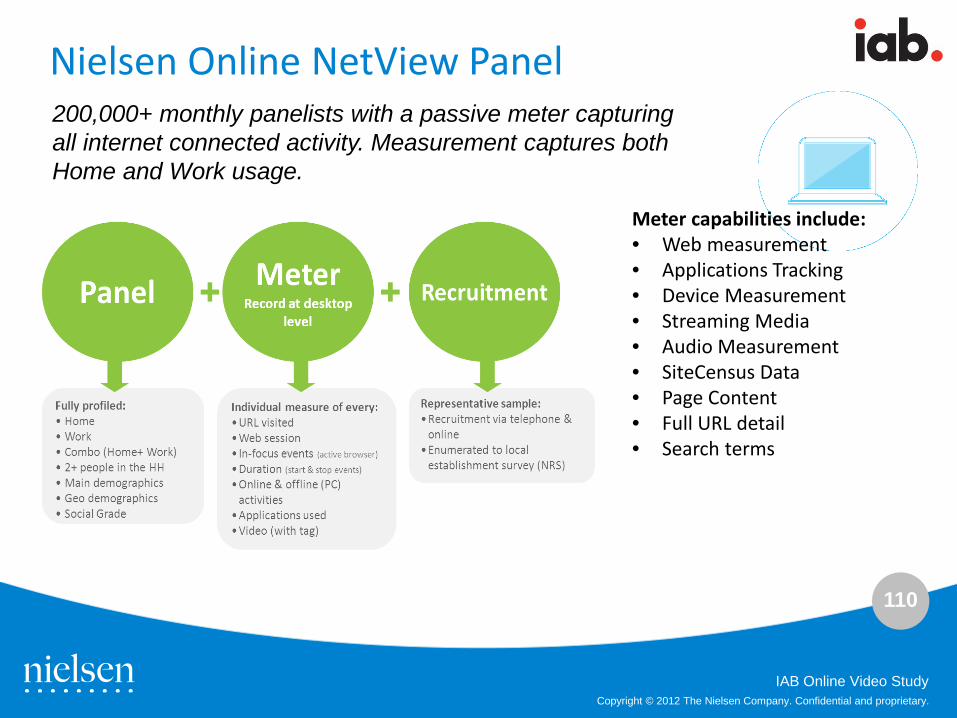
110
Copyright © 2012 The Nielsen Company. Confidential and proprietary.
IAB Online Video Study
Meter capabilities include: • Web measurement • Applications Tracking • Device Measurement • Streaming Media • Audio Measurement • SiteCensus Data • Page Content • Full URL detail • Search terms
Nielsen Online NetView Panel 200,000+ monthly panelists with a passive meter capturing all internet connected activity. Measurement captures both Home and Work usage.
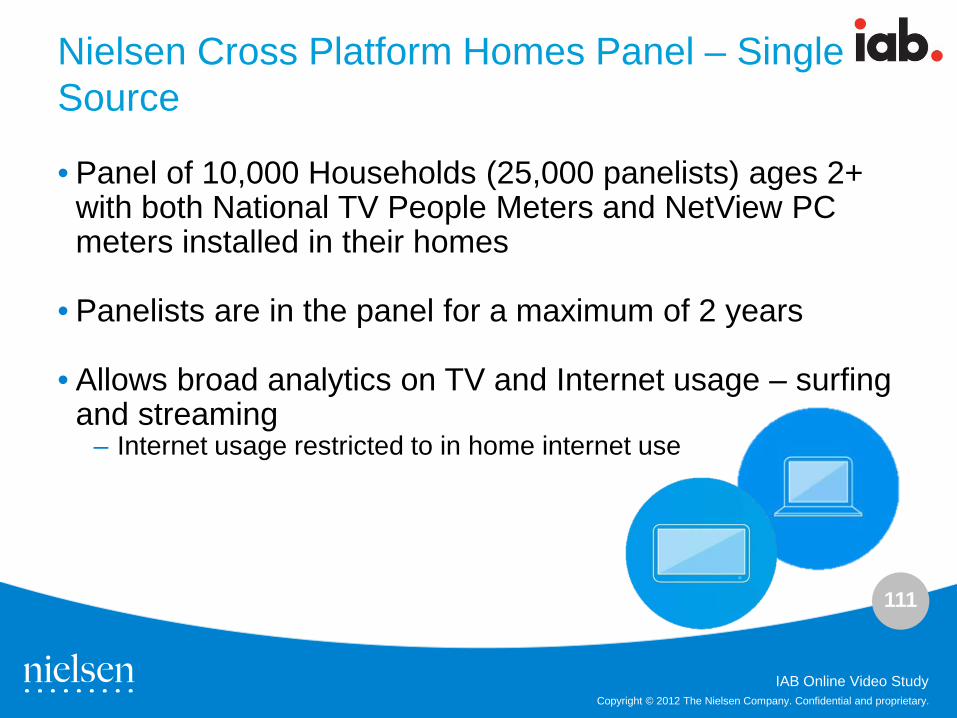
111
Copyright © 2012 The Nielsen Company. Confidential and proprietary.
IAB Online Video Study
Nielsen Cross Platform Homes Panel – Single Source
• Panel of 10,000 Households (25,000 panelists) ages 2+ with both National TV People Meters and NetView PC meters installed in their homes
• Panelists are in the panel for a maximum of 2 years • Allows broad analytics on TV and Internet usage – surfing
and streaming – Internet usage restricted to in home internet use
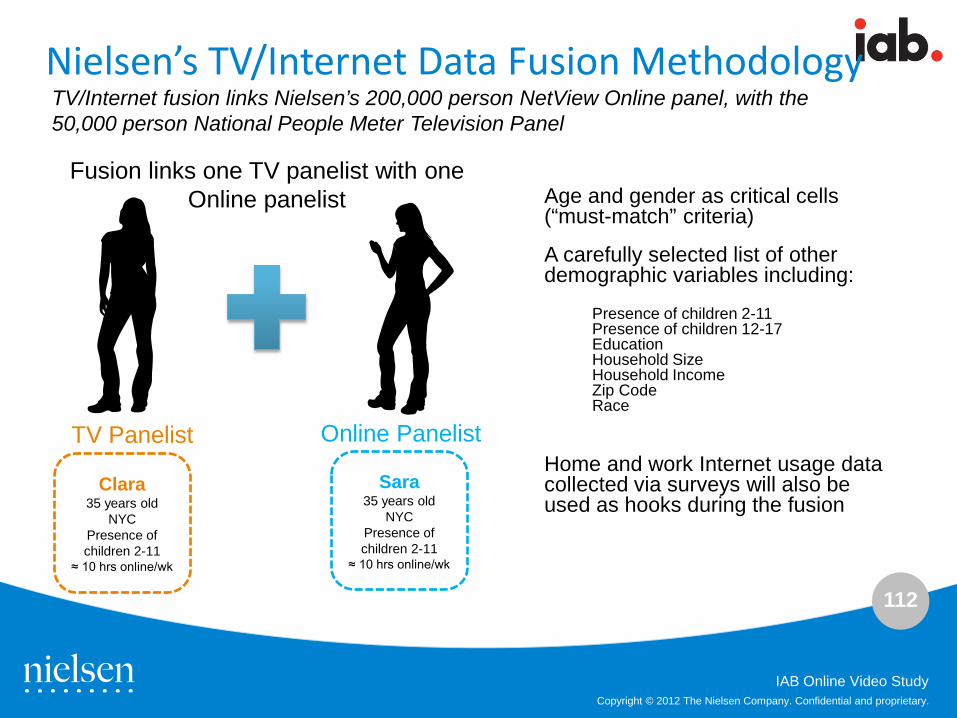
112
Copyright © 2012 The Nielsen Company. Confidential and proprietary.
IAB Online Video Study
Nielsen’s TV/Internet Data Fusion Methodology
Fusion links one TV panelist with one Online panelist
Clara 35 years old
NYC Presence of children 2-11
≈ 10 hrs online/wk
Sara 35 years old
NYC Presence of children 2-11
≈ 10 hrs online/wk
TV Panelist Online Panelist
Age and gender as critical cells (“must-match” criteria)
A carefully selected list of other demographic variables including:
Presence of children 2-11 Presence of children 12-17 Education Household Size Household Income Zip Code Race
Home and work Internet usage data collected via surveys will also be used as hooks during the fusion
TV/Internet fusion links Nielsen’s 200,000 person NetView Online panel, with the 50,000 person National People Meter Television Panel
113
Copyright © 2012 The Nielsen Company. Confidential and proprietary.
IAB Online Video Study
Video Brand Effect Methodology
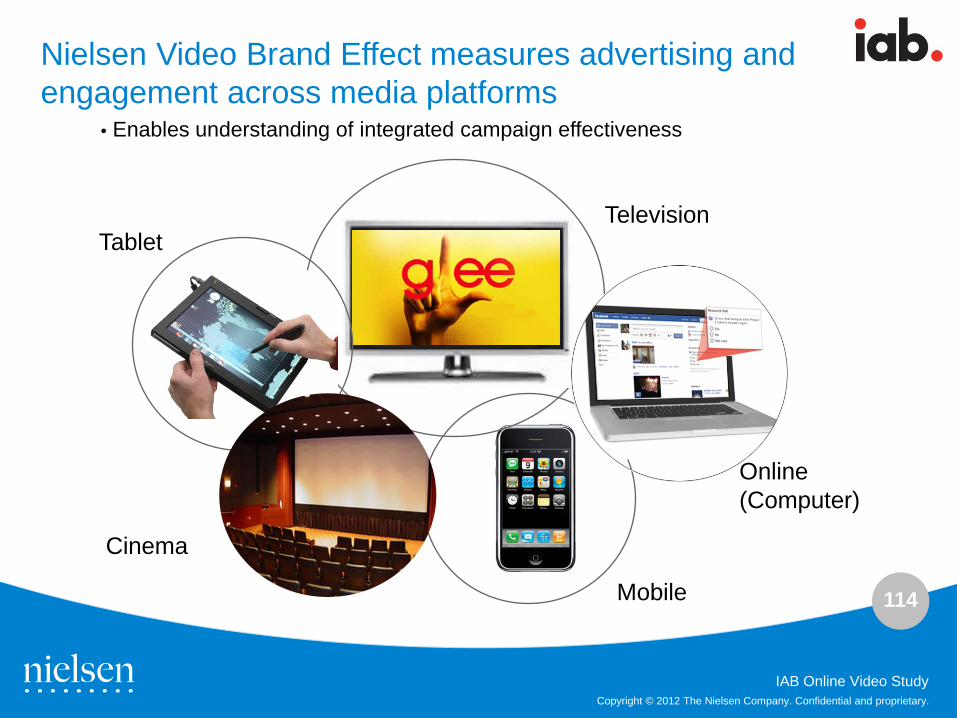
114
Copyright © 2012 The Nielsen Company. Confidential and proprietary.
IAB Online Video Study
Nielsen Video Brand Effect measures advertising and engagement across media platforms
Television
Online (Computer)
Cinema
Mobile
Tablet
• Enables understanding of integrated campaign effectiveness
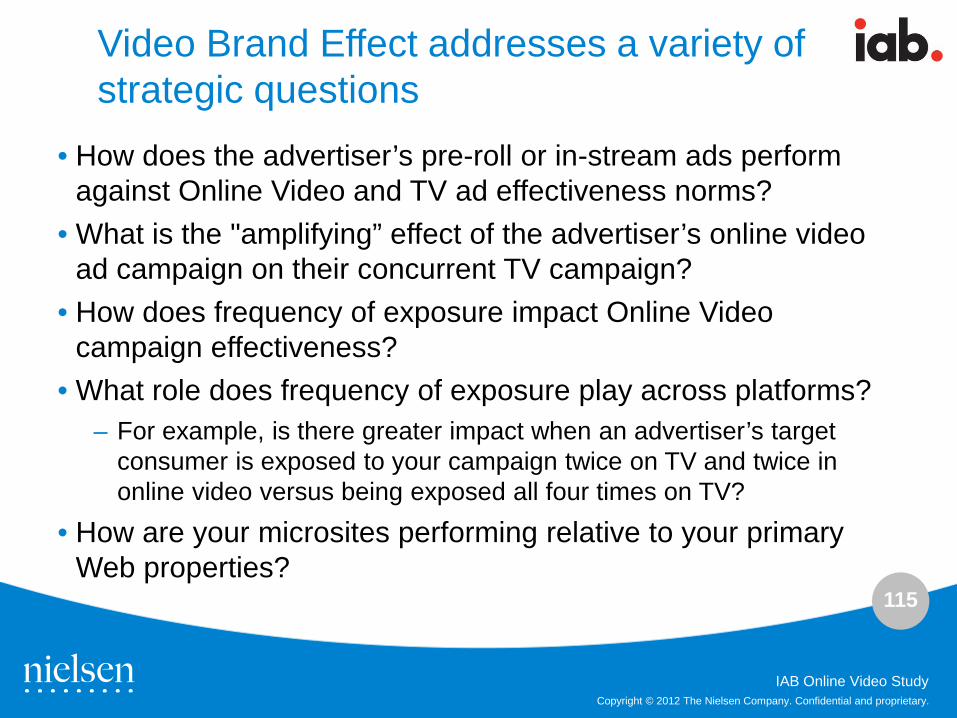
115
Copyright © 2012 The Nielsen Company. Confidential and proprietary.
IAB Online Video Study
Video Brand Effect addresses a variety of strategic questions
• How does the advertiser’s pre-roll or in-stream ads perform against Online Video and TV ad effectiveness norms?
• What is the "amplifying” effect of the advertiser’s online video ad campaign on their concurrent TV campaign?
• How does frequency of exposure impact Online Video campaign effectiveness?
• What role does frequency of exposure play across platforms? – For example, is there greater impact when an advertiser’s target
consumer is exposed to your campaign twice on TV and twice in online video versus being exposed all four times on TV?
• How are your microsites performing relative to your primary Web properties?
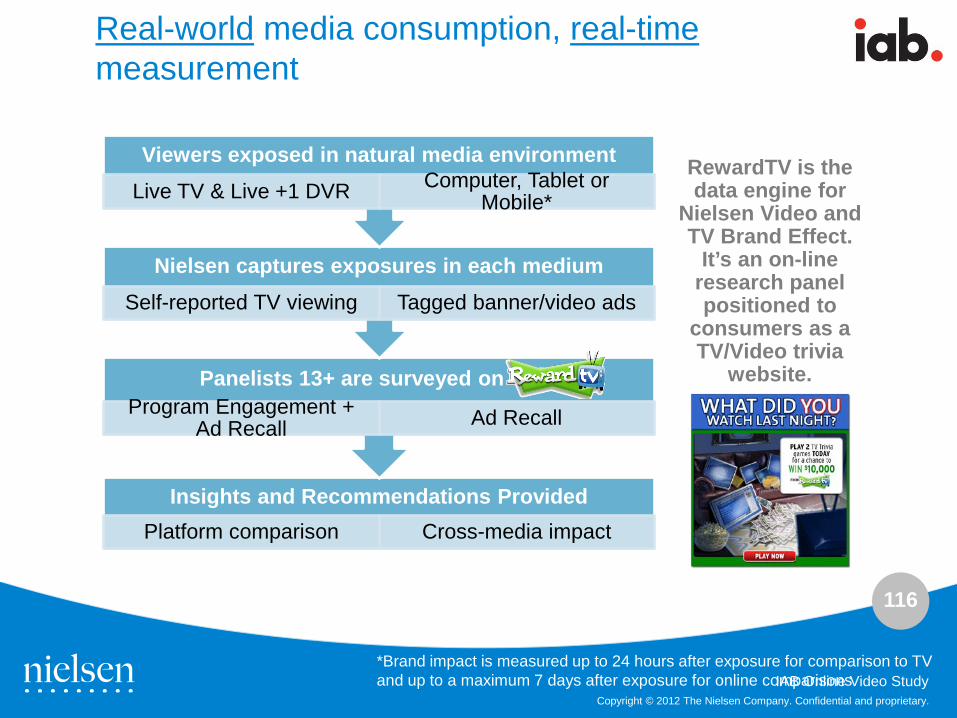
116
Copyright © 2012 The Nielsen Company. Confidential and proprietary.
IAB Online Video Study
Real-world media consumption, real-time measurement
Insights and Recommendations Provided Platform comparison Cross-media impact
Panelists 13+ are surveyed on RTV Program Engagement +
Ad Recall Ad Recall
Nielsen captures exposures in each medium Self-reported TV viewing Tagged banner/video ads
Viewers exposed in natural media environment Live TV & Live +1 DVR Computer, Tablet or
Mobile* RewardTV is the data engine for
Nielsen Video and TV Brand Effect.
It’s an on-line research panel positioned to
consumers as a TV/Video trivia
website.
*Brand impact is measured up to 24 hours after exposure for comparison to TV and up to a maximum 7 days after exposure for online comparisons
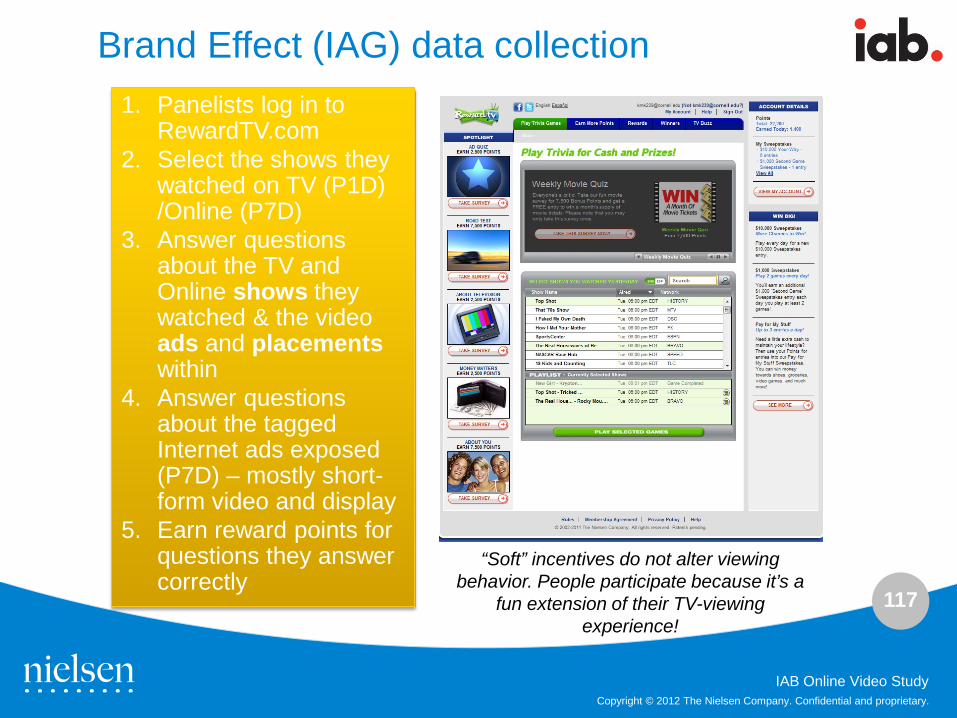
117
Copyright © 2012 The Nielsen Company. Confidential and proprietary.
IAB Online Video Study
Brand Effect (IAG) data collection 1. Panelists log in to
RewardTV.com 2. Select the shows they
watched on TV (P1D) /Online (P7D)
3. Answer questions about the TV and Online shows they watched & the video ads and placements within
4. Answer questions about the tagged Internet ads exposed (P7D) – mostly short-form video and display
5. Earn reward points for questions they answer correctly
“Soft” incentives do not alter viewing behavior. People participate because it’s a
fun extension of their TV-viewing experience!
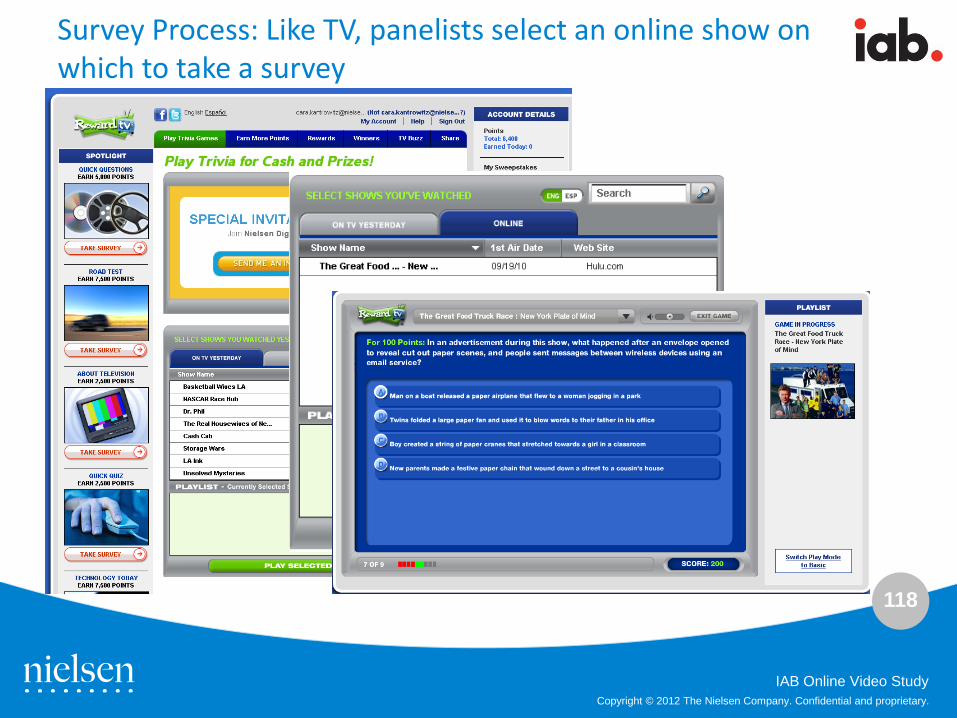
118
Copyright © 2012 The Nielsen Company. Confidential and proprietary.
IAB Online Video Study
Survey Process: Like TV, panelists select an online show on which to take a survey
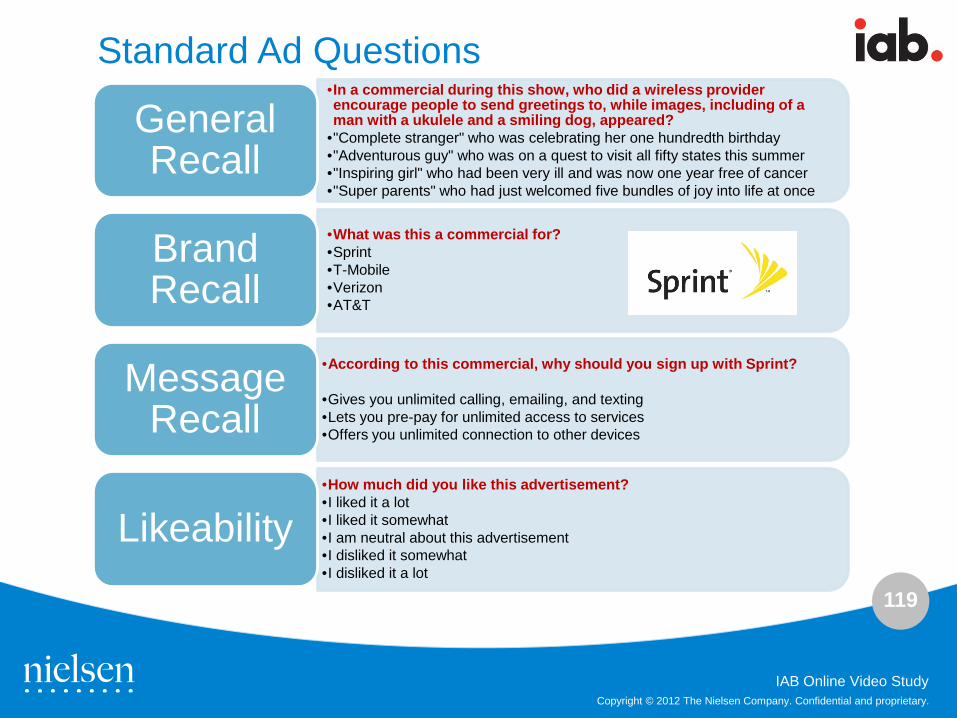
119
Copyright © 2012 The Nielsen Company. Confidential and proprietary.
IAB Online Video Study
•In a commercial during this show, who did a wireless provider encourage people to send greetings to, while images, including of a man with a ukulele and a smiling dog, appeared?
•"Complete stranger" who was celebrating her one hundredth birthday •"Adventurous guy" who was on a quest to visit all fifty states this summer •"Inspiring girl" who had been very ill and was now one year free of cancer •"Super parents" who had just welcomed five bundles of joy into life at once
General Recall
•What was this a commercial for? •Sprint •T-Mobile •Verizon •AT&T
Brand Recall
•According to this commercial, why should you sign up with Sprint?
•Gives you unlimited calling, emailing, and texting •Lets you pre-pay for unlimited access to services •Offers you unlimited connection to other devices
Message Recall
•How much did you like this advertisement? •I liked it a lot •I liked it somewhat •I am neutral about this advertisement •I disliked it somewhat •I disliked it a lot
Likeability
Standard Ad Questions
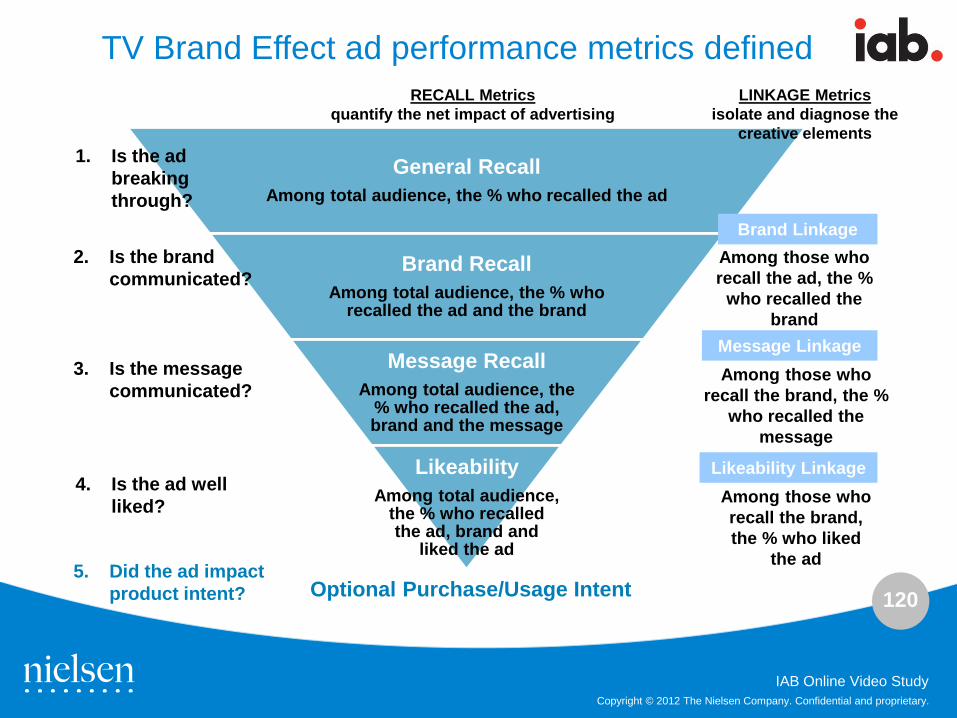
120
Copyright © 2012 The Nielsen Company. Confidential and proprietary.
IAB Online Video Study
TV Brand Effect ad performance metrics defined
General Recall Among total audience, the % who recalled the ad
Brand Recall Among total audience, the % who
recalled the ad and the brand
Message Recall Among total audience, the
% who recalled the ad, brand and the message
Likeability Among total audience,
the % who recalled the ad, brand and
liked the ad
Among those who recall the ad, the %
who recalled the brand
Brand Linkage
RECALL Metrics quantify the net impact of advertising
1. Is the ad breaking through?
2. Is the brand communicated?
3. Is the message communicated?
4. Is the ad well liked?
LINKAGE Metrics isolate and diagnose the
creative elements
Message Linkage Among those who
recall the brand, the % who recalled the
message
Likeability Linkage Among those who recall the brand, the % who liked
the ad
Optional Purchase/Usage Intent 5. Did the ad impact
product intent?
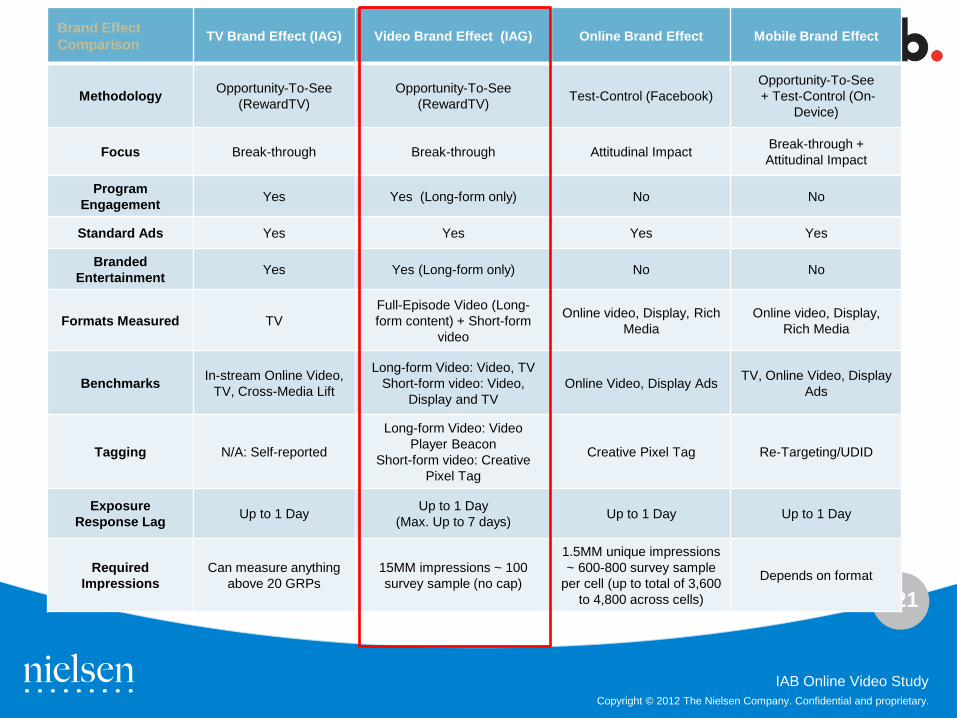
121
Copyright © 2012 The Nielsen Company. Confidential and proprietary.
IAB Online Video Study
Brand Effect Comparison TV Brand Effect (IAG) Video Brand Effect (IAG) Online Brand Effect Mobile Brand Effect
Methodology Opportunity-To-See (RewardTV)
Opportunity-To-See (RewardTV) Test-Control (Facebook)
Opportunity-To-See + Test-Control (On-
Device)
Focus Break-through Break-through Attitudinal Impact Break-through + Attitudinal Impact
Program Engagement Yes Yes (Long-form only) No No
Standard Ads Yes Yes Yes Yes
Branded Entertainment Yes Yes (Long-form only) No No
Formats Measured TV Full-Episode Video (Long-form content) + Short-form
video
Online video, Display, Rich Media
Online video, Display, Rich Media
Benchmarks In-stream Online Video, TV, Cross-Media Lift
Long-form Video: Video, TV Short-form video: Video,
Display and TV Online Video, Display Ads TV, Online Video, Display
Ads
Tagging N/A: Self-reported
Long-form Video: Video Player Beacon
Short-form video: Creative Pixel Tag
Creative Pixel Tag Re-Targeting/UDID
Exposure Response Lag Up to 1 Day Up to 1 Day
(Max. Up to 7 days) Up to 1 Day Up to 1 Day
Required Impressions
Can measure anything above 20 GRPs
15MM impressions ~ 100 survey sample (no cap)
1.5MM unique impressions ~ 600-800 survey sample
per cell (up to total of 3,600 to 4,800 across cells)
Depends on format
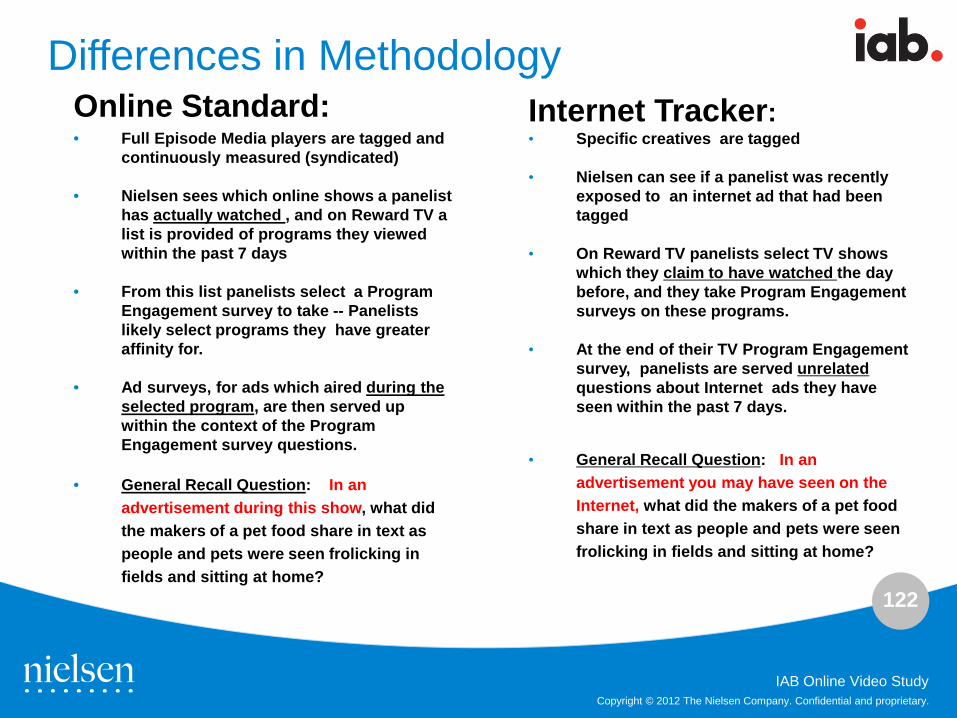
122
Copyright © 2012 The Nielsen Company. Confidential and proprietary.
IAB Online Video Study
Online Standard: • Full Episode Media players are tagged and
continuously measured (syndicated)
• Nielsen sees which online shows a panelist has actually watched , and on Reward TV a list is provided of programs they viewed within the past 7 days
• From this list panelists select a Program Engagement survey to take -- Panelists likely select programs they have greater affinity for.
• Ad surveys, for ads which aired during the
selected program, are then served up within the context of the Program Engagement survey questions.
• General Recall Question: In an advertisement during this show, what did the makers of a pet food share in text as people and pets were seen frolicking in fields and sitting at home?
Differences in Methodology Internet Tracker: • Specific creatives are tagged • Nielsen can see if a panelist was recently
exposed to an internet ad that had been tagged
• On Reward TV panelists select TV shows
which they claim to have watched the day before, and they take Program Engagement surveys on these programs.
• At the end of their TV Program Engagement survey, panelists are served unrelated questions about Internet ads they have seen within the past 7 days.
• General Recall Question: In an
advertisement you may have seen on the Internet, what did the makers of a pet food share in text as people and pets were seen frolicking in fields and sitting at home?
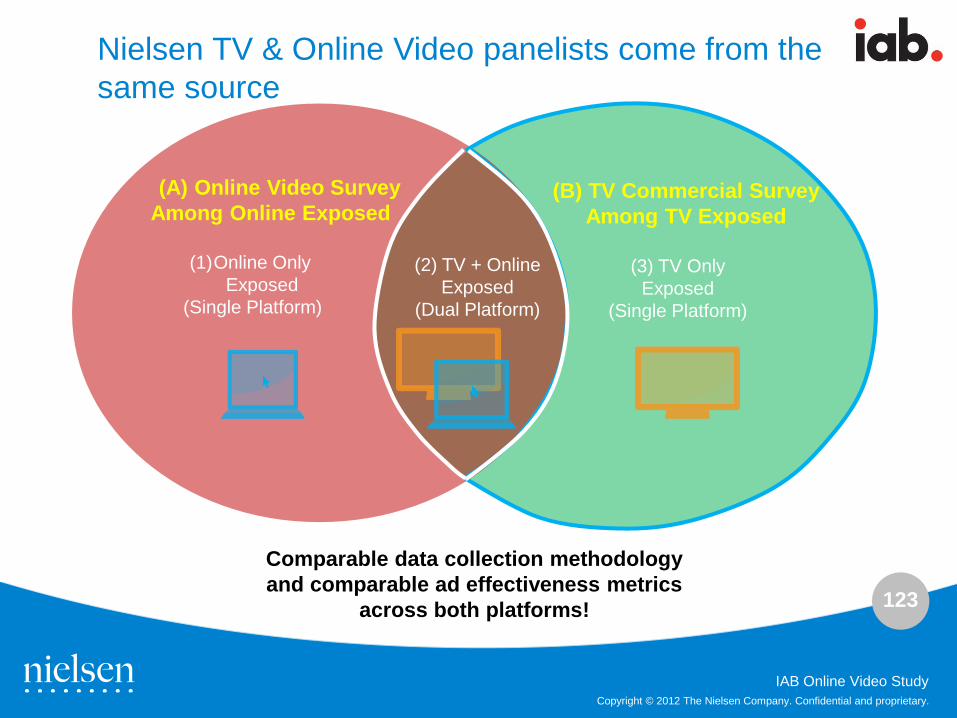
123
Copyright © 2012 The Nielsen Company. Confidential and proprietary.
IAB Online Video Study
Comparable data collection methodology and comparable ad effectiveness metrics
across both platforms!
(B) TV Commercial Survey Among TV Exposed
(A) Online Video Survey Among Online Exposed
(1)Online Only Exposed
(Single Platform)
(3) TV Only Exposed
(Single Platform)
(2) TV + Online Exposed
(Dual Platform)
Nielsen TV & Online Video panelists come from the same source
124
Copyright © 2012 The Nielsen Company. Confidential and proprietary.
IAB Online Video Study Copyright © 2012 The Nielsen Company. Confidential and proprietary.
Questions?
Sherrill Mane SVP Research, Analytics & Measurement, IAB [email protected]
Kristina Sruoginis Research Director, IAB