Niche Partitioning of Marine Group I Crenarchaeota in the ...
APPLIED AND ENVIRONMENTAL MICROBIOLOGY, Nov. 2011, p. 7469–7478 Vol. 77, No. 210099-2240/11/$12.00 doi:10.1128/AEM.00294-11Copyright © 2011, American Society for Microbiology. All Rights Reserved.
Niche Partitioning of Marine Group I Crenarchaeota in the Euphoticand Upper Mesopelagic Zones of the East China Sea�†
Anyi Hu,1,2 Nianzhi Jiao,1* Rui Zhang,1 and Zao Yang1
State Key Laboratory of Marine Environmental Science, Xiamen University, Xiamen 361005, People’s Republic of China,1 andKey Laboratory of Urban Environment and Health, Institute of Urban Environment, Chinese Academy of Sciences,
Xiamen 361021, People’s Republic of China2
Received 9 February 2011/Accepted 15 July 2011
Marine group I Crenarchaeota (MGI) represents a ubiquitous and numerically predominant microbialpopulation in marine environments. An understanding of the spatial dynamics of MGI and its controllingmechanisms is essential for an understanding of the role of MGI in energy and element cycling in the ocean.In the present study, we investigated the diversity and abundance of MGI in the East China Sea (ECS) byanalysis of crenarchaeal 16S rRNA gene, the ammonia monooxygenase gene amoA, and the biotin carboxylasegene accA. Quantitative PCR analyses revealed that these genes were higher in abundance in the mesopelagicthan in the euphotic zone. In addition, the crenarchaeal amoA gene was positively correlated with the copynumber of the MGI 16S rRNA gene, suggesting that most of the MGI in the ECS are nitrifiers. Furthermore,the ratios of crenarchaeal accA to amoA or to MGI 16S rRNA genes increased from the euphotic to themesopelagic zone, suggesting that the role of MGI in carbon cycling may change from the epipelagic to themesopelagic zones. Denaturing gradient gel electrophoretic profiling of the 16S rRNA genes revealed depthpartitioning in MGI community structures. Clone libraries of the crenarchaeal amoA and accA genes showedboth “shallow” and “deep” groups, and their relative abundances varied in the water column. Ecotypesimulation analysis revealed that MGI in the upper ocean could diverge into special ecotypes associated withdepth to adapt to the light gradient across the water column. Overall, our results showed niche partitioning ofthe MGI population and suggested a shift in their ecological functions between the euphotic and mesopelagiczones of the ECS.
Microbes are the most abundant and diverse life forms inoceans and play a critical role in energy flux and elementcycling (14, 28). Determining the structure of marine microbialcommunities and their spatial and temporal variation is anessential step in an understanding of the role of microbes inthe functioning of ecosystems (55). The application of molec-ular technology has led to great advances in microbial ocean-ography (14). On the horizontal dimension, marine microor-ganisms have been shown to have biogeographic distributionpatterns like those of macroorganisms (39). Depth is consid-ered a predominant factor in structuring of microbial commu-nities across the oceanic water column, since the major phys-ical and chemical gradients (e.g., light, temperature, pressure,nutrients, and organic matter) are apparent on the verticalscale (12). Numerous studies show the depth-stratified nicheadaptation of marine bacteria, either at the population level(7) or at the community level (12).
Marine group I Crenarchaeota (MGI), one of the major phy-logenetic groups of pelagic archaea, were first discovered by using16S rRNA gene-based molecular methods (11, 15). A number ofstudies showed that MGI forms one of the most abundant pop-ulations of marine microorganisms: it is estimated that there are
1.3 � 1028 to 2.7 � 1028 MGI cells, representing up to 40% of thetotal prokaryotic biomass in the dark ocean (31, 49). Phylogeneticand genomic studies revealed that MGI together with mesophilicCrenarchaeota in soil environments likely form a third archaealphylum, the Thaumarchaeota (6, 51). Recent observations of thecrenarchaeal amoA gene, encoding ammonia monooxygenasesubunit A, in marine (56) and soil (54) metagenomics and theisolation of the marine crenarchaeon “Candidatus Nitrosopumi-lus maritimus” (32) imply that most mesophilic Crenarchaeotahave the ability to oxidize ammonia to nitrite, which was previ-ously thought to be achieved only by ammonia-oxidizing bacteria(AOB) (34). Meanwhile, a novel mechanism of autotrophic car-bon fixation, the 3-hydroxypropionate/4-hydroxybutyrate path-way, was identified in the genomes of “Candidatus Nitrosopumi-lus maritimus” and “Candidatus Cenarchaeum symbiosum” (20,57). The acc gene, encoding acetyl coenzyme A (acetyl-CoA)carboxylase, one of the key enzymes in that pathway, and theamoA gene are used as phylogenetic markers to mirror the eco-logical function of MGI (5, 13, 25, 59, 60).
Previous investigations showed that the MGI populationseems to be rather similar on the horizontal scale in the world’soceans (25, 35, 40), except where different water masses meet(1, 16, 30). Vertically, however, two distinct phylogeneticgroups of MGI (MGI-� and MGI-�), based on analyses of 16SrRNA genes, predominated in shallow and deep waters, re-spectively (3, 40). Additional evidence for depth-stratified phy-logeny within MGI has also been observed by using the cren-archaeal 16S rRNA gene internal transcribed spacer region(18) and the amoA (5, 21, 48) and accA (25, 60) genes. The
* Corresponding author. Mailing address: State Key Laboratory ofMarine Environmental Science, Xiamen University, Xiamen, People’sRepublic of China. Phone and fax: 86-592-2187869. E-mail: [email protected].
† Supplemental material for this article may be found at http://aem.asm.org/.
� Published ahead of print on 26 August 2011.
7469

concordant depth-stratified phylogeny suggests that MGI pop-ulations have evolved into different ecotypes to adapt to spe-cific habitats (niches) according to different environmental fac-tors or resources (60).
Some studies suggested that the depth-related phylogeny ofMGI may be due to photoinhibition-resistant adaptations (8,42). Assuming this to be true, we hypothesized that (i) MGImight have a restricted distribution pattern (niche partition-ing) across the water column due to the influence of light orother continuous environmental gradients and (ii) evolution-ary divergence among MGI ecotypes can be observed sinceniche partitioning might contribute to restricted gene flow dur-ing their evolution (44a). To test these hypotheses, we inves-tigated the vertical distribution of the abundance and diversityof MGI in the euphotic and upper mesopelagic zones at twostations along the Kuroshio Current using multiphasic molec-ular methods, including denaturing gradient gel electrophore-sis (DGGE), clone libraries, quantitative PCR (qPCR), andecotype simulation analysis. Our results showed that MGI inthe upper ocean diverged into special ecotypes associated withdepth in order to adapt to the light gradient in the watercolumn.
MATERIALS AND METHODS
Sampling stations and environmental conditions. The East China Sea (ECS),located in the Northwest Pacific Ocean, is the largest continental shelf sea in thetemperate zone. The Kuroshio Current going along the ECS shelf edge origi-nates from the West Pacific warm pool and is characterized by high temperatureand high salinity (29) (Fig. 1). Two sites along the shelf slope of the ECS on thewest side of the Kuroshio Current were selected for the present study: station 712
(27.44°N, 126.14°E) and station 608 (30.33°N, 128.62°E) (Fig. 1). Station 712 islocated by the main stream of the Kuroshio Current, while station 608 is situatednear a branch of the Kuroshio Current. With similar water depths, both beyond500 m, but different environmental conditions (please see below for detailedresults), these two stations provided an opportunity for comparative studies ofmicrobial dynamics along both geographic and vertical environmental dimen-sions.
Water samples were collected on board the RV Dongfanghong #2 between 5and 12 November 2007. A SeaBird SBE 9/11 Plus conductivity-temperature-depth (CTD) system fitted with a rosette sampler was used to measure temper-ature and salinity and to collect water samples. The potential density (�t) wascalculated based on the equation for the state of seawater as proposed previously(41). The mixed-layer depths (MLDs) were estimated by using the �t values. Theeuphotic zone depth of these two stations was derived from the monthly meanAqua-MODIS euphotic depth [Lee] data set (34a) in the corresponding months(http://oceancolor.gsfc.nasa.gov/cgi/l3). Water samples were collected at 10 in-tervals in the euphotic and upper mesopelagic zones (0 to 400 m) for each station(Table 1). Subsamples (2 to 3 liters) were prefiltered through a 20-�m mesh(Millipore, Billerica, MA) and subsequently filtered onto 0.2-�m-pore-size poly-carbonate filters (Millipore) at a pressure of �0.03 MPa. The filters were im-mediately frozen and stored at �80°C until further analysis.
Environmental DNA extraction. Microbial community DNA was extracted byusing the UltraClean Soil DNA kit (MoBio, San Diego, CA) as described else-where previously (26). DNA integrity and size were checked in a 0.8% agarosegel stained with SYBR green I (Molecular Probes, Eugene, OR), and the con-centrations were quantified in duplicate by using a FlexStation 3 instrument(Molecular Devices, Sunnyvale, CA) with a Quant-iT dsDNA HS assay kit(Molecular Probes). A standard curve was generated by using known amounts oflambda DNA (Molecular Probes).
qPCR analysis. qPCR was performed on an ABI Prism 7500 system (AppliedBiosystems, Foster City, CA) with the primers listed in Table S1 in the supple-mental material. Plasmids carrying the respective 16S rRNA or functional genefragments (archaeal and MGI 16S rRNA genes, crenarchaeal amoA and accAgenes, and �-AOB amoA genes) as an insert were constructed (25). The con-centrations of plasmid DNAs were determined by using a Quant-iT dsDNA HS
FIG. 1. Map of the ECS showing the approximate bottom topography and hydrographic structure and the location of the sampling stations.CDW, Changjiang diluted water; TWC, Taiwan Warm Current; KBCNT, Kuroshio Branch Current north of Taiwan; KBCWK, Kuroshio BranchCurrent west of Kyushu; TSWC, Tsushima Strait Warm Current; YSWC, Yellow Sea Warm Current; Kuroshio, Kuroshio Current. The map wascreated by use of Planiglobe, with information on currents taken from references 7a and 29.
7470 HU ET AL. APPL. ENVIRON. MICROBIOL.
assay kit (Molecular Probes). Tenfold serial dilutions of a known number ofplasmids were subjected to qPCR assays in triplicate to generate an externalstandard curve.
The abundances of the 16S rRNA genes of the archaea and MGI and thefunctional genes of the Crenarchaeota (amoA and accA) and �-AOB (amoA) inall samples were measured in triplicate for each sample. For the quantification of16S rRNA genes, a 20-�l reaction mixture consisting of 10 �l of SYBRGreenER-qPCR SuperMix Universal (Molecular Probes), 50 nM ROX dye, and5 �g bovine serum albumin (BSA) plus 0.4 �M primers and 1 �l of template (1to 10 ng) was used. For the quantification of the functional genes, the followingreaction mixture was used: 10 �l of SYBR Premix Ex Taq (TaKaRa, Dalian,China), 50 nM ROX dye, 5 �g BSA, 0.4 �M primers, and 1 �l template DNA of1 to 10 ng in a final volume of 20 �l. The specificity of qPCRs was confirmed byusing melting curve analysis and agarose gel electrophoresis after amplification.The thermocycling parameters and efficiency of the qPCRs are described inTable S2 in the supplemental material.
T-RFLP analysis of bacterial 16S rRNA genes. Bacterial community structureswere analyzed by using terminal restriction fragment length polymorphism (T-RFLP) analysis for PCR amplification with primer pair 27F/926R, with primer27F labeled by 6-carboxyfluorescein phosphoramidite at the 5 end. The PCRconditions and chemistry were described elsewhere previously (62). Briefly, 1 to10 ng of the extracted DNA was added as a template in a 50-�l PCR mixture.Purified PCR products were digested with RsaI (TaKaRa) at 37°C for 12 h.Digested products were recovered in a final volume of 20 �l of Mill-Q waterusing ethanol precipitation. Purified products (10 �l) were mixed with 0.5 �l ofthe internal ET ROX-900 size standard (Amersham Bioscience) and then de-tected by using a MegaBACE genetic analyzer (Amersham) operated in geno-typing mode (62). The T-RFLP data were exported by using MegaBACE Ge-netic Profiler software and were processed with T-REX software for filtering outnoise, aligning terminal restriction fragments (T-RFs), and constructing a datamatrix (9). The obtained matrix was further imported into PAST v1.92 (23) toperform the cluster analysis with both Sorensen and Bray-Curtis algorithms.T-RFs of �50 bp or contributing �0.5% to the total fluorescence signal wereexcluded from the analysis.
DGGE analysis of crenarchaeal 16S rRNA genes. Crenarchaeal 16S rRNAgene fragments were amplified by employing a nested PCR strategy as describedpreviously (44). Briefly, crenarchaeal 16S rRNA gene fragments were amplifiedby using primer 21F (11) and modified primer 1492R (44) in the first round andprimers 771F (45) and GI_956R (42) in the second round, with primer GI_956Rcontaining a 40-bp GC clamp. DGGE was performed by using a Bio-Rad DCodeuniversal mutation detection system (Bio-Rad, Hercules, CA) according to themanufacturer’s instructions. The PCR products of the crenarchaeal 16S rRNAgene were applied onto 8% (wt/vol) gels in 1� Tris-acetate-EDTA (TAE) bufferwith a denaturing gradient of 30 to 55% denaturant (100% denaturing solutioncontaining 40% formamide and 7 M urea). Electrophoresis was performed at aconstant temperature of 60°C and at 75 V for 16 h. The DGGE images, stainedwith SYBR green I (Molecular Probes), were captured and analyzed by usingGeneSnap and GeneTools software (SynGene-Synoptics, Cambridge, UnitedKingdom).
Crenarchaeal amoA and accA gene clone library analyses. Clone libraries wereconstructed for the crenarchaeal amoA genes targeting ammonia monooxygen-ase subunit A and for the crenarchaeal accA genes targeting acetyl-CoA carbox-ylase subunit A for the six depth zones at each station. The amoA gene fragmentswere amplified with Arch-amoAF/Arch-amoAR (13), and the accA gene frag-
ments were amplified with Cren529F/Cren981R (59), except that the nested PCRstrategy was employed when few positive PCR products were obtained from theeuphotic samples. Subsequently, purified PCR products were ligated into thepMD18-T vector (TaKaRa) and then transformed into competent Escherichiacoli DH5� cells (TaKaRa). Positive clones were screened by using PCR ream-plification with vector primers M-13F and M-13R and selected for sequencing byusing an ABI 3730 XL sequencer (Applied Biosystems).
Phylogenetic analysis and ecotype simulation. The crenarchaeal amoA andaccA gene sequences, along with their closest relatives retrieved from GenBank,were imported into ARB (37). The sequences were first translated and aligned byusing Clustal W in ARB, and the nucleotides were then realigned according totheir protein alignments. Ambiguously and incorrectly aligned positions werecorrected manually by using the ARB-edit tool. The sequence base frequencyfilters were used to exclude ambiguous positions and columns containing gaps.The Bayesian tree was generated by using the MrBayes v. 3.1.2 program (47) andthe following parameters: the general time reversal model of evolution withgamma-invariable-distributed rate, the number of chains set to 6, and the tem-perature set to 0.1. Five Markov chains in parallel were run with 5,000,000generations and sampled every 100 generations (the first 7,500 to 10,000 “burn-in” trees were excluded from the consensus tree). Tree topologies were alsoevaluated with the neighbor-joining and maximum parsimony methods by usingPAUP*4.0 (53).
Ecotype simulation analyses were performed by using AdaptML software (27).Since Bayesian trees constructed with archaeal amoA or accA gene sequencescontained several multifurcation nodes, maximum likelihood trees constructedby using RAxML v7.0.4 (52) were used as inputs for AdaptML analyses withdefault parameters.
Statistical analysis. Operational taxonomic units (OTUs) for clone libraryanalyses were defined by using the furthest-neighbor algorithm in DOTUR (50)and a cutoff of �5% as described in previous studies (4, 13, 25). Rarefaction, thenonparametric richness estimator Chao1, the Shannon diversity index, and Simp-son’s index were also calculated by using DOTUR. The coverage of each clonelibrary was calculated as coverage (C) 1 � (n/N) � 100, where n is the numberof unique clones detected in the sample and N is the total number of clonesanalyzed (19).
Community classification of the crenarchaeal assemblages for both the amoAand accA genes was determined by using phylogeny-based weighted UniFracenvironmental clustering (36) or ecotype-abundance-based clustering analyses.Analyses of similarity (ANOSIM) were performed to verify the significance ofmicrobial community structures from different groups or stations. The signifi-cance of the correlations between two distance matrices or between microbialcommunity structures and environmental variables was tested with the Manteltest. Analyses were performed with the PAST v1.92 program (23). Since anormality of distribution of the individual data sets was not always met, non-parametric statistical analyses were performed by using SPSS v13.0 (SPSS, Inc.,Chicago, IL).
Nucleotide sequence accession numbers. Sequences reported in this studyhave been deposited in the GenBank database under accession numbersGU181423 to GU181799 (crenarchaeal amoA genes), GU195200 to GU195605(crenarchaeal accA genes), and GU195606 to GU195629 (bacterial accA genes).
RESULTS
The main hydrographic characteristics of the two stationsinvestigated in this study are summarized in Table 1. Thetemperature was significantly higher but the �t was significantlylower at station 712 than at station 608, while the salinity valueswere not significantly different between the two stations. Asindicated by the �t, the MLD was slightly greater at station 712(�75 m) than at station 608 (�50 m) (Table 1). At bothstations, the temperature showed a strong decrease with in-creasing depth from the MLD, whereas salinity had constantvalues (Table 1). As seen from the MODIS euphotic zonedepth data for November 2007, the euphotic depth at station608 was around 84 m, whereas the euphotic depth at station712 was slightly greater, at �106 m.
Quantification of 16S rRNA, amoA, and accA genes of pe-lagic Crenarchaeota. Archaeal 16S rRNA gene abundancesranged from 1.41 � 102 to 3.72 � 104 copies ng DNA�1 within
TABLE 1. Properties of the water bodies of two stations located inthe ECS
Depth(m)
Station 712 Station 608
Temp(°C)
Salinity(‰) �t (kg m�3) Temp
(°C)Salinity
(‰) �t (kg m�3)
0 25.80 34.58 22.782 24.36 34.38 23.06510 25.46 34.59 22.889 24.37 34.39 23.07030 25.45 34.58 22.893 24.37 34.30 23.00250 25.27 34.56 22.928 24.31 34.40 23.098a
75 25.26 34.55 22.932a 22.22 34.63 23.882100 23.65 34.39 23.291 20.03 34.62 24.469150 18.46 34.64 24.892 17.38 34.62 25.140200 15.99 34.62 25.463 13.19 34.50 25.969300 11.96 34.44 26.170 10.00 34.36 26.455400 10.42 34.36 26.391 7.96 34.33 26.762
a Depth of the mixed layer.
VOL. 77, 2011 NICHE PARTITIONING OF PELAGIC CRENARCHAEOTA 7471

the euphotic zone at the two stations (Fig. 2). Depth profiles ofMGI 16S rRNA gene abundance ranging from 3.3 � 101 to1.38 � 104 copies ng DNA�1 were similar to those of archaeal16S rRNA genes (Fig. 2). The MGI 16S rRNA gene abun-dance was significantly correlated with the archaeal 16S rRNAgene abundance (R2 0.86; P � 0.001). Furthermore, qPCRanalysis showed that MGI dominated in the archaeal commu-nity below the euphotic zone, with an averaged relative abun-dance of 57.2% of the total.
The crenarchaeal amoA gene abundance increased fromnear the detection limit in the surface waters to a maximum of2.44 � 104 copies ng DNA�1 in the upper mesopelagic zonesof both stations (Fig. 2). A linear regression analysis indicatedthat the crenarchaeal amoA and MGI 16S rRNA genes weresignificantly correlated with each other (R2 0.83; P � 0.001).The abundance of the amoA gene of �-AOB was below thedetection limits in all samples.
The abundance of the crenarchaeal accA gene was almost
always below the detection limit within the euphotic zones butthen increased with depth to maximal values at a depth of300 m at both stations (Fig. 2). The abundance ratios of thecrenarchaeal accA gene to the MGI 16S rRNA gene or to thecrenarchaeal amoA gene increased with depth, and the peakratios occurred in the upper mesopelagic zone (Fig. 3).
Community structure of bacterial and crenarchaeal 16SrRNA genes. The T-RFLP pattern of the bacterial communi-ties revealed a total of 134 T-RFs at the 16S rRNA gene level.The number of T-RFs showed no depth-related pattern at bothstations (data not shown). In contrast, ANOSIM showed dis-tinct site- or water mass-specific bacterial communities be-tween the two stations (P � 0.05). Furthermore, the clusteranalysis demonstrated that the bacterial communities at sta-tion 608 were stratified in the water column, but most samplesfrom station 712 clustered together and did not show a depth-related pattern (Fig. 4a). Mantel tests indicated that the bac-terial communities at station 608 were strongly influenced by
FIG. 2. Depth profiles of abundances of archaeal and MGI 16S rRNA genes and crenarchaeal amoA and accA genes measured by using qPCRat stations 608 and 712 in the ECS. Bars denote 1 standard error of triplicate qPCR determinations and are not visible when they are less thanthe width of the data point.
FIG. 3. Ratios of crenarchaeal accA to MGI 16S rRNA genes or crenarchaeal amoA genes.
7472 HU ET AL. APPL. ENVIRON. MICROBIOL.

depth, temperature, and �t (r � 0.5; P � 0.001), while thisinfluence at station 712 was not obviously seen (P � 0.1).
Crenarchaeal community structures at both stations werecharacterized on the basis of the 16S rRNA gene by usingDGGE. The number of DGGE bands detected ranged from 1to 14 per sample (see Fig. S1 in the supplemental material).There were relatively lower band numbers in the euphotic zone(�100 m) than in greater depths at both stations (P � 0.05 byMann-Whitney test) (Fig. S1), resulting in depth-related vari-ations. Cluster analysis demonstrated a general depth-strati-fied pattern for the crenarchaeal communities at both stations(Fig. 4b): a deep clade (�150 m) and a euphotic zone cluster(�100 m). Moreover, the deep clade could be further dividedinto two subclades (Fig. 4b): a deep epipelagic subclade (150 mand 200 m) and a mesopelagic subclade (300 m and 400 m),except for the depth of 712 to 200 m. Mantel tests indicatedthat the crenarchaeal communities in both stations were
closely related to water depth, temperature, and �t (r � 0.4;P � 0.001). In contrast, homogeneous crenarchaeal communi-ties were observed at both stations (P � 0.5 by ANOSIM).
Diversity and phylogeny of crenarchaeal amoA and accAgenes. To assess the evolutionary divergence and restricteddistribution of MGI ecotypes along the water column, samplesfrom six depths from each station were chosen, based on theabove-described DGGE profiles, to construct clone libraries ofthe crenarchaeal amoA and accA genes. In total, 377 amoAand 406 accA gene sequences were obtained (Table 2). Thesesequences contained 31 unique amoA OTUs and 53 uniqueaccA OTUs based on a 5% cutoff value at the DNA level. Thenumbers of OTUs per sample varied between 2 and 15 foramoA and between 3 and 17 for accA (Table 2). The values oflibrary coverage ranged from 83.7 to 100% for amoA and 82 to97.4% for accA. The diversity of amoA varied at both stations:clone libraries below the euphotic zones (�150 m) had a
FIG. 4. Clustering of the T-RFLP profiles of bacterial 16S rRNA genes (a) and clustering of the DGGE profiles of crenarchaeal 16S rRNAgenes (b) in the ECS. Clustering analyses were performed based on the Sorensen algorithm, and the scale bar indicates the Sorensen distance.
TABLE 2. Diversity indices of crenarchaeal amoA and accA clone libraries recovered from the stations investigated in the ECS
Sample depthrange (m)
Crenarchaeal amoA Crenarchaeal accA
No. of clonessequenced
No. ofOTUsb C (%) H 1/D Chao1 index
valueNo. of clonessequenceda
No. ofOTUsb C (%) H 1/D Chao1 index
value
608–10c 29 2 100 0.69 2.06 2 �608–75c 30 3 100 0.83 2.09 3 36 8 91.7 1.37 2.6 9608–100 29 4 93.1 0.79 1.81 5 31 12 87.1 2.15 7.05 13608–150 30 6 100 1.62 4.95 6 31 11 87.1 2.14 8.62 13608–200 37 12 89.2 2.27 10.53 14 52 17 82.7 2.3 7.41 26608–400 30 6 96.7 1.62 5.24 6 40 4 97.5 0.57 1.38 4712–10c 27 3 96.3 0.79 2.09 3 28 7 89.3 1.4 3.11 8712–75c 31 3 100 0.94 2.5 3 38 9 86.8 1.46 2.85 19712–100 31 3 96.8 0.8 2.17 3 30 6 93.3 1.4 3.6 7712–150 30 8 93.3 1.7 4.5 8 32 8 90.6 1.56 3.55 9712–200 43 15 83.7 2.43 11.9 22 50 16 82 2.14 5.81 26712–400 30 8 90 1.67 4.37 10 38 3 97.4 0.55 1.46 3
a A minus sign indicates the unsuccessful application of crenarchaeal accA genes.b OTUs were defined as 5% divergence at the DNA level.c A nested PCR strategy was employed for crenarchaeal accA gene amplification for these samples.
VOL. 77, 2011 NICHE PARTITIONING OF PELAGIC CRENARCHAEOTA 7473
higher level of diversity than did those recovered from theshallower depths (�100 m), as indicated by the Shannon, re-ciprocal Simpson’s, and Chao1 diversity indices (P � 0.01 byMann-Whitney test) (Table 2). In contrast, there were no sig-nificant differences in accA diversity between the euphoticzone samples and those from greater depths (P � 0.1 by Mann-Whitney test) (Table 2). Overall, the numbers of OTUs andthe Shannon and Chao1 richnesses of accA were generallyhigher than those of amoA, with three exceptions: at stations atdepths of 608 to 400 m, 712 to 150 m, and 712 to 400 m.
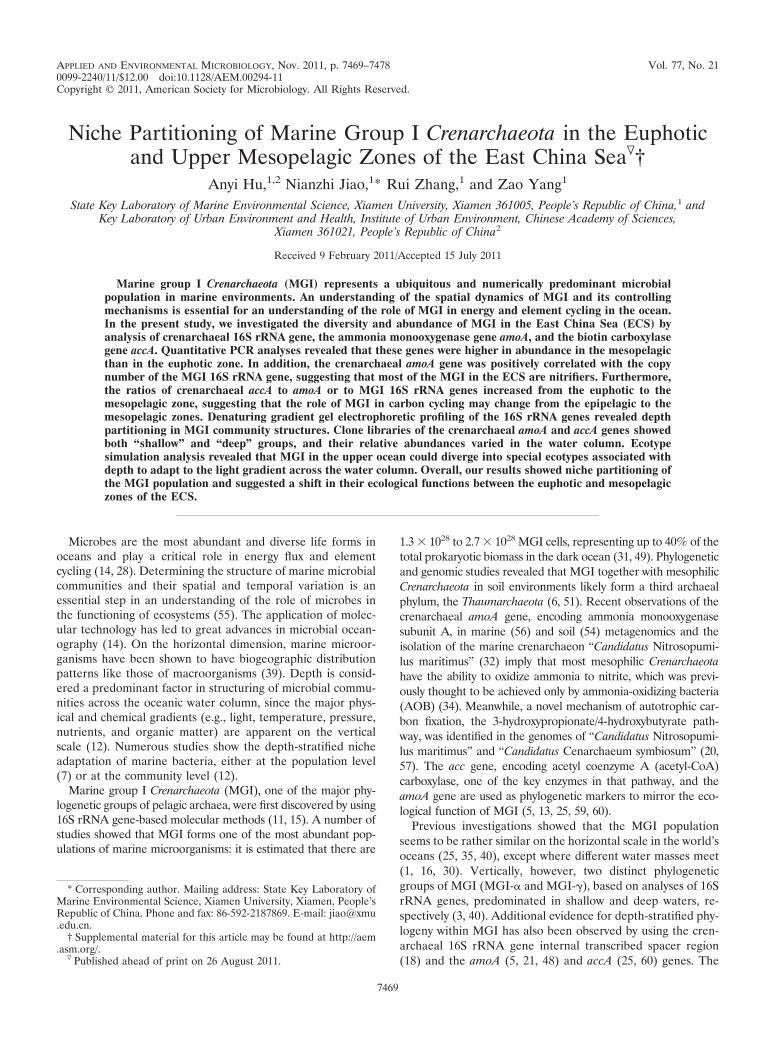
Phylogenetic analyses demonstrated that all sequences ofboth genes were affiliated with the two primary marine clustersdescribed previously, the “shallow group” and the “deepgroup” (1, 25, 60) (see Fig. S2 in the supplemental material),indicating that there was a high level of phylogenetic congru-ence between the crenarchaeal amoA and accA genes. Theshallow group for both genes contained sequences derivedexclusively from epipelagic water (�200 m) (Fig. S2), but theirrelative abundances decreased with increasing depth (Fig. 5).Accordingly, the deep group for both genes appeared near thebase of the euphotic zone (150 m for amoA genes and 75 m foraccA genes), and the relative abundance of this group in-creased with depth (Fig. 5).
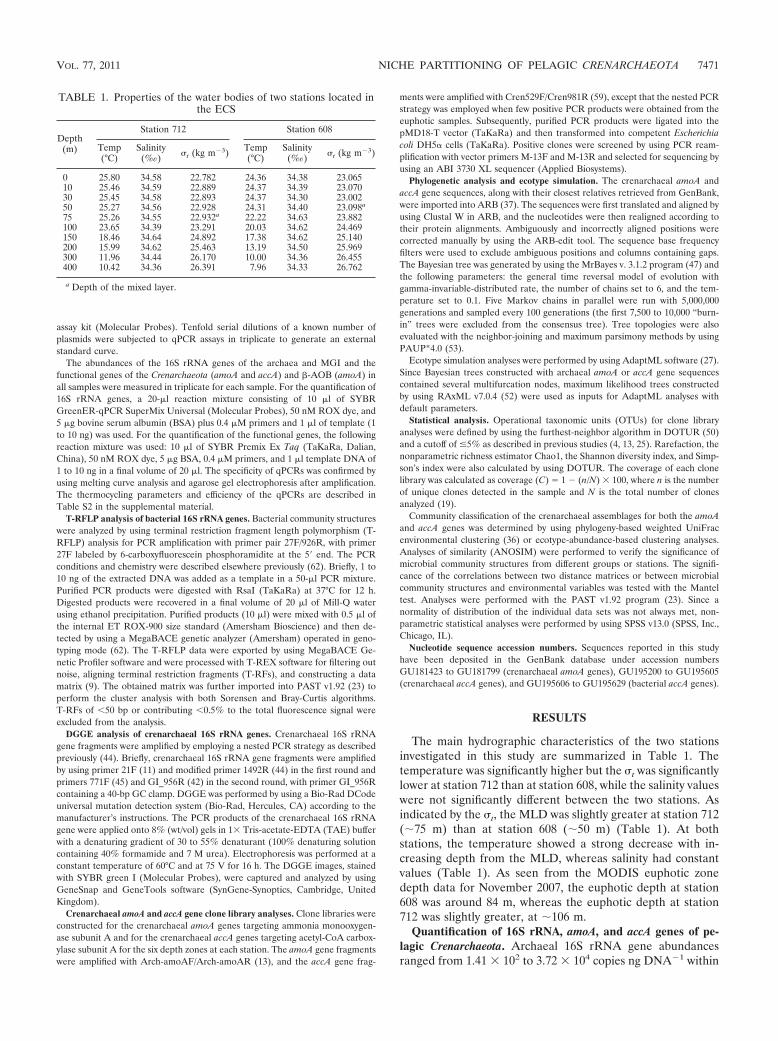
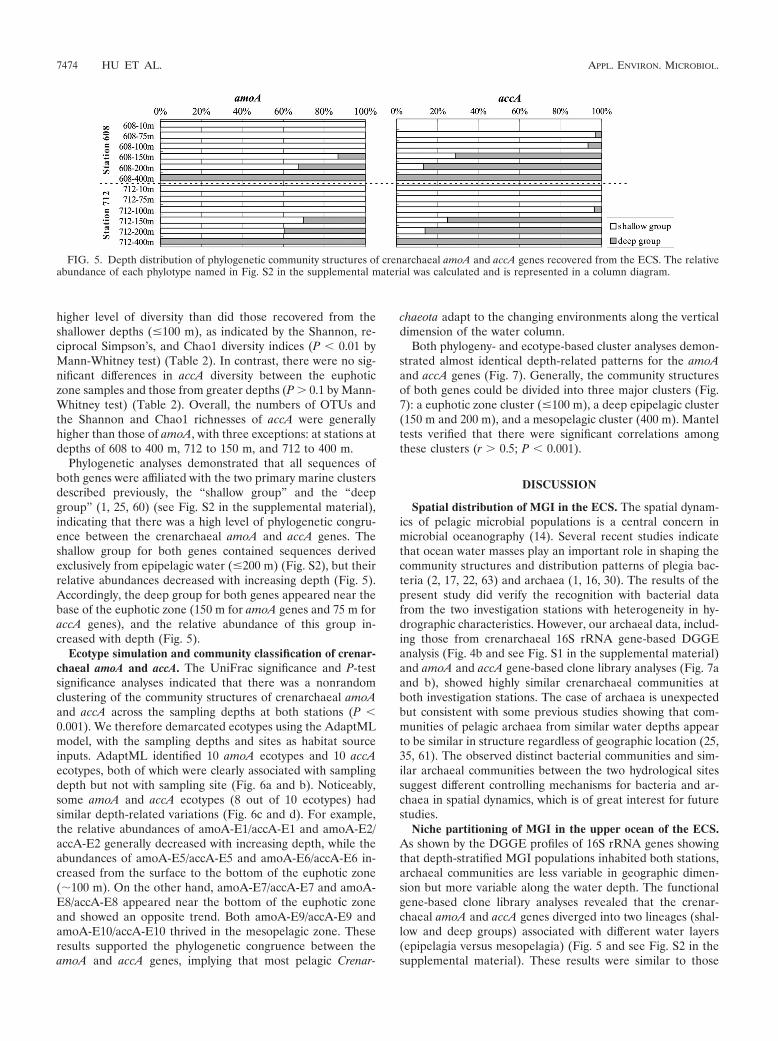
Ecotype simulation and community classification of crenar-chaeal amoA and accA. The UniFrac significance and P-testsignificance analyses indicated that there was a nonrandomclustering of the community structures of crenarchaeal amoAand accA across the sampling depths at both stations (P �0.001). We therefore demarcated ecotypes using the AdaptMLmodel, with the sampling depths and sites as habitat sourceinputs. AdaptML identified 10 amoA ecotypes and 10 accAecotypes, both of which were clearly associated with samplingdepth but not with sampling site (Fig. 6a and b). Noticeably,some amoA and accA ecotypes (8 out of 10 ecotypes) hadsimilar depth-related variations (Fig. 6c and d). For example,the relative abundances of amoA-E1/accA-E1 and amoA-E2/accA-E2 generally decreased with increasing depth, while theabundances of amoA-E5/accA-E5 and amoA-E6/accA-E6 in-creased from the surface to the bottom of the euphotic zone(�100 m). On the other hand, amoA-E7/accA-E7 and amoA-E8/accA-E8 appeared near the bottom of the euphotic zoneand showed an opposite trend. Both amoA-E9/accA-E9 andamoA-E10/accA-E10 thrived in the mesopelagic zone. Theseresults supported the phylogenetic congruence between theamoA and accA genes, implying that most pelagic Crenar-
chaeota adapt to the changing environments along the verticaldimension of the water column.
Both phylogeny- and ecotype-based cluster analyses demon-strated almost identical depth-related patterns for the amoAand accA genes (Fig. 7). Generally, the community structuresof both genes could be divided into three major clusters (Fig.7): a euphotic zone cluster (�100 m), a deep epipelagic cluster(150 m and 200 m), and a mesopelagic cluster (400 m). Manteltests verified that there were significant correlations amongthese clusters (r � 0.5; P � 0.001).
DISCUSSION
Spatial distribution of MGI in the ECS. The spatial dynam-ics of pelagic microbial populations is a central concern inmicrobial oceanography (14). Several recent studies indicatethat ocean water masses play an important role in shaping thecommunity structures and distribution patterns of plegia bac-teria (2, 17, 22, 63) and archaea (1, 16, 30). The results of thepresent study did verify the recognition with bacterial datafrom the two investigation stations with heterogeneity in hy-drographic characteristics. However, our archaeal data, includ-ing those from crenarchaeal 16S rRNA gene-based DGGEanalysis (Fig. 4b and see Fig. S1 in the supplemental material)and amoA and accA gene-based clone library analyses (Fig. 7aand b), showed highly similar crenarchaeal communities atboth investigation stations. The case of archaea is unexpectedbut consistent with some previous studies showing that com-munities of pelagic archaea from similar water depths appearto be similar in structure regardless of geographic location (25,35, 61). The observed distinct bacterial communities and sim-ilar archaeal communities between the two hydrological sitessuggest different controlling mechanisms for bacteria and ar-chaea in spatial dynamics, which is of great interest for futurestudies.
Niche partitioning of MGI in the upper ocean of the ECS.As shown by the DGGE profiles of 16S rRNA genes showingthat depth-stratified MGI populations inhabited both stations,archaeal communities are less variable in geographic dimen-sion but more variable along the water depth. The functionalgene-based clone library analyses revealed that the crenar-chaeal amoA and accA genes diverged into two lineages (shal-low and deep groups) associated with different water layers(epipelagia versus mesopelagia) (Fig. 5 and see Fig. S2 in thesupplemental material). These results were similar to those
FIG. 5. Depth distribution of phylogenetic community structures of crenarchaeal amoA and accA genes recovered from the ECS. The relativeabundance of each phylotype named in Fig. S2 in the supplemental material was calculated and is represented in a column diagram.
7474 HU ET AL. APPL. ENVIRON. MICROBIOL.
observed previously for other ocean regions (5, 40, 42, 60). Inthe central California Current, members of the “deep group”are strongly associated with deepwater transportation but areless active than their shallow-water-adapted counterparts, pro-viding evidence that these two independent MGI groups in-deed represent shallow- and deep-water-adapted “ecotypes”(48). In the present work, we applied AdaptML modeling andfound 10 ecotypes for the amoA and accA genes, while onlytwo general lineages were demarcated based on common phy-logenetic analyses (Fig. 6). Definition of ecotypes with higherresolution would provide new insights into the evolutionarymechanisms of MGI speciation. More interestingly, althoughthe accA gene abundance was extremely low in the epipelagiczone, 8 out of 10 ecotypes of both genes had similar depth-related distribution patterns (Fig. 6 and 7c and d). This findingsuggested that MGI functional groups containing amoA andaccA underwent a similar ecological adaptation and evolution-ary history. This conclusion is further supported by the almostconsistent clustering network observation based on phyloge-netic branch length or ecotype abundance (Fig. 7).
Although the mechanisms of the niche partitioning of MGIwith depth remain unknown, light and oxygen have been pro-posed to play a significant role in structuring of communities ofammonia-oxidizing crenarchaea in the ocean (42, 43). In thepresent study, the ecotypes of MGI in the oxygenated upperocean of the ECS had a strongly restricted distribution withdepths where the light intensity was attenuated across thewater column, suggesting that light might have been a potentialkey factor resulting in this depth-related phylogenetic parti-tioning of MGI. However, it was impossible to exclude theeffects of other environmental gradients existing in the watercolumn, such as dissolved organic matter (DOM) and pressure.Further studies are needed to establish a certain relationshipbetween environmental variables and crenarchaeal ecotypes.
Ecological roles of MGI in the ocean. The qPCR assaysindicated an amoA-to-16S rRNA gene ratio close to 2 at bothstations, which is within the reference ranges reported previ-ously for other regions of the Pacific Ocean (5, 8, 25, 48).Numerous studies have demonstrated that crenarchaeal amoAgenes are more abundant than those of AOB in various open
FIG. 6. Ecotype simulation of crenarchaeal amoA (a) and accA (b) gene sequences recovered from the ECS and shift in relative abundancesof different predicted ecotypes for amoA (c) and accA (d) across the water column of the ECS. Sampling stations and sampling depths are codedby colored squares. Predicted ecotypes are coded by colored circles at the phylogenetic nodes or the colored squares shown in panels c and d. Twomore-detailed images for panels a and b are shown in Fig. S3 in the supplemental material.
VOL. 77, 2011 NICHE PARTITIONING OF PELAGIC CRENARCHAEOTA 7475

oceans (5, 10, 48, 58). In agreement with the results of thosestudies, our data suggest that ammonia-oxidizing archaea out-compete AOB in the open region of the study sites, whichmight be explained by the conspicuous adaptability of MGI tolow concentrations of ammonia (38).
It was suggested previously that meso- and bathypelagicCrenarchaeota may lack the amoA gene, given the low ratiosof amoA to 16S rRNA genes, and therefore are hetero-trophic (1, 10). This conclusion remains debatable due tothe less comprehensive primers used in those studies (8, 33,60). In this study, besides the amoA genes, we quantified theabundance of accA genes, one of the key genes in the 3-hy-droxypropionate/4-hydroxybutyrate pathway of mesophilicCrenarchaeota. Our results indicated that crenarchaeal accAgenes were almost absent in the euphotic zone but weremore abundant below the euphotic zone. The scarcity ofcrenarchaeal accA genes in the euphotic zone raised thepossibility that epipelagic Crenarchaeota may rely on chemo-lithoheterotrophy and play a minor role in dissolved inor-ganic carbon fixation. However, a ratio of 1 amoA gene copyto 1 accA gene copy was found previously in the meta-genomic data set recovered from surface water of the Sar-gasso Sea (21). One possible explanation for this discrep-ancy is that some accA genes of epipelagic Crenarchaeotamight have been missed in our qPCR assays, since the prim-ers commonly used were designed based on only a fewavailable sequences (25). In contrast, in the upper mesope-lagic zone, the ratios of crenarchaeal accA to MGI 16SrRNA genes or to crenarchaeal amoA genes were close to 1,
which was in agreement with our previous investigation inthe South China Sea (25). This finding suggested that am-monia oxidization may be an important energy source forautotrophic CO2 fixation by MGI in deep waters (1, 24).Such chemoautotrophy can reduce the respiratory consump-tion of DOM and further provide fresh DOM for othermicrobial carbon demands. An earlier study revealed thatCO2 fixation by marine Crenarchaeota can meet the substan-tial carbon demand of the deep-sea microbial food web (46).A portion of such fresh DOM could ultimately be trans-formed into recalcitrant DOM through the microbial carbonpump contributing ocean carbon sequestration (28). Theincreasing ratio of crenarchaeal accA to amoA or to MGI16S rRNA genes from the euphotic zone to the mesopelagiczone suggests that MGI could play a more important role inthe dark ocean. The recognition of such a function of ar-chaea at taxonomic- and functional-group levels would shedlight on the mechanisms of carbon cycling in the ocean. Acomprehensive view of the archaeal community structureand its ecological functioning is to be acquired throughmultiple approaches, including metagenomics, proteomics,and metabolomics, in the future.
ACKNOWLEDGMENTS
We thank the captain and crew of the RV Dongfanghong #2, L. K.Hao and H. Y. Cai for assistance during sampling, J. W. Tian forproviding the temperature and salinity data, and Lawrence David andAlbert Wang for assistance in using the Adapt ML software. We thankJohn Hodgkiss for his help in polishing the English.
FIG. 7. Clustering of the crenarchaeal amoA and accA clone libraries based on the weighted UniFrac algorithm (a and b) or based onthe Bray-Curtis algorithm of ecotype abundance (c and d). The scale bar indicates the UniFrac distance (a and b) or the Bray-Curtis distance(c and d).
7476 HU ET AL. APPL. ENVIRON. MICROBIOL.
This work was supported by the NSFC project (grants 91028001,41076063, 40906059), the SOA project (grant 201105021), and theNCET (09-0683). Anyi Hu was partially supported by the MEL YoungScientist Visiting Fellowship (MELRS1026) from the State Key Lab-oratory of Marine Environmental Science at Xiamen University.
REFERENCES
1. Agogue, H., M. Brink, J. Dinasquet, and G. J. Herndl. 2008. Major gradientsin putatively nitrifying and non-nitrifying Archaea in the deep North Atlan-tic. Nature 456:788–791.
2. Agogue, H., D. Lamy, P. R. Neal, M. L. Sogin, and G. J. Herndl. 2011. Watermass specificity of bacterial communities in the North Atlantic revealed bymassively parallel sequencing. Mol. Ecol. 20:258–274.
3. Bano, N., S. Ruffin, B. Ransom, and J. T. Hollibaugh. 2004. Phylogeneticcomposition of Arctic Ocean archaeal assemblages and comparison withAntarctic assemblages. Appl. Environ. Microbiol. 70:781–789.
4. Beman, J. M., and C. A. Francis. 2006. Diversity of ammonia-oxidizingarchaea and bacteria in the sediments of a hypernutrified subtropical estu-ary: Bahia del Tobari, Mexico. Appl. Environ. Microbiol. 72:7767–7777.
5. Beman, J. M., B. N. Popp, and C. A. Francis. 2008. Molecular and biogeo-chemical evidence for ammonia oxidation by marine Crenarchaeota in theGulf of California. ISME J. 2:429–441.
6. Brochier-Armanet, C., B. Boussau, S. Gribaldo, and P. Forterre. 2008.Mesophilic Crenarchaeota: proposal for a third archaeal phylum, the Thau-marchaeota. Nat. Rev. Microbiol. 6:245–252.
7. Carlson, C. A., et al. 2009. Seasonal dynamics of SAR11 populations in theeuphotic and mesopelagic zones of the northwestern Sargasso Sea. ISME J.3:283–295.
7a.Chen, C., J. Zhu, R. C. Beardsley, and P. J. S. Franks. 2003. Physical-biological sources for dense algal blooms near the Changjiang River. Geo-phys. Res. Lett. 30:22–1–22-4.
8. Church, M. J., B. Wai, D. M. Karl, and E. F. DeLong. 2010. Abundances ofcrenarchaeal amoA genes and transcripts in the Pacific Ocean. Environ.Microbiol. 12:679–688.
9. Culman, S., R. Bukowski, H. Gauch, H. Cadillo-Quiroz, and D. Buckley.2009. T-REX: software for the processing and analysis of T-RFLP data.BMC Bioinformatics 10:171.
10. De Corte, D., T. Yokokawa, M. M. Varela, H. Agogue, and G. J. Herndl. 2009.Spatial distribution of Bacteria and Archaea and amoA gene copy numbersthroughout the water column of the Eastern Mediterranean Sea. ISME J.3:147–158.
11. DeLong, E. F. 1992. Archaea in coastal marine environment. Proc. Natl.Acad. Sci. U. S. A. 89:5685–5689.
12. DeLong, E. F., et al. 2006. Community genomics among stratified microbialassemblages in the ocean’s interior. Science 311:496–503.
13. Francis, C. A., K. J. Roberts, J. M. Beman, A. E. Santoro, and B. B. Oakley.2005. Ubiquity and diversity of ammonia-oxidizing archaea in water columnsand sediments of the ocean. Proc. Natl. Acad. Sci. U. S. A. 102:14683–14688.
14. Fuhrman, J. A. 2009. Microbial community structure and its functionalimplications. Nature 459:193–199.
15. Fuhrman, J. A., K. McCallum, and A. A. Davis. 1992. Novel major archae-bacterial group from marine plankton. Nature 356:148–149.
16. Galand, P. E., et al. 2009. Archaeal diversity and a gene for ammoniaoxidation are coupled to oceanic circulation. Environ. Microbiol. 11:971–980.
17. Galand, P. E., M. Potvin, E. O. Casamayor, and C. Lovejoy. 2009. Hydrog-raphy shapes bacterial biogeography of the deep Arctic Ocean. ISME J.4:564–576.
18. Garcia-Martinez, J., and F. Rodriguez-Valera. 2000. Microdiversity of un-cultured marine prokaryotes: the SAR11 cluster and the marine Archaea ofgroup I. Mol. Ecol. 9:935–948.
19. Good, I. J. 1953. The population frequencies of species and the estimation ofpopulation parameters. Biometrika 40:237–264.
20. Hallam, S. J., et al. 2006. Genomic analysis of the uncultivated marinecrenarchaeote Cenarchaeum symbiosum. Proc. Natl. Acad. Sci. U. S. A.103:18296–18301.
21. Hallam, S. J., et al. 2006. Pathways of carbon assimilation and ammoniaoxidation suggested by environmental genomic analyses of marine Crenar-chaeota. PLoS Biol. 4:e95.
22. Hamilton, A. K., C. Lovejoy, P. E. Galand, and R. G. Ingram. 2008. Watermasses and biogeography of picoeukaryote assemblages in a cold hydro-graphically complex system. Limnol. Oceanogr. 53:922–935.
23. Hammer, Ø., D. A. T. Harper, and P. D. Ryan. 2001. PAST: paleontologicalstatistics software package for education and data analysis. Palaeontol. Elec-tron. 4:9.
24. Hansman, R. L., et al. 2009. The radiocarbon signature of microorganisms inthe mesopelagic ocean. Proc. Natl. Acad. Sci. U. S. A. 106:6513–6518.
25. Hu, A., N. Jiao, and C. L. Zhang. 2011. Community structure and function ofplanktonic Crenarchaeota: changes with depth in the South China Sea.Microb. Ecol. 61:549–563.
26. Hu, A., et al. 2010. Community structures of ammonia-oxidising archaea and
bacteria in high-altitude lakes on the Tibetan Plateau. Freshw. Biol. 55:2375–2390.
27. Hunt, D. E., et al. 2008. Resource partitioning and sympatric differentiationamong closely related bacterioplankton. Science 320:1081–1085.
28. Jiao, N., et al. 2010. Microbial production of recalcitrant dissolved organicmatter: long-term carbon storage in the global ocean. Nat. Rev. Microbiol.8:593–599.
29. Jiao, N., Y. Yang, H. Koshikawa, and M. Watanabe. 2002. Influence ofhydrographic conditions on picoplankton distribution in the East China Sea.Aquat. Microb. Ecol. 30:37–48.
30. Kalanetra, K. M., N. Bano, and J. T. Hollibaugh. 2009. Ammonia-oxidizingArchaea in the Arctic Ocean and Antarctic coastal waters. Environ. Micro-biol. 11:2434–2445.
31. Karner, M. B., E. F. DeLong, and D. M. Karl. 2001. Archaeal dominance inthe mesopelagic zone of the Pacific Ocean. Nature 409:507–510.
32. Konneke, M., et al. 2005. Isolation of an autotrophic ammonia-oxidizingmarine archaeon. Nature 437:543–546.
33. Konstantinidis, K. T., J. Braff, D. M. Karl, and E. F. DeLong. 2009. Com-parative metagenomic analysis of a microbial community residing at a depthof 4,000 meters at station ALOHA in the North Pacific Subtropical Gyre.Appl. Environ. Microbiol. 75:5345–5355.
34. Kowalchuk, G. A., and J. R. Stephen. 2001. Ammonia-oxidizing bacteria: amodel for molecular microbial ecology. Annu. Rev. Microbiol. 55:485–529.
34a.Lee, Z. P., et al. 2007. Euphotic zone depth: its derivation and implication toocean-color remote sensing. J. Geophys. Res. 112:C03009.
35. Liu, B., et al. 2009. Community structure of Archaea in the water columnabove gas hydrates in the Gulf of Mexico. Geomicrobiol. J. 26:363–369.
36. Lozupone, C., M. Hamady, and R. Knight. 2006. UniFrac—an online tool forcomparing microbial community diversity in a phylogenetic context. BMCBioinformatics 7:371.
37. Ludwig, W., et al. 2004. ARB: a software environment for sequence data.Nucleic Acids Res. 32:1363–1371.
38. Martens-Habbena, W., P. M. Berube, H. Urakawa, J. R. de la Torre, andD. A. Stahl. 2009. Ammonia oxidation kinetics determine niche separation ofnitrifying Archaea and Bacteria. Nature 461:976–979.
39. Martiny, J. B. H., et al. 2006. Microbial biogeography: putting microorgan-isms on the map. Nat. Rev. Microbiol. 4:102–112.
40. Massana, R., E. F. DeLong, and C. Pedros-Alio. 2000. A few cosmopolitanphylotypes dominate planktonic archaeal assemblages in widely differentoceanic provinces. Appl. Environ. Microbiol. 66:1777–1787.
41. Millero, F. J., C. Chen, A. Bradshaw, and K. Schleicher. 1980. A new highpressure equation of state for seawater. Deep Sea Res. 27A:255–264.
42. Mincer, T. J., et al. 2007. Quantitative distribution of presumptive archaealand bacterial nitrifiers in Monterey Bay and the North Pacific SubtropicalGyre. Environ. Microbiol. 9:1162–1175.
43. Molina, V., L. Belmar, and O. Ulloa. 2010. High diversity of ammonia-oxidizing archaea in permanent and seasonal oxygen-deficient waters of theeastern South Pacific. Environ. Microbiol. 12:2450–2465. doi:10.1111/j.1462-2920.2010.02218.x.
44. Nicol, G. W., S. Leininger, C. Schleper, and J. I. Prosser. 2008. The influenceof soil pH on the diversity, abundance and transcriptional activity of ammo-nia oxidizing archaea and bacteria. Environ. Microbiol. 10:2966–2978.
44a.Oakley, B. B., F. Carbonero, C. J. van der Gast, R. J. Hawkins, and K. J.Purdy. 2010. Evolutionary divergence and biogeography of sympatric niche-differentiated bacterial populations. ISME J. 4:488–497.
45. Ochsenreiter, T., D. Selezi, A. Quaiser, L. Bonch-Osmolovskaya, and C.Schleper. 2003. Diversity and abundance of Crenarchaeota in terrestrialhabitats studied by 16S RNA surveys and real time PCR. Environ. Microbiol.5:787–797.
46. Reinthaler, T., H. M. van Aken, and G. J. Herndl. 2010. Major contributionof autotrophy to microbial carbon cycling in the deep North Atlantic’sinterior. Deep Sea Res. II 57:1572–1580.
47. Ronquist, F., and J. P. Huelsenbeck. 2003. MrBayes 3: Bayesian phylogeneticinference under mixed models. Bioinformatics 19:1572–1574.
48. Santoro, A. E., K. L. Casciotti, and C. A. Francis. 2010. Activity, abundanceand diversity of nitrifying archaea and bacteria in the central Californiacurrent. Environ. Microbiol. 12:1989–2006.
49. Schattenhofer, M., et al. 2009. Latitudinal distribution of prokaryotic pico-plankton populations in the Atlantic Ocean. Environ. Microbiol. 11:2078–2093.
50. Schloss, P. D., and J. Handelsman. 2005. Introducing DOTUR, a computerprogram for defining operational taxonomic units and estimating speciesrichness. Appl. Environ. Microbiol. 71:1501–1506.
51. Spang, A., et al. 2010. Distinct gene set in two different lineages of ammonia-oxidizing archaea supports the phylum Thaumarchaeota. Trends Microbiol.18:331–340.
52. Stamatakis, A., T. Ludwig, and H. Meier. 2005. RAxML-III: a fast programfor maximum likelihood-based inference of large phylogenetic trees. Bioin-formatics 21:456–463.
53. Swofford, D. L. 2003. PAUP*, phylogenetic analysis using parsimony (*andother methods), version 4. Sinauer Associates, Sunderland, MA.
54. Treusch, A. H., et al. 2005. Novel genes for nitrite reductase and Amo-
VOL. 77, 2011 NICHE PARTITIONING OF PELAGIC CRENARCHAEOTA 7477

related proteins indicate a role of uncultivated mesophilic crenarchaeota innitrogen cycling. Environ. Microbiol. 7:1985–1995.
55. Treusch, A. H., et al. 2009. Seasonality and vertical structure of microbialcommunities in an ocean gyre. ISME J. 3:1148–1163.
56. Venter, J. C., et al. 2004. Environmental genome shotgun sequencing of theSargasso Sea. Science 304:66–74.
57. Walker, C. B., et al. 2010. Nitrosopumilus maritimus genome reveals uniquemechanisms for nitrification and autotrophy in globally distributed marinecrenarchaea. Proc. Natl. Acad. Sci. U. S. A. 107:8818–8823.
58. Wuchter, C., et al. 2006. Archaeal nitrification in the ocean. Proc. Natl. Acad.Sci. U. S. A. 103:12317–12322.
59. Yakimov, M. M., V. L. Conoa, and R. Denaroa. 2009. A first insight into theoccurrence and expression of functional amoA and accA genes of au-
totrophic and ammonia-oxidizing bathypelagic Crenarchaeota of TyrrhenianSea. Deep Sea Res. II 56:748–754.
60. Yakimov, M. M., et al. 2011. Contribution of crenarchaeal autotrophic ammoniaoxidizers to the dark primary production in Tyrrhenian deep waters (CentralMediterranean Sea). ISME J. 5:945–961.
61. Zeng, Y. H., H. Y. Li, and N. Z. Jiao. 2007. Phylogenetic diversity of plank-tonic archaea in the estuarine region of East China Sea. Microbiol. Res.162:26–36.
62. Zhang, R., V. Thiyagarajan, and P. Y. Qian. 2008. Evaluation of terminal-restriction fragment length polymorphism analysis in contrasting marineenvironments. FEMS Microbiol. Ecol. 65:169–178.
63. Zhang, Y., and N. Jiao. 2007. Dynamics of aerobic anoxygenic phototrophicbacteria in the East China Sea. FEMS Microbiol. Ecol. 61:459–469.
7478 HU ET AL. APPL. ENVIRON. MICROBIOL.