NIC Investment Guide
20
NIC Investment Guide Investing in Seniors Housing & Care Properties FIFTH EDITION EXECUTIVE SUMMARY
Transcript of NIC Investment Guide

NIC Investment GuideInvesting in Seniors Housing & Care PropertiesFIFTH EDITION
EXECUTIVE SUMMARY

Freedom Pointe at The VillagesThe Villages, FL
Table of ContentsAppendix A: Glossary
Appendix B: Factors Affecting Demand
Appendix C: Needs Assessment and Pricing
Appendix D: Entrance-Fee CCRCs
Appendix E: Alternative Housing and Services
Appendix F: Development Considerations
Appendix G: Underwriting Criteria and Financing Terms
Appendix H: General Legal Requirements
Appendix I: Medicare and Medicaid
Appendix J: Health Care Reform
Appendix K: Risks and Mitigating Factors
Appendix L: Regulations
Appendix M: About NIC MAP
Appendix N: Data Sources
Introduction
Section 1: Executive Summary
Section 2: Emerging Trends and Observations
Section 3: Independent Living
Section 4: Assisted Living
Section 5: Memory Care
Section 6: Nursing Care
Section 7: Continuing Care Retirement Communities
Section 8: Development and Capital Spending
Section 9: Capital Sources
Section 10: Valuations, Returns, and Loan Performance
The complete NIC Investment Guide is available for purchase at www.store.nic/ig.

NIC Investment GuideInvesting in Seniors Housing & Care PropertiesFIFTH EDITION
IntroductionThe NIC Investment Guide: Investing in Seniors Housing & Care
Properties, Fifth Edition provides an overview of the seniors housing
and care sector based on current time-series data. This edition of
the Investment Guide was prepared and reviewed by a task force
of industry professionals within NIC’s Future Leaders Council (FLC)
and NIC staff. The guide helps fulfill NIC’s mission to enable access
and choice in seniors housing and care by providing data, analytics,
and connections that bring together investors and providers.
PurposeThe Investment Guide is designed as a seniors housing and care
primer that investors can use to investigate the opportunities,
challenges, and risks of investing in the sector and help formulate
an investment thesis. It serves as an introduction to the industry’s
investment characteristics, performance, and leading players.
The Investment Guide is intended as a representative overview of
the significant characteristics of the industry. Wherever possible,
it provides information on seniors housing in comparison to other
commercial real estate property. Sources used are listed in an ap-
pendix that readers can utilize to review more detailed information
on the specific issues that interest them.
Data UsedThis data-based overview has been made possible by the tremen-
dous progress in data collection by the industry over the past 12
years. The NIC MAP® Data Service (NIC MAP), which now tracks
and reports on 140 of the nation’s metropolitan markets, has
provided reliable time-series data for the past 12 years for industry
performance on occupancy, rent growth, supply, and construction.
For time-series data in this publication, unless otherwise noted, we
use aggregates for the nation’s 31 Primary Markets (i.e., metropoli-
tan markets), because data from those markets is available starting
from 4Q2005. For point-in-time comparisons, data for all of NIC
MAP’s 99 Primary and Secondary Markets as of year-end 2017 is
used since it is more representative of the overall seniors housing
and care market. See Appendix M for a listing of all the metropoli-
tan markets tracked by NIC MAP.
Through NIC’s strategic alliance with Real Capital Analytics, NIC
MAP also reports pricing and volume metrics on closed sales
transactions of seniors housing and care properties throughout the
U.S. for the past ten years. The National Council of Real Estate
Investment Fiduciaries (NCREIF) has tracked the investment return
performance of seniors housing properties since 2003, and the
expanded and improved State of Seniors Housing provides yearly
snapshots of industry performance in key areas such as expenses
and operating margins. Together, these data sources offer essential
information on net operating income (NOI), margins, and invest-
ment returns.
For data consistency, wherever possible, the Investment Guide uses
data as of the end of 2017.
Throughout the creation of the Investment Guide, we had to decide
what information to include and what to exclude, either because
the data integrity was questionable or because the information was
considered beyond the scope of a primer. There were a number of
places where the FLC task force and NIC staff recognized that qual-
ity data simply was not available and that further work was needed
to collect and report such data in the future. NIC is committed to
working with others in the industry to fill these data gaps for future
editions of this publication. Please share any comments and sug-
gestions you have to improve future editions of the publication and
advance industry transparency.
Introduction 1

2 NIC Investment Guide
Organization of the Report The Investment Guide begins with an executive summary that
provides an overview and roadmap to the entire report. The
fifth edition also includes the popular Emerging Trends and
Observations (Section 2) that was introduced in the third edition of
the Investment Guide. While the majority of the publication relies
on data to review past performance, the Emerging Trends and
Observations section relies on expert opinions to provide a
forward-looking perspective.
The technical chapters of the Investment Guide begin with a
detailed description of each seniors housing and care community
type that is covered in Sections 3 through 7. This fifth edition
includes a separate chapter on properties focused primarily on
memory care, rather than combining memory care properties with
assisted living. The community type descriptions include resident
profiles, supply data, industry operating structures, operating
economics, and current trends. In Section 8, we discuss the
development and construction of new properties and the acquisition
of existing properties. Section 9 provides an overview of debt
and equity sources of capital for the seniors housing and care
industry. Finally, Section 10 discusses valuations, returns, and loan
performance.
We have included a comprehensive set of appendices with
information that will interest investors in seniors housing and care
properties, such as demographics (Appendix B). The appendices
also include detailed information on entrance-fee continuing care
retirement communities, which are also referred to as life plan
communities (Appendix D), and lender underwriting standards
(Appendix G).
Notes on Data Sources and FootnotesAppendix N includes a list of all data sources referenced in the
Investment Guide. Numbered footnotes refer to the data sources
in Appendix N. Sources in Appendix N are listed in order of
those most frequently referenced in the Investment Guide. The
numbering of the footnotes is often not sequential. In general, we
have used the most timely, accurate, and reliable data available.
AcknowledgmentsNIC would like to express its sincere appreciation to several groups
whose efforts were instrumental in the development and production
of this guide. First, NIC would like to thank the members of NIC’s
Future Leaders Council (FLC) who contributed to this guide. This
group’s main responsibilities were writing an initial draft of the
select sections in the report, reviewing chapters written by NIC staff,
and providing authorship for the Emerging Trends and Observations
section. Members of the FLC task force included:
• Lee Delaveris, Vice President, KeyBank Real Estate Capital
• Andrew Lavinder, Vice President, MidCap Financial
Services, LLC
• Jerry Taylor, Director of Sales & Investments, National Health
Investors REIT
• Sara Veit, Managing Director, Omega Healthcare Investors, Inc.
• Dustin Warner, Vice President, Harrison Street Real Estate
Capital, LLC
• Kris Woolley, Founder and CEO, Avista Senior Living
• Jennifer Zhao, Assistant Vice President, AEW Capital Management
We would like to acknowledge the significant contributions of NIC
staff members, including Lana Peck, who was the project leader
extraordinaire of the entire guide, Leighann Garcia, Chuck Harry,
Bill Kauffman, Liz Liberman, Beth Burnham Mace, Molly McCarter,
Dan Raney, and Anne Standish. We would also like to thank Melissa
Cohen, who consulted on select portions of the guide.

Abiitan Mill CityMinneapolis, MN

The NIC Investment Guide: Investing in Seniors Housing & Care Properties serves as a primer for understanding the seniors housing and care property sector. The Investment Guide covers the investment characteristics of the sector, as well as its performance and the leading players. Our aim is to provide the most current and reliable industry data for investors to help them evaluate opportunities, risks, and returns, and fine-tune their individual investment strategies. The Investment Guide is an outgrowth and reflection of NIC’s mission to provide data, analytics, and connections, all of which advance the access and choice of seniors housing and care for America’s elders—from independent living, assisted living, and memory care, to skilled nursing and post-acute care.
1.1 Seniors Housing and Care PropertiesThe seniors housing and care industry provides both housing and an array of services to seniors, generally to those over the age of 75. Care segments are commonly divided into four categories:• Independent living (IL)• Assisted living (AL)• Memory care (MC)• Nursing care (NC)
Nursing care has traditionally been provided in an institutional-style setting, although there is a growing movement toward a more homelike setting. The other care segments typically are provided in a multifamily setting. Seniors housing and care properties also include continuing care retirement communities (CCRCs), also referred to as life plan communities, which must offer at least two care segments (i.e., independent living and nursing care) in a single community. For purposes of this report, the term “seniors housing” excludes nursing care properties and 55+ seniors apartments, whereas the term “seniors housing and care properties” includes all of the properties providing the care segments outlined previously but not 55+ seniors apartments.
In the U.S., there currently are approximately 23,500 investment-grade seniors housing and care properties containing 3 million units. For the purposes of this report, we use “investment grade” to define
age-restricted properties with at least 25 units/beds that charge market rates for the housing and services offered. These estimates do not include many smaller “board and care” properties, which are not considered for purchase by the typical institutional investor yet serve a sizable population of seniors. The total value of this investment-grade seniors housing and care property market is estimated at $409 billion (assuming a $181,000 price per unit for seniors housing properties and an $84,000 price per bed for nursing care properties).1
Exhibit 1.a shows the number of properties and units offered within the different community types, campus types, and care segments. (See Appendix A for definitions of these terms.)
Section 1:Executive Summary
In this section1.1 Seniors Housing and Care Properties ______________________________ 41.2 Seniors Population ___________________________________________ 61.3 Performance Comparisons ______________________________________ 81.4 Property Ownership and Large Operators ____________________________ 9
By Community Type # Properties # Units***
Independent Living (IL) 2,800 427,000
Assisted Living (AL) 7,200 595,000
Memory Care (MC) 1,400 73,000
Nursing Care (NC) 10,300 1,344,000
CCRC/Life Plan Community 1,800 604,000
Total 23,500 3,043,000
By Campus Type # Properties # Units***
CCRC/Life Plan Community 1,800 604,000
Combined 6,900 845,000
Freestanding 14,800 1,594,000
Total 23,500 3,043,000
By Care Segment # Properties # Units***
Independent Living (IL) 695,000
Assisted Living (AL) 659,000
Memory Care (MC) 215,000
Nursing Care (NC) 1,474,000
Total 3,043,000* Current estimates are not comparable to estimates from prior years due to different estimation techniques.** Estimates are representative of properties with at least 25 units/beds that charge market rates and/or accept Medicaid for the housing and services offered.*** One nursing bed is equivalent to one unit. Source: NIC MAP® Data Service, NIC
Exhibit 1.aSupply of Investment-Grade*Seniors Housing and Care Properties in the U.S.By Property and Unit Counts across Community Types, Campus Types, and Care Segments | Estimates as of 4Q17**
4 NIC Investment Guide

Care segments are defined as the type and level of services offered
by properties. Community types are classified by the plurality of
units by care segment offered. (For example, an assisted living
community with 10 independent living units, 60 assisted living
units, and 30 nursing care beds is classified as an assisted living
community, as is any combined property with a plurality of assisted
living units or a freestanding assisted living property.)
The campus type of a property depends on the number and
possible combination of care segments offered:
• CCRCs offer independent living and nursing care at the same
property (although assisted living and memory care are generally
offered as well).
• Combined campuses offer at least two different care segments
(e.g., independent living and assisted living). However, these
do not include properties that offer independent living and
nursing care, because they are considered CCRCs.
• Freestanding campuses offer only one type of care segment
(e.g., independent living only).
Exhibit 1.b highlights the array of services offered across the
different property types. Besides housing (including both shelter
and amenities), seniors housing and care properties offer residents
myriad services:
• Hospitality services—meals, transportation, housekeeping,
entertainment, and concierge services.
• Care services—assistance with bathing, grooming, dressing,
eating, medication management, and other activities of daily
living (ADLs).
• Medical services—skilled nursing, rehab therapy, and
chronic care.
The care and medical service mix at the property increases with the
residents’ needs. Independent living typically serves the most able
residents and offers primarily hospitality services. Nursing care,
on the other hand, serves the residents with the greatest medical
needs and, accordingly, has the most intensive services.
A continuing trend in seniors housing and care has been the
rising acuity levels of residents upon initial move-in across the
care segments. As a result, independent living and assisted living
operators often care for residents who already have some ADL
needs. In addition, skilled nursing operators increasingly are serving
residents in need of short-term rehabilitation services or those with
high-acuity medical care needs who were previously served for a
more extended period of time in an acute care hospital, a long-term
acute care hospital, or an in-patient rehabilitation facility. Some
independent living and assisted living operators now provide home
healthcare, therapy, and other services to residents in order to
better meet the needs of residents in their properties. Others allow
residents independently to engage third-party service providers to
meet care needs that could not otherwise be accommodated in
their properties either by the decision of the operator or by the state
regulatory framework.
Exhibit 1.bProperty Types by Services Provided
Skilled Nursing
ShelterActivities,
RecreationTransport,Laundry Meals Care Services
Short-TermPost-Acute Care
Long-TermChronic Care
Seniors Apartments
Independent Living
Assisted Living
Nursing Care Real Estate Component
Real Estate Component
Real Estate Component
Services Component
Services Component
Services Component
Real Estate Component
Section 1: Executive Summary 5

Independent Living Assisted Living Memory Care Nursing Care Communities Communities Communities Communities CCRC/LPCs
Average Monthly Rent $3,050 $4,577 $6,301 $9,463* $3,119
Median Number of Units 136 78 48 120 290
Median Age of Buildings (years) 19 19 15 38 33
* The nursing care average monthly rent is the average private-pay per diem rate calculated on a monthly basis; see Section 6 for the Medicare and Medicaid rates. Source: NIC MAP® Data Service
Exhibit 1.dSelected Metrics by Community TypeAs of 4Q17
1.2 Seniors PopulationSeniors who are in need of services and their families drive demand
for seniors housing and care properties. For purposes of this report,
the average age of residents in seniors housing is believed to be
presently in the mid-80s, while the average move-in age is in the
low- to mid-80s. The population of individuals aged 80 years or
older provides a reasonable benchmark for potential demand. The
population estimate of individuals aged 80 years or older for 2016
was 12.2 million, which represented 4% of the U.S. population.
Exhibit 1.e shows the breakout of age cohorts by individuals and by
households.7
The sizes of the 80+ and 85+ populations are expected to increase
at a rate of approximately 2% and 1.2% per year, respectively,
during the remainder of the decade, while the early part of the next
decade will see elderly population growth accelerate—averaging
3.4% and 2.1%, respectively, from 2021 through 2025. (See
Exhibit 1.f.) More precision can be found by looking at the 82- to
6 NIC Investment Guide
Exhibit 1.c highlights the average asking monthly rents for each
care segment, reflecting the needs level and the accompanying
service mix. (See Appendix C for more detail regarding needs
assessment and pricing.)
Exhibit 1.d provides select metrics that further quantify some of the
distinctions between the different seniors housing and care community
types.
Exhibit 1.cAverage Monthly Rent by Care SegmentAs of 4Q17
*The nursing care monthly rent is the average private-pay per diem rate calculated on a monthly basis; see Section 6 for the Medicaid and Medicare rates. Source: NIC MAP® Data Service
Independent Living
Assisted Living
Memory Care
Nursing Care
$0 $2,000 $4,000 $6,000 $8,000 $10,000 $12,000
Average Monthly Rent
Housing, Housekeeping, Laundry, Meals, Socialization, Skilled Nursing Care
Housing, Housekeeping, Laundry, Meals, Socialization, Personal Care, Memory Support
Housing, Housekeeping, Laundry, Meals, Socialization, Personal Care
Housing, Housekeeping, Laundry, Meals, Socialization

86-year-old age cohort, which best captures the average move-in
age of seniors housing residents. This population cohort is projected
to expand by 1.4% in 2018 and then accelerate through the next
several years, averaging 2% growth over the balance of the current
decade and then 4.3% per year from 2021 through 2025.
The latter part of the 2020s will see the beginning of significant
acceleration in this population, with the 80+ population growth rate
averaging roughly 4.8% per year from 2026 through 2030. The 85+
population cohort will not grow quite as fast but still will average
nearly 4.0% over the same period, while the 82–86 cohort will
average 5.3% per year.6
A way to measure the utilization of seniors housing by seniors is
the penetration rate. Industry penetration can be calculated in a
variety of ways and will vary by region, age, or population cohort.
Dividing the total U.S. inventory of seniors housing units by the U.S.
population aged 80 years or older yields an estimate of 12.6% as of
2017, while dividing it by the U.S. population aged 75 years or older
yields an estimate of 7.6%. Other measures of penetration rates use
U.S. households older than 75 or, in some instances, population
and household estimates are income qualified. (See Appendix B for
more details about demand drivers.)
While more than 1.4 million people live in seniors housing, demand
may be constrained by many seniors’ hesitancy to leave their homes
and anxiety concerning monthly rent payments, particularly
Population (Millions) Households (Millions)
Number % of Total Number % of Total
45-64 84.2 26% 46.6 39%
65-74 28.6 9% 18.2 14%
75-84 14.2 4% Not Available
75+ 20.6 6% 13.6 11%
80+ 12.2 4% Not Available
85+ 6.4 2% Not Available
* Population estimates for 2016 and household estimates for 2017Source: U.S. Census Bureau
Exhibit 1.eU.S. Population and Households by Age Cohort*
Section 1: Executive Summary 7
Exhibit 1.fAnnual Population Growth Rate Projections2017–2050
12%
10%
8%
6%
4%
2%
0%
-2%
-4%
Population 25-35 Population 75+ Population 80+ Population 82-86 Population 85+
Source: U.S. Census 2017 Population Projections
2017
2018
2019
2020
2021
2022
2023
2024
2025
2026
2028
2029
2030
2031
2032
2033
2034
2035
2036
2037
2038
2039
2040
2041
2042
2043
2044
2045
2046
2047
2049
2050
2048
2027

for those households who own their homes. Because of this
preference, many businesses provide services to seniors within their
existing homes as an alternative to the housing and services offered
by seniors housing and care properties. We refer to these services
as “alternative services.” (Detailed descriptions of alternative
housing and services are provided in Appendix E.)
1.3 Performance ComparisonsFor many investors, the combined components of real estate,
hospitality, and needs-driven services give seniors housing and care
properties a unique resiliency, offering the benefits of real estate
investment along with the characteristics of the health care field.
This resiliency was evident during the real estate downturn of 2008–
2009, when seniors housing and care properties outperformed
other commercial real estate property types in terms of investment
returns and rent growth.
The NCREIF Property Index (NPI) is a leading U.S. quarterly
time series composite total rate of return measure of investment
performance (gross of fees) of a very large pool of individual
commercial real estate properties acquired in the private market for
investment purposes only. NCREIF is the acronym for the National
Council of Real Estate Investment Fiduciaries. All properties in the
NPI have been acquired, at least in part, on behalf of tax-exempt
institutional investors—the great majority being pension funds.
As such, all properties are held in a fiduciary environment. As of
4Q2017, the NPI comprised 7,527 properties with a combined
market value of $559.8 billion.9
Over the past 10 years, as seen in Exhibit 1.g, the nominal returns
on the seniors housing properties within NCREIF’s database (but
which are not included in the NPI) have outperformed the nominal
performance return measurements for the broad NPI as well as for
the other individual NPI indices. As of 4Q2017, seniors housing
properties had generated an annualized return of 10.4% since
4Q2007. This compares to an annualized return of 6.1% for the
entire NPI. Seniors housing has also outperformed the NPI property
types in terms of the appreciation and income components, both
of which are discussed in Section 10. As of 4Q2017, data on 100
stabilized seniors housing properties was reported to NCREIF. The
value of these assets totaled $4.9 billion.9
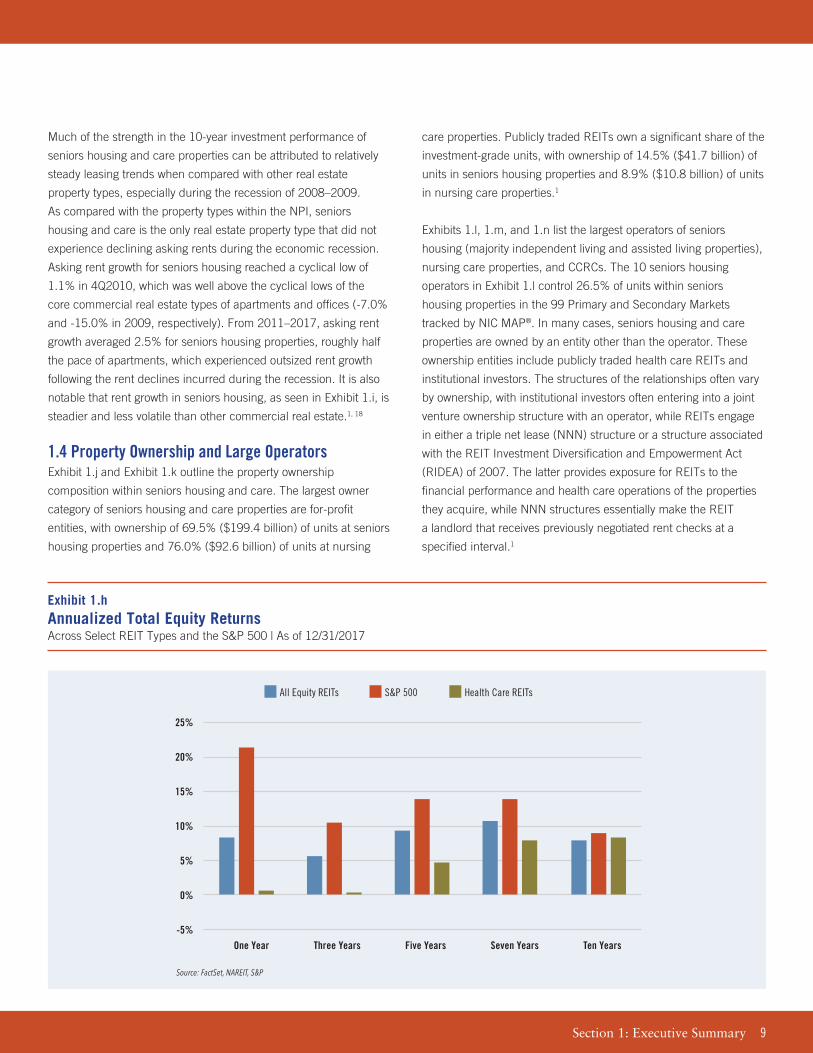
On a 10-year basis, as seen in Exhibit 1.h, publicly traded health
care real estate investment trusts (REITs), for which seniors housing
and care properties represent a significant share of their investment
portfolios, outperformed the FTSE NAREIT Equity REIT Index
(NAREIT) but slightly lagged the S&P 500 Index. However, the
health care REIT sector underperformed the S&P 500 since 2015
as investors shifted out of dividend stocks including REITs. Health
care REITs also underperformed the NAREIT Index since 2015.19
8 NIC Investment Guide
Exhibit 1.gNCREIF Annualized Total Returns Across Select Property TypesAs of 12/31/2017
Source: NCREIF, NIC
NPI Apartment Hotel Industrial Office Retail Seniors Housing
18.0%
16.0%
14.0%
12.0%
10.0%
8.0%
6.0%
4.0%
2.0%
0.0% One Year Three Years Five Years Ten Years
Much of the strength in the 10-year investment performance of
seniors housing and care properties can be attributed to relatively
steady leasing trends when compared with other real estate
property types, especially during the recession of 2008–2009.
As compared with the property types within the NPI, seniors
housing and care is the only real estate property type that did not
experience declining asking rents during the economic recession.
Asking rent growth for seniors housing reached a cyclical low of
1.1% in 4Q2010, which was well above the cyclical lows of the
core commercial real estate types of apartments and offices (-7.0%
and -15.0% in 2009, respectively). From 2011–2017, asking rent
growth averaged 2.5% for seniors housing properties, roughly half
the pace of apartments, which experienced outsized rent growth
following the rent declines incurred during the recession. It is also
notable that rent growth in seniors housing, as seen in Exhibit 1.i, is
steadier and less volatile than other commercial real estate.1, 18
1.4 Property Ownership and Large OperatorsExhibit 1.j and Exhibit 1.k outline the property ownership
composition within seniors housing and care. The largest owner
category of seniors housing and care properties are for-profit
entities, with ownership of 69.5% ($199.4 billion) of units at seniors
housing properties and 76.0% ($92.6 billion) of units at nursing
care properties. Publicly traded REITs own a significant share of the
investment-grade units, with ownership of 14.5% ($41.7 billion) of
units in seniors housing properties and 8.9% ($10.8 billion) of units
in nursing care properties.1
Exhibits 1.l, 1.m, and 1.n list the largest operators of seniors
housing (majority independent living and assisted living properties),
nursing care properties, and CCRCs. The 10 seniors housing
operators in Exhibit 1.l control 26.5% of units within seniors
housing properties in the 99 Primary and Secondary Markets
tracked by NIC MAP®. In many cases, seniors housing and care
properties are owned by an entity other than the operator. These
ownership entities include publicly traded health care REITs and
institutional investors. The structures of the relationships often vary
by ownership, with institutional investors often entering into a joint
venture ownership structure with an operator, while REITs engage
in either a triple net lease (NNN) structure or a structure associated
with the REIT Investment Diversification and Empowerment Act
(RIDEA) of 2007. The latter provides exposure for REITs to the
financial performance and health care operations of the properties
they acquire, while NNN structures essentially make the REIT
a landlord that receives previously negotiated rent checks at a
specified interval.1
Section 1: Executive Summary 9
Exhibit 1.hAnnualized Total Equity ReturnsAcross Select REIT Types and the S&P 500 | As of 12/31/2017
25%
20%
15%
10%
5%
0%
-5%One Year Three Years Five Years Seven Years Ten Years
Source: FactSet, NAREIT, S&P
All Equity REITs S&P 500 Health Care REITs

10 NIC Investment Guide
Exhibit 1.jImplied Market Value of Seniors Housing PropertiesAs of 4Q17
$17.5 billion
$87.4 billion
$140.2 billion
$41.7billion
Publicly Traded Operating Company
Other For-Profit Entity
Publicly Traded REIT
Nonprofit Entity
Source: NIC MAP® Data Service; NIC
Exhibit 1.iCommercial Real Estate Year-Over-Year Asking Rent Growth TrendsAs of 12/31/2017
15%
10%
5%
0%
-5%
-10%
-15%
-20%
Source: NIC MAP® Data Service; Green Street Advisors
2007 2008 2009 2010 2011 2012 2013 2014 2015 2016 2017
Apartment OfficeIndustrial StripMall Seniors Housing
Exhibit 1.kImplied Market Value of Majority Nursing Care PropertiesAs of 4Q17
$4.3 billion
$29.2 billion
$77.5 billion
$10.8billion
Publicly Traded Operating Company
Other For-Profit Entity
Publicly Traded REIT
Nonprofit Entity
Source: NIC MAP® Data Service; NIC

The 10 nursing care operators in Exhibit 1.m control 15.2% of
units within majority nursing care properties in the 99 Primary and
Secondary Markets.1
The 10 CCRC operators in Exhibit 1.n control 22.9% of units within
CCRC properties in the 99 Primary and Secondary Markets.1
Section 1: Executive Summary 11
Exhibit 1.lLargest Seniors Housing Operators in the99 Primary and Secondary MarketsAs of 4Q17
Number of Properties Number of Units Operated* Operated**
Brookdale Senior Living 647 63,351
Holiday Retirement 185 22,914
Sunrise Senior Living 248 20,439
Atria Senior Living 155 18,722
Five Star Senior Living 131 13,495
Senior Lifestyle Corporation 104 12,304
Life Care Services 55 8,033
Capital Senior Living Corp 71 7,769
Integral Senior Living 46 5,377
Senior Resource Group 29 5,065
10 Largest Operator’s Share of Total Units 26.5%
*Includes independent living, assisted living, and memory care communities.**Includes all units within the property. May also contain nursing beds.
Source: NIC MAP® Data Service
Exhibit 1.mLargest Nursing Care Operators in the99 Primary and Secondary MarketsAs of 4Q17
Number of Properties Number of Units Operated* Operated**
Genesis HealthCare 281 35,904
HCR ManorCare 165 22,917
Sava Senior Care 98 12,376
Life Care Centers of America 87 10,640
Consulate Health Care 78 9,296
Ensign Group 80 8,906
CommuniCare Health Services 60 8,013
National HealthCare Corporation 43 6,453
Kindred Healthcare 48 6,024
Diversicare 43 4,516
10 Largest Operator’s Share of Total Units 15.2%
*Includes nursing care properties.**May include independent living units, assisted living units, or memory care units in addition to nursing care beds.
Source: NIC MAP® Data Service
Exhibit 1.nLargest CCRC/Life Plan Community Operators in the 99 Primary and Secondary MarketsAs of 4Q17
Number of Properties Number of Units Operated* Operated**
Erickson Living 18 23,308
Life Care Services 49 19,578
Brookdale Senior Living 34 12,546
Five Star Senior Living 26 7,243
ACTS Retirement-Life Communities 13 5,085
Covenant Retirement Communities 11 4,258
Lifespace Communities 11 4,240
Vi Senior Living 8 3,065
Presbyterian Homes & Services 8 2,643
Sunrise Senior Living 6 2,604
10 Largest Operator’s Share of Total Units 22.9%
*Includes CCRCs/Life plan communities. **Includes all units within the property, including nursing beds.
Source: NIC MAP® Data Service

Brightview West EndRockville, MD

Section 2: Emerging Trends and Observations 13
Throughout most of this document, NIC relies on data-driven
observations to inform investors about the seniors housing and
care industry. This section is different because it draws upon the
judgment of industry participants to make observations and discuss
trends that presently are emerging, for which reliable empirical
data may not be available. The observations are presented in the
spirit of contributing to a timely and forward-looking document.
The observations and trends fall into five broad areas: supply and
demand, operating strategies, capital markets, the labor market, and
regulation.
2.1 Supply and Demand• High Construction Activity. The historically strong
operational and investment performance of seniors
housing, expectations for strengthening demand due to
demographic growth, and availability of capital have helped
fuel investment activity in the seniors housing market in
recent years. Demand for existing high-quality seniors
housing properties has generally outpaced supply in
recent years, which has driven average transaction prices
higher. Subsequently, these conditions have caused some
investors to turn to new development opportunities to grow
their seniors housing portfolios in the pursuit of higher
investment returns. As a result, some metropolitan markets
have experienced significant amounts of new construction,
with much of the new development focused on private pay
assisted living and memory care. As a result, supply has
outpaced demand in a number of markets, resulting in
downward pressure on occupancy. Some investors speculate
that the best return opportunities may shift in the coming
years toward acquiring failed development projects or
repositioning older properties through investment in capital
improvement projects. The rising costs of construction and
borrowing may prove to be mitigating factors going forward.
• Addressing Affordability. Industry participants are exploring
ways to make seniors housing more affordable and serve a
less affluent resident. Among these efforts, NIC awarded a
research grant to the non-partisan and objective research
organization NORC at the University of Chicago in 2017,
with published results anticipated for mid-2019. The grant
is intended to help define and quantify the “middle market”
seniors population through 2029. As many baby boomers
(born between 1946 and 1964) have not saved sufficiently,
it is generally believed that there will be an increasing need
for lower-cost seniors housing and care options and/or a
greater availability of subsidies for care costs as the U.S.
population ages. While the majority of new construction
activity has been focused on private-pay, market-rate
projects, some developers and operators have been
innovating to address demand for more affordable seniors
housing. New development approaches have been pursued
to reduce costs, including redeveloping existing real estate
rather than ground-up new construction.
• Residents’ Entry Age and Acuity Continue to Increase. On
average, seniors are older and frailer at the time of moving
into a seniors housing community today than they were
in the past. Following the Great Recession, many seniors
delayed moving into seniors housing due to economic
uncertainty and weakness in the single-family resale market,
as proceeds from the sale of a home are often accessed
Section 2:Emerging Trendsand Observations
In this section
2.1 Supply and Demand _________________________________________ 132.2 Operating Strategies ________________________________________ 142.3 Capital Markets ____________________________________________ 152.4 Labor Market ______________________________________________ 162.5 Regulation _______________________________________________ 16

14 NIC Investment Guide
to pay for seniors housing rents and services. However,
the average age of entry into seniors housing reportedly
continues to rise even though home prices have recovered.
The trend implies a current shift in consumer decision-making
for seniors housing toward more needs-driven factors that
arise with age and declining health rather than lifestyle-
driven factors. This has investment implications for seniors
housing, since rising average age and increasing frailty of
residents affect length of stay, turnover rates, occupancy,
and, ultimately, operating income. However, there are some
investors and operators looking at lower-acuity, hospitality-
oriented independent living and “active adult” products as
promising opportunities.
• New Interest in Age-Restricted Housing Development. Age-
restricted housing, also referred to as “active adult” or “55+”
housing, is not a new concept but has attracted renewed
interest from developers and investors in the seniors housing
industry. Age-restricted communities do not directly provide
care services but rather offer lifestyle housing options for
older adults, often centered on socialization and recreational
activities. Historically, since personal care services are not
provided, age-restricted properties were traditionally distinct
from the seniors housing continuum and considered to be
a variation of multifamily housing or other residential real
estate products. However, some investors who are active
in the seniors housing industry or the multifamily housing
sector are directing capital toward the development of these
communities. Rationale for their investment interest includes
a view that age-restricted housing will be in greater demand
from the baby boomer generation based on the trend of
seniors delaying entry into higher-service communities until
they are older and have greater care needs. There is also a
view that age-restricted housing may provide a referral source
for prospective residents seeking higher levels of care over
time. And while there is a wide variety of development models
for this type of housing, it remains to be seen what role these
types of communities will play as they attract new investors
and potentially become more closely aligned with the seniors
housing continuum.
2.2 Operating Strategies• Growth of Provider Partnerships. Health care reform, the
growing number of seniors using managed care plans, and
various demonstration programs are driving the integration of
acute care/post-acute care and long-term care. As the lines
blur across the continuum of care, seniors housing and nursing
care operators are identifying ways to partner with acute care
hospitals, managed care companies, and other health care
providers up and down the care continuum. For nursing care
providers, the need for such partnerships is becoming clear.
Financial incentives increasingly are being tied to producing
better health outcomes and opportunities to improve payer
mix and margins through relationships with hospitals and
insurers. While seniors housing operators may also find a need
for partnerships in the health care continuum as value-based
payment models evolve and resident acuity increases, there
are currently diverging strategies among operators, with some
focusing on care and ancillary service offerings and others
focusing on housing and hospitality services.
• Skilled Nursing Properties Position for Post-Acute Care. The
skilled nursing care sector is bifurcating, with many operators
and facilities moving to provide more intensive therapy
for short-stay post-acute care patients rather than serving
traditional long-stay custodial-care residents. This move has
the potential to improve rates and margins at skilled nursing
properties that are able to deliver and document positive
outcomes for such patients. However, challenges remain,
such as shorter lengths of stay and getting access to health
care dollar savings being generated. Operators may find the
need to renovate or replace their real estate to effectively
provide these services, and they may need to recruit and
retain more highly trained staff and adjust their operating
models for higher resident turnover. While skilled nursing
properties may reposition themselves to attract more short-
term, post-acute patients, long-term residents continue to
make up the majority of skilled nursing patients.
• Convergence of Independent Living and Assisted Living.
As independent living properties continue to experience a
rising entry age for residents, there is less distinction in the
services provided in assisted living and independent living.
Some independent living operators increasingly are providing
more of the services available in an assisted living property,
either through third-party ancillary service providers or on
their own. Other operators focus on ensuring residents
can “age in place” by using flexible building design. It is
important to recognize, however, that states often have
building codes that specify standards for assisted living that
are different than those for independent living.

Section 2: Emerging Trends and Observations 15
• Technology Innovations. There has been a growing interest in
both complementary and potentially disruptive technologies
that will allow seniors housing providers to achieve greater
operating efficiency. From an operations perspective, new
leads are being generated over the internet. IT systems and
big data are allowing senior management to observe real-time
changes in their day-to-day performance and operations, and
remote monitoring of residents is generating staff efficiencies.
From a health and wellness perspective, telehealth and virtual
care systems have the potential to reduce health care costs
and improve health care coverage by allowing instant video
conferencing at call centers with live doctors. Smart phones
and appliances, remote sensors, handheld devices with
medical applications, and mobile, personalized connectivity
applications, and software systems have the potential to better
allow aging in place, independence, and virtual socialization.
2.3 Capital Markets• Rising Interest Rates. Seniors housing and care real estate
experienced a declining cost of capital in recent years as cap
rates and debt pricing were driven downward by competition
among capital providers pursuing opportunities in the sector
and a very low interest rate environment. However, after
years of historically low levels, interest rates in the U.S. are
beginning to increase. In this environment, investors may
have higher return targets, and the rising cost of debt capital
may dampen both acquisition and development volumes.
An offset to rising interest rates could be strong growth
in net operating income (NOI) driven by positive market
fundamentals, such as rising occupancy rates. However,
occupancy rates have generally been trending lower in the
past few years. Another offset could be continued inflow of
capital into the sector, which would put downward pressure
on cap rates. However, higher interest rates could also affect
valuations if NOI growth doesn’t offset the effects of higher
interest rates on cap rates.
• Changing Acquisition Market. Ongoing consolidation among
seniors housing and care providers is expected to continue
due to capital availability, industry fundamentals, and
growing investor awareness of the sector. However, the
composition of the investors that are driving transaction
activity is again changing. For example, after several years
of high acquisition volume, public REITs were not buying at
the same pace and, in some instances, were selling assets
through year-end 2017. More private equity funds have
entered the space as active buyers, while existing private
equity funds are expanding their footprint. Foreign capital
sources, ranging from private investment funds to public
institutions, have also entered the U.S. senior care sector
as buyers. Chinese capital has been particularly strong, as
of late. Additionally, some independent, non-institutional
owners are aggregating assets as they find opportunities to
strengthen their presence in their current markets or expand
to new markets.
• Joint Ventures Are Preferred. Historically, REITs were
exclusively real estate owners and sought triple net lease
(NNN) structures with operators. However, certain REITs
and operators have shifted away from NNN and are actively
pursuing new structures for their relationships. Among those
structures, REITs are pursuing more joint ventures through
the REIT Investment Diversification and Empowerment Act
of 2007 (RIDEA) for their seniors housing properties, which
allow them to share in the operating income along with their
operating partner. Also notable is anecdotal evidence that
REITs are aligning more frequently with regional operators
rather than operators that are national in scope. Reasons
for these changes include the difficulty some operators
experience in meeting rent escalators in their leases, a
mutual interest in establishing strong partnerships, and a
desire for a greater alignment of incentives.
• Divergence of Nursing Care Market. Through year-end 2017,
diversified health care REITs have increasingly separated their
nursing care portfolios from their seniors housing portfolios
to focus on private-pay seniors housing, and increasingly
the buyers of nursing facilities are institutional private equity
funds and independent owner/operators. The reasons for
these changes are in part attributable to the diverging market
fundamentals of nursing care properties from seniors housing,
as evidenced in NIC data and elsewhere. Additionally,
as many nursing care operators enhance their operating
models with high acuity rehabilitation services, they are
aligning further with the health care continuum, which could
potentially affect the composition of the investor base.

16 NIC Investment Guide
2.4 Labor Market• Rising Cost of Labor. Operators are experiencing rising
labor costs nationally as a result of tighter labor markets
and minimum wage legislation in various states and
municipalities. NIC MAP and Bureau of Labor Statistics
(BLS) data for 4Q2017 show wage growth, as measured
by average hourly wages, exceeding asking rent growth for
assisted living and independent living properties. Since labor
costs are typically the largest expense of operating a seniors
housing property, these changes can have a significant
impact on operating margins.
• Labor Shortages. Shortages of labor are emerging across
many industries in the U.S. Shortages of executive
directors, nurses, and care assistants are becoming more
common in the seniors housing and care sector due to
low unemployment and uncertain immigration policy going
forward. The recent period of high development activity in
seniors housing has created greater need for labor in the
industry. In addition, there has been growing competition
among operators to hire experienced staff from incumbent
operators in response to a shortage of qualified labor. The
availability of labor in a local market is becoming a key
investment criteria for operators considering the acquisition
or development of a seniors housing property.
• Recruitment and Retention. Training programs and
credentialing for positions such as executive directors are
emerging in an effort to develop bench strength in the labor
force. Such credentialing includes the Certified Director of
Assisted Living (CDAL) from the Senior Living Certification
Commission (SLCC). Employee retention is a key concern,
because the labor market continues to be competitive and
the cost of labor turnover can be high. As the demand for
seniors housing increases with the anticipated demographic
trends, the labor shortfall may be exacerbated. Projections
from Argentum, University of California, and others estimate
the need for 1 million to 2.5 million additional long-term care
workers by 2030.
2.5 Regulation• CMS Strategies. A characteristic of the nursing care
industry is its exposure to extensive regulatory risks, since
the majority of revenue is derived from federal and state
funds through Medicare and Medicaid. The Centers for
Medicare & Medicaid Services (CMS) continues to develop
new strategies to adequately manage health care access
and costs as the U.S. approaches a time of unprecedented
growth in the population of older adults. Among the current
initiatives, CMS is in the process of implementing a three-
year phase-in of significant updates to the requirements for
participation in its programs. Additionally, the Value-Based
Purchasing Initiative, which intends to reduce costly hospital
readmissions, will be implemented in fiscal year 2019. CMS
has also proposed a replacement for the current RUG-IV
Medicare payment system. The new Skilled Nursing Facility
(SNF) Patient-Driven Payment Model (PDPM) is expected to
be implemented in 2019.
• Managed Care Is Increasing Market Share. Medicare
Advantage plans continue to increase their market share,
with 33% of Medicare beneficiaries enrolled as of 2017,
representing more than a tripling of market share since
2004. However, while Medicare Advantage penetration
is increasing among post-acute skilled nursing patients,
according to NIC’s Skilled Nursing Data Initiative, only a
small share of skilled nursing patient days is attributable
to Medicare Advantage. Additionally, more states are
moving toward managed care administration of their
Medicaid programs for long-term care services. Nursing
care properties will need to adapt to these changing
payment systems, which may have leverage in determining
reimbursement rates, as managed care companies begin to
represent a greater share of their payer mix and potentially
reduce their operating margins.
• Fragmented Seniors Housing Regulation. While the skilled
nursing industry is highly regulated at the federal and state
levels, regulation of assisted living and memory care facilities
differs by state. Building design standards, licensure types,
minimum staffing requirements, staff credentialing, and
numerous other considerations that affect the development
or operation of these properties are not uniform, and there
are no apparent trends in the regulatory environment
nationally. Investors should seek awareness of local
regulatory requirements and understand how they affect the
costs and underwriting of a seniors housing property.

LakeshoreDuluth, MN
Heron’s Key Gig Harbor, WA
The Springs at Greer GardensEugene, OR
COVER PHOTO
National Investment Center for Seniors Housing & Care1997 Annapolis Exchange Parkway, Suite 480
Annapolis, MD 21401
Phone: (410) 267-0504
Fax: (410) 268-4620
www.nic.org
© 2018 National Investment Center for Seniors Housing & Care. All rights reserved.
ISBN 978-0-692-16655-0
The complete NIC Investment Guide is available for purchase at www.store.nic.org/ig.