Niagara Community Observitory Policy Brief 33:Layout 1 19 ... · For the purposes of this report,...
12
Niagara Community Observatory YOUTH IN NIAGARA: Highly Skilled, Highly Mobile Policy Brief #32, March 2018 By Jeff Boggs, Adam Durrant, and Thalia Semplonius The purpose of this report is to build on the research identified in the Niagara Community Observatory’s October 2017 policy brief: Youth Employment in Niagara: Mapping the Opportunities. Mobilizing data from the 2016 Census, this report will explore Niagara’s youth population through the following themes: population, education, and occupation. A common point of reference will also be established for further work on two of the recommendations from the Youth Employment in Niagara policy brief. The first of these recommendations was to create an expert panel on youth employment in Niagara and the second was to shed light on the need to support the synchronization of youth skills with the region’s growing sectors. Though the analyses provided in this report are insufficient to invite specific policy actions or recommendations, they do provide a clear and current snapshot of Niagara’s assets in terms of our youth workforce, the youth workforce of Niagara’s neighbours, and the employment sectors most likely to hire youth. The resulting snapshot provides a basis from which recommendations can be made. We find that, overall, Niagara’s population has increased by 3.8 per cent between 2011 and 2016. Although the total number of youth has remained consistent between these years, their proportion of the population at both a local and provincial level has decreased. With regard to educational attainment, 64.2 per cent of youth age 25 to 29 years have Jeff Boggs, PhD, is an associate professor in Brock University’s Department of Geography. Adam Durrant, MA, is the research and project manager at Niagara Workforce Planning Board. Thalia Semplonius is a research associate at the Niagara Workforce Planning Board and a PhD candidate in Brock University’s psychology department. completed post-secondary education. Examining the educational programs youth have completed allows us to obtain a picture of the available skill set of the potential youth labour force at a local level. Finally, an analysis of job demand in the Niagara region indicated that “entry-level” jobs (i.e., requiring fewer than two years of experience; a potential proxy measure for youth employment) are most highly concentrated in Niagara Falls, St. Catharines, and Welland (comprising 72.4 per cent of job postings) even though they house only 61.1 per cent of Niagara’s population. These results have implications and call for future research across a minimum of two topics: challenging a culture of hiring through the hidden job market and supporting regional transit in Niagara. Job aggregation software, though effective, is only able to provide a measure of public-facing job demand. Thus, to obtain a complete sense of in-demand jobs and skills within the region, this report offers ideas on supporting local businesses with additional human resources tools to make hiring practices more public and more measur- able. Second, given that the majority (72.4 per cent) of job postings are in Niagara Falls, St. Catharines, and Welland, but these municipalities only comprise 61.1 per cent of Niagara’s population, regional transit and transportation networks could be mobilized to provide access to jobs. With the goal of increasing accessibility to available jobs, research should examine whether
Transcript of Niagara Community Observitory Policy Brief 33:Layout 1 19 ... · For the purposes of this report,...

Niagara Community Observatory
YOUTH IN NIAGARA: Highly Skilled, Highly MobilePolicy Brief #32, March 2018
By Jeff Boggs, Adam Durrant, and Thalia Semplonius
The purpose of this report is to build on the researchidentified in the Niagara Community Observatory’sOctober 2017 policy brief: Youth Employment in Niagara: Mapping the Opportunities. Mobilizing datafrom the 2016 Census, this report will explore Niagara’syouth population through the following themes: population, education, and occupation.
A common point of reference will also be establishedfor further work on two of the recommendations fromthe Youth Employment in Niagara policy brief. The firstof these recommendations was to create an expertpanel on youth employment in Niagara and the second was to shed light on the need to support thesynchronization of youth skills with the region’s growing sectors. Though the analyses provided in thisreport are insufficient to invite specific policy actionsor recommendations, they do provide a clear and current snapshot of Niagara’s assets in terms of ouryouth workforce, the youth workforce of Niagara’sneighbours, and the employment sectors most likelyto hire youth. The resulting snapshot provides a basisfrom which recommendations can be made.
We find that, overall, Niagara’s population has increased by 3.8 per cent between 2011 and 2016. Although the total number of youth has remainedconsistent between these years, their proportion of thepopulation at both a local and provincial level has decreased. With regard to educational attainment,64.2 per cent of youth age 25 to 29 years have
Jeff Boggs, PhD, is an associate professor in Brock University’s Department of Geography. Adam Durrant, MA, is the research and project manager at NiagaraWorkforce Planning Board. Thalia Semplonius is a research associate at the Niagara Workforce Planning Board and a PhD candidate in Brock University’s psychology department.
completed post-secondary education. Examining theeducational programs youth have completed allowsus to obtain a picture of the available skill set of thepotential youth labour force at a local level.
Finally, an analysis of job demand in the Niagara region indicated that “entry-level” jobs (i.e., requiringfewer than two years of experience; a potential proxy measure for youth employment) are most highly concentrated in Niagara Falls, St. Catharines, andWelland (comprising 72.4 per cent of job postings)even though they house only 61.1 per cent of Niagara’spopulation.
These results have implications and call for future research across a minimum of two topics: challenginga culture of hiring through the hidden job market andsupporting regional transit in Niagara. Job aggregationsoftware, though effective, is only able to provide ameasure of public-facing job demand. Thus, to obtaina complete sense of in-demand jobs and skills withinthe region, this report offers ideas on supporting localbusinesses with additional human resources tools tomake hiring practices more public and more measur-able. Second, given that the majority (72.4 per cent)of job postings are in Niagara Falls, St. Catharines, andWelland, but these municipalities only comprise 61.1per cent of Niagara’s population, regional transit andtransportation networks could be mobilized to provideaccess to jobs. With the goal of increasing accessibilityto available jobs, research should examine whether
Niagara Community Observitory Policy Brief 33:Layout 1 19/03/2018 11:58 AM Page 1

2
regional transit routes are accommodating a labourforce that must commute via public transit from elsewhere in Niagara.
MethodologyWhile historical trends would offer the best contextfor understanding the advantages and challenges relating to Niagara’s youth, there are significant limitations to making such a comparison. Due tomethodological changes between the 2011 NationalHousehold Survey and the 2016 Census, detailed historical comparisons of education and employmentdata are not possible.
Preliminary attempts to compare the 2016 Censusdata with the 2006 Census revealed significant drift inoccupational and industrial classifications. This is to beexpected considering that the jobs of 2016 are quitedifferent than those of the 1991 Standard Occupational Classification employed by the 2006Census. To that end, we have included provincial-levelcomparisons, as well as comparisons to migrationhotspots identified by the Niagara Workforce Planning
Demographic Shifts In 2016,2 the Niagara region was home to 447,885 residents. This figure is a 3.8 per cent increase fromthe 2011 Census.3 Within this population, youth represented 78,995 people or 17.6 per cent of the over-all population. As population data were drawn fromthe mandatory short-form census in 2011, and not theNational Household Survey, we are able to offer
historical comparisons between Niagara’s youth population in 2011 and 2016.
As illustrated in Table 1, the youth population in Niagara has remained relatively consistent between2011 and 2016 in terms of absolute value. Proportionally, however, youth represented a smaller
Board in their second Region Building paper, LabourMobility – Who’s Coming, Who’s Going.
For the purposes of this report, youth are defined asthose individuals between the ages of 15 (i.e. the earliest an individual can legally work in Ontario) and29. Five-year cohorts within the broader youth definition provide additional clarity into age groupsthat can loosely categorize youth as either still engaged in secondary education, attending a post-sec-ondary institution/beginning a trades apprenticeship,or making their first forays into the workforce.
As the census has released limited data on the employment patterns of Francophone and Indigenousyouth, with an expectation of more data to come in2018, this report does not offer any significant insightson these groups at this time. However, if Francophoneand/or Indigenous youth were residing within the Niagara region during the 2016 Census’ enumeration,their data would be included within the overall scopeof this report.
1Statistics Canada. 2017. Niagara, RM Census Profile. 2016 Census. Statistics Canada Catalogue no. 98-316-X2016001 and Statistics Canada - 2011 Census.Catalogue no. 98-311-XCB2011023.2Statistics Canada, 2016 Census of Population, Statistics Canada Catalogue no. 98-400-x20160043Statistics Canada. 2017. Niagara, RM Census Profile. 2016 Census. Statistics Canada Catalogue no. 98-316-X2016001.
Age Group Youth 2011 Youth % 2011 Youth 2016 Youth %
2016 5-year % change
15 to 19 years 28,490 6.6% 25,710 5.7% -9.8%
20 to 24 years 27,225 6.3% 28,155 6.3% 3.4%
25 to 29 years 23,170 5.4% 25,130 5.6% 8.5%
Youth total 78,885 18.3% 78,995 17.6% 0.1%
Table 1: Historical Youth Population, Niagara Region.1
Niagara Community Observitory Policy Brief 33:Layout 1 19/03/2018 11:58 AM Page 2

3
segment of the 2016 population than they did in 2011.These data can then be seen to be consistent with thetrend of an aging population within the Niagara region. This trend is also observed at a provincial level,as seen in Table 2. Despite a 1.93 per cent increase inthe youth population, the proportion of youth in Ontario fell between 2011 and 2016.
Age Group Youth 2011 Youth % 2011 Youth 2016 Youth %
2016 5-year % change
15 to 19 years 863,635 6.7% 811,665 6.0% -6.0%
20 to 24 years 852,910 6.6% 894,390 6.7% 4.9%
25 to 29 years 815,120 6.3% 874,350 6.5% 7.3%
Youth total 2,531,665 19.7% 2,580,405 19.2% 1.9%
Table 2: Historical Youth Population, Ontario.4
4Statistics Canada. 2017. Ontario Census Profile. 2016 Census. Statistics Canada Catalogue no. 98-316-X2016001 and Statistics Canada - 2011 Census. Cata-logue Number 98-311-XCB2011023.5For additional reading on the implications of an aging population see: Foot, David K. Aging Population: Some Economic and Social Consequences of PopulationAging. Institute for Research on Public Policy, 2008; McQuillan, Kevin. All the Workers We Need: Debunking Canada’s Labour-Shortage Fallacy. The School ofPublic Policy SPP Research Papers, 6(16), 2013; Miner, Rick. People Without Jobs, Jobs Without People: Ontario’s Labour Market Future. Miner ManagementConsultants, 2010. Waldbrook, Natalie, Rosenberg, Mark W., Brual Janette: Challenging the Myth of Apocalyptic Aging at the Local Level of Governance in On-tario. The Canadian Geographer 57(4), 2013
These data show that our current gains are insufficientto maintain a consistent proportion of youth withinNiagara or Ontario. An aging population may have implications for future labour force trends, migration,health-care spending, and urban planning.5
Niagara Community Observitory Policy Brief 33:Layout 1 19/03/2018 11:58 AM Page 3

4
Major Field of Study 25 to 29 Age Cohort
Health and related fields 18.2%
Business, management, and public administration 16.8%
Social and behavioral sciences, and law 15.2%
Architecture, engineering, and related technologies 15.2%
Personal, protective, and transportation services 10.2%
Humanities 6.3%
Education 5.2%
Visual and performing arts, and communications technologies 4.8%
Physical and life sciences, and technologies 3.5%
Agriculture, natural resources, and conservation 2.4%
Mathematics, computer, and information sciences 2.2%
Table 3: Major Field of Study for Niagara Residents Age 25 to 29. 7
6Statistics Canada, 2016 Census of Population, Statistics Canada Catalogue no. 98-400-X2016242.7Ibid.
Youth Educational Attainment Educational attainment measures an individual’s highest completed level of educational training. Figure1 provides an overview of educational attainment forthe Niagara region as well as for the three age groupswe have identified within our youth cohort.
Figure 1 reflects what one would expect to see in termsof educational attainment given our demographics.
The 15-to-19 age group largely represents studentsstill in secondary school (thus the high proportion of individuals without any formal educational attainment). The 20-to-24 age group maps to youthengaged in post-secondary training or at a point ofentry into the labour force. And the 25-to-29 agegroup represents a youth labour force that has largely completed education and training and is now fully engaged in the labour force.
18.2%
63.0%
6.1% 7.8%
31.2%
34.8%
51.8%
28.0%
50.5%
2.3%
42.2%
64.2%
0%
10%
20%
30%
40%
50%
60%
70%
80%
90%
100%
Total Age 15 to 19 Age 20 to 24 Age 25 to 29
Postsecondary certificate, diploma or degree
Secondary (high) school diploma or equivalency certificate
No certificate, diploma or degree
Figure 1: Educational Attainment for the Population Age 15 and Over and Select Youth Age Groups.6
Niagara Community Observitory Policy Brief 33:Layout 1 19/03/2018 11:58 AM Page 4
5
Major Field of Study (Age 25-29)
Post-secondary completion per 1000 residents age 15 and over Niagara Hamilton Haldimand-
Norfolk Halton Peel Waterloo Toronto
Health and related fields 7.83 10.28 7.10 6.04 8.08 8.67 8.60
Business, management and public administration
7.23 9.25 4.77 10.27 14.34 9.81 19.45
Social and behavioral sciences, and law 6.54 8.31 4.27 7.83 9.14 8.39 14.21
Architecture, engineering, and related technologies
6.53 9.09 9.21 5.69 8.36 10.65 9.19
Personal, protective and transportation services
4.41 3.47 3.11 2.58 3.17 3.58 2.89
Humanities 2.70 3.67 1.72 2.47 3.43 3.85 5.01
Education 2.22 2.29 2.11 2.21 2.18 1.96 2.29 Visual and performing arts, and communications technologies
2.09 2.71 1.39 2.72 2.24 2.45 6.57
Physical and life sciences, and technologies
1.52 2.83 1.05 2.47 3.29 3.27 3.93
Agriculture, natural resources, and conservation
1.05 0.87 1.05 0.67 0.58 1.15 0.76
Mathematics, computer, and information sciences
0.96 1.42 0.33 1.89 3.07 3.44 3.75
Other fields of study 0.00 0.02 0.00 0.00 0.00 0.08 0.01
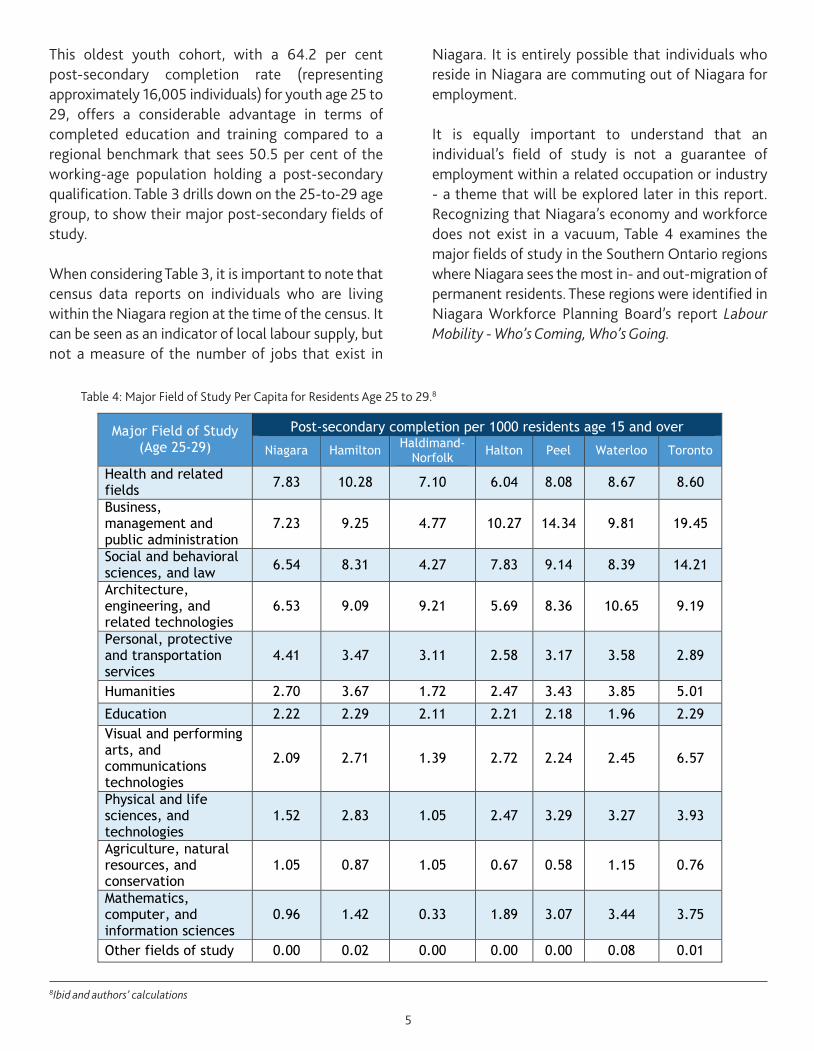
Table 4: Major Field of Study Per Capita for Residents Age 25 to 29.8
8Ibid and authors’ calculations
This oldest youth cohort, with a 64.2 per cent post-secondary completion rate (representing approximately 16,005 individuals) for youth age 25 to29, offers a considerable advantage in terms of completed education and training compared to a regional benchmark that sees 50.5 per cent of theworking-age population holding a post-secondaryqualification. Table 3 drills down on the 25-to-29 agegroup, to show their major post-secondary fields ofstudy.
When considering Table 3, it is important to note thatcensus data reports on individuals who are livingwithin the Niagara region at the time of the census. Itcan be seen as an indicator of local labour supply, butnot a measure of the number of jobs that exist in
Niagara. It is entirely possible that individuals who reside in Niagara are commuting out of Niagara foremployment.
It is equally important to understand that an individual’s field of study is not a guarantee of employment within a related occupation or industry- a theme that will be explored later in this report. Recognizing that Niagara’s economy and workforcedoes not exist in a vacuum, Table 4 examines themajor fields of study in the Southern Ontario regionswhere Niagara sees the most in- and out-migration ofpermanent residents. These regions were identified inNiagara Workforce Planning Board’s report Labour Mobility - Who’s Coming, Who’s Going.
Niagara Community Observitory Policy Brief 33:Layout 1 19/03/2018 11:58 AM Page 5

6
9For a comprehensive review of historical and current youth migration patterns, see: Niagara Community Observatory, The Young Are the Restless, March 5,2009, and Adam Durrant and Thalia Semplonius, Region Building Series #2: Labour Mobility - Who’s Coming and Who’s Going, Fall 2017.10The St. Catharines-Niagara Census Metropolitan Area (CMA) includes all municipalities within the Niagara region except for West Lincoln and Grimsby.Grimsby is part of Hamilton’s CMA and West Lincoln is in non-CMA Ontario. 2016 Census profiles report 14,710 people in Grimsby’s labour force and 8,050 inWest Lincoln’s labour force. These definitions are set by Statistics Canada and are beyond the control of the authors of this report.11Source: Statistics Canada, 2016 Census of Population, Statistics Canada Catalogue no. 98-400-X2016295.
Youth Occupation of Employment Using data from the 2016 Census, wecan gain an understanding of youthemployment patterns for residents of the St. Catharines-Niagara Census Metropolitan Area(or CMA).10 These data reflect allthose individuals who lived in the St.Catharines-Niagara CMA, who wereat least 15 years of age and reportedworking at some point between Jan-uary of 2015 and May of 2016. Asseen in Table 5, the resident youthworkforce represented 23.5 per centof all employed individuals residingin the CMA during the census May2016 reference period.
In terms of total employment,21,675 youth in Niagara reportedemployment in sales and service occupations. Those individuals represented 38.8 per cent of the
Occupation Youth (15-29) Employment
Working Age (15+)
Employment
Management occupations 2,050 20,270
Business, finance and administration occupations
3,375 24,795
Natural and applied sciences and related occupations
1,560 8,520
Health occupations 2,485 13,875
Occupations in education, law and social, community and government services
3,190 20,450
Occupations in art, culture, recreation, and sport
1,405 4,505
Sales and service occupations 21,675 55,805 Trades, transport and equipment operators, and related occupations
5,125 27,270
Natural resources, agriculture, and related production occupations
1,810 4,565
Occupations in manufacturing and utilities
1,545 8,160
All occupations 44,225 188,215
Table 4 attempts to control for regional populationsizes through a per-capita measure of educationalachievement. For example, this table indicates that Ni-agara has 7.83 youth age 25 to 29 with a degree ordiploma in the health-related fields for every thousandresidents age 15 and older. Hamilton, in contrast, has10.28 youth age 25 to 29 with post-secondary trainingin health and related fields for every thousand workingage residents. Although these measures do not implya direct demand for jobs in their fields, particularlysince the census is measuring where people live andnot where they work, they can be taken as a roughbellwether of job demand.
These data are significant in that they invite a broaderconversation on the subject of talent recruitment andlabour mobility within the Niagara region and the regions where we know there is a significant patternof migration. Recognizing that the youth workforce isone that is both highly-skilled and highly-mobile, theabove table illustrates the geographies that could betargeted for talent attraction.9
While the data presented in this table are limited tomajor fields of study within the Classification of Instructional Program (CIP) framework, it is possibleto expand the scope of this analysis to all 49 instructional programs within the first level of the CIP.
Table 5: Occupation of Employment for Youth and Working Age Populations.11
Niagara Community Observitory Policy Brief 33:Layout 1 19/03/2018 11:58 AM Page 6

7
Occupation Age 15 to 19
Age 20 to 24
Age 25 to 29
Total Employment
Management occupations 0.68 0.92 1.07 0.92
Business, finance, and administration occupations 0.64 0.60 0.62 0.80
Natural and applied sciences, and related occupations 0.63 0.70 0.59 0.61
Health occupations 1.02 1.16 1.20 1.11
Occupations in education, law and social, community, and government services
0.56 0.74 0.85 0.89
Occupations in art, culture, recreation, and sport 0.73 0.76 0.69 0.76
Sales and service occupations 1.13 1.20 1.29 1.29
Trades, transport and equipment operators, and related occupations
0.69 1.01 1.19 1.11
Natural resources, agriculture, and related production occupations
1.28 1.44 1.45 1.57
Occupations in manufacturing and utilities 0.47 0.85 1.09 0.87
Table 6: Location Quotient of Youth and Overall Workforce.12
12Statistics Canada Table 98-400-X2016295 and authors’ calculations.
within a region. While location quotients can use national-level frameworks, this analysis is focused ona provincial context. Therefore, if a given occupation has a location quotient of 1.0, then thelevel of employment can be seen as proportional towhat we would find in Ontario as a whole. A highernumber indicates a greater concentration of employment (e.g. a location quotient of 2.0 would indicate double the provincial concentration of employment.) Table 6 explores the youth location
total employed workforce within that major occupa-tion group. To understand if that figure is significant,this report has applied a modified location quotientcalculation to benchmark Niagara’s youth employment against Ontario’s.
The location quotient measures a share of economicactivity for a sub-region (e.g. Niagara) relative to alarger region (e.g. Ontario). This allows for an understanding of how concentrated a given activity is
Niagara Community Observitory Policy Brief 33:Layout 1 19/03/2018 11:58 AM Page 7
13This figure excludes job postings from kijiji.com
8
hiring for jobs that are funded through youth-focusedprograms, such as the Canada Summer Jobs Program,age-targeted hiring would be highly dubious in theface of labour and human rights legislation. To addressthis challenge, this report has prepared a snapshot ofjob demand for Niagara that targets “entry level” employment; therein, a job posting requires fewerthan two years of experience.
Working with a baseline of 11,99513 measurable jobpostings in Niagara during the 2017 calendar year,4,058 (33.8 per cent) job postings fell in the “entrylevel” category. In terms of geography, 72.4 per centof entry-level job postings were for jobs in NiagaraFalls (33.9 per cent), St. Catharines (26.1 per cent), orWelland (12.3 per cent). This concentration of employment opportunities in Niagara’s more urbanmunicipalities is not surprising. It invites future research looking into intra-regional commuter flowsand the need for regional transit strategies.
Aggregation software allows for a considerable levelof detail in terms of occupational and skill demand.While comprehensive four-digit National OccupationClassification (NOC) data can be mined from this software, Table 7 limits the scope of this analysis tomeasurable entry-level job demand at a one-digit NOC-level.
Among youth age 15 to 29, sales and service jobs accounted for 49.0 per cent of employment. For context, sales and service occupations accounted for29.6 per cent of total employment for the working-age population in the St. Catharines-Niagara CMA.Once again, it is important to stress that data in Table7 do not reflect jobs for youth, per se, but jobs which require fewer than two years of work experience. Withmore than 21,000 youth employed in sales and serviceoccupations in Niagara (Table 5) it is reasonable toinfer that youth would be filling entry-level jobs insales and service occupations, and that, in turn, couldshape popular narrative about employment opportunities in Niagara.
quotients and compares them to those for the overallworkforce.
Green highlighted cells in the table illustrate areaswhere Niagara’s youth show a concentration of em-ployment in Niagara. Of note is that youth betweenthe ages of 25 and 29 show identical employment concentrations as the overall workforce in sales andservice occupations. This means that both Niagara’sgeneral workforce and youth workforce are more concentrated in these occupations than what wewould expect to see at a provincial level. Given thewell-known economic strengths of the Niagara region(e.g. tourism, attractions, accommodations, agriculture) the high LQs seen in Table 6 are not surprising.
The Challenge of Measuring “Youth” Job DemandUntil recently, measuring labour and job demand wassomething of a challenging proposition. Data toolsfrom Statistics Canada and other organizations wereoften focused on labour supply instead of labour demand, and where demand data was available it wasoften focused through a national or provincial lens.Advances in data aggregation allow for a new capacityto measure job demand without having to rely primarily on survey data. To that end, this report’s job-demand data mobilizes public-facing job postings(i.e. those that are generally accessible through an internet connection and not hidden behind pay-wallsor private job boards) to produce a snapshot of regional job demand.
Where these data are limited is in their inability to capture job demand that is reflected through referralsand informal networking. Previous analysis from theNiagara Workforce Planning Board indicates that asmany as 20 per cent of employers who completedNWPB’s Employer One survey reported hiring throughthis “hidden” job market. A further challenge is reflected in the fact that there is no specific methodfor targeting “youth” jobs. Outside the confines of
Niagara Community Observitory Policy Brief 33:Layout 1 19/03/2018 11:58 AM Page 8

14CEB, Talent Neuron, Niagara region job postings requiring 0-2 years’ experience, 2017. Excluding job demand posted to kijiji.com and 4.3 per cent of jobdemand where no National Occupation Classification could be assigned to the job posting.
Occupation % of Job Demand Number of Job Postings
Sales and service occupations 47.9% 1,945
Business, finance, and administration occupations 14.3% 581
Trades, transport and equipment operators, and related occupations 9.5% 385
Management occupations 6.0% 245
Occupations in education, law and social, community, and government services 5.3% 217
Natural and applied sciences, and related occupations 4.6% 187
Health occupations 3.6% 147
Occupations in manufacturing and utilities 1.8% 75
Occupations in art, culture, recreation, and sport 1.3% 52
Natural resources, agriculture, and related production occupations 1.2% 48
Table 7: 2017 Job Demand by Occupation, Niagara Region.14
9
Niagara Community Observitory Policy Brief 33:Layout 1 19/03/2018 11:58 AM Page 9

Recommendations and Next Steps1) Breaking Down the Hidden Job Market
This report recognizes that data from any job aggregation software is never going to offer a complete measurement of total job demand in a givenregion. Taken at face value, these data show that almost half of all job opportunities in Niagara are insales and service. For context, sales and service occupations in Niagara had the lowest median hourlyincome in 2016 at $14.29 per hour.15 Within Ontario’s2016 workforce, 35.9 per cent of all employment insales and service is part-time, the highest level of part-time employment among major occupationgroups. Based on the data at hand, these occupationsare the most abundantly available for young job seekers.
However, it is equally important to remember that allavailable data may not show all available opportuni-ties. To that end, this report illustrates the need formore immediate action to promote the available jobdemand that exists in Niagara. Consider that if roughlyone-fifth of employers prefer to hire through informalmeans, then Niagara’s capacity to understand itslabour market demands – and speak to the problem of“jobs without people” – could be improved with moresupport for employers to hire through conventionaland measurable means. One potential action wouldbe to support the 71 per cent of Niagara’s employerswith fewer than nine employees with templates fordata-rich job postings. Standardizing the marketingcomponent of the hiring process for small employerscould show the value of transparent hiring - particu-larly as job seekers take advantage of job boards thatuse data aggregation (e.g. Linking Niagara or Magnet)
while creating a more accurate picture of demand forplanning purposes.
2) Regional Transit and Transportation Networks
These data have revealed that in 2016, almost three-quarters of all entry-level job demand was foundwithin the municipalities of Niagara Falls, St.Catharines, and Welland. These three municipalitieshouse 61.1 per cent of the Niagara region’s 2016 population. A mobilization of the workforce within theremaining 39.9 per cent of Niagara’s population mayserve as another method for answering the problemof jobs without people – and particularly jobs withoutyouth. This is a particularly poignant fact in consideration of the demonstrated labour market integration between Grimsby and Hamilton. Robust,efficient, and timely regional transit would provide anopportunity to draw some of Grimsby’s commutinglabour force back into Niagara.
3) Situating Youth Initiatives Within A Strategy
If there is a single comment to make about the stateof youth employment and education in Niagara, andin Ontario as a whole, it is that the challenges facingyouth are numerous and regularly in flux. The data presented in this report suggest the need for a broaderyouth employment and engagement strategy that, ata regional level, establishes a clear framework for addressing the challenges. Such a framework wouldrequire considerable capacity-building as well as buy-in from a strong base of stakeholders.
15EMSI Analyst, Niagara census division, 2017.3 dataset Statistics Canada. Table 282-0142 - Labour Force Survey estimates (LFS), by National Occupational Classification (NOC) and sex, annual (persons unless otherwise noted)
10
Niagara Community Observitory Policy Brief 33:Layout 1 19/03/2018 11:58 AM Page 10

11
Notes
Niagara Community Observitory Policy Brief 33:Layout 1 19/03/2018 11:58 AM Page 11

@BrockNCO
The Niagara Community Observatory is a think-tank for local public policy at Brock University in St. Catharines,Ont.
This policy brief was done in partnership with the Niagara Workforce Planning Board, one of 26 such boards inOntario, dedicated to delivering accurate and future-focused workforce data to enhance Niagara’s economicprosperity.
An electronic version of this brief can be found at www.brocku.ca/nco and www.niagaraworkforce.ca
The NCO and the NWPB can be found on Twitter.
Please follow us @BrockNCO and @nwpb
Niagara Community Observitory Policy Brief 33:Layout 1 19/03/2018 11:58 AM Page 12


![PHOTOGRAPHS OF NIAGARA, MARINETTE … of Niagara... · PHOTOGRAPHS OF NIAGARA, MARINETTE COUNTY, WISCONSIN [Compiled and Captioned by William John Cummings] 3 View of Niagara, Wisconsin,](https://static.fdocuments.us/doc/165x107/5b993acd09d3f207308b54bc/photographs-of-niagara-marinette-of-niagara-photographs-of-niagara-marinette.jpg)