NIAC Phase I Progress Report Micro Asteroid …The distribution of asteroids within the Belt is not...
32
Hbar Technologies, LLC Dr. Steven D. Howe MAPPER 1 NIAC Phase I Progress Report Micro Asteroid Prospector Powered by Energetic Radioisotopes: MAPPER Final Report Dr. Steven D. Howe and Dr. Gerald P. Jackson Hbar Technologies, LLC Executive Summary The purpose of this project was to identify a revolutionary architecture to catalogue the resources of the Main Belt asteroids for future exploration. The basis of the concept was to design a lightweight, inexpensive spacecraft so that a fleet can cruise autonomously through the Belt for 20 years. Thus, the objectives were to: • Determine mass, power, and number of spacecraft for characterizing a significant fraction of the Main Belt asteroids; • Identify major issues and future goals. The ultimate goal of this project is to identify and investigate an exploration architecture that would allow a hundreds of ultra-light-weight instrument packages to be sent to the Asteroid Belt. Each package will be able to identify mineral deposits and water by passing within a minimum distance of each asteroid. Upon analysis, the elemental content of each asteroid will be transmitted back to Earth for cataloguing. In addition, each asteroid will be implanted with a marker from which future explorers can immediately know the content of the asteroid. Each package will be able to land periodically to extract propellant from the water bearing asteroids. Using a revolutionary power supply, each package will function for over 20 years, passing by asteroid after asteroid and transmitting the location and element inventory to the Earth. We have identified the necessary subsystems required to make the MAPPER concept viable. Our preliminary assessments show that most of the technologies already have a current day version that could be used on a spacecraft. Total mass of the platform is estimated to be just over 100 kg. Using these designs, we have determined that a spacecraft with an average cruise velocity of 0.5 km/s can survey a population of asteroids equivalent to a major fraction of the Earth’s surface area. Further work is necessary to develop active targeting algorithms and to more accurately assess system components masses and lifetimes.
Transcript of NIAC Phase I Progress Report Micro Asteroid …The distribution of asteroids within the Belt is not...

Hbar Technologies, LLC Dr. Steven D. Howe MAPPER
1
NIAC Phase I Progress Report
Micro Asteroid Prospector Powered by Energetic
Radioisotopes: MAPPER
Final Report
Dr. Steven D. Howe and Dr. Gerald P. Jackson Hbar Technologies, LLC
Executive Summary The purpose of this project was to identify a revolutionary architecture to catalogue the resources of the Main Belt asteroids for future exploration. The basis of the concept was to design a lightweight, inexpensive spacecraft so that a fleet can cruise autonomously through the Belt for 20 years. Thus, the objectives were to:
• Determine mass, power, and number of spacecraft for characterizing a significant fraction of the Main Belt asteroids;
• Identify major issues and future goals. The ultimate goal of this project is to identify and investigate an exploration architecture that would allow a hundreds of ultra-light-weight instrument packages to be sent to the Asteroid Belt. Each package will be able to identify mineral deposits and water by passing within a minimum distance of each asteroid. Upon analysis, the elemental content of each asteroid will be transmitted back to Earth for cataloguing. In addition, each asteroid will be implanted with a marker from which future explorers can immediately know the content of the asteroid. Each package will be able to land periodically to extract propellant from the water bearing asteroids. Using a revolutionary power supply, each package will function for over 20 years, passing by asteroid after asteroid and transmitting the location and element inventory to the Earth. We have identified the necessary subsystems required to make the MAPPER concept viable. Our preliminary assessments show that most of the technologies already have a current day version that could be used on a spacecraft. Total mass of the platform is estimated to be just over 100 kg. Using these designs, we have determined that a spacecraft with an average cruise velocity of 0.5 km/s can survey a population of asteroids equivalent to a major fraction of the Earth’s surface area. Further work is necessary to develop active targeting algorithms and to more accurately assess system components masses and lifetimes.

Hbar Technologies, LLC Dr. Steven D. Howe MAPPER
2
Introduction The asteroid belt is estimated to contain 100 billion objects. The total mass is calculated to be around 1/1000 of Earth’s mass [1]. This is equivalent to breaking the top 1.3 miles of the Earth’s crust into pieces that range from a few kilometers to a few meters in diameter. Most of the asteroids are silicon dioxide, some are iron and other metals, a lesser number are carbonaceous chondrites (CC), and a few may be heavy precious metals. Of these, the most valuable to the space explorer are the CCs which potentially hold up to 10 % water by weight. CCs will be the equivalent of the oasis in the desert or the stream in the forest. This is where humanity will congregate their outposts. The problem is how to find them among 100 billion identical looking rocks, and how to keep track of them. The basis of the MAPPER concept is to construct a low-cost, lightweight platform that can be cost-effectively replicated several hundred times. The entire fleet can then be initially dispersed along the inner region of the asteroid belt so the entire fleet can migrate throughout the belt in a self-controlled fashion. To survey a significant number of asteroids within two decades, each platform will have to be autonomous, long-lived, and self-propelled. Researchers at the NASA Goddard Space Flight Center have investigated a similar concept [2] and dubbed it ANTS- “Autonomous Nano Technology Swarm.” The difficulty with the ANTS idea is that it relies on using a solar sail for propulsion and uses conventional power sources for instrumentation. The solar sail is a large area, thin material that is prone to puncture, can’t be steered easily, and must see a direct path to the sun for power. The conventional power sources will have a high specific mass (kg/kW), and will make the platform heavy. As stated in Progress Report #1, the ultimate goal of this project is to identify and investigate an exploration architecture that would allow a hundreds of ultra-light-weight instrument packages to be sent to the Asteroid Belt. Each package will be able to identify mineral deposits and water by passing within a minimum distance of each asteroid. Upon analysis, the elemental content of each asteroid will be transmitted back to Earth for cataloguing. In addition, each asteroid will be implanted with a marker from which future explorers can immediately know the content of the asteroid. Each package will be able to land periodically to extract propellant from the water bearing asteroids. Using a revolutionary power supply, each package will function for over 20 years, passing by asteroid after asteroid and transmitting the location and element inventory to the Earth. The Work Plan proposed for Phase I was:
1) Evaluate feasibility of the U-232 power source a. design a TPC unit using U-232 and GaAs PV cells that can be
rotated to interleave with the uranium. Design optimal thicknesses for the fissile material, the scintillator, and the PV converter;
b. design and assess the intensity of having the uranium interleaved with beryllium foils to create an intense neutron source;

Hbar Technologies, LLC Dr. Steven D. Howe MAPPER
3
c. perform a thermal balance of the waste heat distribution throughout the platform;
2) Evaluate the possibility of using the alpha particles from the uranium foils as a low-thrust, very-high Isp propulsion method;
3) Perform calculations of the neutron induced gamma-ray signal from various asteroid types. Estimate signal to noise, residence times, and minimum approach distances;
4) Determine the optimal type of electric thruster with respect to overall platform mass;
5) Design a water extract system for propellant acquisition; and 6) Evaluate the infrastructure necessary to perform acquisition and analysis
from a distributed net of sensors. Determine signal strength requirements, computational needs, and memory;
In Progress report #1, we described our work on:
1) characterizing the Main Belt asteroid population, focusing our studies on the Flora region of the Belt, and determining average separation distances;
2) assessment of the power production capabilities of using U-232 as a radioisotope source;
3) evaluation of two concepts for a neutron source to perform scanning for water and heavy elements; and
4) preliminary assessment of RF driven electric thrusters. In Progress report #2, we evaluated:
1) mission requirements for deployment from Earth to the Main Belt; 2) mission profiles and delta-V requirements for refueling; 3) neutron and gamma ray detection systems for water and elemental
analysis; 4) water extraction and accumulation for refueling; 5) water storage and transport; and 6) radar requirements for target location, evasion, and flight path
determination. In order to explicitly define the parameters delineated in the Work Plan, we have quantified the characteristics of the Main Belt asteroids. The single critical parameter we have to determine is the average velocity of the platform through the Belt. This parameter dictates the fuel consumption, the on-board power level, and total fuel mass. It also impacts the count rate from the neutron reflection as well as the minimum approach distance for each asteroid. Consequently, Item 0 in the Work Plan has been to ascertain the asteroid distribution.
Hbar Technologies, LLC Dr. Steven D. Howe MAPPER
4
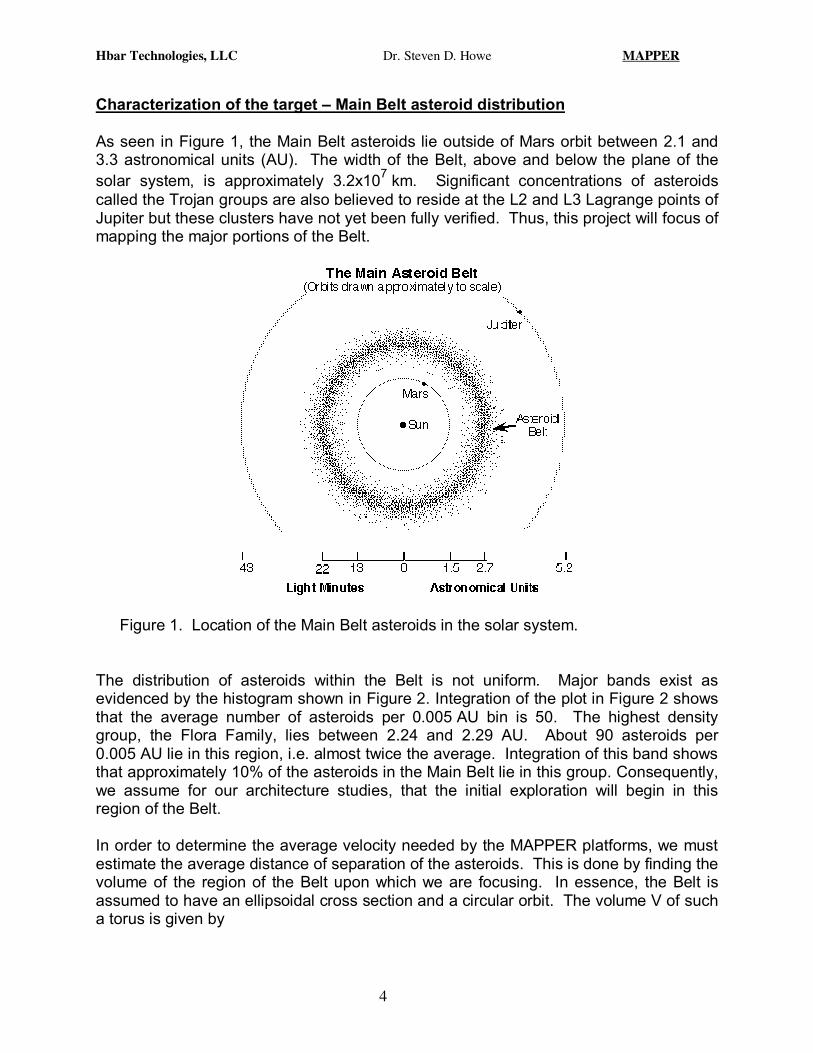
Characterization of the target – Main Belt asteroid distribution As seen in Figure 1, the Main Belt asteroids lie outside of Mars orbit between 2.1 and 3.3 astronomical units (AU). The width of the Belt, above and below the plane of the solar system, is approximately 3.2x10⁷ km. Significant concentrations of asteroids called the Trojan groups are also believed to reside at the L2 and L3 Lagrange points of Jupiter but these clusters have not yet been fully verified. Thus, this project will focus of mapping the major portions of the Belt.
Figure 1. Location of the Main Belt asteroids in the solar system.
The distribution of asteroids within the Belt is not uniform. Major bands exist as evidenced by the histogram shown in Figure 2. Integration of the plot in Figure 2 shows that the average number of asteroids per 0.005 AU bin is 50. The highest density group, the Flora Family, lies between 2.24 and 2.29 AU. About 90 asteroids per 0.005 AU lie in this region, i.e. almost twice the average. Integration of this band shows that approximately 10% of the asteroids in the Main Belt lie in this group. Consequently, we assume for our architecture studies, that the initial exploration will begin in this region of the Belt. In order to determine the average velocity needed by the MAPPER platforms, we must estimate the average distance of separation of the asteroids. This is done by finding the volume of the region of the Belt upon which we are focusing. In essence, the Belt is assumed to have an ellipsoidal cross section and a circular orbit. The volume V of such a torus is given by

Hbar Technologies, LLC Dr. Steven D. Howe MAPPER
5
baR2V 2π=
where a = semimajor axis = 3.2x10⁷ km b = semiminor axis = (Router –Rinner)/2; 7x10⁶ km R = radius from the Sun of the midpoint = (Rinner+Router)/2 Thus, for the Flora region, Rinner=2.24 AU or 3.3x10⁸ km, Router=2.29 AU or 3.37x10⁸ km, R=3.35 x10⁸ km and the volume is 1.4x10²² km3.
Figure 2. Distribution of the Main Belt asteroids as a function of radius.
The number of asteroids in this region can be found by examining Figure 3. This plot shows the total number of asteroids in the belt above a diameter D as a function of D [3]. These data are an accumulation of Earth based radar and optical measurements. As can be seen in the Figure, a power law roughly matches the distribution. This formula can then be used to calculate the number of asteroids that will be in the Flora

Hbar Technologies, LLC Dr. Steven D. Howe MAPPER
6
region. From Figure 2, the Flora region contains around 10% of the entire population. Thus, the number in the region above a diameter D is given as
N(>D) = 0.1 * 2.88x106 D -2.27
= 2.88x10⁵ D -2.27
Assume that the smallest asteroid we would be willing to scan has a diameter of 20 m. The total number of bodies in the Flora region above this diameter is about 10 billion. Dividing the volume of the region by 1.0x10¹⁰ shows that the average volume per asteroid is 1.4x10¹² km3. Assuming a spherical volume for each asteroid yields a radius per asteroid of 7,000 km. The separation distance is twice this value or 14,000 km on average. Thus, some body with a diameter greater than 20 m will be encountered every 14,000 km on average.
Ntot=2.88e06 D-2.27
Figure 3. Total number of asteroids of diameter D above D. The red line is a power law fit to approximate the distribution.
The power law in Figure 3 can be differentiated to yield the number of asteroids at each diameter D. This allows the calculation of the average diameter for all the objects to be made. Thus, the number at diameter D is
N(D)= 6.54x10⁶ D -3.27 dD
This formula can be used to produce a weighted average for the distribution. Dividing the integral of N*D by the integral of N shows that the average diameter is 18 m.
Hbar Technologies, LLC Dr. Steven D. Howe MAPPER
7
This equation allows us to determine the average distance between objects of equal diameter. Thus, the average separation distances between objects at a given diameter, D, are shown in Table1.
Table 1. Distance between asteroids of diameter D
D (km) Separation Distance (km) .02 1.4x10⁴ .05 3.8 x10⁴ .1 8 x10⁴ .2 1.7 x10⁵ .5 4.7 x10⁵
1.0 1 x10⁶ From this table, we can estimate the number of bodies of diameter D scanned over a 20 year period for an assumed average velocity of the spacecraft. The number scanned is the ratio of the velocity to the separation distance. A more useful figure of merit is the fraction scanned, i.e. what percentage of the bodies of diameter D will be mapped in the 20 year period for a given spacecraft velocity. Using the previous formulae, we find that the fraction is given as:
F = 9.6x10⁻⁴ D 2.18 V
Where V= spacecraft velocity (km/s) D= asteroid diameter (km)
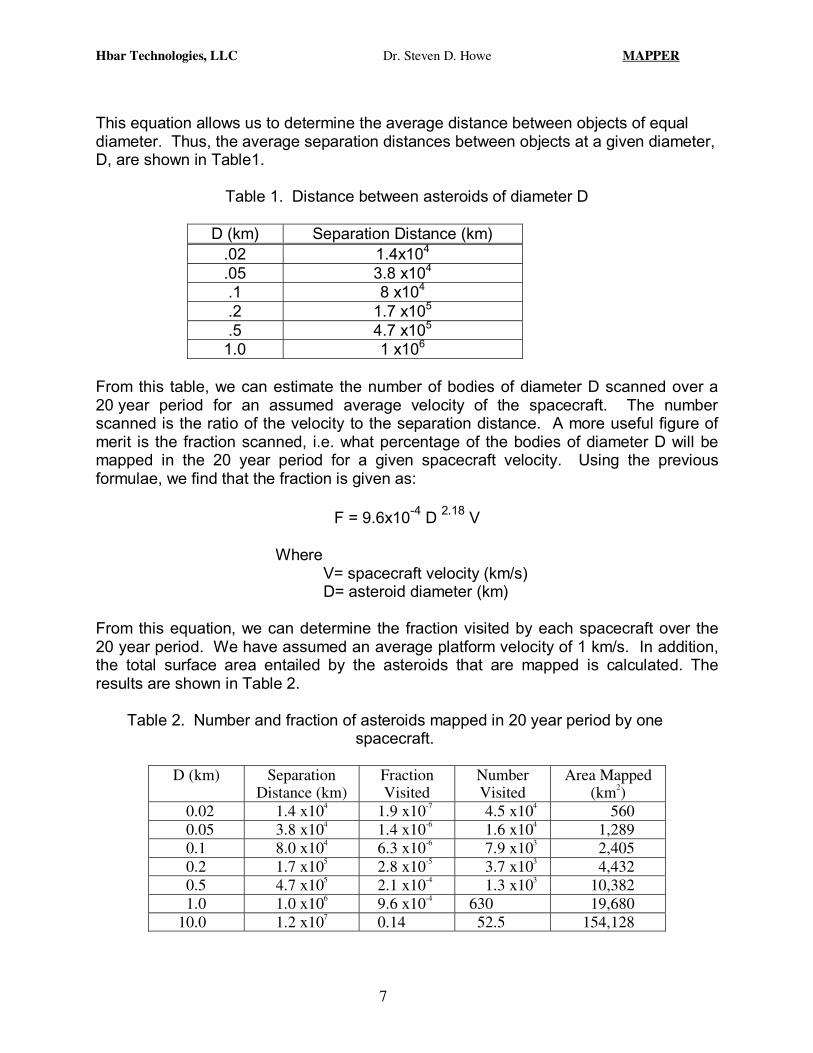
From this equation, we can determine the fraction visited by each spacecraft over the 20 year period. We have assumed an average platform velocity of 1 km/s. In addition, the total surface area entailed by the asteroids that are mapped is calculated. The results are shown in Table 2.
Table 2. Number and fraction of asteroids mapped in 20 year period by one spacecraft.
D (km) Separation
Distance (km) Fraction Visited
Number Visited
Area Mapped (km2)
0.02 1.4 x10⁴ 1.9 x10⁻⁷ 4.5 x10⁴ 560 0.05 3.8 x10⁴ 1.4 x10⁻⁶ 1.6 x10⁴ 1,289 0.1 8.0 x10⁴ 6.3 x10⁻⁶ 7.9 x10³ 2,405 0.2 1.7 x10⁵ 2.8 x10⁻⁵ 3.7 x10³ 4,432 0.5 4.7 x10⁵ 2.1 x10⁻⁴ 1.3 x10³ 10,382 1.0 1.0 x10⁶ 9.6 x10⁻⁴ 630 19,680
10.0 1.2 x10⁷ 0.14 52.5 154,128

Hbar Technologies, LLC Dr. Steven D. Howe MAPPER
8
The total land area of the Earth is 1.5x10⁸ km2. The results in Table 1 indicate that one spacecraft could map 1.3x10⁻³ of the Earth’s land area in the 20 year period traveling at 1 km/s. Thus, 1000 spacecraft could map the land area of the Earth. Increasing the average travel velocity can increase the amount mapped. However, increasing the average velocity increases the power requirement and the propellant mass. The balance of the fraction mapped versus the spacecraft mass and power must yet be optimized. From these evaluations, we conclude that random intercept of the asteroids is not a viable mission architecture. The separation distances are too large to randomly intercept enough objects. Consequently, the spacecraft will need to scan the nearby volume of space after each encounter and select the next target. This requires a radar system with sufficient power and resolution somewhat greater than we had originally estimated. Subsystems We evaluated a number of different concepts and combinations for the subsystems for MAPPER. Our original concept was to utilize “severe integration” wherein a given subsystem would be used for a number of different tasks, e.g. the isotope source would be used to provide electrical power, heat the spacecraft, and make neutrons for the scans. This idea turned out to not be the optimum method in some cases. In the case of the microwave subsystem it was beneficial. In the case of the neutron source, it was not. In short, we evaluate subsystems to perform the following:
• A power supply to provide electrical power to a platform that can propulsively cruise between targets
• A radiation detector system that can measure elemental constituents at a standoff distance,
• A heating system that can extract and store volatiles for propulsion, • A tagging method to label the target for future generations. • A method of absolute coordinate location determination via star tracking or
inter-communication with Earth or a fixed beacon. • Radar system sufficient to provide guidance to the next target and
avoidance of smaller objects • A communication link to Earth
Power Subsystem Preliminary studies of the integrated platform indicate a new direction in its design. The single major component dictating the platforms size is a long-lived, low-mass power source. By using a radioisotope power source, we will investigate the possibility of using the radiation both for power and for active probing of the asteroid at a distance.

Hbar Technologies, LLC Dr. Steven D. Howe MAPPER
9
We have identified a decay chain from Uranium-232 that produces around 43 MeV/atom. This compares well against a standard RTG at 5 MeV/atom and even fission at 180 MeV/atom. Thus, a suitably designed radioisotopic source will heat the platform, provide continuous power to the instruments, provide pulse power for electric propulsion, and provide a neutron source to survey the target bodies. The basis of the power conversion is the technique investigated by Hbar Technologies in a previous NIAC Phase I grant [4] – Tuned Photovoltaic Conversion (TPC). In essence, the alpha particles from a thin layer of the radioisotope impact a specially chosen scintillator material. This material absorbs the alphas and radiates ultraviolet photons with a relatively narrow bandwidth. The photons impact a photovoltaic layer (PV) surrounding the volume that is specifically tuned to match the wavelength of the emitted photons. By tuning the emitter material to the PV layer, efficiencies of up to 40% conversion may be possible. The decay sequence of U-232 is shown in Figure 4. The unique aspects of this material are that several alpha emissions occur before a final stable isotope of lead is produced. In addition, most of the later stage decays have very short half-lives so that the activity of a sample of U-232 is dictated by the long lived first decay. The total activity of a sample of U-232 is shown in Figure 5. In essence, the activity peaks around 10 years after the sample is generated. The peak, however, is wide in that the activity has decreased by less than 10% at 20 years, i.e the power level is relatively flat between 8 to 25 years. The peak activity is 5.8x10¹² disintegrations/s-g (157 curies/g) at the 10 year mark. This corresponds to 5 W/g of thermal energy. With a 40% conversion efficiency, the electrical power estimated for the platform is 2 W/g U-232. The production of U-232 can be achieved by irradiating U-233 in a fast spectrum nuclear reactor, by impinging a proton beam onto a sample of thorium-232, or by extraction from spent nuclear reactor fuel. We have calculated that the irradiation of samples of U-233 or Th-232 would produce gram quantities per year and would be prohibitively expensive. The best approach is to extract the U-232 from spent reactor fuel. We have determined that a small quantity of such material, extracted from spent fuel, is available for study at the Lawrence Livermore National Laboratory. We have established contact with Mr. Cory Cate at LLNL about using their sample for power conversion experiments in Phase II. In addition, in Phase II, we will investigate the lifetime for the PV convertor in a continuous bombardment from alpha particles.

Hbar Technologies, LLC Dr. Steven D. Howe MAPPER
10
Figure 4. Decay Sequence of 232Uranium
Thorium - 228
Radium - 224
α decay – 6.8 MeV – .145 sec
α decay – 6.3 MeV – 55.6 sec
Lead – 212
α decay - 5.3 MeV – 69.8 yr
Radon - 220
α decay – 5.4 MeV - 1.91 yr
α decay – 5.7 MeV – 11.4 day
Polonium - 216
Bismuth - 212
Polonium - 212
Lead – 208
α decay – 11.6 MeV – 45 sec
Beta decay - .3 MeV – 10.6 hr
Beta decay – 2.2 MeV – 1 hr
Total Energy Release = 43.5 MeV
Uranium- 232

Hbar Technologies, LLC Dr. Steven D. Howe MAPPER
11
Figure 5. Plot of the activity released from the decay of U-232.
Figure 6. Dependence of spacecraft power as a function of the average cruise speed through the Belt.
Figures 6 and 7 show the dependence of the require power level as functions of the average cruise velocity and the specific impulse of the electric thruster. These curves result from optimization studies reported later in this document. The results show that

Hbar Technologies, LLC Dr. Steven D. Howe MAPPER
12
the power required is strongly dependent upon both of these parameters. In addition, Figure 7 indicates an optimum Isp of near 1000 s for the minimum mass of the power supply. As is shown later, this value actually approaches 1500 s for a minimum mass spacecraft.
Figure 7. Dependence of spacecraft power as a function of thruster specific impulse.
Alphas for propulsion We evaluated the idea of using the alpha particles from the decay of the U-232 to propel the vehicle. This concept originated due to the results of the Antimatter Sail concept wherein the fission fragments appear to be able to propel a sail to high speeds. In this case, the alphas have an energy of around 5 MeV or approximately 1.2 MeV/amu. This is the same for a fission fragment. Thus, the specific impulse is around 1.5x10⁶ s. The problem rests in the low mass of the alpha particle relative to the fission fragment. The thrust generated by an alpha source is 1x10⁻⁹ Nt/Curie. Thus, a 100 g source producing 15700 Curies could produce 200 W of electrical power via the TPC or 15.7 micro-Newtons of thrust if left exposed. After 1 year, a delta-V of only 5 m/s will be produced on a 100 kg spacecraft. This is insufficient. Thus, we have rejected the idea of using the alphas for propulsion.

Hbar Technologies, LLC Dr. Steven D. Howe MAPPER
13
Neutron signal evaluation As part of the “severe integration” concept, we evaluated the idea of using the same alpha particle source that makes power to make an intense neutron source for scanning the asteroid. This process is used routinely in the physics community. PuBe sources are used to calibrate detectors at accelerators and laboratories around the world. In essence, the source consists of a layer of beryllium surrounding a sample of plutonium-238. The alpha particle emitted by the plutonium impacts the beryllium and generates an energetic neutron. The conversion efficiency from alphas to neutrons is around 8x10⁻⁵ . The neutrons produced by (alpha,n) reactions exhibit peaking in the forward and backward directions, i.e. a “beam” is produced. The angular spread of this “beam” however is quite large. Consequently, we have made signal return calculations assuming a 4π emission. This means that the number of neutrons hitting an asteroid is inversely proportional to the distance squared from the asteroid. In addition, the return signal behaves exactly the same. Thus, the signal produced back at the spacecraft from the U(alpha,n) source is proportional to 1/d4, where d is the approach distance. This means that the U-232 source must be very strong or the approach distance must be quite close to get a sufficient signal. In fact, the approach distance must be under one diameter of the asteroid. This close approach together with the continuous bombardment of the platform and instruments by neutrons throughout the mission make the use of the (alpha,n) option unattractive. Consequently, we rejected this concept. Another possibility is to forego the idea of the “severe integration” concept, wherein we use the U-232 for many purposes, and utilize a small, light weight accelerator to produce a tight beam of neutrons. A 13.15 MeV beam of lithium ions impinging on a hydrogen target [5] will produce a beam of neutrons with 1.64 MeV kinetic energy into a 9 degree cone. This drastically reduces one of the 1/d2 parts of the signal loss.
0
0.5
1
1.5
2
2.5
13 14 15 16 17Incident Energy (MeV)
F d σ
(0o )/d
Ω (b
/sr)
0
0.5
1
1.5
2
2.5
13 14 15 16 17Incident Energy (MeV)
Figure 8: The forward (left) and backward (right) neutron differential cross sections observed using a hydrogen gas cell as the target [5].

Hbar Technologies, LLC Dr. Steven D. Howe MAPPER
14
The generation of an onboard lithium gun, electrostatic accelerator, hydrogen target, and energy recovery electrostatic decelerator will be low mass and very low power. Figure 9 shows a preliminary sketch of the MAPPER spacecraft with this neutron generator assembly superimposed.
Figure 9: Mapper spacecraft after deployment of the lithium acceleration and deceleration electrostatic columns. When the singly ionized lithium enters the hydrogen gas target, the dominant affect on the lithium ions is deceleration due to collisions with electrons (classic dE/dx). Because the peak production has a bandwidth of approximately 0.2 MeV, the trick is to size the gas cell to this thickness. Therefore, while neutrons are produced due to nuclear fusion between the lithium and hydrogen, forming beryllium, the vast majority of the lithium simply undergoes deceleration by 0.2 MeV. Using an energy-recovery deceleration electrostatic column followed by a very thin lithium-absorption foil, most of the energy required for acceleration is recovered while allowing the 2 MeV neutrons to pass harmlessly through the foil. Each of the electrodes in the acceleration columns are composed of thin metallic foils. The standoff’s between the electrodes are very thin ceramic insulator rods. One would naively think that in the interest of severe integration, replacing the hydrogen gas target with a stripping foil, and inverting the polarity of the deceleration column, this neutron source becomes a 40 MeV lithium-based propulsion system. Each lithium ion has a momentum of 730 MeV/c, so a lithium current of 5 Amperes would produce approximately 36 micro-Newtons of thrust, consuming 200 W of electricity. This is slightly twice the thrust from alpha-based thrust, and still completely insufficient. The next step is to perform a technical design of this neutron generator concept, optimizing the overall system architecture for minimum weight and power consumption and maximum neutron generation. Issues of alignment tolerances of the column electrodes and high voltage generation will also be addressed. Analysis of this technique shows that the optimum approach distance is 2.8 diameters of the asteroid. At this distance, the neutron beam just encompasses the full face of the asteroid. This will provide the most signal and full coverage of the exposed surface. Closer approaches will provide more return signal but of a fraction of the surface. Larger standoff distances will provide less accurate statistics of the return signal but

Hbar Technologies, LLC Dr. Steven D. Howe MAPPER
15
may not require as much delta-V for the approach. Optimization of the approach vectors and signal analysis will be pursued in Phase II. Neutron and gamma ray detection systems for water and elemental analysis Elemental analysis using gamma rays from neutron capture has been demonstrated by the Lunar Polar Orbiter [6], Mars Surveyor, and the Eros asteroid flyby missions. In both of these cases, though, the pass-by distances were hundreds of kilometers and the neutrons were generated from the galactic cosmic ray background. By using an intense active source that can be turned on and off on demand, we intend to develop high statistical maps of elemental abundances in short scanning periods.
Figure 10. Neutron detector used on Lunar Prospector to determine the presence of water on the Moon.
The objective of the mission is to map out the elemental resources of the asteroids. The detection of water is done by detecting the energy spectrum of the neutrons returning from the target asteroid. The detection of certain heavy elements can be done by detecting unique gamma rays emitted by those elements. Similar goals were recently executed by a mission to the Moon, the Lunar Prospector. The detectors were built by a team from the Los Alamos National Laboratory. Figures 10 and 11 show the detectors designed and built by Dr. William Feldman used on the mission. The neutron detector has a mass of 3.9 kg and requires 2.5 W of power. The gamma detector has a mass of 8.6 kg and requires 3 W of power. The Lunar Prospector detected neutrons and gamma rays resulting from cosmic ray bombardment of the bare Lunar surface. Consequently, several passes over the same point of the surface were needed to establish sufficient precision. Figure 12 shows the gamma ray spectra returned to the detector and the identified elements.

Hbar Technologies, LLC Dr. Steven D. Howe MAPPER
16
Figure 11. Gamma ray detector used on Lunar Prospector mission for elemental abundance measurements.
Figure 13 shows the neutron spectra returned as a function of the water content in the soil. The moderation or “slowing down” of neutrons is extremely sensitive to the amount of hydrogen present. By bombarding the soil with a known spectrum of neutrons and measuring the returning spectrum, we can easily and accurately identify the water content in the soil. In the MAPPER missions, we will utilize an intense pulsed neutron source to induce return signals. This will allow the platform to make measurement over a few second time window.
Figure 12. Gamma ray spectra from Lunar prospector

Hbar Technologies, LLC Dr. Steven D. Howe MAPPER
17
Howe problem
1.0E-09
1.0E-08
1.0E-07
1.0E-06
1.0E-05
1.0E-09 1.0E-08 1.0E-07 1.0E-06 1.0E-05 1.0E-04 1.0E-03
neutron energy
flux
3%waterwater10%
Figure 13. Neutron spectra returned as a function of water content Electric thruster evaluation Research into high specific-impulse, low-specific-mass electric thrusters has been pursued by many institutions for decades. The main thrust of the research has been to develop arc-jet and electrostatic ion thrusters. Both of these systems have been operated in space in deployed spacecraft. Typically, the arc-jet has a specific impulse (Isp) of around 1000 s while the ion thruster can have an Isp of up to 5000 s. Unfortunately, the efficiency and lifetimes of these systems tend to reach desirable values only at high power levels. The goal of this project is to develop a spacecraft that is small and can be propelled between asteroids using low power thrusters [7,8]. To keep the propellant mass down, we will require a high Isp system. However, preliminary calculations indicate that only a few hundred watts of jet power are needed to carry a small craft between asteroids with a one to two day transit time. Recent research at the Pennsylvania State University [9,10] has demonstrated the possibility of using 2.45 GHz microwave radiation to power a light weight thruster. A schematic of the thruster is shown in Figure 14. Preliminary results show a specific impulse of 1300 s for helium. Tests have also been started using nitrogen, ammonia, and water as propellants. Tests on this system have also demonstrated several other advantages over conventional arcjets such as no cathode erosion, higher efficiency at low power, and ability to operate in a pulsed mode. The performance of this type of thruster appears to be well suited for the MAPPER application.

Hbar Technologies, LLC Dr. Steven D. Howe MAPPER
18
Figure 14. Schematic drawing of the low power micro wave thruster being developed at PSU. [courtesy of http://www.islandone.org/APC/Electric/04.html]
In addition, the NASA Glen Research Center recently published results of the High Power Electric Propulsion (HiPEP) ion engine [11], see Figure 15. This engine demonstrated a specific impulse of 6000 s using xenon as a working fluid. The HiPEP ran at a power level of around 12 kW. This power level is well beyond what is feasible for MAPPER but the demonstration of the high Isp may be applicable.
Figure 15. Test of the HiPEP thruster at the NASA Glen Research Center Mission profiles and delta-V requirements for refueling The basis of this concept hinges upon the ability of the spacecraft to refuel itself. The premise for this scenario is that, periodically, a carbonaceous-chondrite asteroid will be found and mapped that has a high density of water retained in the surface material. The

Hbar Technologies, LLC Dr. Steven D. Howe MAPPER
19
refueling profile will occur many times during the mission. In order to estimate the fuel and power requirements of the spaceship during the mission, we have assumed a standard flight profile as shown in Figure 16. The mass of fuel (water) required to be on board will depend upon the cruise velocity that must be reversed. However, the basic profile is as follows:
1) cruise through the Belt with a constant velocity, V0; 2) scan objects they pass with the neutron beam and the radar; 3) if no water signature is detected, scan the forward direction for other
bodies to determine the next target; 4) if a sufficient water signature is detected, initiate docking sequence
a. reverse orientation and apply full thrust b. maintain radar lock on target asteroid c. accelerate for ½ the distance, reverse and decelerate d. return to the target in 14 days e. approach surface and “dock” f. initiate water extraction sequence – apply partial thrust to maintain
contact with surface We have calculated the amount of water needed to execute the docking maneuver and the power required to stop the forward cruise and reverse toward the target. We have initially assumed that the ship should stop its forward progress within 10 days and return to the target within 10 days. These are arbitrary values used for initial estimates. The stopping and return times will be optimized to correspond with the overall power level for the ship. That power level is to be determined after considering all power demands such as water extraction, communications, and propulsion.
Cruise vector
Neutron probe
Water = Yes then decelerate
∆V = cruise velocity
T = Taccel
Return to asteroid in 1.4 Taccel days
Accelerate for ½ distance and decelerate for ½ distance
Water = NO
Then radar search and course correct
Figure 16. Flight profile to dock with target asteroid for the extraction of water for refueling.
If water is detected on the target, the docking process starts. We have assumed that the ship at this point consists of the instruments, structure, propulsion system, power system, water extraction system, and sufficient water/fuel to make the stop with a 10% contingency. This is then the initial mass that is needed to be stopped and docked to

Hbar Technologies, LLC Dr. Steven D. Howe MAPPER
20
the asteroid. The delta-V of the stopping leg shown in Figure 1 is the cruise velocity of the ship. The second delta-V is that needed to return to the asteroid within the specified 10 days. Thus, the return delta-V is 0.20 the cruise velocity. Working through the rocket equation shows that the total mass of the spacecraft at the start of the docking sequence is: Mass propellant = Massinitial x (e delta-V/Vex -1) Adding up the contributions for each leg of the profile results in Masstot = Massdry x e(2.2*Vcruise/Vex)
where Masstot = total mass of the spacecraft prior to deceleration Massdry = Total mass less the mass of the propellant Vcruise = average velocity of the craft Vex = exhaust velocity of the ion thrusters The time requirement of the stopping and docking determines the power level needed by the propulsion system. The jet power needed to perform both legs of the sequence is given by Power = Masstot x Vex x delta-V 2 x T where T= the transit time for each leg This formula has been incorporated into our optimization setup. As we vary the cruise velocity, a corresponding power will be calculated. This, in turn, dictates the amount of U-232 and the mass of the power sub-system. Water extraction and accumulation for refueling The added advantage of the microwave thruster is the potential duality of the system. In 1985, Dr. T. Meek of the Los Alamos National Laboratory (LANL) demonstrated the ability to extract water from simulated lunar soil using 2.45 GHz microwaves [12]. Microwaves readily couple to the water trapped in soils. According to Meek, using conventional means to heat the soil would require 10,000 times more energy than using the microwaves to selectively heat the water in the soil. The results of Dr. Meek’s work clearly demonstrated that actual lunar soil was remarkably receptive to heating by the microwaves as seen in Figure 17. Within 10 s, a 1 cm3 sample was melted into a glass-like droplet. His studies also indicated that the microwaves would penetrate to a depth of around 30 cm in the regolith bearing a few per cent water – this result, however, is dependent upon the water content of the soil and the mineralogical make-up. Thus, we will examine the potential of reconfiguring the microwave thruster so that the microwaves can be directly sent into the soil of a carbonaceous chondrite (CC) asteroid.

Hbar Technologies, LLC Dr. Steven D. Howe MAPPER
21
By placing the microwave generator over the soil, we intend to produce water vapor which can then be condensed on cool plates. The liquefied water is then transported into the propellant tanks. Because CC asteroids have as much as 10% water and are relatively abundant in the steroid belt, we believe that the spacecraft can frequently find sufficient sources of water to replenish the fuel supply. The basis of the MAPPER concept relies on the ability to refuel the spacecraft using in-situ resources found on the asteroids. After examining the elemental and mineralogical abundances predicted to reside on the asteroids, we have concluded that water is probably the best resource to use as propellant. Water has been used in microwave heated plasma jet thrusters and is estimated to be available among the asteroid population. However, the water will be present in the form of subsurface ice or bound into minerals. Acquisition of sufficient quantities of water is, therefore, a major technological issue for this project.
Figure 17. Sample of lunar soil irradiated with 2.45 GHz microwaves We have already examined the status of microwave driven thrusters. Many versions have been tested at different power levels that demonstrated the use of water as a working fluid. In addition, we have made preliminary studies of the relative velocity distribution of the asteroids in the Main Belt. For a rough approximation, the average relative velocity between asteroids is around 1 km/s. Thus, we propose that the delta-Vs needed to evade unattractive targets or to alter course to flyby attractive targets is on the scale of a fraction of 1 km/s. The actual delta-V will be estimated during our optimization study because it depends upon what the average cruise velocity of the spacecraft is. The specific impulse of the thruster will also be optimized. Clearly, a high value of Isp means less propellant is required, however, a high value of Isp means higher power levels and larger masses for the radioisotope and power sub-system. Thus, an optimization is needed of all the complex interactions of the sub-systems.

Hbar Technologies, LLC Dr. Steven D. Howe MAPPER
22
The primary propellant requirement for the spacecraft will be the stopping maneuver discussed previously to acquire the water from an asteroid. This is the highest delta-V and thus the highest mass requirement. Again, this depends upon the average cruise velocity which must be negated in order to rendezvous with the body. We estimate that this mass will be a few 10s of kg depending upon the Isp of the thruster. We have investigated the premise that the microwaves from the thruster system can be redirected to heat the asteroid surface and extract water from the soil. The rechanneling can be accomplished either by mechanical alteration of the microwave conduit or by altering the polarization of the microwaves so that they follow an alternative path. The concept involves placing a “bell” against the surface. The bell is similar in shape to the’ bell nozzle” on a normal rocket but is made of thin aluminum of even metalized plastic. Microwaves will be transported down a waveguide into the bell and thus into the soil. Water vapor generated in the soil will escape creating s slightly pressurized volume in the bell. The vapor will be condensed on the bell walls and through capillary action transported into the fuel tank. This method has been demonstrated by several astronauts, e.g. Dr. Don Pettit, aboard the International Space Station. The use of capillary action is attractive in that the “wicking” force in a zero-gee environment is dominant and keeps the fluids from randomly moving in the volume. We estimate that a 50 cm radius bell will be able to acquire almost 60 kg of water from an asteroid with 10% concentration. Conceivably, for a smaller concentration, multiple extraction points on a given body may be required. If we assume the extraction is performed over a 10 hr interval, a power level of around 4 kW is necessary. This correlation is included in our optimization study. One subtle aspect of the water extraction scenario is the pressurization of the collection bell. Essentially, the asteroid has negligible gravitational force on the spacecraft. Thus, in order to keep the bell solidly against the surface, the spacecraft will need to maintain a slight thrust level against the asteroid during the water extraction process. This necessitates the use of the microwaves for both thrust and soil-heating simultaneously. This requirement is now being assessed with regards to which method of microwave diversion is more appropriate. Water Storage and transport One final issue with regards to using water as a propellant is the storage issue. In order to keep power requirements at a minimum, the spacecraft wants to use liquid water. If the water is allowed to freeze, significant heat will be needed to liquify it to feed the thruster. Thus, we have examined the use of the waste heat from the radioisotope power source to maintain the fuel tank at a temperature where the water will remain liquid. Assuming a spherical tank, water at 50 degrees centigrade will radiate around

Hbar Technologies, LLC Dr. Steven D. Howe MAPPER
23
154 W of heat into space. This must be replaced by the power system to maintain the temperature. We envision a power source, however, of near 10 kW thermal. Thus, a small fraction, probably through conduction in the platform structure, will be needed to maintain the water. Radar requirements for target location, evasion, and flight path determination. In order to meet the above requirements, it is necessary to find, track, and monitor the position, size, class, and rotation of candidate asteroids at distances far enough away to allow for decisions and directional thrusts consistent with the above propulsion system parameters. For example, if the rotational rate is above a preset limit, it would be dangerous and hence pointless to rendezvous with such a target. The properties of the radar system that are important are output power, angular resolution, and signal line width. Output power is necessary to extend the sensitivity of the system out to farther distances, reducing the amount of thrust required for a rendezvous. Angular resolution is important in order to pinpoint the trajectory of a candidate asteroid with sufficient precision that a rendezvous is possible. Signal line width set the resolution of Doppler shift that can be measured, hence specifying the timing of the rendezvous with sufficient precision. In the spirit of reducing cost, weight, and package size, it is most efficient to first consider using the same RF source for radar vision that is used for propulsion and water gathering. The wavelength of a 2.45 GHz microwave is 12.2 cm, very similar to the 12.6 cm wavelength used by Arecibo [13-16]. According to this data, the typical worst-case radar albedo at these wavelengths is 5%. In report #1 we calculated that the average asteroid size was 18 m, and the average distance between asteroids of this size is roughly 14,000 km [table 3]. Above we estimated that the average speed of asteroids relative to our probe is approximately 1 km/sec. Using the parameters for water refilling above, was assume that a probe can accelerate to 1 km/sec in the span of 10 days, or at one ten-thousandth of one g. The bottom line is that for the probe to “get in the way” of the closest average asteroid at or above 18 m in diameter, it needs approximately two days. The mean distance of the asteroid from the probe two days prior to passage is therefore 156,000 km. The above numbers are examples of input parameters into a model for the sensitivity and directionality requirements of the radar system. Because of the similarity in wavelength, we use the sensitivity of the Arecibo receiver to calculate that a probe with a 30 m diameter parabolic radar antenna is sensitive to 1x10-18
W. The transmission cone angle from such an antenna is 0.3o and 20% efficient. Using the above numbers, the power required to detect a typical 18 m diameter asteroid is 30 MW peak power. Assuming a 3 kW cw source, energy storage and a duty cycle of 10-4
is required. For a millisecond burst long enough to get sufficient Doppler shift data for radial velocity, a measurement every 10 sec is possible. It was assumed that the antenna is a lightweight wire mesh that can be deployed and retracted at will.

Hbar Technologies, LLC Dr. Steven D. Howe MAPPER
24
Tagging and communications We examined two options for tagging the asteroid once it has been scanned. In addition to sending the scan data back to Earth, we envision implanting some type of device onto the asteroid that would broadcast a unique signal over ranges of 100’s of kilometers. In this way, future explorers could read the signal, correlate it with a compendium of data transmitted to earth, and know what the elemental make-up of the body was. The goal then was to identify a technique that would allow a few thousand units to be carried on board the platform. Total mass of all of the units should be a few kilograms. Our initial assumption was to utilize radioisotopes. Conceivably, five different isotopes could be mixed in different amounts, ala a paint mixer at the local hardware store, to produce a unique combination. This mix would emit gamma rays and the ratio of those gamma rays would essentially provide a “bar code” to tag the asteroid. The advantages of this concept are that 1) no electrical power is required, 2) the signals could be long lived (> 30 years), and the concept has inherent security. The disadvantages are that 1) the natural gamma ray background may overshadow the signal from the tag and 2) the observer has to be in a line of sight to see the signal. After examining the idea, we conclude that this is not a viable concept. The alternative is to utilize electronic beepers. We originally discounted this option because of the need for long-lived electrical power for each beeper. However, recent developments in this area, e.g. the Smart Dust [17] concept referenced in another NIAC Phase I, show that small, lightweight, long-lived units are already available. Figure 18 shows such a beeper.
Figure 18. Smart Dust transmitter. The main advantage of using this method for tagging is that it broadcasts into all directions. Thus, future explorers need only get within the minimum distance to receive the signal and identify the asteroid. As mentioned previously, the scan data will be sent to Earth to be catalogued. We estimate that a total power requirement of 400 w or less is sufficient for this task. This is

Hbar Technologies, LLC Dr. Steven D. Howe MAPPER
25
the power level contained on the Galileo spacecraft around Jupiter. In addition to the elemental spectra, the signal to Earth should contain the location of the asteroid. This information can be determined by using the split field of view star sensors (StarNav II)[18]. This technique has been developed by Prof. Junkins at Texas A&M University and allows the absolute location in a given reference frame to be determined from star positions. Optimization studies Estimates for mass and power requirements for all subsystems were used in an optimization routine. The goal was to find the mass of the platform as a function of power level, acceleration time up to cruise velocity, average cruise velocity, and specific impulse of the thruster. These four parameters were varied as free variables to assess the dependency of the platform mass on each. In addition, we tried to estimate the cost effectiveness of each result. For this, we assumed a deployment scenario that distributed the swarm of spacecraft into the asteroid belt. The assumption was that a nuclear thermal rocket would transport an assembly of MAPPER platforms to the Belt. The entire “stage”, engine, fuel and platforms would be lofted into low Earth orbit by a Delta IV rocket at a cost of $73 M. Thus, the cost per platform is the launch cost divided by the number of platforms. The number possible is the total available mass left on the Delta IV divided by the mass of each platform determined in the optimization study. Mission requirements for deployment from Earth to the Main Belt The goal of this project is to design a spacecraft that is sufficiently small and light-weight that hundreds to thousands of units could be deployed into the Main Belt. The assumption of this proposal is that the platforms could be deployed to the Main Belt at a reasonable cost per unit. This assumption requires that launch costs from Earth be kept low or that a large number of platforms be launched at a time from Earth. Current launch costs using chemical rockets would be prohibitively expensive. Given the NIAC charter for developing technology within the next 40 year timeframe, we have examined the potential for using a nuclear thermal rocket to deliver clusters of platforms to the Belt. In 1955, the Los Alamos Scientific Laboratory began the Rover program to develop a solid core nuclear rocket engine. The basic concept was to allow a graphite-fuel based nuclear reactor to reach high temperatures, to cool the reactor with clean hydrogen, and to exhaust the high-speed hydrogen for thrust. The advantages were seen to be shorter trip times, lower mass in orbit, and no possibility of accidental explosion. In 1963, the Nuclear Engine for Rocket Vehicle Applications (NERVA) began with Aerojet as the prime contractor and Los Alamos as a supporting contributor. The goal

Hbar Technologies, LLC Dr. Steven D. Howe MAPPER
26
of the NERVA program was to transform the nuclear reactor technology developed by Los Alamos and produce a space qualified nuclear engine. Both programs were terminated in 1972. Before termination, however, the Rover/NERVA programs built and tested 23 reactors/engines, achieved fuel temperatures in excess of 5500ºF, ran a reactor with a peak power of greater than 4000 MW, operated a system for over an hour, demonstrated start-up and shut-down operations, and proved that the graphite based reactor core could withstand the extreme conditions of operation. The exhaust of the engine in the final days of the program was calculated to have a specific impulse of near 850 seconds, almost three times the performance of the kerosene engines of the Saturn V and twice that of the soon-to-be-developed LOX/hydrogen engines of the Space Shuttle. The impact of this performance would have been to reduce the trip time of a manned Mars mission from the 2.5 years, possible with chemical engines, to about 14 months. The recently announced Space Initiative by President Bush has rekindled interest by NASA in the nuclear thermal rocket (NTR). Studies over the past decade indicate that a NTR built with modern materials and techniques could have a specific impulse of 950 s and a thrust to weight ratio of around three. We have modeled the a potential mission using a 15,000 lb thrust engine weighing 1667 lbs and having an exhaust velocity of 9310 m/s.
Figure 19. Example flight profile for a Hohman transfer orbit from Earth to Jupiter.

Hbar Technologies, LLC Dr. Steven D. Howe MAPPER
27
Figure 19 shows the flight path for a typical Hohman transfer orbit. The Hohman orbit is unique in that it requires the minimum expenditure of energy by the propulsion system because the apogee of the elliptical orbit just reaches the desired orbital distance. If a second engine burn is not executed, the craft will return to the original orbit. As seen in the figure, the second firing of the rocket is required to implant a payload into a distant orbit. From orbital mechanics, the delta-V required at each orbit can be found by: ∆V1=(µ/a1)1/2 [ 2 a2 -1] (a1 + a2) where
µ = G(m1 + m2) G= gravitational constant m1= mass of ship m2= mass of central gravitational body, e.g. the Sun a1,a2= distance to initial orbit and final orbit respectively
Plugging in 1 AU for earth and 2.25 AU (the Flora region of the Belt) for a1 and a2 yields ∆V1 = 5.3 km/s ∆V2 = 4.22 km/s
With these ∆Vs and the exhaust velocity, we calculate can calculate the mass of propellant needed to take the cluster to the Main Belt. The result is that the mass of the entire payload in Earth orbit prior to launch is
Mtot = 2.71 x Mpay Where Mpay is the mass of just the cluster of platforms. The mass of the platform is that which can be launched from the Earth’s surface into Low Earth Orbit (LEO). A Delta-IV rocket can put 9090 kg into LEO for $73 M. The NTR weighs 758 kg. The propellant mass to insert the entire cluster into orbit at the Main Belt will be 4409 kg. Thus, we calculate that the total mass of the spacecraft cluster must equal 3700 kg. The number in the cluster depends, therefore, on the mass of each unit. This value will result from our optimization study. However, if we can design each ship to be 100 kg, then 37 units can be launched per NTR flight. This would be $2M per spacecraft. Results The results of the optimization studies are shown of Figures 20-23. The dependency on platform mass, power level, and cost per platform versus average cruise speed and Isp

Hbar Technologies, LLC Dr. Steven D. Howe MAPPER
28
are shown. In addition, we have determined a figure of merit parameter to try to illuminate the value of the MAPPER performance.
Figure 20. Dependence of various parameters versus average cruise velocity.
Figure 21. Fraction of the Earth’s surface scanned by 1000 spacecraft in 20 years as a function of average cruise speed.

Hbar Technologies, LLC Dr. Steven D. Howe MAPPER
29
Instead of assessing the fraction of asteroids visited, we have calculated the surface area encompassed by the asteroids. The “frac” parameter is the integral of the area of each asteroid times the number of asteroids of diameter D visited by 1000 MAPPER platforms during a 20 year interval. The units of the “frac” parameter are expressed in Earths, i.e. what fraction of the total surface area of the Earth will be catalogued. Figure 21 shows the fraction as a function of the average cruise speed.
Figure 22. Dependence of various parameters versus specific impulse of the thruster.
Finally, the ratio of the cost per platform to the fraction of Earths is shown in Figure 23. This is the final optimization. In essence, this plot shows that the most land area is scanned for the fewest dollars with a cruise speed of 0.5 km/s. This then determines the power levels and mass of the spacecraft.

Hbar Technologies, LLC Dr. Steven D. Howe MAPPER
30
Figure 23. Ratio of the cost per platform to surface area scanned as a function of cruise velocity.
Conclusions From these calculations, we conclude that the optimum cruise velocity is 0.5 km/s and the optimum specific impulse of the thruster is 1500 s. The specific impulse is well within the capabilities of the thrusters mentioned earlier. The conclusions we have reached from this Phase I study are:
• A host of small platforms can survey a significant fraction of the asteroid population in a 20 year interval
• The land area surveyed could be equal to a major fraction of the Earth’s surface area
• The energetic radioisotope power supply appears adequate for the mission needs
• Most subsystem hardware has current-day examples that can be improved
• A time-dependent simulation is needed for flight profile demonstration and targeting algorithm development

Hbar Technologies, LLC Dr. Steven D. Howe MAPPER
31
Phase II studies We have completed the initial examination of the architecture and subsystems for the MAPPER concept. The results show that platforms with a mass of near 100 kg may be possible to construct that could achieve the desired goals. We have identified currently existing technologies to fulfill the subsystem requirements and used their mass and power values for optimization studies. The concept looks very promising. Essentially, this method may allow the surface area of the Earth to be scanned and recorded within a 20 year period. This represents almost unimaginable amount of raw resources including water. Mapping these resources would enable rapid utilization of the asteroid belt for colonization or support of human exploration into the solar system. This study also revealed many areas for further investigation. More detailed assessment of technologies is needed. Improvements in technologies and subsystem components need to be implemented into the optimizer. A major issue pertinent to the entire concept is lifetime. The 20 year duration assumed for this mission is beyond proven lifetimes for some technologies. An accurate assessment of the impact of shortened lifetimes needs to be made. In addition, a time dependent simulation of the flight of the platform must be made to truly assess the viability and requirements of the radar targeting system. Random interception is insufficient. Active course correction after each encounter is required to intercept a sufficient number of asteroids. This must be simulated as accurately as possible to determine the delta-V of the interceptions. In Phase II, we intend to create designs of each subsystem, virtually package the components into an integrated platform, and demonstrate via simulation the performance of the spacecraft. By the end of Phase II, we hope to demonstrate the feasibility and attractiveness of the MAPPER concept for further consideration by NASA and future explorers, References
1. http://www.solstation.com/stars/asteroid.htm - asteroid belt data 2. http://ants.gsfc.nasa.gov/information.html - ANTS 3. Farinella, P. and Davis, D.R. 1994. Will the real asteroid size distribution please
step forward. Lunar Planet. Sci. Conf. XXV, 365 – 366. – asteroid distribution 4. Howe, S. and G. Jackson, “Antimatter Sail for Deep Space Missions,” Final
Report Phase I, NIAC, 2003. 5. J.H. Dave, et al., “The 1H (7Li,n) 7Be Reaction as an Intense MeV Neutron
Source”, Nucl. Instr. Meth. 200 285 (1982).

Hbar Technologies, LLC Dr. Steven D. Howe MAPPER
32
6. http://www.lanl.gov/orgs/pa/News/030698.html - lunar prospector / water on the moon
7. http://www.grc.nasa.gov/WWW/ion/archive/2002/inhouse/aiaa-2002-3837.pdf – ion thruster
8. http://www.fbodaily.com/cbd/archive/1999/01(January)/28-Jan-1999/Asol007.htm - low power ion thrusters / GRC
9. http://www.islandone.org/APC/Electric/04.html - microwave thruster PSU/JPL 10. http://www.engr.psu.edu/news/News/1999%20Press%20Releases/October/micro
wave.html --- PSU microwave thruster data 11. HiPEP test, NASA Glenn Research center
<http://www.spaceref.com/redirecth.html?id=0&url=http://www.grc.nasa.gov/> 12. Meek, T., et al., “Microwave Processing of Lunar Materials: Potential
Applications,” Proceedings of Lunar Bases and Space Activities of the 21st Century, W.W. Mendell editor, Lunar Planetary Institute, 1985.
13. Magri, C., S. J. Ostro, K. D. Rosema, M. L. Thomas, D. L. Mitchell, D. B. Campbell, J.F. Chandler, I. I. Shapiro, J. D. Giorgini, and D. K. Yeomans, “Mainbelt asteroids:Results of Arecibo and Goldstone radar observations of 37 objects during 1980-1995”, Icarus 140 (1998) 379-407.
14. Mitchell, D. L., S. J. Ostro, K. D. Rosema, R. S. Hudson, D. B. Campbell, J. F. Chandler, and I. I. Shapiro, “Radar observations of asteroids 7 Iris, 9 Metis, 12 Victoria, 216 Kleopatra, and 654 Zelinda”, Icarus 118 (1995) 105-131.
15. Mitchell, D. L., S. J. Ostro, R. S. Hudson, K. D. Rosema, D. B. Campbell, R. Velez, J. F. Chandler, I. I. Shapiro, J. D. Giorgini, and D. K. Yeomans, “Radar observations of asteroids 1 Ceres, 2 Pallas, and 4 Vesta”, Icarus 124 (1996) 113-133.
16. Ostro, S. J., R. S. Hudson, M. C. Nolan, J.-L. Margot, D. J. Scheeres, D. B. Campbell, C. Magri, J. D. Giorgini, and D. K. Yeomans, “Radar observations of asteroid 216 Kleopatra”, Science 288 (2000) 836-839.
17. http://robotics.eecs.berkeley.edu/~pister/SmartDust - small sensors and comms 18. http://www.jsc.nasa.gov/aiaa/lal/lljun01/