NI 43-101 Technical Report for the Costerfield Mine ... · PDF file17.3.3 Uphole Airleg...
124
NI 43-101 Technical Report for the Costerfield Mine, specifically the Augusta Lodes and Brunswick Mill, of Mandalay Resources Corporation at Costerfield, Victoria, Australia Prepared for: Mandalay Resources Corporation 76 Richmond Street, Suite 330 Toronto, Ontario M5C 1P1 CANADA Prepared by: SRK Consulting (Australasia) Pty Ltd Level 6, 141 Queen Street Brisbane 4000 AUSTRALIA Effective Date: 1 March 2010 Report Date: 14 May 2010 Project Code: PLI003
Transcript of NI 43-101 Technical Report for the Costerfield Mine ... · PDF file17.3.3 Uphole Airleg...

NI 43-101 Technical Report for the Costerfield Mine, specifically the
Augusta Lodes and Brunswick Mill, of Mandalay Resources Corporation at
Costerfield, Victoria, Australia
Prepared for: Mandalay Resources Corporation
76 Richmond Street, Suite 330 Toronto, Ontario
M5C 1P1 CANADA
Prepared by: SRK Consulting (Australasia) Pty Ltd
Level 6, 141 Queen Street Brisbane
4000 AUSTRALIA
Effective Date: 1 March 2010
Report Date: 14 May 2010
Project Code: PLI003

SRK Consulting │ PLI003 Costerfield - Mandalay Resources NI 43-101 Technical Report 14 May 2010
SRK Consulting (Australasia) Pty Ltd RALE/SOMM/DUPL/DUTO/MULL/wulf PLI003_Costerfield_Augusta_RR_Audit_NI 43-101_Technical_Report_Rev3 │i
NI 43-101 Technical Report for the Costerfield Mine, specifically the Augusta Lodes and Brunswick Mill, of Mandalay Resources Corporation at Costerfield, Victoria, Australia
PLI003
Document Reference: PLI003_Costerfield_Augusta_RR_Audit_NI 43-101_Technical_Report_Rev3.docx
Mandalay Resources Corporation 76 Richmond Street, Suite 330 VANCOUVER V6E 2E9 Toronto, Ontario M5C 1P1 Canada
SRK Consulting (Australasia) Pty Ltd Level 6, 141 Queen Street, Brisbane QUEENSLAND 4000 Australia
Compiled by: Peer Reviewed by:
Chris Raleigh Principal Consultant (Mining)
John Blackburn Principal Consultant (Mining)
Contributors:
Kobus du Plooy BSc (Geology and Geochemistry)
Brett Muller BE (Minerals Engineering and Extractive Metallurgy)
Adriaan du Toit BSc (Geology and Hydrology)
Bruce Sommerville BSc (Mining Geology)
Endorsed by QP: Chris Raleigh
SRK Consulting │ PLI003 Costerfield - Mandalay Resources NI 43-101 Technical Report 14 May 2010
SRK Consulting (Australasia) Pty Ltd RALE/SOMM/DUPL/DUTO/MULL/wulf PLI003_Costerfield_Augusta_RR_Audit_NI 43-101_Technical_Report_Rev3 │ii
SRK Report Distribution Record
Project Number: PLI003
Date Issued: 14 May 2010
Name/Title Company
Mark Sander Mandalay Resources
This document is protected by copyright vested in SRK. It may not be reproduced or transmitted in any form or by any means whatsoever to any person without the written permission of the copyright holder, SRK.
Rev No. Date Revised By Revision Details
0 28 April 2010 Chris Raleigh Draft report issued to client
1 12 May 2010 Chris Raleigh Report issued to client
2 13 May 2010 Chris Raleigh Report issued to client
3 14 May 2010 Chris Raleigh Final report issued to client
SRK Consulting │ PLI003 Costerfield - Mandalay Resources NI 43-101 Technical Report 14 May 2010
SRK Consulting (Australasia) Pty Ltd RALE/SOMM/DUPL/DUTO/MULL/wulf PLI003_Costerfield_Augusta_RR_Audit_NI 43-101_Technical_Report_Rev3 │i
Table of Contents (Section 1.3.1)
Summary (Item 3) ............................................................................................................ viii
1. Introduction (Item 4) ............................................................................................... 1-1
1.1 Terms of Reference and Purpose of the Report ........................................................ 1-1 1.1.1 Terms of Reference .................................................................................................. 1-1 1.1.2 Purpose of the Report ............................................................................................... 1-1
1.2 Reliance on Other Experts and Sources of Information (Item 5) ............................... 1-1 1.2.1 Reliance on other Experts ........................................................................................ 1-1 1.2.2 Sources of Information.............................................................................................. 1-1
1.3 Qualifications of Consultants ..................................................................................... 1-2 1.3.1 Qualification and Experience .................................................................................... 1-2 1.3.2 Site Visit .................................................................................................................... 1-2
1.4 Effective Date ............................................................................................................ 1-2 1.5 Units of Measure ....................................................................................................... 1-3
2. Property Description and Location (Item 6) ......................................................... 2-1
2.1 Property Location ...................................................................................................... 2-1 2.2 Tenements ................................................................................................................. 2-1 2.3 Survey Grid Location ................................................................................................. 2-4 2.4 Royalties and Taxes .................................................................................................. 2-5
2.4.1 Royalties ................................................................................................................... 2-5 2.4.2 Taxes ........................................................................................................................ 2-5
2.5 Environmental Liabilities and Permitting .................................................................... 2-5 2.5.1 Required Permits and Status .................................................................................... 2-5 2.5.2 Compliance Evaluation – Groundwater License ...................................................... 2-6
3. Accessibility, Climate, Local Resources, Infrastructure and Physiography (Item 7) .................................................................................................................... 3-1
3.1 Topography, Elevation and Vegetation ..................................................................... 3-1 3.1.1 Topography ............................................................................................................... 3-1 3.1.2 Elevation ................................................................................................................... 3-1 3.1.3 Vegetation ................................................................................................................. 3-1
3.2 Climate and Length of Operating Season ................................................................. 3-1 3.2.1 Climate ...................................................................................................................... 3-1 3.2.2 Operating Season ..................................................................................................... 3-1
3.3 Physiography ............................................................................................................. 3-2 3.4 Access to Property .................................................................................................... 3-2 3.5 Local Resources and Infrastructure ........................................................................... 3-2
3.5.1 Access Road and Transportation ............................................................................. 3-2 3.5.2 Power Supply ............................................................................................................ 3-2 3.5.3 Water Supply ............................................................................................................ 3-3 3.5.4 Buildings and Ancillary Facilities .............................................................................. 3-3 3.5.5 Camp Site ................................................................................................................. 3-3 3.5.6 Tailings Storage Area ............................................................................................... 3-3 3.5.7 Waste Rock Storage Area ........................................................................................ 3-3 3.5.8 Manpower ................................................................................................................. 3-3
4. History (Item 8) ....................................................................................................... 4-1
4.1 Ownership ................................................................................................................. 4-1 4.2 Past Exploration and Development ........................................................................... 4-1 4.3 Historic Mineral Resource and Reserve Estimates ................................................... 4-1 4.4 Historic Production .................................................................................................... 4-2

SRK Consulting │ PLI003 Costerfield - Mandalay Resources NI 43-101 Technical Report 14 May 2010
SRK Consulting (Australasia) Pty Ltd RALE/SOMM/DUPL/DUTO/MULL/wulf PLI003_Costerfield_Augusta_RR_Audit_NI 43-101_Technical_Report_Rev3 │ii
5. Geological Setting (Item 9) .................................................................................... 5-1
5.1 Regional Geology ...................................................................................................... 5-1 5.2 Local Geology ............................................................................................................ 5-3 5.3 Project Geology ......................................................................................................... 5-5
6. Deposit Type (Item 10) ........................................................................................... 6-1
7. Mineralisation (Item 11) ......................................................................................... 7-1
7.1 Mineralised Zones ..................................................................................................... 7-1 7.2 Relevant Geological Controls .................................................................................... 7-1
8. Exploration (Item 12) .............................................................................................. 8-1
8.1 Surveys and Investigations ........................................................................................ 8-1
9. Drilling (Item 13) ..................................................................................................... 9-1
9.1 Type and Extent of Drilling ........................................................................................ 9-1 9.1.1 Procedures ............................................................................................................... 9-2
9.2 Drill Hole Collar and Survey Control .......................................................................... 9-4
10. Sampling Method and Approach (Item 14) ......................................................... 10-1
10.1 Sampling Methods ................................................................................................... 10-1 10.1.1 Diamond Core Sampling ........................................................................................ 10-1 10.1.2 Underground Face Sampling .................................................................................. 10-2
11. Sample Preparation, Analyses and Security (Item 15) ...................................... 11-1
11.1 Sample Preparation and Assaying Methods ........................................................... 11-1 11.1.1 Testing Laboratories ............................................................................................... 11-1 11.1.2 Sample Preparation ................................................................................................ 11-1 11.1.3 Sample Analysis ..................................................................................................... 11-1
12. Data Verification (Item 16) ................................................................................... 12-1
12.1 Blanks ...................................................................................................................... 12-1 12.2 Standards ................................................................................................................ 12-2 12.3 Laboratory Repeats ................................................................................................. 12-3 12.4 Assay Repeats ........................................................................................................ 12-4 12.5 Conclusion ............................................................................................................... 12-4
13. Adjacent Properties (Item 17) .............................................................................. 13-1
13.1 Statement ................................................................................................................ 13-1
14. Mineral Processing and Metallurgical Testing (Item 18) ................................... 14-1
14.1 Mineral Processing Facility ...................................................................................... 14-1 14.1.1 Introduction ............................................................................................................. 14-1 14.1.2 Process Plant Background ..................................................................................... 14-1 14.1.3 Facility Description .................................................................................................. 14-1 14.1.4 Operating Background ............................................................................................ 14-1 14.1.5 Recoveries .............................................................................................................. 14-1 14.1.6 Risk to Throughput and Recovery .......................................................................... 14-1 14.1.7 Crushing and Screening Circuit .............................................................................. 14-2 14.1.8 Milling Circuit .......................................................................................................... 14-2 14.1.9 Flotation Circuit ....................................................................................................... 14-2 14.1.10 Leaching Circuit ...................................................................................................... 14-2

SRK Consulting │ PLI003 Costerfield - Mandalay Resources NI 43-101 Technical Report 14 May 2010
SRK Consulting (Australasia) Pty Ltd RALE/SOMM/DUPL/DUTO/MULL/wulf PLI003_Costerfield_Augusta_RR_Audit_NI 43-101_Technical_Report_Rev3 │iii
14.1.11 Metal Accounting .................................................................................................... 14-2 14.2 Status of Processing Facility ................................................................................... 14-2 14.3 Historical Plant Performance ................................................................................... 14-3 14.4 Forecast Plant Performance .................................................................................... 14-5
14.4.1 Metallurgical Performance ...................................................................................... 14-5 14.4.2 Processing Costs .................................................................................................... 14-8
14.5 Metallurgical Testing .............................................................................................. 14-10 14.6 Processing Risks ................................................................................................... 14-11 14.7 Mechanical and Civil Review ................................................................................. 14-11
14.7.1 Mechanical ............................................................................................................ 14-11 14.7.2 Structural and Civil ................................................................................................ 14-12
14.8 Tailings Storage ..................................................................................................... 14-12 14.9 Data Sources ......................................................................................................... 14-12
15. Mineral Resources and Mineral Reserve Estimates (Item 19) .......................... 15-1
15.1 Resource Estimation ............................................................................................... 15-1 15.1.1 Summary ................................................................................................................ 15-1 15.1.2 Database ................................................................................................................ 15-4 15.1.3 Compositing ............................................................................................................ 15-5 15.1.4 Specific Gravity ....................................................................................................... 15-6 15.1.5 Variogram Analysis and Modelling ......................................................................... 15-7 15.1.6 Grade Estimation .................................................................................................... 15-9 15.1.7 Resource Classification ........................................................................................ 15-10
15.2 Reserve Estimation ............................................................................................... 15-10 15.2.1 Conversion of Mineral Resources to Mineral Reserves ....................................... 15-10 15.2.2 Mineral Resources ................................................................................................ 15-12 15.2.3 Planned Dilution .................................................................................................... 15-12 15.2.4 Unplanned Dilution ............................................................................................... 15-13 15.2.5 Ore Loss ............................................................................................................... 15-13 15.2.6 Mineral Reserve Estimate .................................................................................... 15-14
16. Other Relevant Data and Information (Item 20) ................................................. 16-1
17. Additional Requirements for Development Properties and Production (Item 25)................................................................................................................. 17-1
17.1 Mining Operations ................................................................................................... 17-1 17.1.1 Geotechnical Considerations .................................................................................. 17-1 17.1.2 Geotechnical Characterisation ............................................................................... 17-1 17.1.3 Structural Geology .................................................................................................. 17-2 17.1.4 Stope Design Parameters ...................................................................................... 17-2 17.1.5 Ground Conditions and Ground Support ................................................................ 17-3 17.1.6 Mine Development .................................................................................................. 17-3 17.1.7 Decline Development .............................................................................................. 17-4 17.1.8 Level Development ................................................................................................. 17-4 17.1.9 Production ............................................................................................................... 17-4
17.2 Services ................................................................................................................... 17-6 17.2.1 Ventilation ............................................................................................................... 17-6 17.2.2 Ventilation Requirements ....................................................................................... 17-7 17.2.3 Ventsim Modelling .................................................................................................. 17-7 17.2.4 Pumping ................................................................................................................ 17-10 17.2.5 Power .................................................................................................................... 17-12 17.2.6 Ancillary Equipment .............................................................................................. 17-14
17.3 Mining Method ....................................................................................................... 17-14 17.3.1 Cut & Fill ............................................................................................................... 17-14 17.3.2 Cut & Fill Parameters ............................................................................................ 17-15 17.3.3 Uphole Airleg Stoping ........................................................................................... 17-15 17.3.4 Mining Method Description and Design Criteria ................................................... 17-15 17.3.5 Blasthole Stoping .................................................................................................. 17-17

SRK Consulting │ PLI003 Costerfield - Mandalay Resources NI 43-101 Technical Report 14 May 2010
SRK Consulting (Australasia) Pty Ltd RALE/SOMM/DUPL/DUTO/MULL/wulf PLI003_Costerfield_Augusta_RR_Audit_NI 43-101_Technical_Report_Rev3 │iv
17.3.6 Mining Recovery ................................................................................................... 17-18 17.4 Processing ............................................................................................................. 17-19
17.4.1 Metallurgical Performance and Recoverability ..................................................... 17-19 17.5 Markets .................................................................................................................. 17-21 17.6 Contracts ............................................................................................................... 17-21 17.7 Environmental Considerations ............................................................................... 17-21
17.7.1 Remediation .......................................................................................................... 17-21 17.7.2 Closure Plan ......................................................................................................... 17-25 17.7.3 Conceptual Hydrogeological Model ...................................................................... 17-25
17.8 Impact on the Receiving Environment ................................................................... 17-25 17.8.1 Dewatering ............................................................................................................ 17-25 17.8.2 Water Disposal ..................................................................................................... 17-25 17.8.3 Groundwater ......................................................................................................... 17-25 17.8.4 Water Quality ........................................................................................................ 17-26 17.8.5 Dust – Air Quality .................................................................................................. 17-26 17.8.6 Noise ..................................................................................................................... 17-26
17.9 Royalties and Taxes .............................................................................................. 17-26 17.9.1 Royalties ............................................................................................................... 17-26 17.9.2 Taxes .................................................................................................................... 17-27
17.10 Capital Costs ......................................................................................................... 17-27 17.10.1 Capital Development ............................................................................................ 17-27 17.10.2 On Going Capital .................................................................................................. 17-27
17.11 Operating Costs ..................................................................................................... 17-27 17.11.1 Manning ................................................................................................................ 17-28 17.11.2 Equipment ............................................................................................................. 17-28
17.12 Economic Analysis ................................................................................................ 17-28 17.12.1 LOM Plan and Economics .................................................................................... 17-28 17.12.2 Sensitivity .............................................................................................................. 17-28 17.12.3 Mine Life ............................................................................................................... 17-31
18. Interpretation and Conclusions (Item 21) ........................................................... 18-1
18.1 Geological ................................................................................................................ 18-1 18.1.1 Field Surveys .......................................................................................................... 18-1 18.1.2 Analytical and Testing Data .................................................................................... 18-1 18.1.3 Mineral Resources .................................................................................................. 18-1
18.2 Geotechnical ............................................................................................................ 18-1 18.3 Environmental .......................................................................................................... 18-1 18.4 Mining ...................................................................................................................... 18-2 18.5 Process .................................................................................................................... 18-2 18.6 Other Relevant Information ..................................................................................... 18-2
19. Recommendations (Item 22) ................................................................................ 19-1
19.1 Geological ................................................................................................................ 19-1 19.2 Geotechnical ............................................................................................................ 19-1 19.3 Environmental .......................................................................................................... 19-1 19.4 Mining ...................................................................................................................... 19-2 19.5 Processing ............................................................................................................... 19-2
20. References (Item 23) ............................................................................................ 20-1
21. Glossary ................................................................................................................ 21-1
21.1 Mineral Resources and Reserves ........................................................................... 21-1 21.1.1 Mineral Resources .................................................................................................. 21-1 21.1.2 Mineral Reserves .................................................................................................... 21-1
21.2 Glossary .................................................................................................................. 21-2

SRK Consulting │ PLI003 Costerfield - Mandalay Resources NI 43-101 Technical Report 14 May 2010
SRK Consulting (Australasia) Pty Ltd RALE/SOMM/DUPL/DUTO/MULL/wulf PLI003_Costerfield_Augusta_RR_Audit_NI 43-101_Technical_Report_Rev3 │v
List of Tables
Table 2-1: Tenement details .................................................................................................... 2-1 Table 2-2: Costerfield mine grid (from Fredericksen, 2009) .................................................... 2-4 Table 2-3: Summary of relevant Work Plans and Work Plan Variations .................................. 2-5 Table 2-4: Summary of planning permits from the City of Greater Bendigo ............................ 2-6 Table 4-1: Mineral Resource Estimate (W, E, C & N lodes) as at 31 March 2009 ................... 4-1 Table 4-2: Quarterly Historical Production from Augusta Mine ................................................ 4-2 Table 4-3: Augusta Mine production with Mandalay Involvement ............................................ 4-2 Table 9-1: Drilling history at Costerfield ................................................................................... 9-1 Table 14-1: Historical plant performance data ......................................................................... 14-3 Table 14-2: Planned versus actual feed tonnes ....................................................................... 14-6 Table 14-3: Planned versus actual antimony grade and recovery ........................................... 14-7 Table 14-4: Planned versus actual gold grade and recovery ................................................... 14-7 Table 14-5: March 2010 processing budget ............................................................................ 14-9 Table 14-6: Key reagent consumption rates .......................................................................... 14-10 Table 15-1: Diluted Mineral Resources for Augusta (W, E, C & N lodes) as at 31 March
2009 ...................................................................................................................... 15-2 Table 15-2: Estimated Costerfield Resources as at 1-Mar 2010 including Brunswick Vein
as estimated by AMC Consultants ........................................................................ 15-3 Table 15-3: Reconciled mine production vs mill production for ore derived from Augusta
Mine ...................................................................................................................... 15-4 Table 15-4: Composite statistics for E Lode – Face Composites (domain 10) ........................ 15-5 Table 15-5: Composite statistics for E Lode – Face Composites (domain 11 and 12) ............ 15-5 Table 15-6 Composite statistics for W Lode – Face Composites ........................................... 15-5 Table 15-7: Composite statistics for E Lode – Drill Hole Composites ...................................... 15-6 Table 15-8: Composite statistics for W Lode – Drill Hole Composites ..................................... 15-6 Table 15-9: Variogram models drill hole composites ............................................................... 15-8 Table 15-10: Variogram models face sample composites ......................................................... 15-8 Table 15-11: Dip and strike correction factors ........................................................................ 15-10 Table 15-12: Breakdown of NRPT 1 ....................................................................................... 15-11 Table 15-13: Summary of Transition including Dilution and Ore Loss ..................................... 15-14 Table 15-14: Summary of Mineral Reserve as at 1 March 2010 ............................................. 15-15 Table 17-1: Current equipment and ventilation requirements at 0.05m3/s/kW ......................... 17-7 Table 17-2: Ventilation modelling - Ventsim criteria ................................................................. 17-8 Table 17-3: Surface 415V substation loading ........................................................................ 17-14 Table 17-4: Underground 1000V substation loading ............................................................. 17-14 Table 17-5: Recent history of Unplanned Dilution ................................................................. 17-15 Table 17-6: Planned versus actual plant feed tonnes ............................................................ 17-19 Table 17-7: Planned versus actual antimony grade and recovery ......................................... 17-20 Table 17-8: Planned versus actual gold grade and recovery ................................................. 17-20 Table 17-9: Mining operating cost breakdown ....................................................................... 17-27 Table 17-10: LOM economic results ........................................................................................ 17-28 Table 21-1: Glossary ................................................................................................................ 21-2 Table 21-2: Abbreviations ........................................................................................................ 21-3

SRK Consulting │ PLI003 Costerfield - Mandalay Resources NI 43-101 Technical Report 14 May 2010
SRK Consulting (Australasia) Pty Ltd RALE/SOMM/DUPL/DUTO/MULL/wulf PLI003_Costerfield_Augusta_RR_Audit_NI 43-101_Technical_Report_Rev3 │vi
List of Figures
Figure 2-1: Mine site location .................................................................................................... 2-1 Figure 2-2: Plan of area of ML 4644 from DPI, Victorian State Government ............................ 2-2 Figure 2-3: Plan detailing reduction in EL3310 ......................................................................... 2-3 Figure 2-4: Relationship between mine grids (from Fredericksen, 2009).................................. 2-4 Figure 3-1: Monthly average temperature and rainfall .............................................................. 3-2 Figure 4-1: Historical production from Augusta Mine ................................................................ 4-2 Figure 5-1: Regional geology .................................................................................................... 5-2 Figure 5-2: Local geology .......................................................................................................... 5-3 Figure 5-3: Costerfield lode systems ......................................................................................... 5-4 Figure 5-4: Schematic cross section through the Augusta deposit ........................................... 5-5 Figure 6-1: E Lode 1070 Level South ....................................................................................... 6-1 Figure 6-2: Mineralisation in E Lode 1070 Level South ............................................................ 6-2 Figure 7-1: Stibnite mineralisation as stibnite matrix supported quartz breccia ........................ 7-1 Figure 8-1: Exploration target area for W Lode. ........................................................................ 8-2 Figure 9-1: Drill hole locations in the Costerfield area .............................................................. 9-2 Figure 9-2: Drilling procedures used by AGD ........................................................................... 9-3 Figure 10-1: Location of drill samples and underground development ..................................... 10-1 Figure 10-2: Face sampling guide for Augusta Mine ................................................................ 10-3 Figure 12-1: Analysis of blanks ................................................................................................. 12-1 Figure 12-2: Analysis of Standard ADG07-01 ........................................................................... 12-2 Figure 12-3: Analysis of Standard G902-2 ................................................................................ 12-2 Figure 12-4: Analysis of Standard G902-8 ................................................................................ 12-3 Figure 12-5: Laboratory preparation duplicate .......................................................................... 12-3 Figure 12-6: Laboratory assay repeats ..................................................................................... 12-4 Figure 12-7: Inter-laboratory repeats ........................................................................................ 12-4 Figure 14-2: Recent antimony in tailings trend .......................................................................... 14-6 Figure 14-3: Recent gold tails trend .......................................................................................... 14-8 Figure 15-1: Density data compared to calculated value .......................................................... 15-7 Figure 15-2: CIM relationship between Mineral Resources and Mineral Reserves ................ 15-11 Figure 15-3: Planned and Unplanned Dilution ........................................................................ 15-13 Figure 17-1: Augusta rockmass classification ........................................................................... 17-2 Figure 17-2: Typical ground conditions and ground support in ore drives ................................ 17-3 Figure 17-3: Long section showing all stopes and development .............................................. 17-4 Figure 17-4: Isometric view of stoping and development on the East and West lodes ............. 17-5 Figure 17-5: Long section of W lode stopes .............................................................................. 17-5 Figure 17-6: Long section of E lode stopes ............................................................................... 17-6 Figure 17-7: Isometric view of Cut & Fill in the virgin area of Augusta ...................................... 17-6 Figure 17-8: Plan view of current ventilation system ................................................................. 17-8 Figure 17-9: Long section of current ventilation system ............................................................ 17-9 Figure 17-10: Long section view of future ventilation system ..................................................... 17-9 Figure 17-11: Site water schematic ........................................................................................... 17-10 Figure 17-12: Schematic of current dewatering system ............................................................ 17-11 Figure 17-13: Schematic of the LOM dewatering system ......................................................... 17-12 Figure 17-14: LOM plan for the power reticulation system ....................................................... 17-13 Figure 17-15: Long section of the uphole airleg stoping layout ................................................. 17-16 Figure 17-16: Cross section of orebody intersecting development ........................................... 17-18 Figure 17-17: Surface plan of plant site showing tailings dam facilities .................................... 17-23 Figure 17-18: Surface plan of the mine site, waste dump and evaporation dam ...................... 17-24 Figure 17-19: Project sensitivity to gold price variation from USD1000/oz ............................... 17-28 Figure 17-20: Project sensitivity to antimony price variation from USD6000/t .......................... 17-29 Figure 17-21: Project sensitivity to exchange rate variation from the 1.0 AUD: 0.9USD Base
Case ................................................................................................................... 17-29

SRK Consulting │ PLI003 Costerfield - Mandalay Resources NI 43-101 Technical Report 14 May 2010
SRK Consulting (Australasia) Pty Ltd RALE/SOMM/DUPL/DUTO/MULL/wulf PLI003_Costerfield_Augusta_RR_Audit_NI 43-101_Technical_Report_Rev3 │vii
Figure 17-22: Project sensitivity to mine production rate variation ............................................ 17-30 Figure 17-23: Project sensitivity to mining cost variation .......................................................... 17-30 Figure 17-24: Sensitivity to increase in Au tail grade ................................................................ 17-31
List of Appendices
Appendix A: Certificates of Authors

SRK Consulting │ PLI003 Costerfield - Mandalay Resources NI 43-101 Technical Report 14 May 2010
SRK Consulting (Australasia) Pty Ltd RALE/SOMM/DUPL/DUTO/MULL/wulf PLI003_Costerfield_Augusta_RR_Audit_NI 43-101_Technical_Report_Rev3 │viii
Summary (Item 3)
Report Purpose
The purpose of the report is to ensure that the resultant ore resources and reserves of the Costerfield Augusta Mine (Augusta) have been verified and are reported to the standard required by the National Instrument (NI) 43-101 of the Canadian Securities Administrators.
Property Location and Ownership
The Augusta mine site is located at Costerfield, approximately 10 km northeast of Heathcote, 50 km east of Bendigo and 100 km north of Melbourne, the state capital of Victoria, Australia. The mine is located at a latitude of 36
0 52‟ 27” S and a longitude of 144
0 47‟ 38” E.
Primary approval for mine operation is held with the Mining License MIN 4644 issued by the Victorian State Government which was renewed in June 2008 for a further two years and so is due for renewal by 30 June 2010. The tenement details are presented in Table 2-1.
AGD Operations Pty Ltd, a wholly owned subsidiary of Mandalay Resources Corporation (Mandalay), holds the mining and exploration licences.
History of Costerfield and Discovery of Augusta
The Costerfield area has had a large number of different mining operators since 1860, mining for both gold and antimony. The most extensive operations existed in the periods 1860 to 1883 and 1904 to 1925. Between 1934 and 1980, there was ongoing exploration and intermittent small-scale production by several companies, including a period managed by the Victorian Mines Department.
With more extensive exploration of the Costerfield deposits, a processing plant was constructed in 1995 to re-treat the old tailings plus the oxide material which was mined from the Brunswick open pit.
Following continued exploration and resource definition drilling, the Augusta deposit was discovered and, following a successful feasibility study, the development of an underground mine was commenced in 2006.
Geology and Mineralisation
The Augusta gold and antimony deposit is located on the western edge of the Melbourne Trough in the Lachlan Geosyncline. Gold and antimony mineralisation occurs in thin lode veins. The veins are hosted within a broader, strongly foliated shear system and are composed of laminated to brecciated quartz and massive sulphide mineralisation containing stibnite and gold.
Exploration
The Costerfield Au/Sb field was discovered during the 1860s and has a long exploration history. Recent exploration by AGD has been by surface drilling and has been focused on the Augusta mine area.
Resources and Reserves
Mineral Resources for the E and W lodes in the Measured and Indicated category (the lodes currently in production) were developed in 2009. Mineral Resources estimates were also prepared in 2009 for the C and N lodes. The Measured and Indicated Resources for the E and W lodes as at 31 March 2009 are 224,200 tonnes (t) ore @ 11.8 g/t Au and 6.4% Sb. Accounting for the extraction of ore between 1 April 2009 and 28 February 2010 it is estimated that the Measured and Indicated Resource as at 1 March 2010 is 218,500 t @ 11.8 g/t Au and 6.4% Sb.
SRK Consulting │ PLI003 Costerfield - Mandalay Resources NI 43-101 Technical Report 14 May 2010
SRK Consulting (Australasia) Pty Ltd RALE/SOMM/DUPL/DUTO/MULL/wulf PLI003_Costerfield_Augusta_RR_Audit_NI 43-101_Technical_Report_Rev3 │ix
Mineral Resources have been estimated using the two-dimensional approach which is considered appropriate, given the very thin nature of the deposit and that there is little possibility of mining selectivity in the across-dip direction. Grades have been estimated using ordinary kriging. Diamond drill holes and mine face data have been used in the grade estimations.
Mineral Resources have been reported using a 4.6 g/t Au Equivalence at a minimum mining thickness of 1.2 m. Measured Resources are restricted to those parts of the mine in which underground development has occurred due to the variable nature of the grade and thickness.
The development of the Mineral Reserves initially required the creation of mining shapes in the Mine 2-4D computer program. Following the application of dilution and mining recovery factors, and with some risk associated with the Environmental Modifying Factor, the Mineral Reserve for this short life operation which has significant potential, is considered to be 65,576 t of ore at 13.1 g/t gold and 7.0% antimony.
SRK understands that there are ongoing discussions with the relevant authorities, particularly the environmental related authorities, to resolve the outstanding issues.
Production
Production was commenced at the Augusta Mine in 2006.
With the previous Mineral Resource statement as at 31 March 2009 production from the mine, as reported by AGD Operations, has been 21.3 kt @ 7.1 g/t Au and 4.3% Sb from 1 April 2009 to 28 February 2010. All production was from the Measured and Indicated Resources for E and W lodes.
The underground mine has decline access via 4 m wide and 4 m high development mined at a gradient of 1 in 8 (12.5%). This decline development has been mined to approximately 1070 m RL or 100 m below surface. There is horizontal access to the E and W lodes of the orebody, at approximately 8 m level intervals. The orebody width is variable – up to 1.2 m and the dip of the orebody of 690.
Access to the lower levels of the orebody is being achieved by extending the decline to the lower horizons to enable orebody confirmation with diamond drilling and orebody development.
The ore in the upper levels of the mine has been extracted by long hole stoping. The stope height, and orebody inconsistency on the hanging wall, has resulted in increased dilution from hanging wall fall off. In addition, there was a safety hazard with entry to these stoping areas.
With deteriorating ground conditions, the extraction method has been changed to cut and fill mining to improve the mining recovery and reduce dilution. This method, apart from improving the recovery by reducing ore loss and increasing the head grade by lowering dilution, also improves the consistency of production by decreasing the unpredictability of the hanging wall conditions with lower cut heights. It also allows the level interval to be increased to 20 m.
With the application of this improved production plan, the required 4,000 t of ore per month at the necessary gold and antimony grade is likely to be achieved.
The processing facility comprises a two-stage crushing process, two milling stages in series, with classification and gravity concentration in closed circuit, rougher, scavenger and cleaner flotation for the production of gravity gold and an antimony and gold concentrate.
Because the processing facilities are located near residences noise restrictions currently confine plant operation to 5.5 days per week.

SRK Consulting │ PLI003 Costerfield - Mandalay Resources NI 43-101 Technical Report 14 May 2010
SRK Consulting (Australasia) Pty Ltd RALE/SOMM/DUPL/DUTO/MULL/wulf PLI003_Costerfield_Augusta_RR_Audit_NI 43-101_Technical_Report_Rev3 │x
Capital and Operating Costs
The capital costs applied to this assessment are those required to maintain the operation during the period of extraction of the current mineral reserves – from March 2010 and November 2011. This totals AUD1.984M or AUD30.27/t which covers the mine capital development and the minor capital expenditure for the necessary replacement of some items during this period.
The operating costs covered in this evaluation are made up of those incurred by the mine, the mill and the administration areas. This totals AUD15.527M or AUD236.79/t.
Economic Analysis and Sensitivity
With the short life of the Mineral Reserves, the economic analysis was limited to the assessment of revenue, costs, EBITDA, Pre Tax Profit and Cash Surplus.
Mining Plus consultants determined that the total revenue that would be realised over the production period of these ore reserves would be AUD38.2M. The total costs of the operation over this short mine life would be AUD25.3M, resulting in an EBITDA of AUD12.9M. The Pre Tax Profit was AUD8.8M and the Cash Surplus was AUD8.5M. This cash surplus will in part be used to cover the AUD1.1M Exploration program that Mandalay has approved, in a concerted attempt to lengthen the mine life.
Sensitivities of these results to metal prices, exchange rate, production and cost variations of +20% to -20% are presented.
There is the greatest sensitivity in Pre Tax Profit and Cash Flow to variations in gold price, exchange rate and production rate.
Conclusions and Recommendations
Conclusions
The major conclusions include those from the geological area that appropriate methods of data gathering and analysis are being applied and that resource estimates are made using both diamond drill and face sample data.
In the geotechnical area, it was concluded that increased confidence would result from a well-managed geotechnical database.
From the environmental point of view, it was concluded that there is risk associated with compliance in the areas of waste dump management, the management and containment of the mine and process water plus water sampling and noise level readings.
The major conclusions in the mining operation area include the fact that the change to cut and fill mining is progressively improving the operating results, the critical mining risk assessments are carried out with diligence and there is no spare capacity in the technical services area.
On the understanding that there is risk associated with the Environmental Modifying Factor, a Mineral Reserve has been established on the Measured and Indicated Resource. This totals 65,576 t at 13.1 g/t gold and 7.0% antimony.
It was concluded that the process plant conditions are improving, the projected plant throughput and costs are in line with historical results and the projected plant recoveries are achievable. However, there is sensitivity to a possible increase in the gold tail grade.

SRK Consulting │ PLI003 Costerfield - Mandalay Resources NI 43-101 Technical Report 14 May 2010
SRK Consulting (Australasia) Pty Ltd RALE/SOMM/DUPL/DUTO/MULL/wulf PLI003_Costerfield_Augusta_RR_Audit_NI 43-101_Technical_Report_Rev3 │xi
Recommendations
The major recommendations in the geological area include the recommendation that, following the planned exploration drilling program, a new Mineral Resource be developed.
In the geotechnical area, the recommendations include the development of a geotechnical database, additional geotechnical drilling is required and a formal risk assessment on the likelihood of ground failures resulting from water accumulation.
Environmental recommendations include the rectification of non-compliance issues, the updating of the groundwater abstraction license, the assessment of the use of mine water for dust suppression, development of a hydrogeological model, compilation of an approved Environmental Management Program, a review of current monitoring methods and the collation of all environmental information.
Recommendations in the mining area include that the current risk assessment process should be continued; that the mine should expedite the conversion to cut and fill mining with the appropriate equipment to achieve optimal results, and that the establishment and maintenance of the appropriate technical staff so as to continually achieve the required operating results and the maintenance of an appropriate operator training program, should be ensured. Recommendations in the process area include the maintenance of the antimony tail grade and management of any increase of the gold tail grade, until the proposed online analysis system is installed and commissioned. Additional recommendations include the increase to the maintenance budget until steady state operation is realised and better actual operating data is available and the establishment of a metallurgical test program for ore from each new mining area.

SRK Consulting │ PLI003 Costerfield - Mandalay Resources NI 43-101 Technical Report 14 May 2010
SRK Consulting (Australasia) Pty Ltd RALE/SOMM/DUPL/DUTO/MULL/wulf PLI003_Costerfield_Augusta_RR_Audit_NI 43-101_Technical_Report_Rev3 │1-1
1. Introduction (Item 4)
1.1 Terms of Reference and Purpose of the Report
1.1.1 Terms of Reference
The Augusta Underground Mine at Costerfield, Victoria, Australia is 100% owned by AGD Operations Pty Ltd, which itself became a 100% owned subsidiary of Mandalay Resources Corporation (Mandalay), beginning 1 December 2009. A review of the mine was carried out in September 2009 by SRK Consulting (Australasia) Ltd (SRK) at the request of Plinian Capital (Plinian), which at the time, was considering investing in Mandalay. Based in part on that review, Plinian completed its investment and provided key managers for Mandalay. Following on from this review, SRK were requested by Plinian to carry out an audit of the Mineral Resources and Mineral Reserves of the Augusta Mine and produce a National Instrument (NI) 43-101-compliant report.
1.1.2 Purpose of the Report
The purpose of the report is to ensure that the resultant resources and reserves of the Costerfield Mine, specifically of the Augusta lodes, have been verified and are reported to the standard required by the NI 43-101.
1.2 Reliance on Other Experts and Sources of Information (Item 5)
1.2.1 Reliance on other Experts
The preparation of this report has required the technical input from other experts.
In preparing the geological section of this report SRK has relied on other experts as listed below:
Mr Dean Fredericksen (MSc Hons) undertook the Mineral Resource estimate for E and W lodes at Augusta and assessment of data quality for the Augusta deposit.
Mr Rodney Webster (BAppSc) undertook the Mineral Resource estimate for C and N lodes at the Augusta deposit and the assessment of data quality and Mineral Resource estimate for Brunswick Deposit.
AGD personnel have been relied on for information pertaining to mining and exploration tenements.
Mr Dean Fredericksen, Mr Rodney Webster and AGD personnel have been relied on for the geological sections of this report – namely Sections 5, 6, 7, 8, 9, 10, 12 and 15.
In preparing the mining section of this report, SRK has relied on other experts, namely:
Mr Brad Evans (BEng, MAusIMM) of Mining Plus Consultants compiled the Augusta Life-of-Mine Plan (LOM).
In preparing the processing section of this report, SRK has relied on other experts as listed below:
Mr Brett Muller of Simulus Pty Consulting Metallurgical Engineers, has been relied on for Section 14 and Section 17-4.
1.2.2 Sources of Information
The report is compiled from information supplied by AGD, together with that obtained from site visits by each of the authors, which included trips to the underground operations and the surface facilities including the process plant, the tailings dams, the waste dump and the ancillary services.
In addition, this report has relied on information appearing in the Augusta LOM Plan of April 2010 that has been developed by Mining Plus Mining Consultants.

SRK Consulting │ PLI003 Costerfield - Mandalay Resources NI 43-101 Technical Report 14 May 2010
SRK Consulting (Australasia) Pty Ltd RALE/SOMM/DUPL/DUTO/MULL/wulf PLI003_Costerfield_Augusta_RR_Audit_NI 43-101_Technical_Report_Rev3 │1-2
1.3 Qualifications of Consultants
1.3.1 Qualification and Experience
Each of the authors of this report is a qualified person in their preferred field.
In the geological area, Bruce Sommerville [BSc Hons (Mining Geology), BAppSc (Geology), MAusIMM, MAusIG, MGSAus] is a Principal Consultant with more than 15 years‟ experience in geoscience and mine planning roles which includes 10 years in the areas of Mineral Resources and Ore Reserves in operating mines and projects. Bruce specialises in resource estimation and 3D modelling.
Covering the field of geotechnical engineering is Kobus du Plooy [BSc (Geology and Geochemistry), PrSciNat, MIEAus] who is a Senior Consultant and rock mechanics engineer with 15 years of operating and consulting experience. One area of Kobus‟ expertise, apart from operational review and assistance, is numerical modelling to assess geotechnical conditions, ground support and pillar design plus the design and interpretation of rock engineering strategies.
Adriaan du Toit [BSc (Geology and Hydrology), PrSciNat who is a Senior Consultant with 18 years of experience in environmental hydrogeology covered the important hydrogeological area of the report. He brings his wide knowledge and international experience together to evaluate the impact of new or existing projects on the environment and to find practical, cost effective solutions.
The process plant review has been carried out by Brett Muller [BEng (Minerals Engineering and Extractive Metallurgy), BCom (Finance)], of Simulus Engineers who has a broad range of experience covering plant operations and commissioning, troubleshooting, detailed design, project management and metallurgical testwork management.
The mining engineering and project management aspects of this report has been carried out by Chris Raleigh [BSc (Mining Engineering), FAusIMM (CP), RPEQ], a Principal Consultant with more than 35 years of mining experience in many different areas of the industry, including gold, base metals and industrial minerals, in the operating, projects and planning areas, in large and small underground and open pit operations, in Australia and overseas.
The peer review of this report has been carried out by John Blackburn [BE (Mining), MBA, MAusIMM] a Principal Consultant who has more than 35 years of experience working in underground and open pit mines with mining companies, consultants and suppliers, and who has underground operating experience including open stoping, cut and fill stoping and slot stoping. John‟s specialist areas include production planning and scheduling, mine planning and scheduling, mine costing and due diligence.
1.3.2 Site Visit
To ensure that this report is based on a complete set of data and information, the relevant consultant visited the operation during the months of January, February and March 2010 to review each area of activity at the operation.
1.4 Effective Date
The effective date of this report is 1 March 2010.

SRK Consulting │ PLI003 Costerfield - Mandalay Resources NI 43-101 Technical Report 14 May 2010
SRK Consulting (Australasia) Pty Ltd RALE/SOMM/DUPL/DUTO/MULL/wulf PLI003_Costerfield_Augusta_RR_Audit_NI 43-101_Technical_Report_Rev3 │1-3
1.5 Units of Measure
Symbol Meaning
Φ diameter
g/t grams per metric tonne
k thousand
kg kilogram
kl kilolitre
m metre
M million
m3 cubic metre
ML megalitre – 1000 litres
Mt million tonnes
Mtpa million tonnes per annum
Oz Troy ounce or 31.1035 grams
t tonne

SRK Consulting │ PLI003 Costerfield - Mandalay Resources NI 43-101 Technical Report 14 May 2010
SRK Consulting (Australasia) Pty Ltd RALE/SOMM/DUPL/DUTO/MULL/wulf PLI003_Costerfield_Augusta_RR_Audit_NI 43-101_Technical_Report_Rev3 │2-1
2. Property Description and Location (Item 6)
2.1 Property Location
The Augusta mine site is located at Costerfield, approximately 10 km northeast of Heathcote, 50 km east of Bendigo and 100 km north of Melbourne, the state capital of Victoria, Australia.
The mine is located at a latitude of 360 52‟ 27” S and a longitude of 144
0 47‟ 38” E. The location and
access roads are detailed in Figure 2-1.
Figure 2-1: Mine site location
The Brunswick Processing Plant, which comprises a 75,000 tpa antimony and gold gravity-flotation-CIP circuit is also adjacent to the main access road. Two tailings dams are positioned in close proximity to the processing plant with the construction of a third tailings dam having just been completed.
2.2 Tenements
AGD Operations holds the Mining License MIN4644 issued by the Victorian State Government under the Mineral Resources (Sustainable Development) Act 1990. This license is renewable and currently valid until 30 June 2010. This license covers the current and future planned mining activity.
The tenement details, including the Exploration Licenses EL 3310 & EL 4848, are shown in Table 2-1.
Table 2-1: Tenement details
Number and type (Name) Licensee Location Area Expiry date
MIN 4644 (Costerfield) AGD Operations P/L Costerfield 1219.3 ha 30/06/2010
EL 3310 (Costerfield) AGD Operations P/L Costerfield 59.0 GRATS 17/09/2011
EL 4848 (Antimony Creek) AGD Operations P/L SW Costerfield 18.0 GRATS 27/01/2012
The Plans of Area of the Mining License No. 4644, and the recent reduction in Exploration License EL 3310, issued by the Department of Primary Industries (DPI) of the State Government of Victoria, are shown in Figure 2-2 and Figure 2-3.

SRK Consulting │ PLI003 Costerfield - Mandalay Resources NI 43-101 Technical Report 14 May 2010
SRK Consulting (Australasia) Pty Ltd RALE/SOMM/DUPL/DUTO/MULL/wulf PLI003_Costerfield_Augusta_RR_Audit_NI 43-101_Technical_Report_Rev3 │2-2
Figure 2-2: Plan of area of ML 4644 from DPI, Victorian State Government

SRK Consulting │ PLI003 Costerfield - Mandalay Resources NI 43-101 Technical Report 14 May 2010
SRK Consulting (Australasia) Pty Ltd RALE/SOMM/DUPL/DUTO/MULL/wulf PLI003_Costerfield_Augusta_RR_Audit_NI 43-101_Technical_Report_Rev3 │2-3
Figure 2-3:Plan detailing reduction in EL3310

SRK Consulting │ PLI003 Costerfield - Mandalay Resources NI 43-101 Technical Report 14 May 2010
SRK Consulting (Australasia) Pty Ltd RALE/SOMM/DUPL/DUTO/MULL/wulf PLI003_Costerfield_Augusta_RR_Audit_NI 43-101_Technical_Report_Rev3 │2-4
2.3 Survey Grid Location
The survey grid for the Costerfield Project has been established with the Costerfield Grid North set at 19°west of MGA 94 (Map Grid Australia) North (29° west of Magnetic North).
All mining survey information, including that for diamond drill hole data, is stored in Costerfield Mine Grid co-ordinates.
The details of the grid conversion, between the MGA 94 and the Costerfield Mine Grid (CMG) are detailed in Table 2-2 and Figure 2-4.
Table 2-2: Costerfield mine grid (from Fredericksen, 2009)
Figure 2-4: Relationship between mine grids (from Fredericksen, 2009)

SRK Consulting │ PLI003 Costerfield - Mandalay Resources NI 43-101 Technical Report 14 May 2010
SRK Consulting (Australasia) Pty Ltd RALE/SOMM/DUPL/DUTO/MULL/wulf PLI003_Costerfield_Augusta_RR_Audit_NI 43-101_Technical_Report_Rev3 │2-5
2.4 Royalties and Taxes
2.4.1 Royalties
Royalties apply to the production of antimony. This royalty is applied at 2.75% of the revenue realized from the sale of antimony produced, less the selling costs.
For the life of the current proven and probable reserves, the total antimony revenue is AUD15,169,671; the total selling costs are AUD863,438 and the royalty payable is AUD393,421. No royalty on gold production exits.
There is no Royalty payable on gold production.
2.4.2 Taxes
Mandalay reports that there are approximately AUD40M in tax loss carry forwards for AGD that will effectively eliminate any income tax being paid in the short life of the current Mineral Reserves.
Income Tax on Australian company profits is set at 30%. The Australian Federal Government has now announced changes to the taxation rates for companies, which will decrease the tax rate to 28% in future years, as well as impose an additional resources-based tax on profits that exceed 6%. These tax changes are yet to be imposed.
2.5 Environmental Liabilities and Permitting
2.5.1 Required Permits and Status
A summary of Work plans and Variations, plus Planning Permissions associated with mining and processing activities are given in Table 2-3 and Table 2-4.
Work Plans issued under the mining licenses:
There are an extensive number of Work Plans issued between 1994 under MIN4073 up to the latest mining license MIN4644 (Work Plan Variations dated February 2005, October 2005, November 2005, February 2006 & October 2006).
Table 2-3: Summary of relevant Work Plans and Work Plan Variations
DPI Work Plans & Variations
Date Registered Description
Work Plan 16/02/1994 Treatment of Tailings
Work Plan Variation 20/01/1995 Treatment of Tailings
Work Plan Variation 1/06/1995 Construction of Brunswick Tailings Dam
Work Plan Variation 22/08/1995 Tailings Treatment and Brunswick Tailings Dam Construction
Work Plan Variation 20/06/1996 Tailings Treatment and Brunswick Tailings Dam Construction
Work Plan Variation 11/11/1997 Bombay Minerva Open Cut Mine
Work Plan Variation 26/10/2004 Underground Mining Augusta
Work Plan Variation 26/10/2004 Underground Mining Augusta
Work Plan Variation 8/11/2005 Open Cut Mining of Oxide Ore from the Augusta Deposit at Costerfield South
Work Plan Variation 8/02/2006 Upgrade / modification of processing plant
Work Plan Variation 30/10/2006 Change in environmental monitoring program

SRK Consulting │ PLI003 Costerfield - Mandalay Resources NI 43-101 Technical Report 14 May 2010
SRK Consulting (Australasia) Pty Ltd RALE/SOMM/DUPL/DUTO/MULL/wulf PLI003_Costerfield_Augusta_RR_Audit_NI 43-101_Technical_Report_Rev3 │2-6
Table 2-4: Summary of planning permits from the City of Greater Bendigo
Council Planning Permits
Date Issued Description
PP1777 5/12/1995 Gold and Antimony Recovery from Tails
PP1834 5/08/1996 Mining
PP1861 20/6/1996 Lot 2 Subdivision
PP1887 11/12/1996 Shed to house pilot plant for continued research on antimony / gold
PP2248 17/6/1997 Open Cut Mining and Gold Antimony Recovery
2248 (Amended) 7/11/1997 Open Cut Mining and Gold Antimony Recovery
DM/753/03 14/1/2004 Underground Mine
DM/253/2005 8/11/2005 Establishment and Operation of Open Pit Gold / Antimony Mine
A review of the Work Plans and the abovementioned Planning Permits indicates that numerous generic conditions are associated with these plans and permits
No significant liabilities relating to the above Works plans and Planning Permits were found.
Groundwater license:
The mine has in place a Section 51, 67 & 145 (Water Act, 1989) Groundwater License for the abstraction of 69 million litres per annum up to 30 June 2019 (License No. 8005313).
This abstraction entitlement is subject to numerous conditions, as per the Second Schedule of this license.
2.5.2 Compliance Evaluation – Groundwater License
Some inconsistencies between the groundwater license conditions and the current situation at the mine were found. The potential liability cost of this is unknown but non-compliance does increase the risk of the Department of Water temporarily or permanently revoking or cancelling this right, which will have a direct impact on mining operations.
The following identifies some issues requiring immediate attention:
1 The extraction volume entitlement is 69 ML/annum. According to mine records abstraction over the past 11 months has been 72.8 ML. This is reportedly due to exploration / dewatering drill holes not being tapped off at the completion of the drilling program. AGD report that these holes were tapped off during December and as a result, extraction volumes have dropped significantly. The legal authorised abstraction entitlement is measured from 1 July to 30 June each year. To comply with the remaining allocation of 13.4 ML for the 2009/10 year the extraction must be up to 3.35 ML/month. AGD believe that dewatering will be within the extraction license entitlement.
2 First Schedule Conditions: The authorisation of this right is for the extraction of groundwater from specific bores that have been numbered and identified. Each bore has an allowable extraction rate and volume. These conditions are not being complied with, as dewatering is taking place from the underground workings and not from the designated bores. AGD have advised that this issue is being addressed.
3 Second Schedule Conditions: There is non-compliance with the following conditions:
Condition 1.1 (a) – Take water except by the method approved by the Authority
Condition 4.3 (a) – Metering
Although meters are installed on the site, they are not measuring at the authorised abstraction points as listed under the First Schedule conditions. The recommendations (Section 19) of this report address the above three issues.

SRK Consulting │ PLI003 Costerfield - Mandalay Resources NI 43-101 Technical Report 14 May 2010
SRK Consulting (Australasia) Pty Ltd RALE/SOMM/DUPL/DUTO/MULL/wulf PLI003_Costerfield_Augusta_RR_Audit_NI 43-101_Technical_Report_Rev3 │3-1
3. Accessibility, Climate, Local Resources, Infrastructure and Physiography (Item 7)
3.1 Topography, Elevation and Vegetation
3.1.1 Topography
The topography of the Costerfield area includes some rugged hill country, undulating rises, gentle slopes and drainage depressions.
3.1.2 Elevation
The area has an average elevation of approximately 245 m ASL, with the range being from about 216 m ASL to about 268 m ASL.
3.1.3 Vegetation
The vegetation landscape varies from mixed species of open forest in the valleys and gentle slopes, with shrubby box gum on the stony gravelly hills and heath and grasses on the dry slopes and ridges. Much of the undulating land and alluvial flats have been cleared of vegetation for farming purposes.
3.2 Climate and Length of Operating Season
3.2.1 Climate
The local climate of the Costerfield district is „semi-arid‟ or „Mediterranean‟ in character so that, generally speaking, the winters are cool and wet whilst the summers are hot and dry. There is a high probability of violent electrical storms occurring in summer and these can often yield high intensity downpours.
Annual rainfall in the area is approximately 575 mm with most occurring between April and October. The temperature ranges from -2°C in winter (May to August) to +40°C in summer (November to February). Monthly average data from Redesdale (the nearest weather recording station to Costerfield, which is some 19 km south west of Heathcote) is shown in Figure 3-1.
3.2.2 Operating Season
With occasional heavy rainfall occurring between April and October the operating season for the operation is not unduly affected by climatic conditions. This results in the ability for the year round operation of the facilities with only short duration interruptions caused by the weather.

SRK Consulting │ PLI003 Costerfield - Mandalay Resources NI 43-101 Technical Report 14 May 2010
SRK Consulting (Australasia) Pty Ltd RALE/SOMM/DUPL/DUTO/MULL/wulf PLI003_Costerfield_Augusta_RR_Audit_NI 43-101_Technical_Report_Rev3 │3-2
Figure 3-1: Monthly average temperature and rainfall
3.3 Physiography
The project area is in the western catchment of the Lower Goulburn River. It is flat to undulating terrain ranging in elevation from 160 m ASL in the east, along the Wappentake Creek, to 288 m ASL in the northwest.
The area is a mixture of cleared grazing / cropping land and blocks of lightly timbered Box-Ironbark forest. The forested land is largely the rocky, rugged hill country administered by the Department of Sustainability and Environment as State Forest, while most of the undulating land and alluvial flats is privately held freehold land, which has been cleared for farming.
The Project Area adjoins the north west boundary of the Puckapunyal Military Area.
3.4 Access to Property
The Costerfield Project is accessed off the Heathcote-Nagambie Road at a distance of 11 km from the junction with the main McIvor / Northern Highway, at a distance of approximately 100 km north of Melbourne.
3.5 Local Resources and Infrastructure
3.5.1 Access Road and Transportation
The access road to the project, off the Heathcote-Nagamie Road is a narrow width bitumen strip with gravel shoulders, which are maintained in good condition. Private transport is utilised to move the mine personnel to and from the operation.
3.5.2 Power Supply
The Costerfield Project purchases electricity directly from the main national electricity grid and has connections at both the Brunswick plant site and the Augusta underground mine site.
AGD Operations purchases this power under contract from Tru Energy Australia. This three-year contract expires at the end of May 2011.
0
10
20
30
40
50
60
70
0
5
10
15
20
25
30
35
Jan Feb Mar Apr May Jun Jul Aug Sep Oct Nov Dec
Rai
nfa
ll (m
m)
Tem
pe
ratu
re (d
egr
ee
s C
)
Monthly Average Temperature and RainfallRedesdale weather station
Mean Rainfall Mean Maximum Temperature Mean Minimum Temperature

SRK Consulting │ PLI003 Costerfield - Mandalay Resources NI 43-101 Technical Report 14 May 2010
SRK Consulting (Australasia) Pty Ltd RALE/SOMM/DUPL/DUTO/MULL/wulf PLI003_Costerfield_Augusta_RR_Audit_NI 43-101_Technical_Report_Rev3 │3-3
Supply from the National Grid to AGD high voltage installations is in two locations:
1 Augusta mine, a 800 kW feed at a power factor of 0.8
2 Brunswick plant, a 758 kW feed at a power factor of 0.8
The power to the underground mine from the Augusta mine substation is supplied through a 42 m cased borehole for 415V feed, and via a step–up transformer and a 42 m cased borehole for the 1000V feed.
The power to the Brunswick plant supplies the gold and antimony processing plant, the administration building and the workshop.
3.5.3 Water Supply
The dewatering of the mine totals 206 kL/d. The underground and surface operations of the operation require 45 kL/d. The mine water is pumped from the underground mine to a 40 ML evaporation pond adjacent to the Augusta Mine facilities.
The water required by the process plant is sourced from a bore located adjacent to the plant, from standing water within the old Brunswick pit, recycled from the tailings dam, and also from the Augusta Mine dewatering system.
The project does not have a permit to discharge water from the site.
The site has a 69 ML water right for extraction from underground and from two surface bores. An application to increase this to 200 ML per annum has been submitted to the relevant authority.
The site water storage capacity is approximately 40 ML excluding the tailings storage facilities.
3.5.4 Buildings and Ancillary Facilities
Appropriate office and ablution facilities are located on the mine site as per the detail in Figure 17-18. The additional ancillary facilities include the workshop and store.
3.5.5 Camp Site
There is no camp site in the mining license area. All employees live in the surrounding towns with some travelling from Bendigo each day, a distance of some 100 km.
3.5.6 Tailings Storage Area
Tailings are now being deposited in the new Cell 2 of the Bombay Tailings Dam. The Bombay Cell #1, in which tailings from the current operation were deposited until Cell #2 was completed, is nearly full. Old tailings from the Brunswick Tailings Dam are currently being treated at the adjacent Processing Plant facility. The plan of the Tailings Dam area is shown in Figure 17-17.
3.5.7 Waste Rock Storage Area
It is understood that AGD has commenced negotiations with the authorities to increase the size of the waste (barren or low grade) rock storage area. Due to the status of the current facility, this is considered of utmost importance. The plan of the Waste Rock Storage Area is shown in Figure 17-18.
3.5.8 Manpower
The workforce for the mine operation is sourced from the surrounding area plus from as far afield as the large mining town of Bendigo.
There is adequate manpower available in the area for the foreseeable expansion plans.
The working roster is made up of three 8-hour shifts per day for five standard working days per week.

SRK Consulting │ PLI003 Costerfield - Mandalay Resources NI 43-101 Technical Report 14 May 2010
SRK Consulting (Australasia) Pty Ltd RALE/SOMM/DUPL/DUTO/MULL/wulf PLI003_Costerfield_Augusta_RR_Audit_NI 43-101_Technical_Report_Rev3 │3-4
The mining crew consists of shift boss supervision, maintenance fitters in the surface workshop, decline development miners and production operators. The capital development and production operators include jumbo operators, loader drivers, hand-held miners, microscoop operators and truck drivers. In addition, there are offsiders to assist the decline crew and nippers to assist and transport equipment for the production crews.
The planned management, administration, technical staff and supervisors total 10 in March 2010, while the mining and maintenance crews total 37. The mining crews reduce with the completion of the decline development in June 2010 and the other capital development being completed by January 2011. The mine operating workforce commences at 25, reducing progressively to 10 by November 2011.

SRK Consulting │ PLI003 Costerfield - Mandalay Resources NI 43-101 Technical Report 14 May 2010
SRK Consulting (Australasia) Pty Ltd RALE/SOMM/DUPL/DUTO/MULL/wulf PLI003_Costerfield_Augusta_RR_Audit_NI 43-101_Technical_Report_Rev3 │4-1
4. History (Item 8)
4.1 Ownership
The Costerfield Mine area has had a large number of different operators since 1860 when antimony was discovered by two prospectors – called Coster and Field. The company Gold Exploration and Finance Company of Australia (the forerunner of Western Mining Corporation) recommenced operation in 1934.
This was followed by South Costerfield Antimony & Gold Company in 1936, then the Victoria Antimony Mines, Mid East Minerals, Metals Investment Holdings, Forsayth Mineral Exploration, Costerfield Mining, the Victoria Mines Department between 1975 and 1981, and Federation Resources NL, who bought into the project in 1983.
The current operator is Australian Gold Development NL (AGD), which is a wholly owned subsidiary of Mandalay Resources Corporation.
4.2 Past Exploration and Development
The Augusta Deposit was discovered during the ownership of the Victorian Mines Department between 1975 and 1981.
4.3 Historic Mineral Resource and Reserve Estimates
A Mineral Resource Estimate was established for the Costerfield Project, for the W, E, C & N lodes, as at 31 March 2009. This is presented in Table 4-1.
Table 4-1: Mineral Resource Estimate (W, E, C & N lodes) as at 31 March 2009
Resource Category kt Au g/t Sb % Au oz Sb t Au Eq oz Au Eq g/t
Measured 72.9 16.1 9.6 37,700 7000 79,700 34.0
Indicated 151.4 9.6 4.8 46,700 7300 90,300 18.6
Measured & Indicated 224.2 11.7 6.4 84,400 14,300 170,000 23.6
Inferred 126.9 9.2 4.5 37,400 5,700 72,000 17.5
Source: Fredericksen (2009b)
With the ore extraction during the period April 2009 to February 2010, it is estimated that the Measured and Indicated Mineral Resource at 1 March 2010 was 218.5 kt @ 11.8 g/t Au and 6.4% Sb.
As this report considers the Augusta Veins only the Resource of the Brunswick Vein is not included. The Brunswick Vein is covered in a separate report by Rodney Webster of AMC Consultants.
No previous estimates of Mineral Reserves have been published.
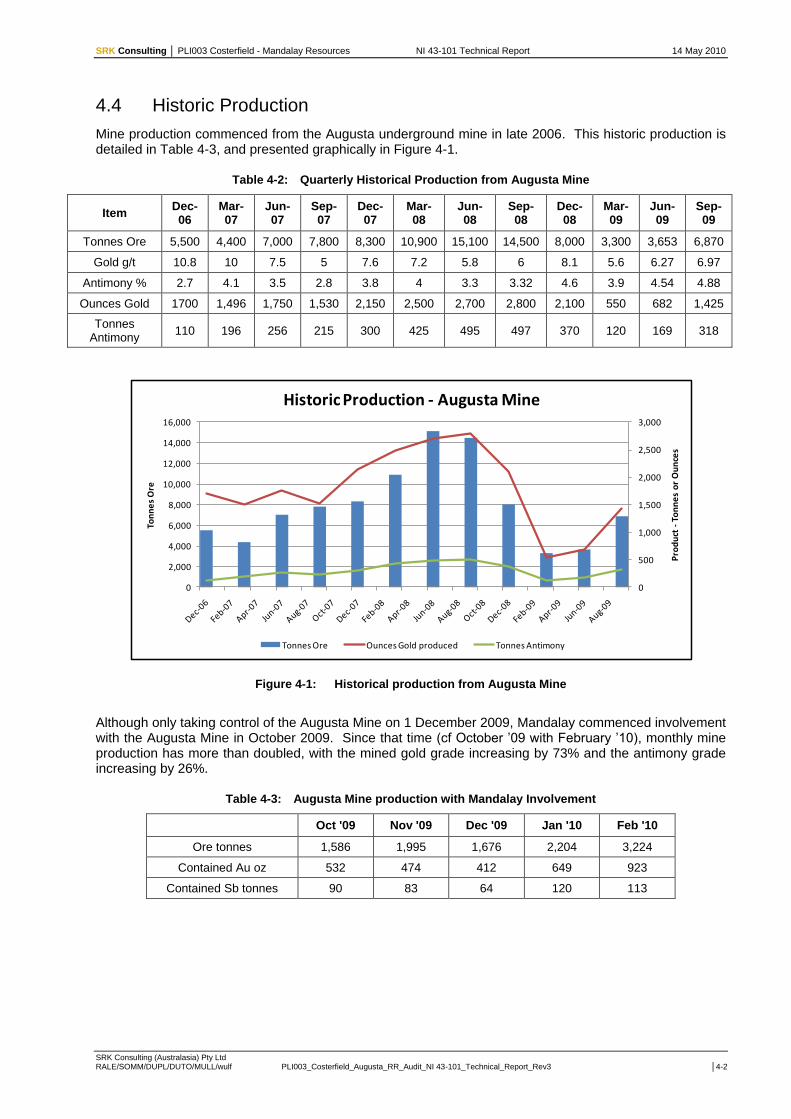
SRK Consulting │ PLI003 Costerfield - Mandalay Resources NI 43-101 Technical Report 14 May 2010
SRK Consulting (Australasia) Pty Ltd RALE/SOMM/DUPL/DUTO/MULL/wulf PLI003_Costerfield_Augusta_RR_Audit_NI 43-101_Technical_Report_Rev3 │4-2
4.4 Historic Production
Mine production commenced from the Augusta underground mine in late 2006. This historic production is detailed in Table 4-3, and presented graphically in Figure 4-1.
Table 4-2: Quarterly Historical Production from Augusta Mine
Item Dec-06
Mar-07
Jun-07
Sep-07
Dec-07
Mar-08
Jun-08
Sep-08
Dec-08
Mar-09
Jun-09
Sep-09
Tonnes Ore 5,500 4,400 7,000 7,800 8,300 10,900 15,100 14,500 8,000 3,300 3,653 6,870
Gold g/t 10.8 10 7.5 5 7.6 7.2 5.8 6 8.1 5.6 6.27 6.97
Antimony % 2.7 4.1 3.5 2.8 3.8 4 3.3 3.32 4.6 3.9 4.54 4.88
Ounces Gold 1700 1,496 1,750 1,530 2,150 2,500 2,700 2,800 2,100 550 682 1,425
Tonnes Antimony
110 196 256 215 300 425 495 497 370 120 169 318
Figure 4-1: Historical production from Augusta Mine
Although only taking control of the Augusta Mine on 1 December 2009, Mandalay commenced involvement with the Augusta Mine in October 2009. Since that time (cf October ‟09 with February ‟10), monthly mine production has more than doubled, with the mined gold grade increasing by 73% and the antimony grade increasing by 26%.
Table 4-3: Augusta Mine production with Mandalay Involvement
Oct '09 Nov '09 Dec '09 Jan '10 Feb '10
Ore tonnes 1,586 1,995 1,676 2,204 3,224
Contained Au oz 532 474 412 649 923
Contained Sb tonnes 90 83 64 120 113
0
500
1,000
1,500
2,000
2,500
3,000
0
2,000
4,000
6,000
8,000
10,000
12,000
14,000
16,000
Pro
du
ct -
Ton
ne
s o
r O
un
ces
Ton
ne
s O
re
Historic Production - Augusta Mine
Tonnes Ore Ounces Gold produced Tonnes Antimony

SRK Consulting │ PLI003 Costerfield - Mandalay Resources NI 43-101 Technical Report 14 May 2010
SRK Consulting (Australasia) Pty Ltd RALE/SOMM/DUPL/DUTO/MULL/wulf PLI003_Costerfield_Augusta_RR_Audit_NI 43-101_Technical_Report_Rev3 │4-3
Figure 4-2: Augusta Mine Production with Mandalay Involvement
-
100
200
300
400
500
600
700
800
900
1,000
-
500
1,000
1,500
2,000
2,500
3,000
3,500
Oct '09 Nov '09 Dec '09 Jan '10 Feb '10
Co
nta
ine
d A
u o
zs &
Sb
to
nn
es
Ore
to
nn
es
Augusta Mine Production with Mandalay Involvement
Ore tonnes Contained Au ozs Contained Sb tonnes

SRK Consulting │ PLI003 Costerfield - Mandalay Resources NI 43-101 Technical Report 14 May 2010
SRK Consulting (Australasia) Pty Ltd RALE/SOMM/DUPL/DUTO/MULL/wulf PLI003_Costerfield_Augusta_RR_Audit_NI 43-101_Technical_Report_Rev3 │5-1
5. Geological Setting (Item 9) The Geological Sections of this Report (i.e. Sections 5 to 12) have been prepared by Bruce Sommerville, who is a Qualified Person as per the requirements of NI 43-101 (See Appendix A for the Letter of Qualification).
5.1 Regional Geology
The following description of the regional geological setting for the Costerfield deposit is taken from Fredericksen (2009a).
The Costerfield Au/Sb vein district, of which the Augusta Lodes are part, is located is located on the western edge of the Melbourne Trough in the Lachlan Geosyncline (Figure 5-1). Stratigraphy in this area comprises a thick sequence of Lower Silurian to Lower Devonian shelf and flysch sediment, dominated by turbiditic siltstone, with minor sandstone and argillite. These rocks form the Murrindindi Supergroup. At the base of the Supergroup is the Costerfield Formation, which is conformably overlain by the Wappentake (sandstone / siltstone) and Dargile (mudstone) Formations, the McIvor Sandstone and the Mount Ida Formation (sandstone-mudstone).
The north trending Heathcote-Mt William Fault system marks the western boundary of the Melbourne Trough in the Costerfield area. This fault system also bounds and disrupts the Cambrian Heathcote Volcanic Belt, whilst further to the west lies the Bendigo Trough.
Devonian Tabberabberan deformation of the Murrindindi Supergroup in the Costerfield area produced early, regional, arcuate N-S trending folds and faults. Later N-S shortening overprinted these structures.

SRK Consulting │ PLI003 Costerfield - Mandalay Resources NI 43-101 Technical Report 14 May 2010
SRK Consulting (Australasia) Pty Ltd RALE/SOMM/DUPL/DUTO/MULL/wulf PLI003_Costerfield_Augusta_RR_Audit_NI 43-101_Technical_Report_Rev3 │5-2
Figure 5-1: Regional geology
Source: Fredericksen (2009a)
Note: Figure 4 in the Regional Geology map is shown as Figure 5.2 Local Geology, in this report.
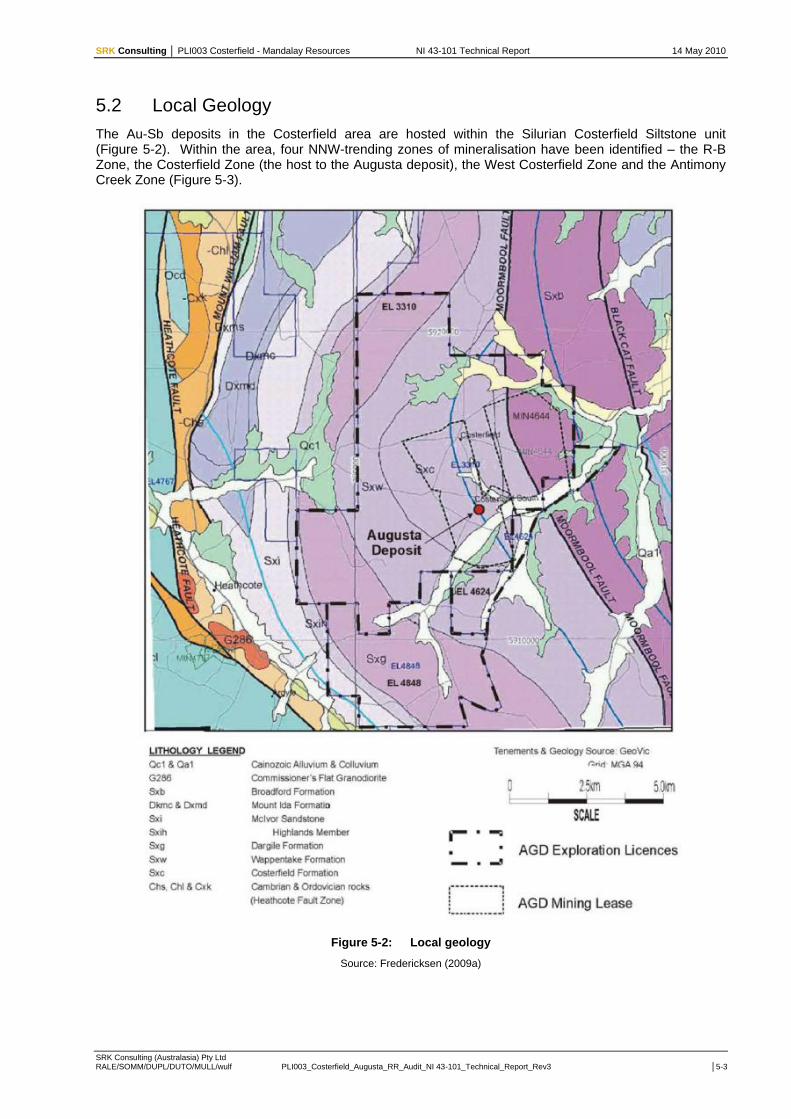
SRK Consulting │ PLI003 Costerfield - Mandalay Resources NI 43-101 Technical Report 14 May 2010
SRK Consulting (Australasia) Pty Ltd RALE/SOMM/DUPL/DUTO/MULL/wulf PLI003_Costerfield_Augusta_RR_Audit_NI 43-101_Technical_Report_Rev3 │5-3
5.2 Local Geology
The Au-Sb deposits in the Costerfield area are hosted within the Silurian Costerfield Siltstone unit (Figure 5-2). Within the area, four NNW-trending zones of mineralisation have been identified – the R-B Zone, the Costerfield Zone (the host to the Augusta deposit), the West Costerfield Zone and the Antimony Creek Zone (Figure 5-3).
Figure 5-2: Local geology
Source: Fredericksen (2009a)

SRK Consulting │ PLI003 Costerfield - Mandalay Resources NI 43-101 Technical Report 14 May 2010
SRK Consulting (Australasia) Pty Ltd RALE/SOMM/DUPL/DUTO/MULL/wulf PLI003_Costerfield_Augusta_RR_Audit_NI 43-101_Technical_Report_Rev3 │5-4
Figure 5-3: Costerfield lode systems
Source: Fredericksen (2009a)

SRK Consulting │ PLI003 Costerfield - Mandalay Resources NI 43-101 Technical Report 14 May 2010
SRK Consulting (Australasia) Pty Ltd RALE/SOMM/DUPL/DUTO/MULL/wulf PLI003_Costerfield_Augusta_RR_Audit_NI 43-101_Technical_Report_Rev3 │5-5
5.3 Project Geology
The Augusta Mine is located in the southern end of the Costerfield Zone and Costerfield Ailtstone. The siltstone is a thick (+600 m) unit of massive- to well-banded siltstones which are well-burrowed. The mineralisation is associated with NNW-trending shear zones, which dip steeply to the west. Several lodes are identified at Augusta. The E and W lodes are the most important lodes, followed by the smaller C and N lodes. A very small, sulphide rich lode, I lode is also identified.
E lode mineralisation is approximately 0.4 m thick, strikes NNW and dips steeply to the west. The lode has a strike length of some 500 m and is intersected by a shear system at approx 4455 m N. Some 40 m west of E lode is W Lode. W lode is also thin (approximately 0.4 m) with and has a strike length of approximately 230 m.
A schematic cross section of the lodes is shown in Figure 5-4.
Figure 5-4: Schematic cross section through the Augusta deposit
Source: Fredericksen (2009a)

SRK Consulting │ PLI003 Costerfield - Mandalay Resources NI 43-101 Technical Report 14 May 2010
SRK Consulting (Australasia) Pty Ltd RALE/SOMM/DUPL/DUTO/MULL/wulf PLI003_Costerfield_Augusta_RR_Audit_NI 43-101_Technical_Report_Rev3 │6-1
6. Deposit Type (Item 10) The Augusta lodes are a thin lode vein-style deposit. The veins are hosted within a broader, strongly foliated shear system and are composed of laminated to brecciated quartz and massive sulphide mineralisation containing stibnite and gold.
Figure 6-1 is a photograph of E Lode on the 1070 m RL and shows the features of the deposit discussed above. A close up photograph of the mineralised lode is shown in Figure 6-2.
Figure 6-1: E Lode 1070 Level South
Notes: Both plates are the same photo, the photo on the right is “marked” up to show the geological features. The mining face is approximately 1.8 m wide and 2.5 m high. For scale, the lens cap is 67 mm.
Host Shear
Laminated Quartz
Viening
Sulphide Vein
Siltstone
Siltstone
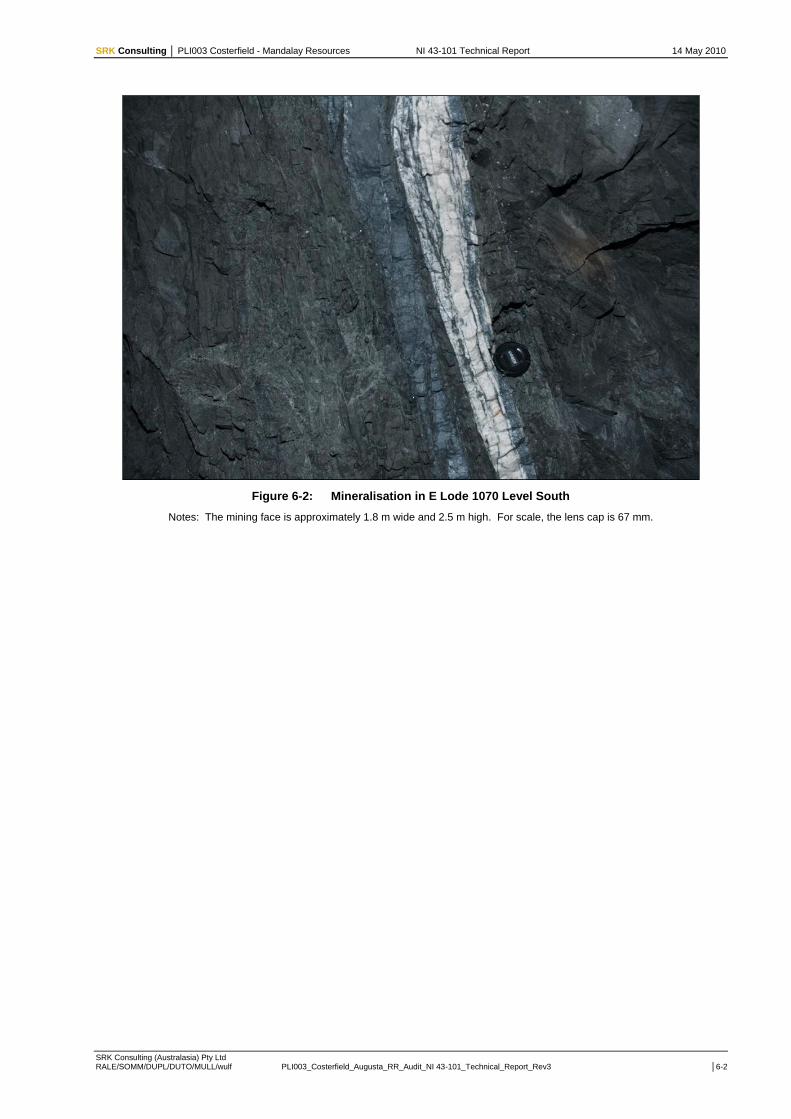
SRK Consulting │ PLI003 Costerfield - Mandalay Resources NI 43-101 Technical Report 14 May 2010
SRK Consulting (Australasia) Pty Ltd RALE/SOMM/DUPL/DUTO/MULL/wulf PLI003_Costerfield_Augusta_RR_Audit_NI 43-101_Technical_Report_Rev3 │6-2
Figure 6-2: Mineralisation in E Lode 1070 Level South
Notes: The mining face is approximately 1.8 m wide and 2.5 m high. For scale, the lens cap is 67 mm.
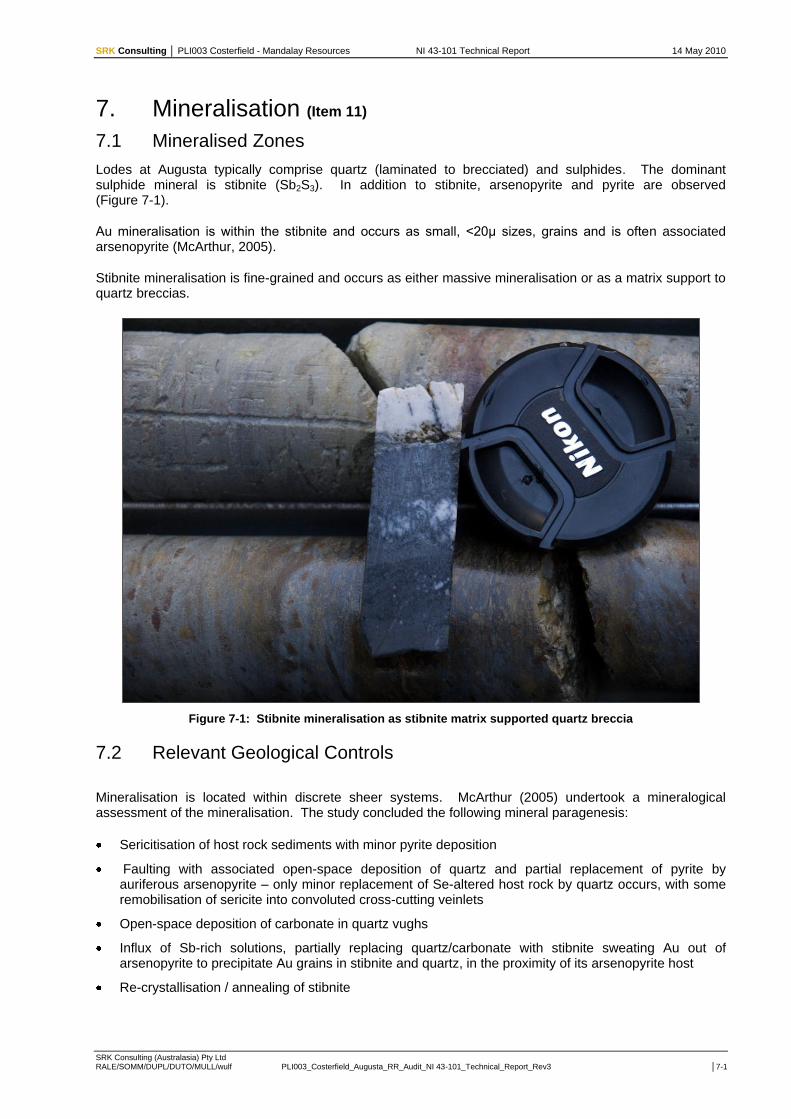
SRK Consulting │ PLI003 Costerfield - Mandalay Resources NI 43-101 Technical Report 14 May 2010
SRK Consulting (Australasia) Pty Ltd RALE/SOMM/DUPL/DUTO/MULL/wulf PLI003_Costerfield_Augusta_RR_Audit_NI 43-101_Technical_Report_Rev3 │7-1
7. Mineralisation (Item 11)
7.1 Mineralised Zones
Lodes at Augusta typically comprise quartz (laminated to brecciated) and sulphides. The dominant sulphide mineral is stibnite (Sb2S3). In addition to stibnite, arsenopyrite and pyrite are observed (Figure 7-1).
Au mineralisation is within the stibnite and occurs as small, <20μ sizes, grains and is often associated arsenopyrite (McArthur, 2005).
Stibnite mineralisation is fine-grained and occurs as either massive mineralisation or as a matrix support to quartz breccias.
Figure 7-1: Stibnite mineralisation as stibnite matrix supported quartz breccia
7.2 Relevant Geological Controls
Mineralisation is located within discrete sheer systems. McArthur (2005) undertook a mineralogical assessment of the mineralisation. The study concluded the following mineral paragenesis:
Sericitisation of host rock sediments with minor pyrite deposition
Faulting with associated open-space deposition of quartz and partial replacement of pyrite by auriferous arsenopyrite – only minor replacement of Se-altered host rock by quartz occurs, with some remobilisation of sericite into convoluted cross-cutting veinlets
Open-space deposition of carbonate in quartz vughs
Influx of Sb-rich solutions, partially replacing quartz/carbonate with stibnite sweating Au out of arsenopyrite to precipitate Au grains in stibnite and quartz, in the proximity of its arsenopyrite host
Re-crystallisation / annealing of stibnite

SRK Consulting │ PLI003 Costerfield - Mandalay Resources NI 43-101 Technical Report 14 May 2010
SRK Consulting (Australasia) Pty Ltd RALE/SOMM/DUPL/DUTO/MULL/wulf PLI003_Costerfield_Augusta_RR_Audit_NI 43-101_Technical_Report_Rev3 │7-2
Weak brittle faulting with milling of quartz, local remobilisation of stibnite, and deposition of carbonate replacement
Very late narrow cracks develop partially filled by carbonate and chlorite (?) with latest deposition of remobilised stibnite, pyrite or rare chalcopyrite
Weathering oxidises stibnite, dissolves carbonate, or converts carbonates and chlorite (?) to clays
Weak open-space re-precipitation of acicular stibnite and low-temperature melnikovite pyrite in vuggy antimony oxide and clay zones

SRK Consulting │ PLI003 Costerfield - Mandalay Resources NI 43-101 Technical Report 14 May 2010
SRK Consulting (Australasia) Pty Ltd RALE/SOMM/DUPL/DUTO/MULL/wulf PLI003_Costerfield_Augusta_RR_Audit_NI 43-101_Technical_Report_Rev3 │8-1
8. Exploration (Item 12)
8.1 Surveys and Investigations
The Costerfield Antimony-Gold deposits were discovered in the 1860. At this time Coster, Field and Youlle named and mined the Main Costerfield Reef. Further exploration led to the Minerva and Bombay deposits between 1860 and 1883. From 1936, the south Costerfield deposit was defined and mined. This deposit is the northern extent of the Augusta deposits. Mid East Minerals discovered the Brunswick line of antimony and gold mineralisation in 1966. This deposit was further explored and mined by the Forsayth Mineral Exploration & Costerfield Mining Pty Ltd from 1973 to 1975. The Augusta mineralisation was discovered by the Victoria Mines Department between 1975 and 1981. Continued exploration and resource definition drilling resulted in the completion of a successful feasibility study and development of the Augusta underground mine in 2006.
SRK understands that AGD will continue exploration in the near mine area. Based on detail provided by AGD geologists, AGD intend to drill 5,625 m of diamond holes to define further dip and strike extensions of E and W Lode, which current drilling has not closed. The estimated drilling costs (including rig mobilisation, staffing and assaying) is $1.076M for a single shift operation. SRK has been advised by Mandalay that this expenditure has been approved by the Mandalay board of directors.
Mandalay have approved the budget based an exploration target of between 118-236 kt at grades comparable to those of the Inferred Resources. Mandalay resource derived the exploration target from calculating the potential range of volume of the target ore shoot (at 1.2 m minimum width for consistency with existing declared resources) as suggested by existing drill intercepts and mapped on and a density of 3.28 g/cc density
The potential quantity and grade is conceptual in nature and there has been insufficient exploration to define a mineral resource. It is uncertain if further exploration will result in the target being delineated as a mineral resource, and, if delineated, will prove economically feasible to mine.

SRK Consulting │ PLI003 Costerfield - Mandalay Resources NI 43-101 Technical Report 14 May 2010
SRK Consulting (Australasia) Pty Ltd RALE/SOMM/DUPL/DUTO/MULL/wulf PLI003_Costerfield_Augusta_RR_Audit_NI 43-101_Technical_Report_Rev3 │8-2
Figure 8-1: Exploration target area for W Lode.
Costerfield- Augusta Deeps Exploration
67.8 g/t Au
45.5% Sb
0.14 m
29.5 g/t Au
29.7% Sb
0.05 m
• Goals for approved
AUD 1.1 Mm programBound potential ore for
extended mine life
Generate near-term, nearby
information to guide continuing
decline
Flexible– early results shift
later holes
Target tonnages not an inferred
resource; based on projection
of existing ore zones to depth
along vein.
Inf. Resource
49 kt > 4.6 g/t
M&I Resource
80 kt > 4.6 g/t
85 g/t Au
27.1% Sb
0.74 m 50.0 g/t Au
32.0% Sb
0.35 m
22.5 g/t Au
25.6% Sb
0.26 m
30.8 g/t Au
16.2% Sb
0.81 m
33.0 g/t Au
58.9% Sb
0.59 m
Target strike length 200-300 m
Targ
et
dip
150-2
00 m
Target
118-236kt
Planned HolesExisting Drill Intercepts
Target vein width
. 0.3-0.4 m (1.2 m min)
W-LODE
Target vein
density = 3.28 g/cc
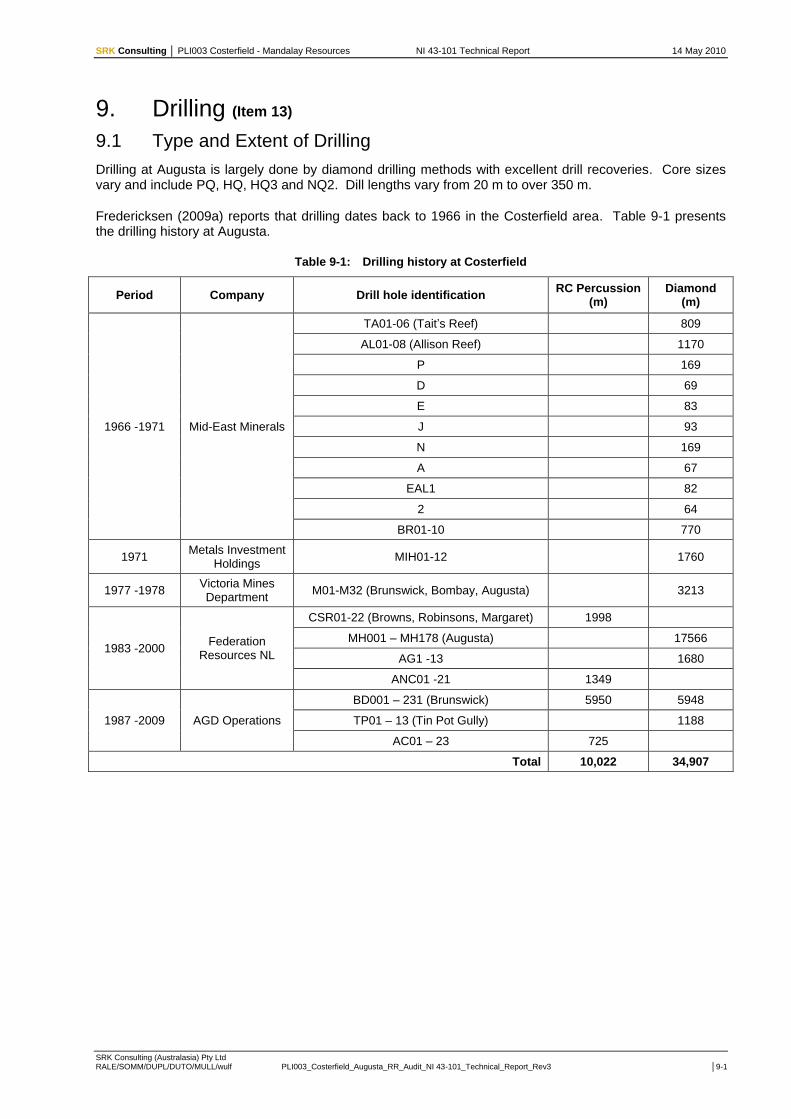
SRK Consulting │ PLI003 Costerfield - Mandalay Resources NI 43-101 Technical Report 14 May 2010
SRK Consulting (Australasia) Pty Ltd RALE/SOMM/DUPL/DUTO/MULL/wulf PLI003_Costerfield_Augusta_RR_Audit_NI 43-101_Technical_Report_Rev3 │9-1
9. Drilling (Item 13)
9.1 Type and Extent of Drilling
Drilling at Augusta is largely done by diamond drilling methods with excellent drill recoveries. Core sizes vary and include PQ, HQ, HQ3 and NQ2. Dill lengths vary from 20 m to over 350 m.
Fredericksen (2009a) reports that drilling dates back to 1966 in the Costerfield area. Table 9-1 presents the drilling history at Augusta.
Table 9-1: Drilling history at Costerfield
Period Company Drill hole identification RC Percussion
(m) Diamond
(m)
1966 -1971 Mid-East Minerals
TA01-06 (Tait‟s Reef) 809
AL01-08 (Allison Reef) 1170
P
169
D
69
E
83
J
93
N
169
A
67
EAL1
82
2
64
BR01-10
770
1971 Metals Investment
Holdings MIH01-12 1760
1977 -1978 Victoria Mines Department
M01-M32 (Brunswick, Bombay, Augusta) 3213
1983 -2000 Federation
Resources NL
CSR01-22 (Browns, Robinsons, Margaret) 1998
MH001 – MH178 (Augusta) 17566
AG1 -13
1680
ANC01 -21 1349
1987 -2009 AGD Operations
BD001 – 231 (Brunswick) 5950 5948
TP01 – 13 (Tin Pot Gully) 1188
AC01 – 23 725
Total 10,022 34,907

SRK Consulting │ PLI003 Costerfield - Mandalay Resources NI 43-101 Technical Report 14 May 2010
SRK Consulting (Australasia) Pty Ltd RALE/SOMM/DUPL/DUTO/MULL/wulf PLI003_Costerfield_Augusta_RR_Audit_NI 43-101_Technical_Report_Rev3 │9-2
Figure 9-1 : Drill hole locations in the Costerfield area
Source: Fredericksen (2009a)
9.1.1 Procedures
Fredericksen (2009a) presents the drilling procedures used by AGD (Figure 9-2). Diamond drilling is carried out by experienced contract drillers. Drillers record drilling activities on daily drilling reports. Drilled core is placed into drill core storage boxes. Each bock is labelled with the drill hole number and the metreage. Core blocks listing the hole number and metreage are placed at the end of each core run.

SRK Consulting │ PLI003 Costerfield - Mandalay Resources NI 43-101 Technical Report 14 May 2010
SRK Consulting (Australasia) Pty Ltd RALE/SOMM/DUPL/DUTO/MULL/wulf PLI003_Costerfield_Augusta_RR_Audit_NI 43-101_Technical_Report_Rev3 │9-3
Additional blocks marking the location of lost core and the end of hole are included by the drillers as required.
Figure 9-2: Drilling procedures used by AGD
Source: Fredericksen (2009a)
Drilling is carried out in a staged fashion with initial exploration drilling occurring at 100 m sections along strike. Resource drilling is then carried out at 40 m along strike and 30 m down dip. In some places, drilling is as at tight as 10 x 10 m should complexity of the geology warrant the additional drilling.
Mineralisation at Augusta dips to the west. Drilling is designed to drill from the hanging wall to the footwall (east dipping holes). Drilling is designed to be the lode perpendicular to the lode.

SRK Consulting │ PLI003 Costerfield - Mandalay Resources NI 43-101 Technical Report 14 May 2010
SRK Consulting (Australasia) Pty Ltd RALE/SOMM/DUPL/DUTO/MULL/wulf PLI003_Costerfield_Augusta_RR_Audit_NI 43-101_Technical_Report_Rev3 │9-4
In the case of underground drilling, the drill holes are drilled from the footwall to the hangingwall.
9.2 Drill Hole Collar and Survey Control
Fredericksen (2009a) reports that underground and surface drill hole collar locations are established by survey personnel. All designed collar locations are marked out by survey.
Once drilling has commenced the actual collar location is surveyed by survey personnel. The surveyed collar locations are recorded in the drill hole request form and drill hole database.
Down hole magnetic survey cameras are used to manage survey control. Typical azimuth and dip measurements are taken at 15 m down hole and every 30 m after that. In cases of low variable tolerances or uncharacteristic survey results, surveys are taken at closer spaced intervals. Recent drilling of the Augusta deposit has been undertaken with the use of electronic single shot instruments (REFLEX® and Camteq® tools). Older drilling within the Augusta and Brunswick deposits has utilised Eastman® single shot camera for downhole survey control.
The measurements obtained from these surveys are relative to magnetic north. A conversion is used to translate these measurements to mine grid. The electronic data is recorded by the driller on a separate survey data sheet, whilst for the Eastman surveys the discs are stored on site. This sheet is given to the supervising geologist and the data is transferred to the drill hole database.
Down hole cameras in recent times have been tested on a purpose-built site with a known azimuth and dip.

SRK Consulting │ PLI003 Costerfield - Mandalay Resources NI 43-101 Technical Report 14 May 2010
SRK Consulting (Australasia) Pty Ltd RALE/SOMM/DUPL/DUTO/MULL/wulf PLI003_Costerfield_Augusta_RR_Audit_NI 43-101_Technical_Report_Rev3 │10-1
10. Sampling Method and Approach (Item 14)
10.1 Sampling Methods
Sampling occurs from both the drill core and directly from underground face samples (Figure 10-1).
Figure 10-1: Location of drill samples and underground development
Blue = E Lode, Purple = W Lode
Source: Source: Fredericksen (2009a)
10.1.1 Diamond Core Sampling
Fredericksen (2009a) details the procedures for logging and sampling and these are detailed below.
Diamond holes are orientated so that the drill holes are as close as possible to being perpendicular. Diamond drill core is logged using a standardised procedure and legend. Geotechnical, lithological, structural, mineralogical and alteration logs are produced using a touch-screen Tough Book computer installed with DrillKing® software.
All geological logs are populated by AGD geology personnel. Data collected on paper prior to implementation of this system has been digitally captured and appears in the AGD drill hole database.
Loss of drill core is initially noted on core blocks by the drilling contractor. This is then verified by the geologist at the logging stage. The data is recorded within the geotechnical database. In order to maximise core recovery and mineralised sample size, 80% of the core drilled at AGD Operations drilling program is of HQ3 size.
McArthur Ore Deposits Assessments Pty Ltd (MODA) 2005 reported for Augusta holes MH001 – MH064 lode recovery was 88%, holes MH065 – M091 lode recoveries were 97%. For the Augusta deposit, much of the current Mineral Resource estimate is based on recent drilling information (holes MH092 – MH178) where core recovery of the lodes is very high (in excess of 95%).

SRK Consulting │ PLI003 Costerfield - Mandalay Resources NI 43-101 Technical Report 14 May 2010
SRK Consulting (Australasia) Pty Ltd RALE/SOMM/DUPL/DUTO/MULL/wulf PLI003_Costerfield_Augusta_RR_Audit_NI 43-101_Technical_Report_Rev3 │10-2
Much of the drill core produced from the Costerfield area is comprised of barren siltstone. As such, not all diamond drill core is sampled. Sample intervals are determined and marked on the core by a geologist. There are a few general rules that are applied in the selection of sample intervals, as listed below:
All stibnite-bearing veins are sampled.
A waste sample is taken either side of the mineralised vein.
Areas of stock work veining are sampled.
Laminated quartz veins are sampled.
Massive quartz veins are sampled.
Silt stone is sampled where disseminated arsenopyrite is prevalent.
Puggy fault zones are sampled at the discretion of the geologist.
AGD staff sample the core. The diamond drill core is cut in half with a diamond saw along the top or bottom mark of orientated core. By this means a representative sample of the core is taken. .
Sampling intervals for drill core are no smaller than 5 cm in length and no greater than 2 m in length. The average sample length for drill core samples within the Augusta drill program is 61 cm. Some drill holes were designed and drilled for metallurgical analysis. Some sample intervals from these holes exceed 2 m in length.
The location and sampling orientations of the diamond holes are representative.
RC drilling is not a common method of drilling to collect samples for the Mineral Resource estimate.
Some RC and hammer drilling is used to establish pre-collars for deeper diamond drill holes.
10.1.2 Underground Face Sampling
Daily underground face samples of the mineralisation are collected using the following method:
1. Face is marked out by the geologist and shows the limits of the lode (red paint) and the bedding angle in blue.
2. Sample locations are marked out so that the sample is taken in a direction that is perpendicular to the dip of the ore lode. Five separate sample locations are marked:
a) Hangingwall sample
b) Footwall sample
c) Three mineralisation samples
3. The face is measured and the lengths of the samples are measured.
4. The face is photographed (a chalk board is used to display the name of the face).
5. Each sample is collected as a channel sample using hammer and chisel and placed into a sample bag.
6. Each sample bag is assigned a unique sample ID.
7. A sample book is used to record the sample IDs used. Also, a tab from the sample book is placed into the sample bag for use by the assay lab.
8. The face is sketched on a face sample sheet and sample detailed recorded.
9. The location of the face is derived from survey pickups of the floor and backs of the drive.
Face samples are taken at the appropriate orientation to the mineralisation and are representative of the mine heading being sampled.

SRK Consulting │ PLI003 Costerfield - Mandalay Resources NI 43-101 Technical Report 14 May 2010
SRK Consulting (Australasia) Pty Ltd RALE/SOMM/DUPL/DUTO/MULL/wulf PLI003_Costerfield_Augusta_RR_Audit_NI 43-101_Technical_Report_Rev3 │10-3
The procedure is documented by the sheet, “Face Sampling Guide” as shown in Figure 10-2.
Figure 10-2: Face sampling guide for Augusta Mine
SRK Consulting │ PLI003 Costerfield - Mandalay Resources NI 43-101 Technical Report 14 May 2010
SRK Consulting (Australasia) Pty Ltd RALE/SOMM/DUPL/DUTO/MULL/wulf PLI003_Costerfield_Augusta_RR_Audit_NI 43-101_Technical_Report_Rev3 │11-1
11. Sample Preparation, Analyses and Security (Item 15)
11.1 Sample Preparation and Assaying Methods
Drill core and underground face samples are prepared and analysed using the same techniques.
11.1.1 Testing Laboratories
Most of the recent drilling at Augusta has used Aminya Laboratories (Onsite Laboratories) in Bendigo for the assaying of Au and Sb. However, Genalysis (Brisbane and Perth) and ALS (Brisbane) have been used.
After dispatching the samples (core or face samples), it is understood that only staff employed by the assay labs are responsible sample and chemical analysis. Results are returned to AGD staff who in turn manage the database.
A search of the National Association of Testing Authorities (NATA) indicates that:
Aminya Laboratories is not certified to NATA standards.
ALS is NATA-certified (825) for Au and Sb.
Genalysis is NATA-certified (3244) for Au and Sb.
11.1.2 Sample Preparation
Fredericksen (2009a) reports the following sample preparation procedure:
1 Sample material is placed into a calico bag previously marked with a sample number.
2 The sample characteristics are marked on a sample ticket and placed in the bag.
3 Calico bags are loaded in to plastic bags so that the plastic bags weigh less than 20 kg.
4 Assay request sheet is filled out and placed in the sample bag.
5 Plastic bags containing samples are sealed and transported to Onsite lab in Bendigo.
6 Samples received by Onsite staff and checked against the submission sheet.
7 Job number assigned and worksheets and sample bags prepared.
8 Samples placed in oven and dried overnight at 80°C.
9 Sample (0.5 – 2 kg) jaw crushed to approximately 2 mm.
10 Sample milled and pulverized to 90% passing 75 μm.
11 Sample split, with 200 g for analysis and the remaining sample returned to sample bag for storage and return to site.
11.1.3 Sample Analysis
Fredericksen (2009a) report that gold grades are determined by fire assay / AAS. The following procedure is used:
1 50 grams of pulp fused with 180 grams of flux.
2 Slag removed from the lead button and cupellation used to produce a gold / silver prill.
3 0.6 mL of 50% nitric acid added to test tube containing prill and test tube placed in a boiling water bath (100° C) until fumes ceases and silver appears to be completely dissolved.
4 1.4 mL of hydrochloric acid HCL added.
5 On complete dissolution of gold, when solution cooled, 8 mL of water added.
6 Once solids have settled gold content determined by flame AAS.

SRK Consulting │ PLI003 Costerfield - Mandalay Resources NI 43-101 Technical Report 14 May 2010
SRK Consulting (Australasia) Pty Ltd RALE/SOMM/DUPL/DUTO/MULL/wulf PLI003_Costerfield_Augusta_RR_Audit_NI 43-101_Technical_Report_Rev3 │11-2
Fredericksen (2009a) reports that Sb grades are determined using acid digest / AAS with the following procedure:
1 Add 0.2 grams of sample to flask.
2 Add 5 grams of Tartaric acid.
3 Add 24 mL of 50% hydrochloric acid and allow to stand for 40 minutes.
4 Add 12 mL of Nitric acid and gently flux on hot plate.
5 When cool, dilute to 200 mL with distilled water.
6 Antimony content determined by AAS.
The sample preparation practices and analytical techniques are appropriate.

SRK Consulting │ PLI003 Costerfield - Mandalay Resources NI 43-101 Technical Report 14 May 2010
SRK Consulting (Australasia) Pty Ltd RALE/SOMM/DUPL/DUTO/MULL/wulf PLI003_Costerfield_Augusta_RR_Audit_NI 43-101_Technical_Report_Rev3 │12-1
12. Data Verification (Item 16) Historic data in the Costerfield area has not been subjected to modern Quality Assurance Quality Control (QA/QC) procedures.
Fredericksen (2009a) reports that holes prior to hole MH064 were not subjected to any QA/QC analysis.
In 2005, MODA developed standard reference material. The material was sourced from the Brunswick stockpiles.
Subsequent to this, Geostats Pty Ltd prepared a set of standards for use.
At Augusta, four QA/QC protocols are in place:
Submission of standards to measure analytical accuracy
Review of laboratory preparation repeats
Blind re-submission of sample pulps
Submission of blanks
In the following sub-sections, the author has relied upon other experts. This discussion on sample quality is based on information prepared by Fredericksen (2009a). The author of this section has not independently verified the results.
12.1 Blanks
Fredericksen (2009a) presents the results of blanks sent to the assay laboratory (Figure 12-1). There is one poor Sb result and one poor Au result.
Figure 12-1: Analysis of blanks
Source: Fredericksen (2009a)
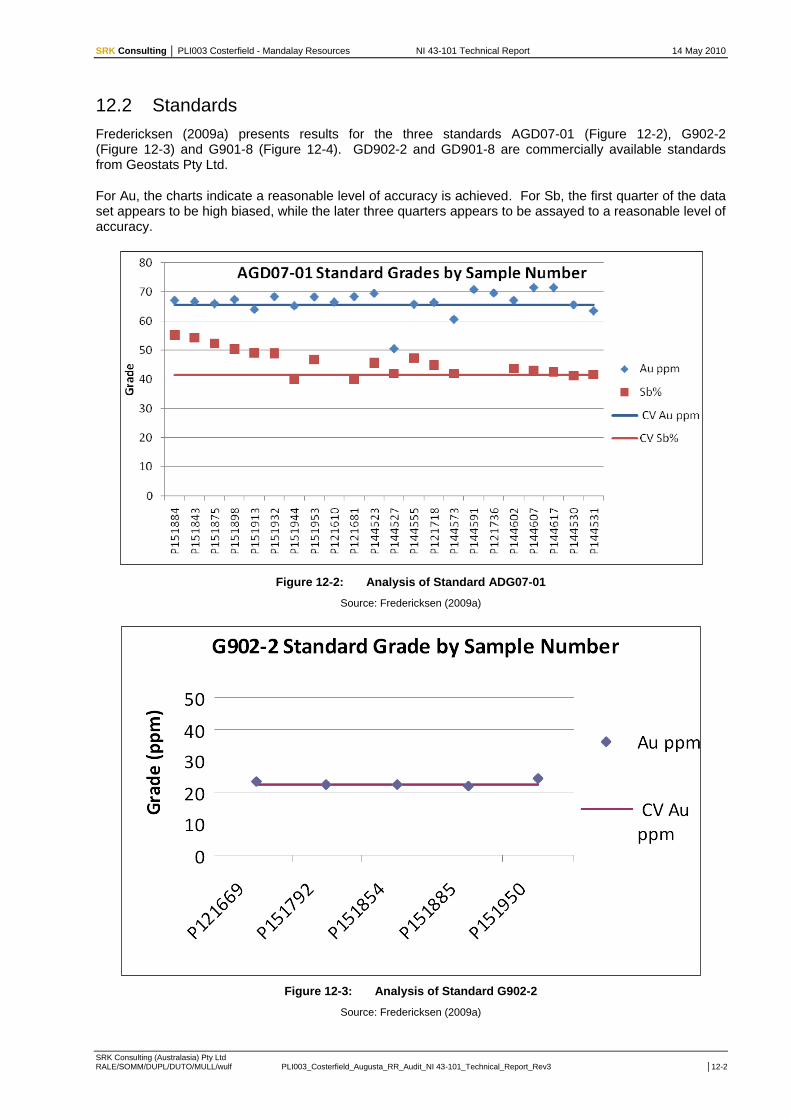
SRK Consulting │ PLI003 Costerfield - Mandalay Resources NI 43-101 Technical Report 14 May 2010
SRK Consulting (Australasia) Pty Ltd RALE/SOMM/DUPL/DUTO/MULL/wulf PLI003_Costerfield_Augusta_RR_Audit_NI 43-101_Technical_Report_Rev3 │12-2
12.2 Standards
Fredericksen (2009a) presents results for the three standards AGD07-01 (Figure 12-2), G902-2 (Figure 12-3) and G901-8 (Figure 12-4). GD902-2 and GD901-8 are commercially available standards from Geostats Pty Ltd.
For Au, the charts indicate a reasonable level of accuracy is achieved. For Sb, the first quarter of the data set appears to be high biased, while the later three quarters appears to be assayed to a reasonable level of accuracy.
Figure 12-2: Analysis of Standard ADG07-01
Source: Fredericksen (2009a)
Figure 12-3: Analysis of Standard G902-2
Source: Fredericksen (2009a)

SRK Consulting │ PLI003 Costerfield - Mandalay Resources NI 43-101 Technical Report 14 May 2010
SRK Consulting (Australasia) Pty Ltd RALE/SOMM/DUPL/DUTO/MULL/wulf PLI003_Costerfield_Augusta_RR_Audit_NI 43-101_Technical_Report_Rev3 │12-3
Figure 12-4: Analysis of Standard G902-8
Source: Fredericksen (2009a)
12.3 Laboratory Repeats
Laboratory repeats are taken after an initial coarse crushing stage of the sample preparation. Fredericksen (2009a) reports that the samples are randomly selected at the assay lab.
The data presented shows that the data fall on a y=x line indicating that the splitting after sample crushing is unbiased (Figure 12-5).
Figure 12-5: Laboratory preparation duplicate
Source: Fredericksen (2009a)
Assay repeats are also carried out. Fredericksen (2009a) presented the results of these repeats, which are shown in Figure 12-6. Again, the data falls on a y=x line indicating that the split is unbiased.

SRK Consulting │ PLI003 Costerfield - Mandalay Resources NI 43-101 Technical Report 14 May 2010
SRK Consulting (Australasia) Pty Ltd RALE/SOMM/DUPL/DUTO/MULL/wulf PLI003_Costerfield_Augusta_RR_Audit_NI 43-101_Technical_Report_Rev3 │12-4
Figure 12-6: Laboratory assay repeats
Source: Fredericksen (2009a)
12.4 Assay Repeats
Sample pulps are:
Blindly resubmitted to the original assay lab for reanalysis
Submitted to ALS laboratory for re-analysis
This has only occurred for seven data and these are presented in Figure 12-7. While Sb compares well, Au is not as repeatable.
Figure 12-7: Inter-laboratory repeats
Source: Fredericksen (2009a)
12.5 Conclusion
Based on the data presented by Fredericksen (2009), the quality of the assay data appears reasonable.

SRK Consulting │ PLI003 Costerfield - Mandalay Resources NI 43-101 Technical Report 14 May 2010
SRK Consulting (Australasia) Pty Ltd RALE/SOMM/DUPL/DUTO/MULL/wulf PLI003_Costerfield_Augusta_RR_Audit_NI 43-101_Technical_Report_Rev3 │13-1
13. Adjacent Properties (Item 17)
13.1 Statement
SRK understands that the adjacent properties are controlled by small land-holders for the purpose of small scale farming activities.

SRK Consulting │ PLI003 Costerfield - Mandalay Resources NI 43-101 Technical Report 14 May 2010
SRK Consulting (Australasia) Pty Ltd RALE/SOMM/DUPL/DUTO/MULL/wulf PLI003_Costerfield_Augusta_RR_Audit_NI 43-101_Technical_Report_Rev3 │14-1
14. Mineral Processing and Metallurgical Testing (Item 18) This section of the report has been compiled by Brett Muller of Simulus Pty Consulting Metallurgical Engineers, who is a Qualified Person as required by the National Instrument 43-101 (Appendix A).
14.1 Mineral Processing Facility
14.1.1 Introduction
This section includes discussion and comment on the metallurgical processing aspects associated with the AGD Pty Ltd Costerfield (Costerfield) mining assets. Specifically, detail and comment is given on the mineral processing, cost and metallurgical testing aspects. These relate to historical plant capacity, metallurgical recovery, metallurgical accounting and operating expenditure as well as commentary on future throughput.
14.1.2 Process Plant Background
The Costerfield mine and process plant was recently acquired by Mandalay Resources. The plant, in its current configuration, was re-commissioned in 2006 by the previous owners to treat sulphide ore. Only minor improvements have been made since this time. The plant produces three products; an antimony and gold-bearing sulphide concentrate, a gravity gold concentrate and a gold dore.
14.1.3 Facility Description
The Costerfield processing facility comprises of a two-stage crushing process, two milling stages in series, with classification and gravity concentration in closed circuit, rougher, scavenger and cleaner flotation for the production of a gravity gold stream and an antimony and gold concentrate. A facility for cyanide gold dissolution and adsorption followed by elution, electrowinning and smelting to produce bullion also exists. This is currently used for the reprocessing of old tailings materials. The current flotation tailings are sent to the current tailings storage facility. The circuit is a conventional CIP circuit with the addition of lead nitrate in the leaching stage and is suited to the application of processing the typical ore types historically processed in the area. A spiral circuit is installed between the two milling circuits as part of the gravity gold circuit but has been removed from the circuit, resulting in an increase in gravity gold recovery. Due to the facilities location, the operating license only allows operation 5.5 days per week.
14.1.4 Operating Background
Current and historical processing throughput, recoveries and costs are the best indicators available for future production forecasts. The plant feed material is all sourced from one mine with two lodes. Whilst variability testwork for each new level accessed is preferable and previously completed, there is no testwork available for the material currently being mined. However, throughput and recovery performance are in line with historical data, suggesting reasonably uniform performance from one level to the next. Samples were also taken on 22 March for the next level, to enable metallurgical testwork prior to processing. This work will assist site understanding, likely throughput constraints, recoveries and reagent consumption rates
14.1.5 Recoveries
Metallurgical recoveries, unless where expressly stated otherwise, have been largely based on the application of historical site information for concentrate grade and recovery relationships. This determines future residue grades based on a relationship between historical head grades, concentrate grades, residue grades and future head grades. However, recent plant assay results have not always been available in a timely manner. Site management are currently investigating alternate laboratory options to improve this. Metallurgical plant performance is a modifying factor included in the estimation of reserves. As such, proper metallurgical accounting and testwork is essential to enable ongoing reserve calculations.
14.1.6 Risk to Throughput and Recovery
A major risk to plant throughput and recovery is the ongoing maintenance of the facility. A preventative maintenance plan was presented for review. However, at the time of inspection a short-term unavailability of labour had resulted in maintenance being more reactionary in nature. It has since been reported that the back log of maintenance events has been overcome.

SRK Consulting │ PLI003 Costerfield - Mandalay Resources NI 43-101 Technical Report 14 May 2010
SRK Consulting (Australasia) Pty Ltd RALE/SOMM/DUPL/DUTO/MULL/wulf PLI003_Costerfield_Augusta_RR_Audit_NI 43-101_Technical_Report_Rev3 │14-2
14.1.7 Crushing and Screening Circuit
The crushing and screening plant consists of two stages of jaw crushing with intermediate screening. Both crushers operate in open circuit. Crushed ore is conveyed to two fine ore bins in parallel. The fine ore bins are poorly designed, with a flat base that has resulted in the live volume being significantly less than total volume. This impacts plant throughput during planned crushing plant shutdowns, which occur every night shift in line with the operating licence conditions. A bypass / re-feeder system is being implemented to allow modifications to the bins.
14.1.8 Milling Circuit
The milling circuit comprises two ball mills in series, both in closed circuit. The gravity gold circuit is installed within the secondary milling circuit. The primary mill operates in closed circuit with a DSM screen, with screen overflow returning to the mill and underflow being pumped to the Knelson concentrators. The mill is reported to operate reliably. A spiral circuit is installed and previously received the DSM screen underflow, with the spiral concentrate reporting to the Knelson concentrators for final gravity gold production. It was reported that operating in this arrangement achieved a gravity gold recovery of approximately 10% of total feed gold. The spirals were bypassed for a trial, with all DSM screen underflow reporting to the Knelson concentrators in combination with the secondary mill cyclone underflow. This significantly increased the flow rate to the Knelson concentrators and requires both units to operate, and also requires manual cleaning of the Knelson concentrators every hour. However, the flowsheet change resulted in gravity gold recovery increasing to 30% of total feed gold. As gravity recovery of gold is by far the cheapest means of recovery on site, this is a very positive outcome.
14.1.9 Flotation Circuit
The flotation circuit consists of a combination of purchased equipment and site fabricated or modified items. The original surge tank, installed to separate the milling circuit from the flotation circuit, is now the conditioning tank. The original conditioning tanks have been modified on site with spare parts to tank cell type flotation cells to add additional rougher residence time. Denver cells are used for the remaining rougher duty, scavenger and cleaning duties. A plate filter press is used for concentrate filtration.
14.1.10 Leaching Circuit
The leaching circuit is currently used to treat reclaimed tailings. The circuit includes seven Pachuca style leach tanks used for a combination of slurry storage and leaching, one converted water tank in leach duty and five adsorption tanks used for adsorption and detoxification duties. A gold room and carbon regeneration kiln are also installed.
All circuits are manually operated. There is no control or data tracking system in place.
14.1.11 Metal Accounting
Metal accounting is performed based on gold and antimony in plant feed, discharge, product assays and carbon loadings. Samples are predominantly hand-sampling of solid and slurry streams. There are no sampling systems installed. Plant recovery calculations are reconciled against gold and concentrate assays following each shipment.
14.2 Status of Processing Facility
The leach / CIP circuit operation is currently not optimised. Due to noise restraints, tailings reclaim only occurs during day shift, whilst leaching and adsorption run continuously with the feed slurry provided by drawing down the levels in the leach tanks. This results in varying leach residence time and circuit instability. SRK recommends a simple study should be conducted to optimise the movement of reclaimed slurry to stabilise the circuit.
Additionally, the first leach tank is bogged and has been for some time. SRK recommends that priority be given to un-bogging this tank, thus increasing surge volume and leaching residence time. At the time of inspection, three of the five agitators in the adsorption circuit were out of service and appeared to have been so for quite some time. However, these are reported to have all now been repaired. The carbon regeneration kiln is out of service due to a broken feed system. This reduces the stripping efficiency and

SRK Consulting │ PLI003 Costerfield - Mandalay Resources NI 43-101 Technical Report 14 May 2010
SRK Consulting (Australasia) Pty Ltd RALE/SOMM/DUPL/DUTO/MULL/wulf PLI003_Costerfield_Augusta_RR_Audit_NI 43-101_Technical_Report_Rev3 │14-3
adsorption capacity of the carbon and increases the amount of carbon and residence time required for proper gold adsorption.
Fluctuations in the gold in solution assays support this finding. It was reported that the kiln would be repaired by the end of March 2010 once parts were received. However, the age and design of the kiln are likely to provide ongoing performance issues. Site management are reviewing options for replacement or off-site regeneration of carbon.
There are a number of pumps on site that were leaking slurry from the seal arrangement. Maintenance of pumps seal packing is a simple maintenance task that should be completed regularly. Poor maintenance of pump seals will lead to wearing of the shaft sleeve and potential contamination of the bearings. These are costly maintenance items that require downtime to rectify. Pump seals should be properly maintained with the correct consumable items. SRK recommends management of these pumps seals be reviewed.
There are no laboratory facilities on site. Off site laboratory turnaround time has previously been poor. Plant operation without an effective assay feedback system is very difficult, and is likely to result in recovery losses. It is planned to improve this issue by the installation of an online analysis system for antimony only. Capital for this is included in the financial model. However, proper technical support and maintenance is required to ensure equipment with this level of sophistication is kept on line and useful. This would require full management support and is not aligned with site observations.
Power supply to site is via connection to the state grid and is very reliable. Water supply is from local bores, dewatering of the old Brunswick open pit adjacent to the plant and the existing Augusta mine dewatering system. These multiple sources of good quality water ensure water supply is reliable.
14.3 Historical Plant Performance
Costerfield has been operating under Mandalay management since late 2009. Steady state operating conditions were reportedly reached in February 2010. It should be noted that the plant has lacked metallurgical supervision throughout this period. A plant metallurgical manager commenced at the start of March and it is anticipated that plant recovery, throughput and cost management will improve. Metallurgical plant performance is a modifying factor included in the estimation of reserves. As such, proper metallurgical accounting and testwork is essential to enable ongoing reserve calculations.
Table 14-1 shows the historical plant operating statistics for the metallurgical plant. No data prior to July 2008 was reviewed.
Table 14-1: Historical plant performance data
Month Feed tonnes
(t) Feed tonnes (average t/h)
Sb grade (%)
Sb Recovery (%)
Au grade (g/t)
Au Recovery (%)
Jul-2008 5508 11.5 4.2 85.8 6.9 80.7
Aug-2008 4874 11.8 4.0 80.3 6.5 81.1
Sep-2008 4418 11.0 5.0 72.6 8.6 76.3
Oct-2008 4814 10.3 5.5 79.9 9.8 81.1
Nov-2008 2814 9.5 5.4 78.8 9.1 78.4
Dec-2008 433 9.2 5.2 81.0 12.9 82.1
Jan-2009 972 8.4 4.61 95.8 6.5 80.7
Feb-2009 1047 7.2 4.82 87.9 5.46 80.8
Mar-2009 1369 11.7 3.7 84.8 7.4 84.1
Apr-2009 0 0 0 0 0 0
May-2009 1225 9.6 3.8 88.5 5.6 78.6
Jun-2009 2031 11.4 5.1 92.8 6.8 83.9
Jul-2009 2437 9.4 5.0 84.5 7.5 78.2
1 Back calculation only, note in met accounts “NB Antimony reconcillation (sic) not correct as assays not taken to save $”
2 Back calculation only, note in met accounts “NB Antimony reconcillation (sic) not correct as assays not taken to save $”

SRK Consulting │ PLI003 Costerfield - Mandalay Resources NI 43-101 Technical Report 14 May 2010
SRK Consulting (Australasia) Pty Ltd RALE/SOMM/DUPL/DUTO/MULL/wulf PLI003_Costerfield_Augusta_RR_Audit_NI 43-101_Technical_Report_Rev3 │14-4
Month Feed tonnes
(t) Feed tonnes (average t/h)
Sb grade (%)
Sb Recovery (%)
Au grade (g/t)
Au Recovery (%)
Aug-2009 1831 8.1 4.6 87.3 6.4 80.1
Sep-2009 2602 9.5 4.8 84.9 6.8 76.7
Oct-2009 1465 14.0 3.7 88.8 7.1 79.4
Nov-2009 2240 16.4 3.3 87.6 5.7 76.2
Dec-2009 1813 17.6 2.7 85.7 5.1 67.5
Jan-2010 2101 14.0 5.4 80.1 9.3 77.1
Feb-2010 2866 11.8 N/A3 N/A N/A N/A
Average 2466 11.8 4.6 83.2 7.5 79.0
In terms of the historical performance of the Costerfield operation, the following observations were made.
Plant throughput appears to be historically constrained by the non availability of ore. The plant has a proven operating history operating at greater than 4,500 t per month with similar feed grades and recoveries. However, the high average hourly feed rates and low monthly tonnes for October to December 2009 highlight that during this period plant availability was low. This period also produced slightly below average gold recovery, suggesting that the gold recovery will be slightly lower if throughput is maintained above 12 t/h consistently.
The plant recoveries have been relatively steady, having averaged 83.2% antimony and 79.0% gold recovery and have been typically maintained above the 79% and 76% respectively for the period reviewed. Recovery is constant with monthly throughput up to 5,000 t per month, indicating that available ore and plant uptime are the key variable impacting production.
Historical throughput data and unit costs were compared against budgeted costs and projected throughput. The summary data is presented in Figure 14-1. The key points are:
The projected costs and throughput are aligned with historic operating data, albeit at the high end of proven production.
Operating costs can be considered to be almost completely fixed, as depicted by the dramatic rise in unit costs from Nov-08 to Aug-09 when throughput was reduced significantly.
Unit costs are coming down and production ramping up, although not as fast as budgeted.
It is fair to expect costs to return to around AUD55-60/t ore milled if throughput can be maintained at 4,000 t/month.
3 Reconciliation not completed as of 9 March 2010.

SRK Consulting │ PLI003 Costerfield - Mandalay Resources NI 43-101 Technical Report 14 May 2010
SRK Consulting (Australasia) Pty Ltd RALE/SOMM/DUPL/DUTO/MULL/wulf PLI003_Costerfield_Augusta_RR_Audit_NI 43-101_Technical_Report_Rev3 │14-5
Figure 14-1: Historical versus budget costs and throughput
14.4 Forecast Plant Performance
14.4.1 Metallurgical Performance
Forecast plant performance was received and reviewed in the form of a life of mine financial model. The model inputs for the processing plant were derived by the previous plant manager.
The model began with data from July 2009, making it possible to undertake some analysis of planned versus actual performance. This was completed as means of forecasting future performance. Table 14-2 shows the planned versus actual feed tonnes. Actual performance tracked against plan well for July to November. However, the gap between planned and actual tonnes has been increasing consistently since December 2009, in line with an increasing planned tonnage. This suggests that there is little chance of achieving the even greater March planned tonnage. At the time of the site visit on 9 March 2010, there was very little ore on the ROM pad. This highlights that the key issue in the underperformance, is the lack of ore delivery to the ROM pad. However, the higher than historical average throughput also shows that the plant was not without its own issues associated with breakdowns and mechanical failure, or lack of operations personnel to operate the plant.
The planned average throughput for the remainder of the financial model (to Dec-2011) is 4,901 t per month. Should the mine be able to achieve this feed rate and if proper maintenance practices are undertaken there is no reason to suggest the plant cannot process the material. This is best seen by reviewing the operating data for July to October 2008 when similar tonnes were processed with an average feedrate of approximately 11 t/h versus 15 t/h required in October 2009 to January 2010 to process significantly less tonnes. To meet the proposed budget, SRK recommend that proactive planned maintenance continue to occur and that a review of critical spare parts is undertaken.

SRK Consulting │ PLI003 Costerfield - Mandalay Resources NI 43-101 Technical Report 14 May 2010
SRK Consulting (Australasia) Pty Ltd RALE/SOMM/DUPL/DUTO/MULL/wulf PLI003_Costerfield_Augusta_RR_Audit_NI 43-101_Technical_Report_Rev3 │14-6
Table 14-2: Planned versus actual feed tonnes
Month Actual feed tonnes (t)
Budget feed tonnes (t)
Jul-2009 2437 2313
Aug-2009 1831 1874
Sep-2009 2602 2468
Oct-2009 1465 1516
Nov-2009 2240 2027
Dec-2009 1813 2102
Jan-2010 2101 2867
Feb-2010 2866 3766
Mar-2010 -- 5378
Table 14-3 shows the planned versus actual antimony feed grade and recovery performance for the same period. The same trend can be seen, with actual grades matching planned grades well to begin with, followed by divergence from late 2009 to present day. Recovery is also seen to dip in January, and likely in February with the increased instantaneous feed rates to the plant. Planned recovery is predicted using a constant tails grade method. This is common and acceptable. The constant tails grade for antimony in the financial model is 0.5%, reducing to 0.3% in March 2010 with the introduction of online analysis. Site personnel reported that a 0.3% tails grade was already being achieved regularly.
Figure 14-2: Recent antimony in tailings trend
Figure 14-2 shows the recent improvements in tailings grade, with occasional process upsets. It is recommended that a tails grade of 0.3% antimony be maintained in the financial model and that the capital allowance for the online analysis be removed.

SRK Consulting │ PLI003 Costerfield - Mandalay Resources NI 43-101 Technical Report 14 May 2010
SRK Consulting (Australasia) Pty Ltd RALE/SOMM/DUPL/DUTO/MULL/wulf PLI003_Costerfield_Augusta_RR_Audit_NI 43-101_Technical_Report_Rev3 │14-7
Table 14-3: Planned versus actual antimony grade and recovery
Month Planned Sb
grade (%)
Actual Sb grade
(%)
Planned Sb recovery
(%)
Actual Sb recovery
(%)
Jul-2009 5.0 5.0 90.0 84.5
Aug-2009 4.6 4.6 89.1 87.3
Sep-2009 5.0 4.8 89.9 84.9
Oct-2009 4.3 3.7 88.3 88.8
Nov-2009 3.8 3.3 86.9 87.6
Dec-2009 3.7 2.7 86.6 85.7
Jan-2010 3.4 5.4 85.5 80.1
Feb-2010 4.4 N/A4 88.7 N/A
Mar-2010 4.2 -- 92.9 --
Table 14-4 shows the same analysis for gold. However, the comparison is quite different. Gold recovery has been consistently below planned recovery for the entire period.
Table 14-4: Planned versus actual gold grade and recovery
Month Planned Au grade (g/t)
Actual Au grade (g/t)
Planned Au recovery
(%)
Actual Au Recovery
(%)
Jul-2009 7.5 7.5 86.7 78.2
Aug-2009 6.4 6.4 84.5 80.1
Sep-2009 6.9 6.8 85.6 76.7
Oct-2009 8.1 7.1 87.7 79.4
Nov-2009 6.2 5.7 83.8 76.2
Dec-2009 6.1 5.1 83.7 67.5
Jan-2010 6.8 9.3 85.2 77.1
Feb-2010 8.4 N/A 88.1 N/A
Mar-2010 9.3 -- 92.5 --
Planned, or forecast gold recovery, is based on a constant tail grade in the life of mine model. This approach is common and acceptable providing the plant stays within a known operating window. However, for the period analysed the constant tail grade chosen appears to be high. The forecast tails grade is reduced from March 2010 onwards due to the implementation of an on line analyser, which is yet to be purchased or installed.
Single variable regression analysis of data for the period of July 2009 to January 2010 shows that a constant tail of 1.6 g/t provides a better alignment between predicted and actual plant performance for the period. This is significantly higher than the 1.0 g/t value in the financial model for the period to February 2010 and the 0.7 g/t value from March 2010 onwards. Likewise, analysis of the dataset from July 2008 to February 2010 showed a constant tail of 1.39 g/t provided the best correlation between predicted and actual recovery. The difference between these two predicted values is very likely to be linked to the average instantaneous plant feed rate. However, more analysis and data is required to confirm this. Assuming the plant is able to operate consistently in the future, it is suggested that the constant gold tails grade in the financial model be increased to 1.4 g/t. Figure 14-3 shows the recent gold tails grade trend. Whilst a tailings grade of 1.0 g/t was recently achieved, this was during an operating period with a relatively low head grade around 6 g/t.
4 Reconciliation not completed as of 9 March 2010
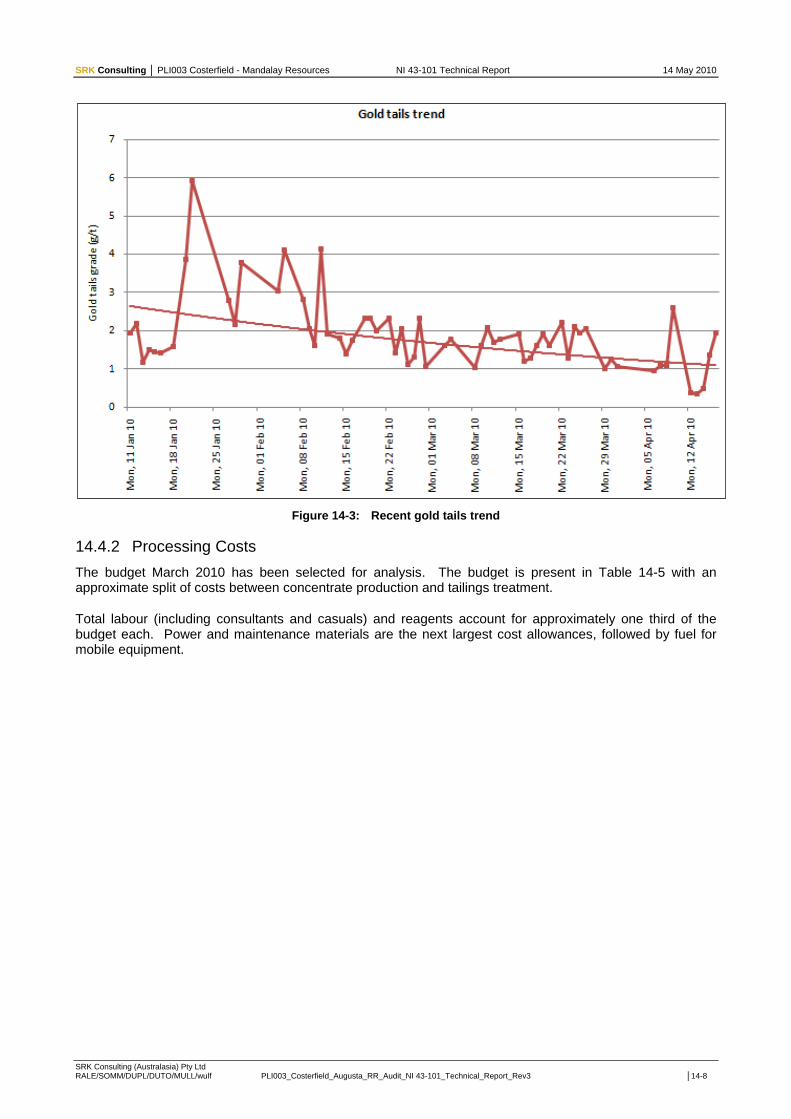
SRK Consulting │ PLI003 Costerfield - Mandalay Resources NI 43-101 Technical Report 14 May 2010
SRK Consulting (Australasia) Pty Ltd RALE/SOMM/DUPL/DUTO/MULL/wulf PLI003_Costerfield_Augusta_RR_Audit_NI 43-101_Technical_Report_Rev3 │14-8
Figure 14-3: Recent gold tails trend
14.4.2 Processing Costs
The budget March 2010 has been selected for analysis. The budget is present in Table 14-5 with an approximate split of costs between concentrate production and tailings treatment.
Total labour (including consultants and casuals) and reagents account for approximately one third of the budget each. Power and maintenance materials are the next largest cost allowances, followed by fuel for mobile equipment.

SRK Consulting │ PLI003 Costerfield - Mandalay Resources NI 43-101 Technical Report 14 May 2010
SRK Consulting (Australasia) Pty Ltd RALE/SOMM/DUPL/DUTO/MULL/wulf PLI003_Costerfield_Augusta_RR_Audit_NI 43-101_Technical_Report_Rev3 │14-9
Table 14-5: March 2010 processing budget
Account code
Category
Labour, consumables,
power, reagent, hire or other
Overall Plant (AUD)
Concentrate production
(AUD)
Tailings treatment
(AUD)
Total 309,444 201,094 108,350
100 Salaries & Wages Labour 92,534 71,475 21,059
110 Payroll Oncosts Labour 23,305 21,340 1,964
115 External Labour Hire Labour - - -
120 Consultants Labour 14,500 14,000 500
125 Contractors Labour 8,480 7,284 1,196
200 Materials & Services Consumables 12,700 11,425 1,275
210 Fuels, Oils & Lubricants Consumables 7,501 4,965 2,537
215 Assay Other - - -
220 Reagents Reagents 110,248 37,789 72,459
295 Light Vehicle Costs Hire 720 720 -
300 Equipment Hire (dry) Hire 2,800 500 2,300
305 Plant Hire (wet) Hire - - -
310 Power Power 25,300 20,240 5,060
710 Cleaning Labour - - -
725 Staff Amenities Other 100 100 -
775 Travel & Accommodation
Domestic Other 500 500 -
785 Maintenance Provision Consumables 10,756 10,756 -
Note: The total value presented above does not match the financial model as received. A formula error in the calculation of salary on costs inflates the budgeted amount by approximately AUD28k per month. However, the budget does not clearly identify if one or two metallurgical personnel are allowed for. There are currently two on site.
Whist the overall budget is aligned with previous operating costs for June 2008 to September 2008, there are some areas which suggest sustainable costs may be higher than the actual costs for that period. These are:
There is no clear allowance for large costs such as mill relines clearly identified. This cost, and the associated downtime, is not spread evenly across the year and should be clearly shown. Approximately half of the maintenance consumables cost is captured as a single allowance of AUD1/t feed rate for each of the crushing of milling areas.
There are some areas where the costs allowed for are clearly low. For example, only AUD200/month has been allowed for cyclone parts. Cyclones are a high wear item and, whist the site cyclones are small, parts generally cost more than AUD200 each.
Overall, the maintenance budget is considered very low and not well prepared. As such, the likelihood of it being accurate is low. It is suggested that the maintenance budget allowance be doubled until such time as the plant running at steady state above 4,000 t/m. This will add approximately 10% (or AUD5/t) to the total processing cost. Whilst this is a simplistic approach, it will at least ensure there is a more realistic funding allowed for in the financial model.
Reagent unit costs appear reasonable. Key reagent consumptions are shown in Table 14-6. It was not possible to verify these against plant operating data. However, consumptions are generally reasonable. SRK recommend that particular attention should be paid to lime and cyanide consumption as these are the two largest cost reagents. Plant trials or testwork should be regularly undertaken to try and minimise consumption.

SRK Consulting │ PLI003 Costerfield - Mandalay Resources NI 43-101 Technical Report 14 May 2010
SRK Consulting (Australasia) Pty Ltd RALE/SOMM/DUPL/DUTO/MULL/wulf PLI003_Costerfield_Augusta_RR_Audit_NI 43-101_Technical_Report_Rev3 │14-10
Table 14-6: Key reagent consumption rates
Reagent Consumption
(kg/t or L/t as appropriate)
Mill balls 1.3
Xanthate 0.14
Flocculant 0.13
Frother 0.2
Lead Nitrate 0.4
Carbon (tailings retreatment) 0.03
Caustic (tailings retreatment) 0.13
Hydrochloric acid (tailings retreatment) 0.08
SMBS (tailings retreatment) 0.75
Copper sulphate (tailings retreatment) 0.25
Lime (tailings retreatment) 1.50
Cyanide (tailings retreatment) 1.30
The site process flow diagram shows lead nitrate being added to the leach circuit for the tailings retreatment. This is not included in the budget. The addition of lead nitrate to cyanide leaching has been trialled for other high antimony gold ores. However, most instances refer to leaching of a concentrate rather than a tailings stream with less than 2 g/t gold content. SRK recommends that the economics of adding lead nitrate to the leach circuit be reviewed, by way of plant trial, as soon as possible. Should an economic benefit be shown, then the cost should be included in the budget. Conversely, the addition of lead nitrate should be stopped if not proven to be economic. Other than lead nitrate addition to tailings retreatment, there is no reason to vary any reagent consumption rates included in the financial forecast at this time.
14.5 Metallurgical Testing
The Costerfield operation is an established operation, with operational data available from 2007 through to current day. Operational data is typically the most appropriate data to use for forecasting and budget purposes for similar ore types. New ore types are generally assessed by metallurgical testwork before processing for their suitability and characteristics. Whilst production is ongoing from a single ore source with two lodes, each new level accessed provides an opportunity for a change in the material characteristics.
No metallurgical testing results were available for the upcoming new levels at the time of review (samples have since been reported as taken). To enable improved plant performance and cost control, SRK recommends variability testwork should be conducted on each new level assessed within the mine. The testwork should include, but not be limited to, the following tests:
reagent dose vs. recovery for flotation reagents
grind size vs recovery
crushing and grinding work index determination
gravity gold recovery
With respect to the tailings reclamation and treatment circuit, the following tests should be undertaken on a regular basis.
bottle roll tests for gold recovery, with and without lead carbonate
monthly carbon activity test
Once consistent trends are established from level to level within the mine, it may be possible to reduce the number and range of tests required.

SRK Consulting │ PLI003 Costerfield - Mandalay Resources NI 43-101 Technical Report 14 May 2010
SRK Consulting (Australasia) Pty Ltd RALE/SOMM/DUPL/DUTO/MULL/wulf PLI003_Costerfield_Augusta_RR_Audit_NI 43-101_Technical_Report_Rev3 │14-11
14.6 Processing Risks
The primary ore processed is sourced from one mine with two lodes. The tailing reclamation is from a single storage facility. These consistent feed sources to the respective circuits should generally result in lower risks of metallurgical losses. However, proactive testwork as outlined in Section 14.5 will ensure the operations personnel are best equipped to optimise plant performance.
The key processing risk is the mechanical availability of the plant as discussed in Section 14.7.1. To date the mine has been unable to maintain ore supply at or above the plant production capacity. As such, maintenance downtime is unlikely to stand out as impacting concentrate production. However, the mine is reported to be accessing a new level in the near future, thus increasing the ore supply, and the processing facility may become a bottleneck.
The saleability of the concentrate produced is another significant risk associated with the process. The concentrate is sold as a gold bearing antimony concentrate. Dependant on metal prices, the revenue is roughly equally split between the two metals. It was reported on site that only one smelter has been identified that will pay a credit for the gold content of the antimony concentrate. As such, the project is heavily reliant on the sales agreement with this single company. Whilst there is a long-term sales agreement in place, the reason for the last period of extended plant shutdown was the default of a single client and their refusal to buy concentrate during the recent global financial crisis.
Any additional processing steps that can increase gold removal from the concentrate will significantly reduce the project risk in a number of ways:
A lower / gold free antimony concentrate can be sold to a range of buyers
Gold sold as dore (unrefined bullion) attracts a significant price premium over the value received for gold in concentrate and is readily saleable
The new site metallurgical management are aware of this and intend to investigate means of reducing the gold grade in concentrate and increasing the production of dore and/or gravity gold.
Maintenance issues are directly impacting gold recovery in the tailings retreatment circuit as discussed previously.
14.7 Mechanical and Civil Review
14.7.1 Mechanical
Overall, the mechanical equipment is in fair to good working condition. Implementation of the preventative maintenance plan was limited by the unavailability of staff at the time of the site visit. However, the outstanding maintenance items are reported to have been addressed or are now awaiting delivery of spare parts.
Proper management supervision, data tracking systems, funding for spare parts, tools and skilled labour must be provided to ensure the plant is able to operate in an ongoing manner, or poor maintenance will add to costs and reduce recovery.

SRK Consulting │ PLI003 Costerfield - Mandalay Resources NI 43-101 Technical Report 14 May 2010
SRK Consulting (Australasia) Pty Ltd RALE/SOMM/DUPL/DUTO/MULL/wulf PLI003_Costerfield_Augusta_RR_Audit_NI 43-101_Technical_Report_Rev3 │14-12
14.7.2 Structural and Civil
In general, the structural and civil aspects of the Costerfield plant are in fair to good condition; however there are some areas which are in need of attention to prevent possible environmental incidents and protect equipment. The flotation building is in good condition. Bunding around the mills and leach circuit is generally limited. Some minor capital should be allocated to improving key risk areas.
SRK recommends capital should also be allowed for the construction of a concrete pad for mill two‟s electrical skid, which appears to currently rest directly on the ground. This area was very muddy at the time of inspection and makes the electrical equipment prone to damage by water ingress.
14.8 Tailings Storage
A new tailings facility was recently commissioned. It was unclear what the useful life of this facility will be. There is a disused pit adjacent to the plant, however it was verbally reported that a further resource is expected to exist below the pit. No further discussions on future tailings were undertaken.
14.9 Data Sources
This report is principally based upon:
A site visit to Costerfield operation by Brett Muller for Mandalay Resources on 9 March 2010
Digital data viewed or provided to Simulus by Costerfield and SRK
Discussions with the site metallurgical staff

SRK Consulting │ PLI003 Costerfield - Mandalay Resources NI 43-101 Technical Report 14 May 2010
SRK Consulting (Australasia) Pty Ltd RALE/SOMM/DUPL/DUTO/MULL/wulf PLI003_Costerfield_Augusta_RR_Audit_NI 43-101_Technical_Report_Rev3 │15-1
15. Mineral Resources and Mineral Reserve Estimates (Item 19)
The Mineral Resources Section of this Chapter of the Report has been prepared by Bruce Sommerville, who is a Qualified Person as per the requirements of NI 43-101. The Mineral Reserves Section has been prepared by Chris Raleigh, who is a Qualified Person as per the requirements of NI 43-101. Bruce Sommerville and Chris Raleigh are independent of Mandalay.
15.1 Resource Estimation
Mineral Resources for the Augusta deposit have been developed by Mr Dean Fredericksen of Fredericksen Geological Solutions. SRK has not re-estimated the Mineral Resources for Augusta. SRK has relied on the work of Mr Dean Fredericksen who undertook the estimation of E and W lodes. Mr Fredericksen acted as the Qualified Person for the resources and documented the resource estimates in:
1 Fredericksen, D., 2009a. Costerfield Gold and Antimony Project. Augusta and Brunswick Located in Costerfield, Victoria, Australia. Technical Report pursuant to National Instrument 43-101 of the Canadian Securities Commission Prepared for AGD Mining Pty Ltd.
2 Fredericksen, D., 2009b. Augusta Project Mineral Resource Estimate. Technical Report prepared for AGD Mining Pty Ltd by Fredericksen Geological Solutions.
3 E and W lodes for the basis of the Mineral Resources at Costerfield, Mr Fredericksen, in (2009a) reported Mineral Resource Estimates prepared by Mr Rodney Webster of AMC Consultants for the C and N lodes.
SRK has relied on the documentation provided by Mr Fredericksen.
Modelling of the mineral resource uses a two dimensional approach. This is appropriate given the very thin nature of the deposit in which the minimum mining width is greater than the lode thickness. As such the entire lode thickness is generally mined and processed with little mining selectivity in the across dip direction.
15.1.1 Summary
A Mineral Resource Estimate was established for the Costerfield Project, for the W, E, C & N lodes, as at 31 March 2009. This is presented in Table 4-1.
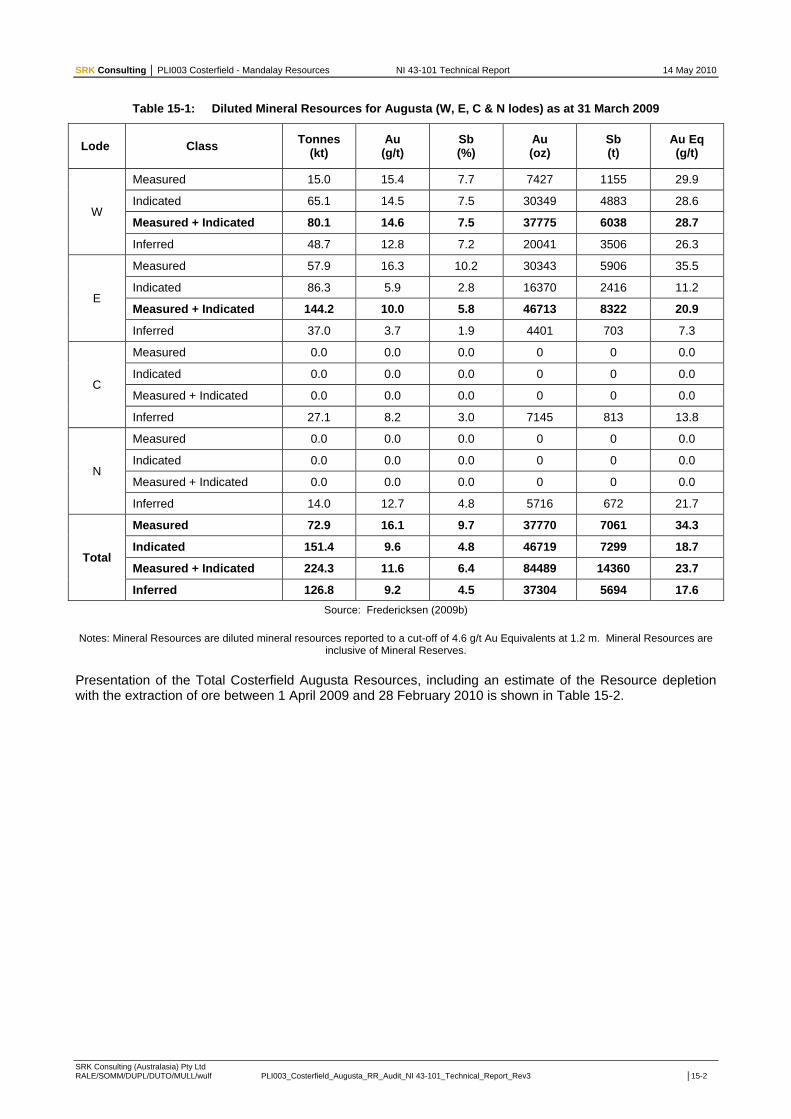
SRK Consulting │ PLI003 Costerfield - Mandalay Resources NI 43-101 Technical Report 14 May 2010
SRK Consulting (Australasia) Pty Ltd RALE/SOMM/DUPL/DUTO/MULL/wulf PLI003_Costerfield_Augusta_RR_Audit_NI 43-101_Technical_Report_Rev3 │15-2
Table 15-1: Diluted Mineral Resources for Augusta (W, E, C & N lodes) as at 31 March 2009
Lode Class Tonnes
(kt) Au
(g/t) Sb (%)
Au (oz)
Sb (t)
Au Eq (g/t)
W
Measured 15.0 15.4 7.7 7427 1155 29.9
Indicated 65.1 14.5 7.5 30349 4883 28.6
Measured + Indicated 80.1 14.6 7.5 37775 6038 28.7
Inferred 48.7 12.8 7.2 20041 3506 26.3
E
Measured 57.9 16.3 10.2 30343 5906 35.5
Indicated 86.3 5.9 2.8 16370 2416 11.2
Measured + Indicated 144.2 10.0 5.8 46713 8322 20.9
Inferred 37.0 3.7 1.9 4401 703 7.3
C
Measured 0.0 0.0 0.0 0 0 0.0
Indicated 0.0 0.0 0.0 0 0 0.0
Measured + Indicated 0.0 0.0 0.0 0 0 0.0
Inferred 27.1 8.2 3.0 7145 813 13.8
N
Measured 0.0 0.0 0.0 0 0 0.0
Indicated 0.0 0.0 0.0 0 0 0.0
Measured + Indicated 0.0 0.0 0.0 0 0 0.0
Inferred 14.0 12.7 4.8 5716 672 21.7
Total
Measured 72.9 16.1 9.7 37770 7061 34.3
Indicated 151.4 9.6 4.8 46719 7299 18.7
Measured + Indicated 224.3 11.6 6.4 84489 14360 23.7
Inferred 126.8 9.2 4.5 37304 5694 17.6
Source: Fredericksen (2009b)
Notes: Mineral Resources are diluted mineral resources reported to a cut-off of 4.6 g/t Au Equivalents at 1.2 m. Mineral Resources are inclusive of Mineral Reserves.
Presentation of the Total Costerfield Augusta Resources, including an estimate of the Resource depletion with the extraction of ore between 1 April 2009 and 28 February 2010 is shown in Table 15-2.

SRK Consulting │ PLI003 Costerfield - Mandalay Resources NI 43-101 Technical Report 14 May 2010
SRK Consulting (Australasia) Pty Ltd RALE/SOMM/DUPL/DUTO/MULL/wulf PLI003_Costerfield_Augusta_RR_Audit_NI 43-101_Technical_Report_Rev3 │15-3
Table 15-2: Estimated Costerfield Resources as at 1-Mar 2010 including Brunswick Vein as estimated by AMC Consultants
Estimated Costerfield Resources as at 1-Mar 2010
Vein kt Au g/t Sb % Au oz Sb t Au Eq oz Au Eq g/t
Augusta W-lode (Fredericksen, 2008)
Measured 15.0 15.4 7.7 7,411 1,153 14,326 29.8
Indicated 65.1 14.5 7.5 30,342 4,881 59,631 28.5
Measured & Indicated 80.1 14.7 7.5 37,753 6,034 73,957 28.7
Inferred 48.7 12.8 7.2 20,057 3,509 41,111 26.2
Augusta E-lode (Fredericksen, 2008)
Measured 57.9 16.3 10.2 30,337 5,905 65,765 35.3
Indicated 86.3 5.9 2.8 16,368 2,416 30,864 11.1
Measured & Indicated 144.2 10.1 5.8 46,705 8,321 96,629 20.8
Inferred 37.0 3.7 1.9 4,405 704 8,626 7.2
Total Augusta Resource W, E ,C and N-lodes (Fredericksen, 2008)
Measured 72.9 16.1 9.6 37,713 6,994 79,678 34.0
Indicated 151.4 9.6 4.8 46,721 7,266 90,317 18.6
Measured & Indicated 224.2 11.7 6.4 84,434 14,260 169,995 23.6
Inferred 85.8 8.9 4.9 24,541 4,202 49,756 18.0
Less Measured and Indicated material mined from W & E-lodes 1-Apr 2009 to 28-Feb 2010 (SRK, 2010)
Measured & Indicated 5.7 7.1 4.3 1,301 245 2,772 15.1
Remaining Measured and Indicated W & E Lode Resource as of 1-Mar 2010 (SRK, 2010)
Measured & Indicated 218.5 11.8 6.4 83,133 14,015 167,223 23.8
Inferred 85.8 8.9 4.9 24,541 4,202 49,756 18.0
N-lode (Frederickson, 2009)
Measured - - - - - -
Indicated - - - - - -
Measured & Indicated - - - - - -
Inferred 14.0 12.7 4.8 5,716 672 9,748 21.7
C-lode (Fredericksen, 2009)
Measured - - - - - -
Indicated - - - - - -
Measured & Indicated - - - - - -
Inferred 27.1 8.2 3.0 7,145 813 12,023 13.8
Remaining Resource Augusta W, E, N & C-lodes
Measured & Indicated 218.5 11.8 6.4 83,133 14,015 167,223 23.8
Inferred 126.9 9.2 4.5 37,402 5,687 71,527 17.5
Brunswick Vein (Webster, 2010) - estimated separately by AMC Consultants
Measured - - - - - -
Indicated 38.3 9.5 3.7 11,698 1,417 20,201 16.4
Measured & Indicated 38.3 9.5 3.7 11,698 1,417 20,201 16.4
Inferred 118.8 6.3 3.8 24,063 4,514 51,149 13.4
Total Costerfield Resources (Augusta W, E, N, C Lodes and Brunswick Vein) as at 1-Mar 2010
kt Au g/t Sb % Au oz Sb t Au Eq oz Au Eq g/t
Measured & Indicated 256.8 11.5 6.0 94,831 15,432 187,424 22.7
Inferred 245.7 7.8 4.2 61,465 10,202 122,676 15.5
Note: It must be noted that the Brunswick Vein Resource has been estimated by AMC Consultants and has not been reviewed by SRK. Mineral Resources are diluted mineral resources reported to a cut-off of 4.6 g/t Au Equivalents at 1.2 m. Mineral Resources are inclusive of Mineral Reserves.

SRK Consulting │ PLI003 Costerfield - Mandalay Resources NI 43-101 Technical Report 14 May 2010
SRK Consulting (Australasia) Pty Ltd RALE/SOMM/DUPL/DUTO/MULL/wulf PLI003_Costerfield_Augusta_RR_Audit_NI 43-101_Technical_Report_Rev3 │15-4
Recent Production
Mine production, as reported by AGD Operations, has been 21.2 kt @ 7.1 g/t Au and 4.3% Sb from 1 April 2009 to 28 February 2010. All production was obtained from the Measured and Indicated Resources for E and W lodes.
With the application of the dilution and loss parameters as presented in Section 15.3.6 the Total Mineral Resources as at 1 March 2010 are therefore estimated to be 218,500 t @ 11.8 g/t Au and 6.4% Sb.
15.1.2 Database
The database used for the estimation of E and W lodes included the drill hole database and face sample database. For C and N lodes only the drill hole database was used.
Fredericksen (2009a) used face samples in the estimate. To justify this, Fredericksen presented Table 15-3 which compares monthly face sample grade data to mill feed sample data. There was no mine production from December 2008 to March 2009, and during this time, the plant was processing stockpile material. The first part of the table shows that the mine grades are significantly higher than the mill, while the second half shows that the mine and mill data compare quite well. Overall, the table shows that the mill grade is lower than the face samples and this represents a risk in the Mineral Resource Estimate.
Table 15-3: Reconciled mine production vs mill production for ore derived from Augusta Mine
Month % Ore types included
Mining Metallurgy
Tonnes Sampled
(g/t)
Sampled Sb (%)
Tonnes Head grade (g/t)
Head grade
(%)
Jul-07 100% HG, 0% LG, 0% StG 2804 10.3 4.9 2594 7.7 3.0
Aug-07 100% HG, 0% LG, 0% StG 2676 11.0 6.4 2493 9.6 4.3
Sep-07 100% HG, 0% LG, 0% StG 1862 16.4 6.1 2663 9.5 4.2
Oct-07 100% HG, 0% LG, 0% StG 2597 12.2 6.0 2634 10.6 4.7
Nov-07 100% HG, 0% LG, 0% StG 2130 14.0 7.8 3056 10.7 5.1
Dec-07 100% HG, 0% LG, 0% StG 2042 13.3 6.3 2893 9.1 4.0
Jan-08 100% HG, 0% LG, 0% StG 3087 13.4 7.0 2720 10.6 4.8
Feb-08 100% HG, 0% LG, 0% StG 2455 11.4 6.4 3810 10.1 5.1
Mar-08 94.3% HG, 5.4% LG, 0.3% StG 5436 7.8 4.3 4434 8.8 4.5
Apr-08 51.7% HG, 30.3% LG, 18% StG 4196 9.1 5.7 5191 6.4 3.9
May-08 50.3% HG, 22% LG, 27.7% StG 3661 10.0 5.2 5365 6.8 3.9
Jun-08 60% HG, 21.6% LG, 18.4% StG 5212 7.0 4.1 4698 6.9 3.8
Jul-08 44.5% HG, 36.5% LG, 19% StG 4493 7.5 4.6 5508 7.0 4.2
Aug-08 63% HG, 19% LG, 18% StG 4498 7.2 4.2 4874 6.3 3.9
Sep-08 54% HG, 30% LG, 16% StG 4736 9.6 6.1 4418 8.5 5.1
Oct-08 67% HG, 15% LG, 17% StG 5055 8.7 5.1 4813 9.8 5.5
Nov-08 54% HG, 27% LG, 19% StG 3182 9.8 6.0 2814 9.1 5.4
Dec-08 95% HG, 5% LG 433 12.9 5.2
Jan-09 54% HG, 46% LG 972 6.5 4.6
Feb-09 95% HG, 5% LG 1,047 5.6 4.9
Mar-09 100% LG 1381 5.8 3.5
YTD 60122 9.8 5.4 68811 8.9 4.5
Source: Fredericksen (2009a)

SRK Consulting │ PLI003 Costerfield - Mandalay Resources NI 43-101 Technical Report 14 May 2010
SRK Consulting (Australasia) Pty Ltd RALE/SOMM/DUPL/DUTO/MULL/wulf PLI003_Costerfield_Augusta_RR_Audit_NI 43-101_Technical_Report_Rev3 │15-5
15.1.3 Compositing
The mineral resources have been estimated as a two-dimensional model. In this case, compositing was carried out so that each lode intersection results in a single intersection. Each lode composite was assigned the following:
Lode name
Thickness (down hole thickness)
True thickness (calculated from the orientation of the deposit and the orientation of the drill hole)
Average Au
Average Sb
Accumulated Au = True Thickness * Average Au
Accumulated Sb = True Thickness * Average Sb
For E Lode, some 628 face sample composites were recorded plus 97 drill holes. For W lode, 285 face sample composites plus 72 drill hole composites.
Composites were assigned a domain name.
Composite statistics from Fredericksen (2009b) are presented in Table 15-4 to Table 15-8.
Table 15-4: Composite statistics for E Lode – Face Composites (domain 10)
Number Min Max Mean CV
Au g/t 573 0.09 413.1 50.34 0.73
Sb % 573 0.11 67.5 27.93 0.5
Thickness m 630 0.01 1.69 0.327 0.68
Au Accumulation 573 0.03 123 15.85 15.7
Sb Accumulation 573 0.007 63.13 9.27 9.1
Source: Fredericksen (2009a)
Table 15-5: Composite statistics for E Lode – Face Composites (domain 11 and 12)
Number Min Max Mean CV
Au g/t 55 3.2 130.5 30.5 0.9
Sb % 55 0.64 62.8 19.96 0.67
Thickness m 65 0.06 2.8 0.83 0.78
Au Accumulation 55 0.35 115.2 21.7 1.05
Sb Accumulation 55 19 63.7 13.9 0.98
Source: Fredericksen (2009a)
Table 15-6 Composite statistics for W Lode – Face Composites
Number Min Max Mean CV
Au g/t 285 0.6 642 64.72
Sb % 285 0.29 67.5 29.1
Thickness m 285 0.01 2.65 0.32
Au Accumulation 285 0.18 182.1 18.8
Sb Accumulation 285 0.04 47.8 9.2
Source: Fredericksen (2009a)
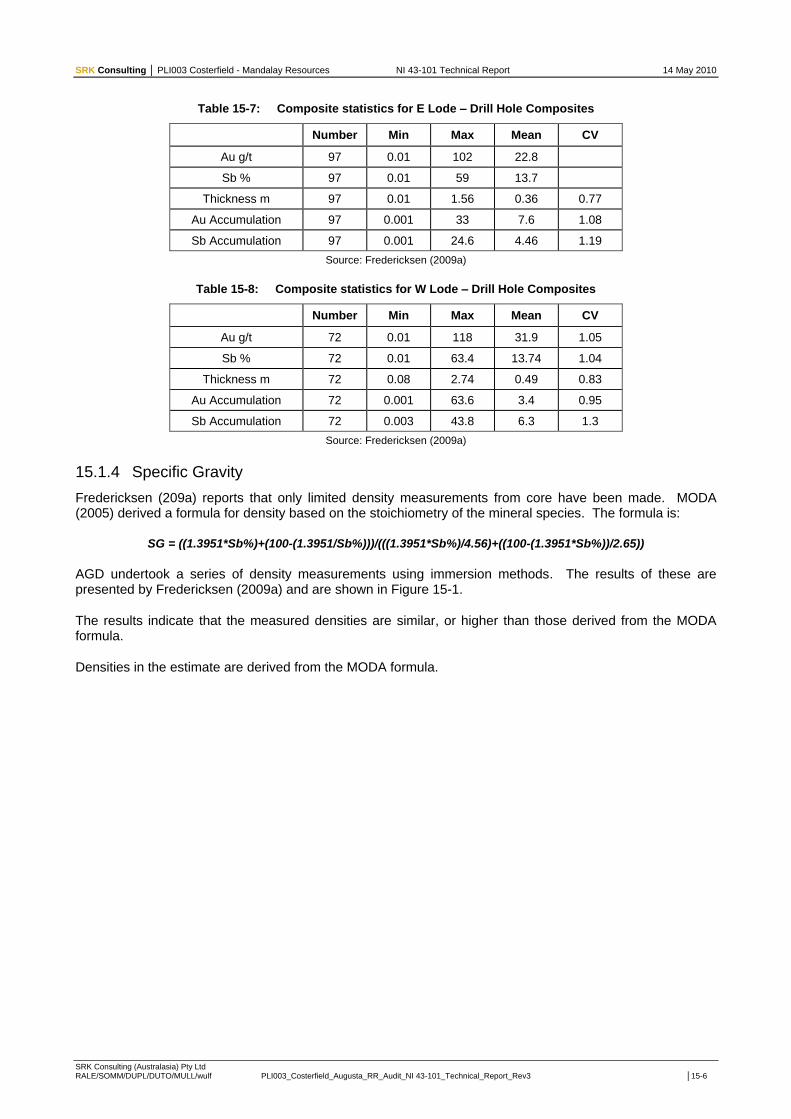
SRK Consulting │ PLI003 Costerfield - Mandalay Resources NI 43-101 Technical Report 14 May 2010
SRK Consulting (Australasia) Pty Ltd RALE/SOMM/DUPL/DUTO/MULL/wulf PLI003_Costerfield_Augusta_RR_Audit_NI 43-101_Technical_Report_Rev3 │15-6
Table 15-7: Composite statistics for E Lode – Drill Hole Composites
Number Min Max Mean CV
Au g/t 97 0.01 102 22.8
Sb % 97 0.01 59 13.7
Thickness m 97 0.01 1.56 0.36 0.77
Au Accumulation 97 0.001 33 7.6 1.08
Sb Accumulation 97 0.001 24.6 4.46 1.19
Source: Fredericksen (2009a)
Table 15-8: Composite statistics for W Lode – Drill Hole Composites
Number Min Max Mean CV
Au g/t 72 0.01 118 31.9 1.05
Sb % 72 0.01 63.4 13.74 1.04
Thickness m 72 0.08 2.74 0.49 0.83
Au Accumulation 72 0.001 63.6 3.4 0.95
Sb Accumulation 72 0.003 43.8 6.3 1.3
Source: Fredericksen (2009a)
15.1.4 Specific Gravity
Fredericksen (209a) reports that only limited density measurements from core have been made. MODA (2005) derived a formula for density based on the stoichiometry of the mineral species. The formula is:
SG = ((1.3951*Sb%)+(100-(1.3951/Sb%)))/(((1.3951*Sb%)/4.56)+((100-(1.3951*Sb%))/2.65))
AGD undertook a series of density measurements using immersion methods. The results of these are presented by Fredericksen (2009a) and are shown in Figure 15-1.
The results indicate that the measured densities are similar, or higher than those derived from the MODA formula.
Densities in the estimate are derived from the MODA formula.

SRK Consulting │ PLI003 Costerfield - Mandalay Resources NI 43-101 Technical Report 14 May 2010
SRK Consulting (Australasia) Pty Ltd RALE/SOMM/DUPL/DUTO/MULL/wulf PLI003_Costerfield_Augusta_RR_Audit_NI 43-101_Technical_Report_Rev3 │15-7
Figure 15-1: Density data compared to calculated value
Source: Fredericksen (2009a)
15.1.5 Variogram Analysis and Modelling
Fredericksen (2009b) details the variography for the deposit. Face sample data and drill hole data were treated separately for variography and grade estimation. Variograms for True Thickness, Accumulated Au and Accumulated Sb were developed.
The following are the variogram parameters as reported by Fredericksen (2009b) are presented in Table 15-9 and Table 15-10.
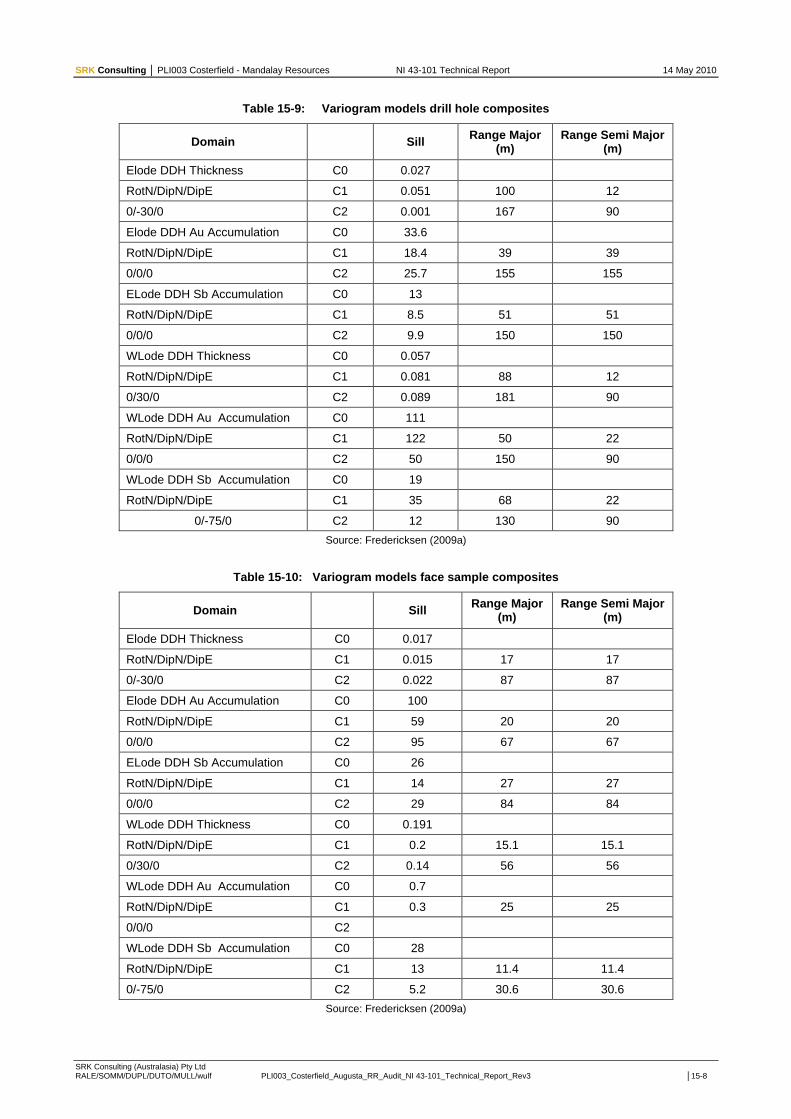
SRK Consulting │ PLI003 Costerfield - Mandalay Resources NI 43-101 Technical Report 14 May 2010
SRK Consulting (Australasia) Pty Ltd RALE/SOMM/DUPL/DUTO/MULL/wulf PLI003_Costerfield_Augusta_RR_Audit_NI 43-101_Technical_Report_Rev3 │15-8
Table 15-9: Variogram models drill hole composites
Domain
Sill Range Major
(m) Range Semi Major
(m)
Elode DDH Thickness C0 0.027
RotN/DipN/DipE C1 0.051 100 12
0/-30/0 C2 0.001 167 90
Elode DDH Au Accumulation C0 33.6
RotN/DipN/DipE C1 18.4 39 39
0/0/0 C2 25.7 155 155
ELode DDH Sb Accumulation C0 13
RotN/DipN/DipE C1 8.5 51 51
0/0/0 C2 9.9 150 150
WLode DDH Thickness C0 0.057
RotN/DipN/DipE C1 0.081 88 12
0/30/0 C2 0.089 181 90
WLode DDH Au Accumulation C0 111
RotN/DipN/DipE C1 122 50 22
0/0/0 C2 50 150 90
WLode DDH Sb Accumulation C0 19
RotN/DipN/DipE C1 35 68 22
0/-75/0 C2 12 130 90
Source: Fredericksen (2009a)
Table 15-10: Variogram models face sample composites
Domain
Sill Range Major
(m) Range Semi Major
(m)
Elode DDH Thickness C0 0.017
RotN/DipN/DipE C1 0.015 17 17
0/-30/0 C2 0.022 87 87
Elode DDH Au Accumulation C0 100
RotN/DipN/DipE C1 59 20 20
0/0/0 C2 95 67 67
ELode DDH Sb Accumulation C0 26
RotN/DipN/DipE C1 14 27 27
0/0/0 C2 29 84 84
WLode DDH Thickness C0 0.191
RotN/DipN/DipE C1 0.2 15.1 15.1
0/30/0 C2 0.14 56 56
WLode DDH Au Accumulation C0 0.7
RotN/DipN/DipE C1 0.3 25 25
0/0/0 C2
WLode DDH Sb Accumulation C0 28
RotN/DipN/DipE C1 13 11.4 11.4
0/-75/0 C2 5.2 30.6 30.6
Source: Fredericksen (2009a)

SRK Consulting │ PLI003 Costerfield - Mandalay Resources NI 43-101 Technical Report 14 May 2010
SRK Consulting (Australasia) Pty Ltd RALE/SOMM/DUPL/DUTO/MULL/wulf PLI003_Costerfield_Augusta_RR_Audit_NI 43-101_Technical_Report_Rev3 │15-9
15.1.6 Grade Estimation
Fredericksen (2009b) reports that a two-dimensional model was constructed. Two separate block models were created:
1 A block model in face sample data area which used a block size of 2.5 m in the northing and 5 m in the RL direction
2 A block model for the diamond drill area, which used a block size of 20 m in the northing and 10 m in the RL
The two separate models were developed because of the different sampling method and the different sample spacing.
Both models used the same model origin at 4000 mN and 900 m RL.
Block estimates for Thickness, Accumulated Au and Accumulated Sb were carried out. For both models ordinary Kriging (OK) was the estimation method used. For both models, kriging neighbourhood analysis was undertaken to provide and optimum search.
In the case of the face sample model, a search ellipse of 60 m in each direction was used. At least four data within the search were required and a maximum number of 15 data. At least one datum was required within 30 m of the block centre.
In the case of the drill hole data model, the search was increased to 120 m (along strike) and 75 m down dip for thickness. A 120 m anisotropic search was used for the accumulations. A minimum of three data and a maximum of five data were required.
Subsequent to estimating thickness and accumulated grades, grades were back-calculated as:
Estimated Au = Estimated Accumulated Au / Estimated Thickness
Estimated Sb = Estimated Accumulated Sb / Estimated Thickness
For each lode, as separate model was developed by combining the face sample model and the drill hole model with the face sample model having priority. For the drill hole model, 8 sub-cells are created with each sub-cell having the same estimated grades.
Densities were assigned to each block using the formula discussed in the previous section.
Tonnages are calculated as:
Undiluted tonnage = 5 m * 2.5 m * Estimated thickness * dip correction * strike correction * density.
Diluted tonnage were estimated by adding a diluting volume out to 1.2 m
Dip and strike correction factors are documented by Fredericksen (2009b) are presented in Table 15-11.

SRK Consulting │ PLI003 Costerfield - Mandalay Resources NI 43-101 Technical Report 14 May 2010
SRK Consulting (Australasia) Pty Ltd RALE/SOMM/DUPL/DUTO/MULL/wulf PLI003_Costerfield_Augusta_RR_Audit_NI 43-101_Technical_Report_Rev3 │15-10
Table 15-11: Dip and strike correction factors
Domain Dip (-ve) Strike Dip correction
Strike correction
E Lode 10 59 332 1.1666 1.1325
E Lode 11 54 352 1.236 1.0098
E Lode 12 72 353 1.0514 1.0075
E Lode 13 64 350 1.1126 1.0154
E Lode 14 58 3 1.1791 1.00137
E Lode 15 65 350 1.10337 1.0154
E Lode 16 63 357 1.1223 1.001372
E Lode 17 73 357 1.0459 1.001372
W Lode 21 46 350 1.0154 1.39
W Lode 22 49 355 1.0038 1.32
W Lode 23 71 10 1.0154 1.0576
W Lode 24 49 359 1.0015 1.32
W Lode 25 61 10 1.0154 1.143
W Lode 26 43 13 1.0263 1.466
W Lode 27 52 358 1.0006 1.269
W Lode 28 64 348 1.0223 1.112
Source: Fredericksen (2009a)
15.1.7 Resource Classification
Fredericksen‟s (2009b) classification of the deposit has been reviewed by SRK. The Mineral Resource within the developed mine area has been classified as Measured. This is based on very close-space data informing both the grade and thickness of the deposit. Indicated Resources are based on 40 x 40 m spaced drilling.
15.2 Reserve Estimation
15.2.1 Conversion of Mineral Resources to Mineral Reserves
The Measured and Indicated material in the Mineral Resource is converted to Proven and Probable Mineral Reserves by the application of the Mine Modifying factors of Dilution and Recovery (Ore Loss).
This audit report is prepared in accordance, and is compliant, with the Canadian National Instrument 43-101.
The terminology used in this report is consistent with the Canadian Institute of Mining, Metallurgy and Petroleum (CIM) definition standards on Mineral Resources and Mineral Reserves. The relationship between Mineral Resources and Mineral Reserves is shown in Figure 15-2.

SRK Consulting │ PLI003 Costerfield - Mandalay Resources NI 43-101 Technical Report 14 May 2010
SRK Consulting (Australasia) Pty Ltd RALE/SOMM/DUPL/DUTO/MULL/wulf PLI003_Costerfield_Augusta_RR_Audit_NI 43-101_Technical_Report_Rev3 │15-11
Figure 15-2: CIM relationship between Mineral Resources and Mineral Reserves
The CIM Standards explain the derivation of Mineral Reserves thus:
‘Mineral Reserves are those parts of the Mineral Resources which, after the application of all mining factors, result in an estimated tonnage and grade which, in the opinion of the Qualified Person(s) making the estimates, is the basis of an economically viable project after taking into account all relevant processing, metallurgical, economic marketing, legal, environmental, socio-economic and government factors. Mineral Reserves are inclusive of diluting material that will be mined in conjunction with the Mineral Reserves and delivered to the treatment plant or equivalent facility’.
Descriptions of the cut-off grade calculation and modifying factors are shown in the following sections.
Cut-off Grade
The cut-off for the definition of ore is defined by the Net Revenue per tonne (NRPT) for a block of ore. Details of the cost breakdown of the NRPT are shown in Error! Reference source not found..
Table 15-12: Breakdown of NRPT 1
Activity AUD/t
Drill & Blast 28.67
Load & Haul 21.71
Ground Support 17.75
Services 32.00
Surface Haul to Mill 4.00
Processing Costs 71.00
Selling Expenses 1.40
Salaries & Admin 88.00
Total 264.53

SRK Consulting │ PLI003 Costerfield - Mandalay Resources NI 43-101 Technical Report 14 May 2010
SRK Consulting (Australasia) Pty Ltd RALE/SOMM/DUPL/DUTO/MULL/wulf PLI003_Costerfield_Augusta_RR_Audit_NI 43-101_Technical_Report_Rev3 │15-12
Metal Prices
The prices for gold and antimony are taken as USD1000/oz Au and USD6000/t Sb. With the AUD: USD exchange rate of 0.90, the Au price is AUD1111.11/oz and Sb price is AUD6666.67.
Modifying factors
The applicable Mining Modifying Factors are assessed by:
The consideration of the Measured and Indicated Mineral Resource relating to the extraction designs
The inclusion of the planned dilution within the outlines of these proposed designs
The inclusion of the unplanned dilution associated with the applied method of extraction
The deduction of the inherent ore losses resulting from the mining processes
15.2.2 Mineral Resources
The Resource Model was verified by Dean Fredericksen of Fredericksen Geological Services, and is dated September 2009. This has subsequently been confirmed by Bruce Sommerville of SRK Consulting, who visited site, inspected the underground operations and the core storage facilities on surface, carried out the required inspections and tests, and reviewed the necessary documentation.
The summary of the Mining Resource is shown in Table 15-1.
15.2.3 Planned Dilution
With the narrow-vein nature of the Augusta orebodies, the required access development results in the inclusion of significant waste or low-grade material in the extraction design of these stopes. This is considered to be necessary, therefore planned, additional waste material that must be mined in order to extract the orebody. As this Planned Dilution is outside the ore boundaries, it is taken as having zero grade.
Planned dilution in the cut and fill areas is a function of orebody width versus drive width. Most of the calculation to work out planned dilution is completed using scripts in Mine2-4D. This process has been detailed in Figure 15-3.

SRK Consulting │ PLI003 Costerfield - Mandalay Resources NI 43-101 Technical Report 14 May 2010
SRK Consulting (Australasia) Pty Ltd RALE/SOMM/DUPL/DUTO/MULL/wulf PLI003_Costerfield_Augusta_RR_Audit_NI 43-101_Technical_Report_Rev3 │15-13
Figure 15-3: Planned and Unplanned Dilution
Source: Mining Plus, 2010
15.2.4 Unplanned Dilution
Inherent in the mining process, and as a result of the extraction of this form of underground deposit, a quantity of additional material, in excess of that designed to be broken, must be removed to recover the desired valuable material. This is considered to be „Overbreak‟ or „Unplanned Dilution‟ as shown in Figure 15-3.
The quantity of this „Unplanned Dilution‟ varies according to the rock characteristics and the drilling and blasting practice.
15.2.5 Ore Loss
It is possible that there will be a quantity of ore, which has been drilled and blasted as per the mine design that will not be recovered from the mining face. This is estimated at 4,825 t. In addition, there is material that will be lost in pillars. This amounts to 10,396 t.
This quantity of „Ore Loss‟ or „Mining Recovery‟ is dependent on the mine design and rock conditions, equipment parameters and time factors.
The first sill drive on a level has been given a mining recovery of 100% as this is a full-face development heading. For subsequent levels, the mining recovery is 95% to allow for some ore loss during blasting and bogging of waste fill.

SRK Consulting │ PLI003 Costerfield - Mandalay Resources NI 43-101 Technical Report 14 May 2010
SRK Consulting (Australasia) Pty Ltd RALE/SOMM/DUPL/DUTO/MULL/wulf PLI003_Costerfield_Augusta_RR_Audit_NI 43-101_Technical_Report_Rev3 │15-14
15.2.6 Mineral Reserve Estimate
The estimate of the resultant Mineral Reserve is therefore determined by the consideration of the Mineral Resource within the mining shapes, with the application of the planned dilution, unplanned dilution and mining recovery (ore loss) plus consideration of the Modifying Factors.
The Mineral Resource within the mining outlines, as extracted from the Mine 2-4D design carried out by Mining Plus, in the Measured and Indicated Resource categories only, total 20,496 t of ore at 46.6 g/t Au and 25.2% Sb, containing 30,700 oz Au and 5,200 tonnes Sb.
The Measured and Indicated mined tonnes include Planned Dilution of 39536 t at zero grade. This therefore totals 60,032 t at 15.9 g/t Au and 8.6% Sb containing the same 30,700 oz Au and 5,200 tonnes Sb. The Planned Dilution is 65.8%.
When this ore is extracted, it will also contain the Unplanned Dilution from fall-off and overbreak. This totals 10,369 t at zero grade and averages 14.7%.
The ore that is lost in the mining process plus the ore remaining in unrecoverable pillars totals 4,825 t at 20.3g/t Au and 11.5% Sb. This Ore Loss averages 7.4%.
The total Load and Haul tonnes, or Mining Reserve, having taken into account the Planned and Unplanned Dilution plus the Recovery (Ore Loss) factors is 65,576 t at 13.1 g/t Au and 7.0% Sb.
The detail of the transition from Mineral Resource to Mineral Reserve is presented in Table 15-13.
Table 15-13: Summary of Transition including Dilution and Ore Loss
Mining Production Results
Classification Tonnes Au Grade
(g/t) Sb Grade
(%) Au Metal
(ozs) Sb Metal
(t)
Lode Tonnes Measured 8901 46.2 26.8 13,221 2,385
Lode Tonnes Indicated 11595 47 24.1 17,521 2,794
Lode Tonnes M&I 20496 46.6 25.2 30,742 5,180
Mined Tonnes Measured 20561 20 11.6 13,221 2,385
Mined Tonnes Indicated 48138 11.3 5.8 17,489 2,792
Planned Dilution 48203 0 0 0 0
Mined Tonnes M&I 68699 13.9 7.5 30,710 5,177
Diluted Tonnes Measured 24516 16.8 9.7 13,242 2,378
Diluted Tonnes Indicated 55939 9.7 5 17,445 2,797
Unplanned Dilution 11755 0 0 0 0
Diluted Tonnes M & I 80455 11.9 6.4 30,687 5,175
Bogged Tonnes Measured 20130 16.9 9.7 10,938 1,953
Bogged Tonnes Indicated 45445 11.4 5.8 16,656 2,636
Recovery and Ore Loss in Pillars 4825 20.3 11.5 3,149 555
Bogged Tonnes M&I 65576 13.1 7.0 27,594 4,588
Source: Mining Plus, 2010

SRK Consulting │ PLI003 Costerfield - Mandalay Resources NI 43-101 Technical Report 14 May 2010
SRK Consulting (Australasia) Pty Ltd RALE/SOMM/DUPL/DUTO/MULL/wulf PLI003_Costerfield_Augusta_RR_Audit_NI 43-101_Technical_Report_Rev3 │15-15
The resultant summary of the Mineral Reserve is shown in Table 15-14.
Table 15-14: Summary of Mineral Reserve as at 1 March 2010
Ore (t)
Au (g/t)
Sb (%)
Au (ozs)
Sb (t)
Proven Reserve 20,130 16.9 9.7 10,938 1,953
Probable Reserve 45,445 11.4 5.8 16,656 2,636
Proven & Probable 65,575 13.1 7.0 27,594 4,588
Source: Mining Plus, 2010
SRK considers that this estimate of the Mineral Reserve is unlikely to be affected by the social, legal, title and marketing modifying factors. There is a risk that environmental issues may impact on the mine operating results.

SRK Consulting │ PLI003 Costerfield - Mandalay Resources NI 43-101 Technical Report 14 May 2010
SRK Consulting (Australasia) Pty Ltd RALE/SOMM/DUPL/DUTO/MULL/wulf PLI003_Costerfield_Augusta_RR_Audit_NI 43-101_Technical_Report_Rev3 │16-1
16. Other Relevant Data and Information (Item 20) SRK is not aware of any other Relevant Data or Information that has not been included in this document.

SRK Consulting │ PLI003 Costerfield - Mandalay Resources NI 43-101 Technical Report 14 May 2010
SRK Consulting (Australasia) Pty Ltd RALE/SOMM/DUPL/DUTO/MULL/wulf PLI003_Costerfield_Augusta_RR_Audit_NI 43-101_Technical_Report_Rev3 │17-1
17. Additional Requirements for Development Properties and Production (Item 25)
17.1 Mining Operations
The mining operations at the Augusta mine have been developed utilizing decline access from surface with the boxcut and portal located in close proximity to the mine infrastructure in suitable quality material.
17.1.1 Geotechnical Considerations
The geotechnical considerations documented here are based on a literature review of the ground control management plan (GCMP) and selected consultants‟ reports, interviews with mine personnel and observations made during an underground visit.
The following reports were reviewed:
AGD Costerfield Augusta Mine, Ground Control Management Plan, Version #4 (29/09/2008)
Preliminary Geotechnical Assessment – Trial Stoping of Augusta Mine, November 2007, MiningOne Pty Ltd
Augusta Gold-Antimony Mine Geotechnical Review – March 2007, Kevin Rosengren and Associates (Draft Report)
Augusta Gold-Antimony Mine Geotechnical Review – June 2006, Kevin Rosengren and Associates
17.1.2 Geotechnical Characterisation
Limited rockmass classification data is available for the Augusta underground operation. The current database is limited to mapping data from selected mining faces and is not adequate for proper geotechnical characterisation. The mine‟s rock mechanics engineer currently performs geotechnical face mapping of development headings, but no formal database is kept for the construction of a geotechnical domain model. MiningOne collected geotechnical data from selected mining faces in 2007 for use in an empirical stope design. This data set, although limited, suggest poor rockmass conditions (mean Q value ranging between 2.0 and 4.2) for the hangingwall and ore body.

SRK Consulting │ PLI003 Costerfield - Mandalay Resources NI 43-101 Technical Report 14 May 2010
SRK Consulting (Australasia) Pty Ltd RALE/SOMM/DUPL/DUTO/MULL/wulf PLI003_Costerfield_Augusta_RR_Audit_NI 43-101_Technical_Report_Rev3 │17-2
Figure 17-1: Augusta rockmass classification
The hangingwall is generally weak and prone to blast induced damage. The majority of hangingwall failures are structurally controlled and gravitational driven. Up to four joint sets are present in the hangingwall.
17.1.3 Structural Geology
The “Mud fault” is a major shear structure that intersects the orebody and consists of a 2 – 6 m weak zone of clayey material. This structure is prone to unravelling when the fault zone is wet, resulting in a rockfall risk when water accumulates in close proximity to the structure. The mine currently does not have a dewatering strategy in place to ensure dry mining conditions.
Ground conditions around this structure are poor hence, the strategy of the mine to increase the support density while developing through it. The location of this structure is well known, thereby allowing engineers to plan for possible production delays and poor ground conditions during development.
17.1.4 Stope Design Parameters
Initial geotechnical studies indicated that longhole open stoping was a possibility at the mine. During stoping trials, it was found that the hangingwall was much weaker than anticipated and that cut-and-fill stoping would be more appropriate to suit the ground conditions and prevent large-scale falls of ground.
The mining engineer and rock mechanics engineer keeps an informal record of stope failures and successes. This data is invaluable for future mine design and should be properly documented and analysed to establish site-specific stope design criteria.
Short-term stope planning is addressed on a case-by-case basis and a formal risk assessment is completed for each stope based on the available geotechnical data.
Au
gu
sta
An
tim
on
y a
nd
Go
ld P
roje
ct -
Ro
ckm
ass
Cla
ssif
ica
tio
n

SRK Consulting │ PLI003 Costerfield - Mandalay Resources NI 43-101 Technical Report 14 May 2010
SRK Consulting (Australasia) Pty Ltd RALE/SOMM/DUPL/DUTO/MULL/wulf PLI003_Costerfield_Augusta_RR_Audit_NI 43-101_Technical_Report_Rev3 │17-3
17.1.5 Ground Conditions and Ground Support
Minimum ground support in the decline comprises 2.4 m long resin bolts and 1.8 m long splitsets which appears to be adequate for the decline. Ore drives are developed with minimum dimensions due to the poor rockmass conditions. Primary ground support consists of splitsets and mesh with additional resin anchored bolts as required.
A photograph of typical ground conditions and ground support is shown as Figure 17-2.
Figure 17-2: Typical ground conditions and ground support in ore drives
17.1.6 Mine Development
The development of the operation is achieved by the establishment first of the decline access or capital development and subsequently with the ore and waste level or operating development. In addition, there is a quantity of ancillary development to complete the appropriate extraction development.
The development and stoping outlines are shown in Figure 17-3.

SRK Consulting │ PLI003 Costerfield - Mandalay Resources NI 43-101 Technical Report 14 May 2010
SRK Consulting (Australasia) Pty Ltd RALE/SOMM/DUPL/DUTO/MULL/wulf PLI003_Costerfield_Augusta_RR_Audit_NI 43-101_Technical_Report_Rev3 │17-4
Figure 17-3: Long section showing all stopes and development
Source: Mining Plus, 2010
17.1.7 Decline Development
Access to the underground mine is achieved through the 4.5 m wide by 4.5 m high decline that has been mined at a gradient of 1 in 7 to a current depth of approximately 100 m below surface at the 1070 m RL.
The decline (capital development) is being advance currently at a rate average 30 m per week with a view to establishing an increased number of production horizons thereby ensuring ongoing production flexibility.
The schedule for the decline development requires this progress to continue until the decline is positioned such that access is most economically achieved to both the East and West lodes.
Figure 17-4 is an isometric view of all the stoping areas plus development on the East and West lodes.
17.1.8 Level Development
The level development is now established at 20 m vertical intervals.
With the introduction of the new narrow loaders the development width is being reduced to a width of 1.5m from 1.8m which results in a 16% reduction in waste from the stoping drive development.
17.1.9 Production
With the two parallel lodes (E & W) striking north-south and dipping at an angle of approximately 70°, the extraction sequence is scheduled such that there is no interference.
The East and the West lode stope are shown in Figure 17-5 and Figure 17-6.
An isometric view of the Cut & Fill stoping area in virgin territory is included in Figure 17-7 Figure 17-17.

SRK Consulting │ PLI003 Costerfield - Mandalay Resources NI 43-101 Technical Report 14 May 2010
SRK Consulting (Australasia) Pty Ltd RALE/SOMM/DUPL/DUTO/MULL/wulf PLI003_Costerfield_Augusta_RR_Audit_NI 43-101_Technical_Report_Rev3 │17-5
Figure 17-4: Isometric view of stoping and development on the East and West lodes
Source: Mining Plus, 2010
Figure 17-5: Long section of W lode stopes
Source: Mining Plus, 2010
W Lode
E Lode
As-built W Lode wireframes
W Lode remnants airleg uphole
stope wireframes (grey)
W Lode remnants cut and fill wireframes
(green)
Surface Box Cut

SRK Consulting │ PLI003 Costerfield - Mandalay Resources NI 43-101 Technical Report 14 May 2010
SRK Consulting (Australasia) Pty Ltd RALE/SOMM/DUPL/DUTO/MULL/wulf PLI003_Costerfield_Augusta_RR_Audit_NI 43-101_Technical_Report_Rev3 │17-6
Figure 17-6: Long section of E lode stopes
Source: Mining Plus, 2010
Figure 17-7: Isometric view of Cut & Fill in the virgin area of Augusta
Source: Mining Plus, 2010
17.2 Services
The major services necessary to achieve the mine production targets include the ventilation of the underground mine, the dewatering system, the power supply and the equipment necessary to optimize production. The equipment requirement for these major services is in addition to the development and production drills and the loaders and trucks required for rock handling.
17.2.1 Ventilation
17.2.1.1 Current Status
The intake air to the mine is provided by the decline and a 132 kW fan in the boxcut forcing air onto 1L and 2L. Further 75 kW fans feed 3L, 4L and 5L. In addition, there is a fan feeding 6L, 7L and the decline.
The internal ventilation raises upcast the return air in hand-mined and long hole-drilled raises to complete the circulation of the air through the mine, returning the air to the 1L main return fan.
As-built E Lode wireframes
E Lode remnants airleg uphole
stope wireframes (grey)
E Lode remnants cut and fill wireframes
(green)
Surface Backfilled Pit
1020 Level
1040 Level
1060 Level

SRK Consulting │ PLI003 Costerfield - Mandalay Resources NI 43-101 Technical Report 14 May 2010
SRK Consulting (Australasia) Pty Ltd RALE/SOMM/DUPL/DUTO/MULL/wulf PLI003_Costerfield_Augusta_RR_Audit_NI 43-101_Technical_Report_Rev3 │17-7
This ventilation return circuit is completed with the aid of a 110 kW axial flow primary fan exhausting from 1L to surface in a secluded area. The current primary fan is producing 41.9 m
3/s at 273 Pa.
17.2.2 Ventilation Requirements
The ventilation requirement at Augusta based on ventilating air per kilowatt of engine power are out lined in Table 17-1.
Table 17-1: Current equipment and ventilation requirements at 0.05m3/s/kW
Equipment Units Engine Rating
(kW) Ventilation requirements
(m3/s)
Wagner truck 1 224 11.2
Cat R1700 1 270 13.5
Toro 151 4 63 12.6
Total 37.3
Source: Mining Plus, 2010
The current vent system is capable of supply this total quantity of ventilating air. However, a better measure of the effectiveness of the Augusta vent system is to measure the ability of the system to simultaneously ventilate multiple working faces to maintain the production levels in the LOM plan. Secondary ventilation is managed on a shift basis to allow 4 airleg headings being mined, 2 headings being bogged and the decline to be worked simultaneously.
Changes to equipment in the LOM Plan will see a reduction in ventilating requirements due to the use of the smaller Aramine loaders, which have a 43 kW engine.
17.2.3 Ventsim Modelling
Ventsim modeling was undertaken to confirm the current ventilation status and to test the future ventilation circuit for life of mine. The Ventsim criteria appear in Table 17-2. Screenshots from the Ventsim model are included in Figure 17-8, Figure 17-9 and Figure 17-10.
The Ventsim model was built up from the current as built survey information and the mine design. The as built areas were attributed using actual as built profile and size. The designed areas were attributed according to design size and profile (outlined in general mine layout).
The available fan curve for the exhaust fan was unclear but the blade angle was deduced from the current underground ventilation survey. Curves for pitch angles of 16 and 19° were constructed and modeled and the 16° curve best match the current ventilation system. The fan has been set up to operate at a relatively low pressure therefore appears to quite easily handle the extension of the system. There are leaks present at several locations in the mine that could be fixed to improve the total volume of air that reached the bottom return. The total air loss in the system is 17.2 m
3/s between the portal and the bottom return, therefore only
24.7 m3/s reaches the bottom return at present.
The underground magazine currently has dedicated return ventilation of approximately 4.2 m3/s. Methods of
ventilating the magazine could be investigated which allow the magazine to be ventilated using secondary means with an automated ventilation system being available in case of emergency. An over-cast has been constructed to access the magazine area which is represented by the magazine development ramping over the return airway development with a fixed length. The magazine ventilation consists of a duct that is connected to the return airway at the overcast.

SRK Consulting │ PLI003 Costerfield - Mandalay Resources NI 43-101 Technical Report 14 May 2010
SRK Consulting (Australasia) Pty Ltd RALE/SOMM/DUPL/DUTO/MULL/wulf PLI003_Costerfield_Augusta_RR_Audit_NI 43-101_Technical_Report_Rev3 │17-8
Table 17-2: Ventilation modelling - Ventsim criteria
Airway Name Design Profile Width
(m) Height
(m) Area (m
2)
Diameter (m)
Decline 4.5 m x 4.5 m Arched 4.5 4.5 19
Vent Acc 3.0 m x 3.0 m Arched 3.0 3.0 8.4
Vent Rise 1 3.0 m Round 7.1 30
Vent Rise 2 2.4 m Square 2.4 2.4 5.8
Vent Rise 3 2.1 m Square 2.1 2.1 4.4
Source: Mining Plus, 2010
Figure 17-8: Plan view of current ventilation system
Source: Mining Plus, 2010
Portal
Simulated Magazine
Overcast

SRK Consulting │ PLI003 Costerfield - Mandalay Resources NI 43-101 Technical Report 14 May 2010
SRK Consulting (Australasia) Pty Ltd RALE/SOMM/DUPL/DUTO/MULL/wulf PLI003_Costerfield_Augusta_RR_Audit_NI 43-101_Technical_Report_Rev3 │17-9
Figure 17-9: Long section of current ventilation system
Source: Mining Plus, 2010
Figure 17-10: Long section view of future ventilation system
Source: Mining Plus, 2010
Portal
Surface Return Exit
Portal
Current Bottom
Return

SRK Consulting │ PLI003 Costerfield - Mandalay Resources NI 43-101 Technical Report 14 May 2010
SRK Consulting (Australasia) Pty Ltd RALE/SOMM/DUPL/DUTO/MULL/wulf PLI003_Costerfield_Augusta_RR_Audit_NI 43-101_Technical_Report_Rev3 │17-10
17.2.4 Pumping
17.2.4.1 Current System
The current pumping system is a series system utilizing 18 kW face pumps and one helical rotor pump. The helical rotor pump is an E64 that can pump 7 l/s up to 240 m total head. This pump is located at the 5 level and is fed from the lower mine. The current pumping system is shown in Figure 17-11.
The current site water balance suggests that the dewatering quantity from underground is approximately 2 l/s. The system is capable of pumping far greater than this but cannot cope with rain events. The other issue with the current system is the reliance on 18 kW pumps in series. If one 18 kW pump fails then the whole system is down. Once the pump is replaced, there is still a period of time where the system is required to catch up to steady state.
In addition to the underground pumping system, water is removed from the old South Costerfield Shaft using a borehole pump, which reduces the amount of ground water that reaches Augusta.
Figure 17-11: Site water schematic
Source: Mining Plus, 2010

SRK Consulting │ PLI003 Costerfield - Mandalay Resources NI 43-101 Technical Report 14 May 2010
SRK Consulting (Australasia) Pty Ltd RALE/SOMM/DUPL/DUTO/MULL/wulf PLI003_Costerfield_Augusta_RR_Audit_NI 43-101_Technical_Report_Rev3 │17-11
Figure 17-12: Schematic of current dewatering system
Source: Mining Plus, 2010
17.2.4.2 Future Expansion
A new WT084 helical rotor type pump will be installed at the 1040 Level to pump directly to surface. The WT104 will be capable of pumping 12 l/s up to 240 total head. After a period of commissioning, the old system will be decommissioned and all water above the 1040 Level will be gravity fed to the primary pumping station. All water below the 1040 Level will be stage pumped up to the settling sumps at the 1040 Level to be pumped to surface. The planned LOM pumping schematic is shown in Figure 17-13. The new system will be more capable of catching up after a rain event and will be less reliant on 18 kW Flygt pumps.
NTS

SRK Consulting │ PLI003 Costerfield - Mandalay Resources NI 43-101 Technical Report 14 May 2010
SRK Consulting (Australasia) Pty Ltd RALE/SOMM/DUPL/DUTO/MULL/wulf PLI003_Costerfield_Augusta_RR_Audit_NI 43-101_Technical_Report_Rev3 │17-12
Figure 17-13: Schematic of the LOM dewatering system
Source: Mining Plus, 2010
17.2.5 Power
Electric power is supplied underground from the main grid. The power reticulation system is detailed in Figure 17-14.
Surface

SRK Consulting │ PLI003 Costerfield - Mandalay Resources NI 43-101 Technical Report 14 May 2010
SRK Consulting (Australasia) Pty Ltd RALE/SOMM/DUPL/DUTO/MULL/wulf PLI003_Costerfield_Augusta_RR_Audit_NI 43-101_Technical_Report_Rev3 │17-13
Figure 17-14: LOM plan for the power reticulation system
(Source – Mining Plus, 2010)

SRK Consulting │ PLI003 Costerfield - Mandalay Resources NI 43-101 Technical Report 14 May 2010
SRK Consulting (Australasia) Pty Ltd RALE/SOMM/DUPL/DUTO/MULL/wulf PLI003_Costerfield_Augusta_RR_Audit_NI 43-101_Technical_Report_Rev3 │17-14
There are two substations for the mine - one located on the surface and the other located underground. Details of the loadings on the substations are shown in Table 17-3 and Table 17-4.
Table 17-3: Surface 415V substation loading
Surface 415 Volt 1 MVA 1400 KMPS Substation
Gear Location kW Amps Duty
1000 Volt Sub Surface 362 585 75%
Fan Boxcut 110 180 100%
Fan RAR 75 123 100%
Fan 2 Level 75 123 100%
Fan 5 Level 75 123 100%
Pump 1 Level 24 30 10%
Office Workshop Surface 30 50 60%
Compressor 1 Surface 110 180 60%
Compressor 2 Surface 110 180 60%
Mono 5 Level 37 60 60%
Total 1000 kW 1640 Amp 75%
Source: Mining Plus, 2010
Table 17-4: Underground 1000V substation loading
U/G 415-1000 Volt Substation 500 KVA 288AMP
Gear Location kW Amps Duty
M2D Dill Mobile 150 106 70%
H104 Drill Mobile 75 53 70%
Fan 1070 75 53 100%
Pump 1070 18 13 70%
Pump 1060 18 13 70%
Pump Face 18 13 70%
Total 362 kW 251 Amp 75%
Source: Mining Plus, 2010
17.2.6 Ancillary Equipment
This additional equipment includes light vehicles, road maintenance equipment and mobile maintenance equipment.
17.3 Mining Method
17.3.1 Cut & Fill
17.3.1.1 Mining Method Description and Design Criteria
In order to further optimise the mining process, the method of extraction has been altered to enhance the mining recovery and reduce dilution. The Cut & Fill method is now being employed which has resulted in approximately a 20% reduction in dilution from that resulting from the open stoping method previously employed.
17.3.2 Cut & Fill Parameters
The parameters that must be quantified to establish the efficiency of the Cut & Fill operation are Planned Dilution, Unplanned Dilution and Mining Recovery (Ore Loss).

SRK Consulting │ PLI003 Costerfield - Mandalay Resources NI 43-101 Technical Report 14 May 2010
SRK Consulting (Australasia) Pty Ltd RALE/SOMM/DUPL/DUTO/MULL/wulf PLI003_Costerfield_Augusta_RR_Audit_NI 43-101_Technical_Report_Rev3 │17-15
17.3.2 Cut & Fill Parameters
The parameters that must be quantified to establish the efficiency of the Cut & Fill operation are Planned Dilution, Unplanned Dilution and Mining Recovery (Ore Loss).
Planned Dilution
Planned dilution in the cut and fill areas is a function of orebody width versus drive width.
Unplanned Dilution
Unplanned dilution has been included to account for drive overbreak during mining, and fall off due to structure. This figure is measured and documented onsite by the survey department. The total unplanned dilution for all development and flat backing is currently at 16%, as shown in Table 17-5.
Table 17-5: Recent history of Unplanned Dilution
Dimensions Metres
Volume Overbreak
Width Height Area Design Actual Difference
October 2009 1.8 2.8 5.0 47 235 279 44 119%
November 2009 1.8 2.8 5.0 80 401 470 69 117%
December 2009 1.8 2.8 5.0 68 342 392 50 115%
January 2010 1.8 2.8 5.0 22 112 132 20 117%
February 2010 1.8 2.8 5.0 94 438 494 56 113%
Total 1.9 2.8 5.4 312 1528 1766 238 116%
Source: Mining Plus, 2010
Mining Recovery (Ore Loss)
The first sill drive on a level has been assigned a mining recovery of 100% as this is a full-face development heading. For subsequent levels, the mining recovery is 95% to allow for ore loss during blasting and bogging of waste fill.
17.3.3 Uphole Airleg Stoping
This mining method has been applied to areas of the upper mine to recover remaining ore on already developed levels, and also to the crown pillar recovery in the cut and fill areas. Approximately 9% of all stoping in the LOM plan is uphole airleg stoping.
17.3.4 Mining Method Description and Design Criteria
Uphole airleg stoping is currently being used onsite with a high degree of success. The current design criteria for the mining method allows for increases in stope strike dependent upon stope performance on a particular level. Figure 17-15 shows the excavation sequence of uphole airleg stoping. The general sequence is to take a 1.2 m airleg rise cut on the access side of the stope with nominal dimension of 0.6 x 0.6 m (unless ore width is greater than this). Once this has been fired, a second rise cut is taken the same dimension 2.4 m long. This gives a final maximum rise length of 3.6 m. The airleg miner then bores a single row of blast holes along the orebody to the strike length of the stope to 3 m high.
At present, uphole airleg stope strike is 4 m, with a 2 m rib pillar between stopes. The stope is then fired towards the access minimising the need for remote bogging. Additionally, prior to firing, a waste bund is also placed in the stope to help ensure fired rock is able to be bogged manually.
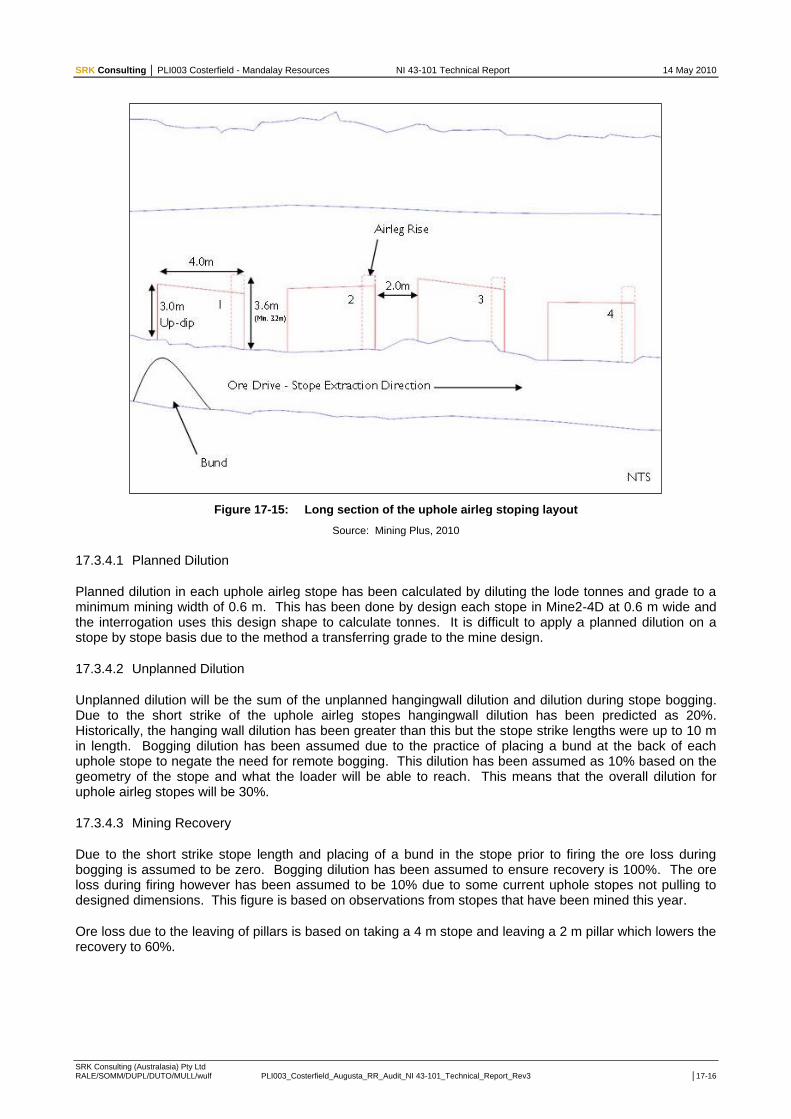
SRK Consulting │ PLI003 Costerfield - Mandalay Resources NI 43-101 Technical Report 14 May 2010
SRK Consulting (Australasia) Pty Ltd RALE/SOMM/DUPL/DUTO/MULL/wulf PLI003_Costerfield_Augusta_RR_Audit_NI 43-101_Technical_Report_Rev3 │17-16
Figure 17-15: Long section of the uphole airleg stoping layout
Source: Mining Plus, 2010
17.3.4.1 Planned Dilution
Planned dilution in each uphole airleg stope has been calculated by diluting the lode tonnes and grade to a minimum mining width of 0.6 m. This has been done by design each stope in Mine2-4D at 0.6 m wide and the interrogation uses this design shape to calculate tonnes. It is difficult to apply a planned dilution on a stope by stope basis due to the method a transferring grade to the mine design.
17.3.4.2 Unplanned Dilution
Unplanned dilution will be the sum of the unplanned hangingwall dilution and dilution during stope bogging. Due to the short strike of the uphole airleg stopes hangingwall dilution has been predicted as 20%. Historically, the hanging wall dilution has been greater than this but the stope strike lengths were up to 10 m in length. Bogging dilution has been assumed due to the practice of placing a bund at the back of each uphole stope to negate the need for remote bogging. This dilution has been assumed as 10% based on the geometry of the stope and what the loader will be able to reach. This means that the overall dilution for uphole airleg stopes will be 30%.
17.3.4.3 Mining Recovery
Due to the short strike stope length and placing of a bund in the stope prior to firing the ore loss during bogging is assumed to be zero. Bogging dilution has been assumed to ensure recovery is 100%. The ore loss during firing however has been assumed to be 10% due to some current uphole stopes not pulling to designed dimensions. This figure is based on observations from stopes that have been mined this year.
Ore loss due to the leaving of pillars is based on taking a 4 m stope and leaving a 2 m pillar which lowers the recovery to 60%.

SRK Consulting │ PLI003 Costerfield - Mandalay Resources NI 43-101 Technical Report 14 May 2010
SRK Consulting (Australasia) Pty Ltd RALE/SOMM/DUPL/DUTO/MULL/wulf PLI003_Costerfield_Augusta_RR_Audit_NI 43-101_Technical_Report_Rev3 │17-17
17.3.5 Blasthole Stoping
The open stoping method of extraction has previously been widely employed at Augusta. With issues of ground conditions, orebody dip and width, plus drill accuracy all increasing in frequency, there was a resultant increase in dilution. With the currently successful trial of Cut & Fill mining, approximately 2% of the ore is now planned to be mined by Blasthole Stoping.
The areas of the as built mine that are suitable for conventional blast hole stoping are those where top and bottom access is available and the orebody is located in the existing drive to allow longhole drilling.
The poor historical success of the blasthole stoping method is attributed to several factors, including poor ground conditions in the upper levels of the mine, relatively wide development headings, poor drilling accuracy and lack of good engineering support for blasting and backfilling. Ground conditions are improving at the new lower levels of the mine, and narrow-width LHDs currently on order will permit reduction of development headings to a width of 1.5 m late in the second quarter of 2010. When already approved mechanised blasthole drilling equipment arrives in the third quarter of 2010, drilling accuracy will be improved. When all these improvements are in place, it may be desirable to implement a test blast hole stope with tightly engineered blasting and backfilling, to determine if conditions for feasible and economical implementation of the method are now present.
17.3.5.1 Mining Method Description and Design Criteria
The blastholes stopes have been designed using similar technique to uphole airleg stoping with the exception of stope height and strike. The blasthole stopes are planned to be breakthrough to the level above and have a particular stope strike length. The planned dilution, unplanned dilution and recovery are the same as the uphole airleg stoping method. Blasthole Stope Wireframe Design Parameters
The blastholes stopes have been designed using the same technique as uphole airleg stoping.

SRK Consulting │ PLI003 Costerfield - Mandalay Resources NI 43-101 Technical Report 14 May 2010
SRK Consulting (Australasia) Pty Ltd RALE/SOMM/DUPL/DUTO/MULL/wulf PLI003_Costerfield_Augusta_RR_Audit_NI 43-101_Technical_Report_Rev3 │17-18
Figure 17-16: Cross section of orebody intersecting development
Source: Mining Plus, 2010
17.3.5.2 Unplanned Dilution
Unplanned dilution will be the sum of the unplanned hangingwall dilution and dilution during stope bogging. Due to the short strike of the blast hole stopes hangingwall dilution has been predicted as 20%. Historically, the hanging wall dilution has been greater than this but the stope strike lengths were up to 10 m in length. Bogging dilution has been assumed due to the practice of filling the stope during production to improve hangingwall stability and to negate the need for remote bogging. This dilution has been assumed as 10% based on the geometry of the stope and what the leader will be able to reach. This means to overall dilution for uphole airleg stopes will be 30%.
17.3.6 Mining Recovery
Due to the short strike stope length and continuous backfilling of the stope, the ore loss during bogging is assumed to be zero. Bogging dilution has been assumed to ensure recovery is 100%. However, the ore loss during firing has been assumed to be 10% due to some current uphole stopes not pulling to designed dimensions. This figure is based on observations from stopes that have been mined this year. Ore loss due to leaving pillars is based on taking an 8 m stope and leaving a 2 m pillar, which lowers the recovery to 72%.
Filled floor stripping
Ore Drives
Stope string in cross section
Original HW interpretation wireframe
Orebody wireframe from survey

SRK Consulting │ PLI003 Costerfield - Mandalay Resources NI 43-101 Technical Report 14 May 2010
SRK Consulting (Australasia) Pty Ltd RALE/SOMM/DUPL/DUTO/MULL/wulf PLI003_Costerfield_Augusta_RR_Audit_NI 43-101_Technical_Report_Rev3 │17-19
17.4 Processing
This section of the Report was compiled by Brett Muller, who is a Qualified Person as required by NI 43-101 (see Appendix A).
17.4.1 Metallurgical Performance and Recoverability
Forecast plant performance was received and reviewed in the form of a life of mine financial model. The model inputs for the processing plant were derived by the previous plant manager.
The model began with data from July 2009, making it possible to undertake some analysis of planned versus actual performance. This was completed as a means of forecasting future performance.
Table 17-6 shows the planned versus actual feed tonnes. Actual performance tracked against plan well for July to November. However, the gap between planned and actual tonnes has been increasing consistently since December 2009, in line with an increasing planned tonnage. This suggests that there is little chance of achieving the even greater March planned tonnage. At the time of the site visit on 9 March 2010, there was very little ore on the ROM pad. This highlights that the key issue in the underperformance, is the lack of ore delivery to the ROM pad. However, the higher than historical average throughput also shows that the plant was not without its own issues associated with breakdowns and mechanical failure, or lack of operations personnel to operate the plant.
The planned average throughput for the remainder of the financial model (to Dec-2011) is 4,901 tonnes per month. Should the mine be able to achieve this feed rate and if proper maintenance practices are undertaken, there is no reason to suggest the plant cannot process the material. This is best seen by reviewing the operating data for July to October 2008 when similar tonnes were processed with an average feed rate of approximately 11 t/h versus 15 t/h required in October 2009 to January 2010 to process significantly less tonnes. To meet the proposed budget, SRK recommend that proactive planned maintenance continue to occur and that a review of critical spare parts is undertaken.
Table 17-6: Planned versus actual plant feed tonnes
Month Actual feed
(t) Budget feed
(t)
Jul-2009 2437 2313
Aug-2009 1831 1874
Sep-2009 2602 2468
Oct-2009 1465 1516
Nov-2009 2240 2027
Dec-2009 1813 2102
Jan-2010 2101 2867
Feb-2010 2866 3766
Mar-2010 -- 5378
Table 17-7 shows the planned versus actual antimony feed grade and recovery performance for the same period. The same trend can be seen, with actual grades matching planned grades well to begin with, followed by divergence from late 2009 to present day. Recovery is also seen to dip in January, and likely in February with the increased instantaneous feed rates to the plant. Planned recovery is predicted using a constant tails grade method. This is common and acceptable. The constant tails grade for antimony in the financial model is 0.5%, reducing to 0.3% in March 2010 with the introduction of online analysis. Site personnel reported that a 0.3% tails grade was already being achieved regularly. However, the monthly data does not support this. It is likely that either a sampling bias or more likely short-term significant upsets are the cause of this discrepancy. It is recommended that a tails grade of 0.5% be maintained in the financial model until such time that online analysis has been proven to consistently provide a benefit.

SRK Consulting │ PLI003 Costerfield - Mandalay Resources NI 43-101 Technical Report 14 May 2010
SRK Consulting (Australasia) Pty Ltd RALE/SOMM/DUPL/DUTO/MULL/wulf PLI003_Costerfield_Augusta_RR_Audit_NI 43-101_Technical_Report_Rev3 │17-20
Table 17-7: Planned versus actual antimony grade and recovery
Month Planned Sb grade
(%) Actual Sb grade
(%)
Planned Sb recovery
(%)
Actual Sb recovery (%)
Jul-2009 5.0 5.0 90.0 84.5
Aug-2009 4.6 4.6 89.1 87.3
Sep-2009 5.0 4.8 89.9 84.9
Oct-2009 4.3 3.7 88.3 88.8
Nov-2009 3.8 3.3 86.9 87.6
Dec-2009 3.7 2.7 86.6 85.7
Jan-2010 3.4 5.4 85.5 80.1
Feb-2010 4.4 N/A5 88.7 N/A
Mar-2010 4.2 -- 92.9 --
Table 17-8 shows the same analysis for gold. However, the comparison is quite different. Gold recovery has been consistently below planned recovery for the entire period.
Table 17-8: Planned versus actual gold grade and recovery
Month Planned Au grade
(g/t) Actual Au grade
(g/t) Planned Au recovery (%)
Actual Au recovery (%)
Jul-2009 7.5 7.5 86.7 78.2
Aug-2009 6.4 6.4 84.5 80.1
Sep-2009 6.9 6.8 85.6 76.7
Oct-2009 8.1 7.1 87.7 79.4
Nov-2009 6.2 5.7 83.8 76.2
Dec-2009 6.1 5.1 83.7 67.5
Jan-2010 6.8 9.3 85.2 77.1
Feb-2010 8.4 N/A 88.1 N/A
Mar-2010 9.3 -- 92.5 --
Planned, or forecast gold recovery, is based on a constant tail grade in the life of mine model. This approach is common and acceptable providing the plant stays within a known operating window. However, for the period analysed the constant tail grade chosen appears to be low. The forecast tails grade is reduced from March 2010 onwards due to the implementation of an online analyser, which is yet to be purchased or installed.
Single variable regression analysis of data for the period of July 2009 to January 2010 shows that a constant tail of 1.6 g/t provides a better alignment between predicted and actual plant performance for the period. This is significantly higher than the 1.0 g/t value in the financial model for the period to February 2010 and the 0.7 g/t value from March 2010 onwards. Likewise, analysis of the dataset from July 2008 to February 2010 showed a constant tail of 1.39 g/t provided the best correlation between predicted and actual recovery. The difference between these two predicted values is very likely to be linked to the average instantaneous plant feed rate. However, more analysis and data is required to confirm this. Assuming the plant is able to operate consistently in the future, it is suggested that the constant gold tails grade in the financial model be increased to 1.4 g/t and no improvement for on line analysis be included until a benefit is consistently achieved.
5Reconciliation not completed as of 9 March 2010.
SRK Consulting │ PLI003 Costerfield - Mandalay Resources NI 43-101 Technical Report 14 May 2010
SRK Consulting (Australasia) Pty Ltd RALE/SOMM/DUPL/DUTO/MULL/wulf PLI003_Costerfield_Augusta_RR_Audit_NI 43-101_Technical_Report_Rev3 │17-21
17.5 Markets
There is an agreement in place between AGD Operations Pty Ltd and Hunan Zhongan Antimony & Tungsten Trading Co Ltd for the sale of the antimony-gold concentrate produced from Augusta. This contract has been extended and expires on 31 December 2010. The schedule requires the monthly delivery of between 150 wmt and 410 wmt between February and December 2010.
17.6 Contracts
The underground mining activity is now carried out solely by internal AGD personnel – there are no mining contracts in place.
17.7 Environmental Considerations
The environmental management programme for the mine exists as parts of each approved Work Plan Variation.
Bond Posting
The bonds applicable to MIN4644 are as follows:
1 Cash held by DPI of AUD4,000
2 Bank guarantee backed by a cash deposit of AUD1,051,400
3 Back guarantee backed by security over property of AUD68,000
The rehabilitation bond may be adjusted periodically by DPI‟s Environmental Division, and at time of writing, AGD is expecting an increase on the bond held to be requested by DPI. This increase will be in the order of AUD1.2M.
17.7.1 Remediation
Mine residue deposits
The mine residue deposits are associated with a number of toxic and carcinogenic elements such as antimony (stibnite), arsenic (arsenopyrite), cyanide (from processing) as well as lead (lead nitrate), caustic soda, acids and other flotation reagents used in the gold extraction process. The management and understanding of the formation and movement of leachate from the mine residue deposits is therefore of critical importance.
SRK notes that anomalous high concentrations of antimony and arsenic are known to occur naturally in groundwater in disseminated gold deposits similar to that found at Augusta mine
6. The importance of
establishing baseline conditions and a high level hydrogeological model is therefore of critical importance in the understanding and management of mine residue deposits and any potential leachate from such deposits.
Tailings storage facilities
There are three tailings storage facilities on the property including the old Brunswick tailings dam, a recently filled tailings dam (Bombay Dam Cell 1) and a newly constructed tailings dam (Bombay Dam Cell 2) which is now being used. At the time of the site visit, this new dam was not yet commissioned (Figure 17-17).
Tailings storage facilities have been approved by regulators as designed and have been constructed to the relevant standard.
Although the Bombay Tailings Dam (Cell 1), is a legal and authorised residue deposit, SRK is of the opinion that the design criteria appears to be inadequate for its long term effectiveness to contain mobilised elements. SRK notes that the clay barrier used to contain the material and seepage is not an impermeable layer, but a low permeability layer. Numerous documents and permits (e.g. DM/753/03) refer to a hydraulic conductivity of 1x10⁻⁹
m/s for the compacted clay layer under the tailings.
6 Reference: . Anomalous gold, antimony, arsenic, and tungsten in ground water and alluvium around disseminated gold deposits
along the Getchell Trend, Humboldt County, Nevada. David J. Grimes, Walter H. Ficklin, Allen L. Meier and John B. Mchugh. U.S. Geological Survey, Box 25046, Federal Center, Mail Stop 973, Denver, CO 80225, USA. January 1994.

SRK Consulting │ PLI003 Costerfield - Mandalay Resources NI 43-101 Technical Report 14 May 2010
SRK Consulting (Australasia) Pty Ltd RALE/SOMM/DUPL/DUTO/MULL/wulf PLI003_Costerfield_Augusta_RR_Audit_NI 43-101_Technical_Report_Rev3 │17-22
Although monitoring bore specifications have been approved by regulators, the bores surrounding the facility appear ineffective in measuring groundwater quality as they are extremely shallow and designed purely for seepage detection – some are less than 5 m deep and do not intercept the shallow water table (6-8 m deep) of the area.
AGD is reportedly in consultation with regulators for the design of a future lift on the operational facility, and groundwater quality monitoring bores will then be installed around the entire tailings facility to replace current shallow seepage detection bores in line with best practice.
The tailings from the old Brunswick tailings dam are currently being reprocessed and dumped into the Bombay Cell 2 tailings dam.

SRK Consulting │ PLI003 Costerfield - Mandalay Resources NI 43-101 Technical Report 14 May 2010
SRK Consulting (Australasia) Pty Ltd RALE/SOMM/DUPL/DUTO/MULL/wulf PLI003_Costerfield_Augusta_RR_Audit_NI 43-101_Technical_Report_Rev3 │17-23
Figure 17-17: Surface plan of plant site showing tailings dam facilities
Source: AGD, 2010

SRK Consulting │ PLI003 Costerfield - Mandalay Resources NI 43-101 Technical Report 14 May 2010
SRK Consulting (Australasia) Pty Ltd RALE/SOMM/DUPL/DUTO/MULL/wulf PLI003_Costerfield_Augusta_RR_Audit_NI 43-101_Technical_Report_Rev3 │17-24
Waste rock
AGD reported to SRK that the current waste rock dump on the mine exceeds its allowable volume and height. AGD have advised SRK that planning for permitting for an expanded waste rock storage area is in progress.
Figure 17-18: Surface plan of the mine site, waste dump and evaporation dam
Source: AGD, 2010
SRK Consulting │ PLI003 Costerfield - Mandalay Resources NI 43-101 Technical Report 14 May 2010
SRK Consulting (Australasia) Pty Ltd RALE/SOMM/DUPL/DUTO/MULL/wulf PLI003_Costerfield_Augusta_RR_Audit_NI 43-101_Technical_Report_Rev3 │17-25
17.7.2 Closure Plan
The closure plan is included as part of the approved Work Plan Variation. No internal closure document using the conditions stipulated in the rehabilitation sections of the Work Plan Variations was available.
17.7.3 Conceptual Hydrogeological Model
No conceptual hydrogeological model of the mine currently exists to enable management of groundwater issues.
17.8 Impact on the Receiving Environment
17.8.1 Dewatering
The current dewatering volumes are not perceived to present a significant impact on the environment or the surrounding landowners. A conceptual hydrogeological model or even a numerical model to help to define and clarify the potential long-term impact of any dewatering activity does not exist.
17.8.2 Water Disposal
The disposal of mine and process water presents a significant challenge to the mine. The current evaporation pond is not large enough to handle the volume of water being extracted from the South Costerfield Shaft and underground workings of the Augusta mine.
AGD are reportedly preparing an Environmental Improvement Plan (EIP) to gain approval for the re-use of untreated mine water for limited stock use and shire road works. As part of the site water management plan, a study for treatment and other re-use options is also underway. SRK notes that the provision of water to any third party is likely to require the written consent of Goulburn-Murray Rural Water Authority as per the Groundwater license condition 2.1.
SRK also strongly advises against providing any untreated mine water to any third party.
AGD report that excess water was stored in the Brunswick tailings dam recently and is used on the waste rock dumps for dust suppression purposes. In a district with possible naturally high levels of metals in surface- and ground-waters, such disposal of mine water, without thorough characterisation of both natural and mine waters to determine the factual net impact of such disposal, could create a potential liability for AGD.
SRK recommends substantially increasing efforts to routinely evaluate the water quality before it is used further.
17.8.3 Groundwater
AGD Operations, as part of its licence to operate, were required to undertake an independent hydrogeological review. URS has been consulting to AGD Operations since 2005 and reviews surface and groundwater monitoring annually. URS has reportedly (Section 3.4.2 - Costerfield Mine Site Hydrogeological Review, December 2008) not assessed the results for metals, pH and turbidity.
Some of the monitoring sample data (e.g. Costerfield Mine Site Hydrogeological Review, URS, December 2008) provided to SRK indicate that analysis for cyanide is not always taking place. This is a non-compliance issue with regard to Sections 9.6.5 & 9.6.7 of the Variations of Work Plan MIN 4073 of November 1997. Where monitoring data are available high levels of arsenic, antimony and even lead (up to 0.26 mg/L) have sometimes been reported.
No explanation was available with regards to the remediation measures taken or planned for previous diesel contamination (25 cm floating depth) in groundwater monitoring bore GW MB23 (July 2007 to September 2007). This incident was investigated but the source of the diesel was not found.

SRK Consulting │ PLI003 Costerfield - Mandalay Resources NI 43-101 Technical Report 14 May 2010
SRK Consulting (Australasia) Pty Ltd RALE/SOMM/DUPL/DUTO/MULL/wulf PLI003_Costerfield_Augusta_RR_Audit_NI 43-101_Technical_Report_Rev3 │17-26
17.8.4 Water Quality
Fortnightly monitoring of in-pit water and mine water is taking place. Water quality of soaks are monitored annually.
Monitoring results indicate extremely high concentrations of antimony (up to 29.7 mg/L, ALS Laboratory results December 2009) and arsenic (up to 1.4 mg/L, ALS Laboratory results October 2009 indicated 1.07 mg/L) in the mine water from Augusta mine, Brunswick open pit and Bombay Shaft. High concentrations of these substances have also been reported in monitoring bore GW02 which has reportedly intersected the mine‟s orebody.
These high levels are not found in groundwater monitoring bores GN7, GN9 and GN17 that are the furthest away from the mine. The water in these bores reflects the receiving groundwater environment around the mine. It is therefore possible that the high levels on the mine reflect the natural geological environment where arsenic minerals are expected to occur in association with the orebody.
It is important to note that the above concentrations are ten to more than a thousand times higher than the Australian drinking guideline levels (0.003 mg/L for antimony and 0.007 mg/L for arsenic). Extensive reviews and summaries of the human and animal toxicity data for arsenic and antimony are available from the World Health Organisation, for example.
17.8.5 Dust – Air Quality
Extensive dust deposition monitoring and reporting is taking place.
The current bucket-type gauge system being used on the mine to sample dust deposition is not optimal. Without directional control of the sample source, the monitoring results from the current sample locations have little value. AGD are reportedly working toward an improved dust deposition monitoring program which includes the installation of a weather station to establish the most suitable location for dust deposition gauges. AGD continue to show ongoing compliance within prescribed dust deposition limits.
Whether the level of arsenic and antimony is greater than local, natural background levels is uncertain due to lack of good baseline data. SRK recommends substantially increasing efforts to establish good natural baseline levels of the environment.
The mine is reportedly using 1 to 2 million litres of water for dust suppression per month over the summer months. Water quality data provided to SRK (mine water analyses dated 7/09/2009 to 01/03/2010) indicate that the average concentration of arsenic in the dust suppression water is 0.34 mg/L and 13.4 mg/L for antimony. This equates to an average of 0.68 kg arsenic and 26.8 kg antimony being released into the environment through this disposal method per month.
SRK recommends that the water that is being used for dust suppression is evaluated prior to placement.
17.8.6 Noise
Extensive noise monitoring and reporting is taking place.
The nationally agreed exposure standard for occupational noise (NOHSC:1007(2000)) is currently an 8-hour equivalent continuous A-weighted sound pressure level, LAeq,8h, of 85dB(A) and a C-weighted peak sound pressure level, LC peak, of 140 dB(C). These levels are much more realistic for a mine environment than the current limitations of 36-45 dB (A) that are place on the operation.
17.9 Royalties and Taxes
17.9.1 Royalties
Royalties apply to the production of antimony. This royalty is applied at 2.75% of the revenue realised from the sale of the antimony produced, less the selling costs.

SRK Consulting │ PLI003 Costerfield - Mandalay Resources NI 43-101 Technical Report 14 May 2010
SRK Consulting (Australasia) Pty Ltd RALE/SOMM/DUPL/DUTO/MULL/wulf PLI003_Costerfield_Augusta_RR_Audit_NI 43-101_Technical_Report_Rev3 │17-27
For the life of the current proven and probable reserves the total antimony revenue is AUD15,169,671; the total selling costs are AUD863,438 and the royalty payable is AUD393,421. No royalty on gold production exits.
17.9.2 Taxes
Mandalay reports that there are approximately AUD40M in tax loss carry forwards for AGD that will effectively eliminate any income tax being paid in the short life of the current Mineral Reserves.
Income Tax on Australian company profits are set at 30%. The Australian Federal Government has now announced changes to the taxation rates for companies which will decrease the tax rate to 28% in future years as well as an additional Resources based tax on profits that exceed 6%. These tax changes are yet to be imposed.
17.10 Capital Costs
Capital expenditure has been identified for the anticipated period of operation for the Costerfield Augusta Mine (that is for the period of extraction of the Mineral Reserves) and is grouped as Capital Development and Ongoing Capital (being for new or replacement capital expenditure items).
17.10.1 Capital Development
The Capital Development scheduled is that necessary to complete the decline to 1020 m RL to enable the orebody to be exposed by development in order to realise future mineral reserve potential. This development, which totals 650 m of various development, will be completed in June 2010 and cost AUD1.139M between March and June 2010 or AUD17.38/t.
17.10.2 On Going Capital
The ongoing capital requirement to purchase equipment including fans, pumps, narrow Aramine loaders, communication and electrical equipment and refuge bay installation totals AUD0.845M. This amount includes refunds for the sale of a jumbo and two loaders or AUD12.89/t.
17.11 Operating Costs
The actual mining cost (from Mining Plus LOM Plan) of the operation from October 2009 to February 2010 was AUD246/t ore, excluding any capital development activity. The budgeted cost for the mine operating activity between March 2010 and November 2011 is AUD237/t ore, excluding capital development. It is envisaged that mining efficiencies will improve with the move to 89% of the ore to come from Cut & Fill mining and the planned increase in supervisory control.
The breakdown of mine operating costs is given in Table 17-9.
Table 17-9: Mining operating cost breakdown
Item Total Cost
AUD Unit Cost
AUD/t
Supervision and Administration, Occupation Health and Safety, Training 2,850,123 43.46
Operating Development 1,750,670 26.70
Operating Stoping 7,927,243 120.89
Services 3,160,352 45.74
Total 15,527,680 236.79
The Mine Operating Cost plus Capital Mine Development is AUD16,667,452 or AUD254.17/t.
With the inclusion of the Capital Equipment, the total Mine Operating Cost becomes AUD17,512,508 or AUD267.06/t.
The Total Site Operating Cost including the Melbourne office is estimated to be AUD25,261,850 over this mine life, or AUD385.23/t ore.
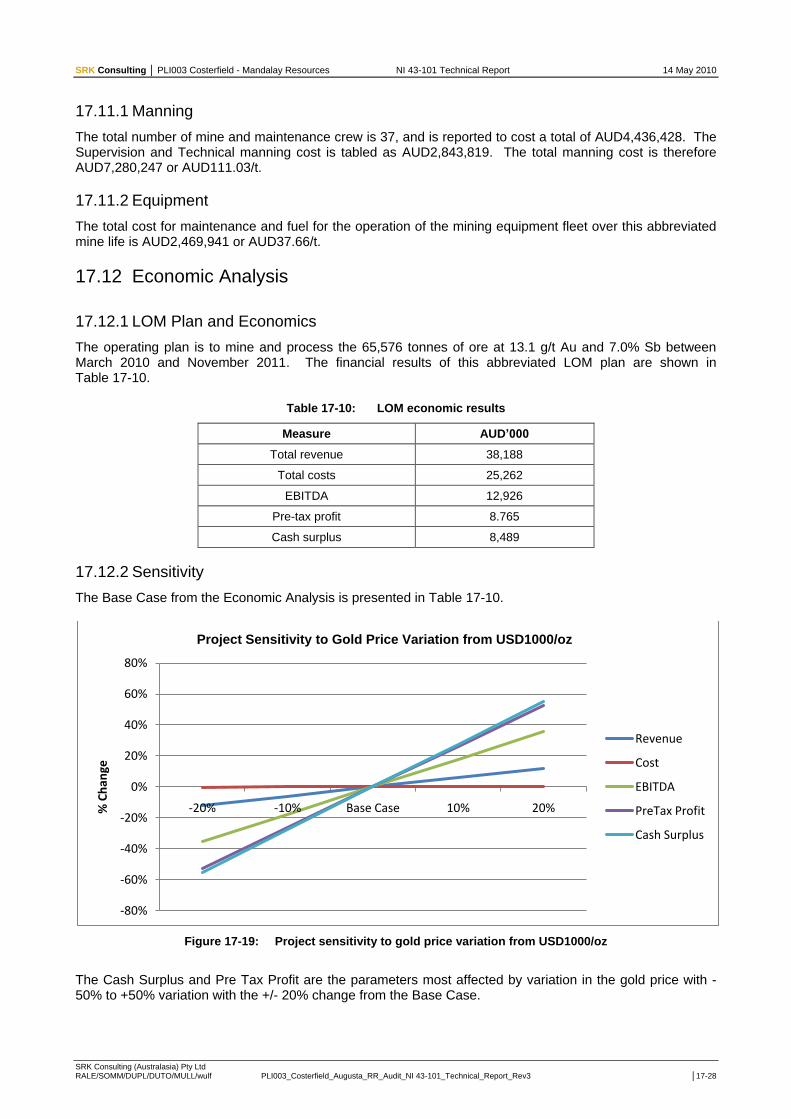
SRK Consulting │ PLI003 Costerfield - Mandalay Resources NI 43-101 Technical Report 14 May 2010
SRK Consulting (Australasia) Pty Ltd RALE/SOMM/DUPL/DUTO/MULL/wulf PLI003_Costerfield_Augusta_RR_Audit_NI 43-101_Technical_Report_Rev3 │17-28
17.11.1 Manning
The total number of mine and maintenance crew is 37, and is reported to cost a total of AUD4,436,428. The Supervision and Technical manning cost is tabled as AUD2,843,819. The total manning cost is therefore AUD7,280,247 or AUD111.03/t.
17.11.2 Equipment
The total cost for maintenance and fuel for the operation of the mining equipment fleet over this abbreviated mine life is AUD2,469,941 or AUD37.66/t.
17.12 Economic Analysis
17.12.1 LOM Plan and Economics
The operating plan is to mine and process the 65,576 tonnes of ore at 13.1 g/t Au and 7.0% Sb between March 2010 and November 2011. The financial results of this abbreviated LOM plan are shown in Table 17-10.
Table 17-10: LOM economic results
Measure AUD’000
Total revenue 38,188
Total costs 25,262
EBITDA 12,926
Pre-tax profit 8.765
Cash surplus 8,489
17.12.2 Sensitivity
The Base Case from the Economic Analysis is presented in Table 17-10.
Figure 17-19: Project sensitivity to gold price variation from USD1000/oz
The Cash Surplus and Pre Tax Profit are the parameters most affected by variation in the gold price with -50% to +50% variation with the +/- 20% change from the Base Case.
-80%
-60%
-40%
-20%
0%
20%
40%
60%
80%
-20% -10% Base Case 10% 20%% C
han
ge
Project Sensitivity to Gold Price Variation from USD1000/oz
Revenue
Cost
EBITDA
PreTax Profit
Cash Surplus
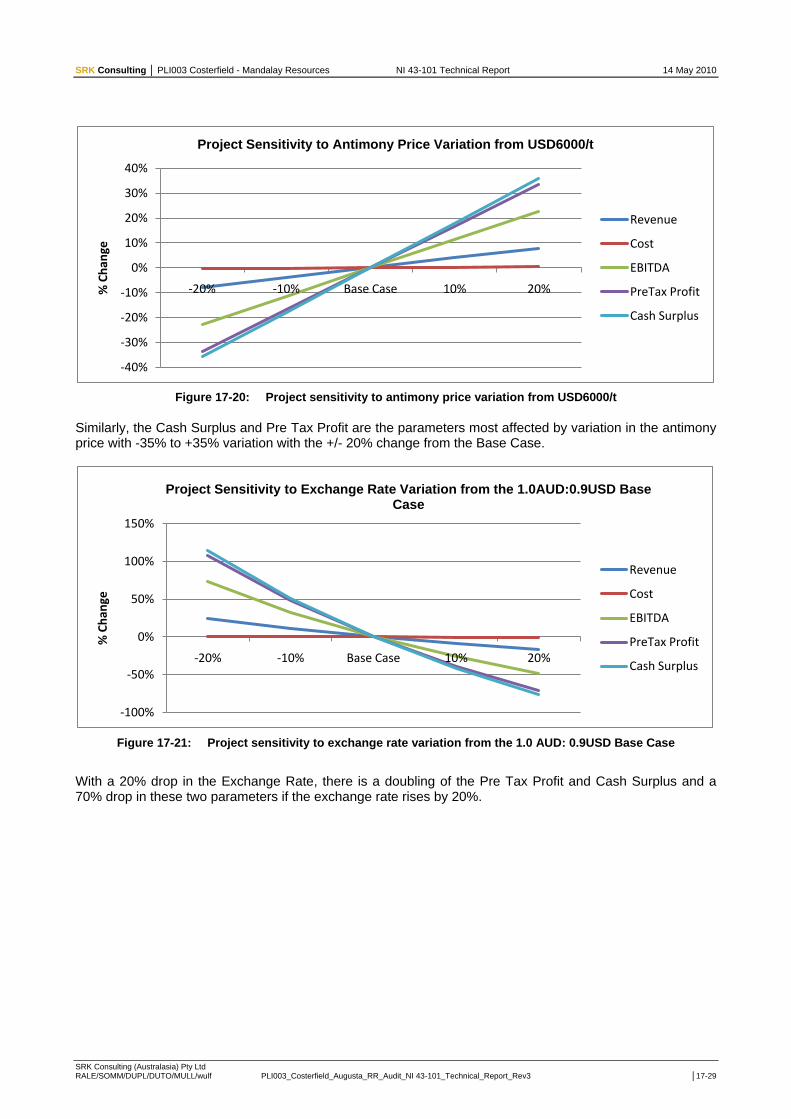
SRK Consulting │ PLI003 Costerfield - Mandalay Resources NI 43-101 Technical Report 14 May 2010
SRK Consulting (Australasia) Pty Ltd RALE/SOMM/DUPL/DUTO/MULL/wulf PLI003_Costerfield_Augusta_RR_Audit_NI 43-101_Technical_Report_Rev3 │17-29
Figure 17-20: Project sensitivity to antimony price variation from USD6000/t
Similarly, the Cash Surplus and Pre Tax Profit are the parameters most affected by variation in the antimony price with -35% to +35% variation with the +/- 20% change from the Base Case.
Figure 17-21: Project sensitivity to exchange rate variation from the 1.0 AUD: 0.9USD Base Case
With a 20% drop in the Exchange Rate, there is a doubling of the Pre Tax Profit and Cash Surplus and a 70% drop in these two parameters if the exchange rate rises by 20%.
-40%
-30%
-20%
-10%
0%
10%
20%
30%
40%
-20% -10% Base Case 10% 20%% C
han
ge
Project Sensitivity to Antimony Price Variation from USD6000/t
Revenue
Cost
EBITDA
PreTax Profit
Cash Surplus
-100%
-50%
0%
50%
100%
150%
-20% -10% Base Case 10% 20%
% C
han
ge
Project Sensitivity to Exchange Rate Variation from the 1.0AUD:0.9USD Base Case
Revenue
Cost
EBITDA
PreTax Profit
Cash Surplus

SRK Consulting │ PLI003 Costerfield - Mandalay Resources NI 43-101 Technical Report 14 May 2010
SRK Consulting (Australasia) Pty Ltd RALE/SOMM/DUPL/DUTO/MULL/wulf PLI003_Costerfield_Augusta_RR_Audit_NI 43-101_Technical_Report_Rev3 │17-30
Figure 17-22: Project sensitivity to mine production rate variation
With a 20% increase in the mining production rate, there is an 80% increase in Pre Tax Profit and Cash Surplus and similarly an 80% drop with a 20% reduction in production tonnes.
Figure 17-23: Project sensitivity to mining cost variation
There is a 35% decrease in Pre Tax Profit and Cash Flow with a 20% increase in mining cost and a 35% increase with 20% drop in mining cost.
-100%
-80%
-60%
-40%
-20%
0%
20%
40%
60%
80%
100%
-20% -10% Base Case 10% 20%% C
han
ge
Project Sensitivity to Mine Production Rate Variation
Revenue
Cost
EBITDA
PreTax Profit
Cash Surplus
-50%
-40%
-30%
-20%
-10%
0%
10%
20%
30%
40%
50%
-20% -10% Base Case 10% 20%% C
han
ge
Project Sensitivity to Mining Cost Variation
Revenue
Cost
EBITDA
PreTax Profit
Cash Surplus
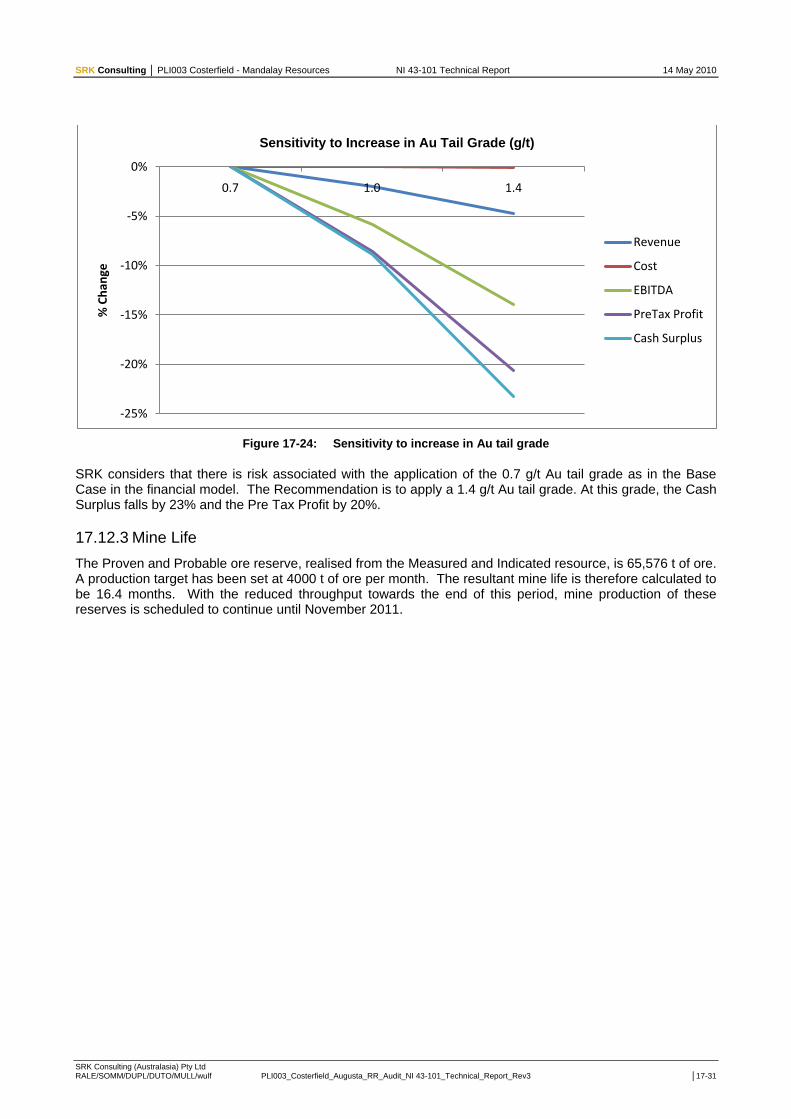
SRK Consulting │ PLI003 Costerfield - Mandalay Resources NI 43-101 Technical Report 14 May 2010
SRK Consulting (Australasia) Pty Ltd RALE/SOMM/DUPL/DUTO/MULL/wulf PLI003_Costerfield_Augusta_RR_Audit_NI 43-101_Technical_Report_Rev3 │17-31
Figure 17-24: Sensitivity to increase in Au tail grade
SRK considers that there is risk associated with the application of the 0.7 g/t Au tail grade as in the Base Case in the financial model. The Recommendation is to apply a 1.4 g/t Au tail grade. At this grade, the Cash Surplus falls by 23% and the Pre Tax Profit by 20%.
17.12.3 Mine Life
The Proven and Probable ore reserve, realised from the Measured and Indicated resource, is 65,576 t of ore. A production target has been set at 4000 t of ore per month. The resultant mine life is therefore calculated to be 16.4 months. With the reduced throughput towards the end of this period, mine production of these reserves is scheduled to continue until November 2011.
-25%
-20%
-15%
-10%
-5%
0%
0.7 1.0 1.4
% C
han
ge
Sensitivity to Increase in Au Tail Grade (g/t)
Revenue
Cost
EBITDA
PreTax Profit
Cash Surplus

SRK Consulting │ PLI003 Costerfield - Mandalay Resources NI 43-101 Technical Report 14 May 2010
SRK Consulting (Australasia) Pty Ltd RALE/SOMM/DUPL/DUTO/MULL/wulf PLI003_Costerfield_Augusta_RR_Audit_NI 43-101_Technical_Report_Rev3 │18-1
18. Interpretation and Conclusions (Item 21)
18.1 Geological
18.1.1 Field Surveys
Data has been collected using:
1 Diamond drilling methods with reasonable recoveries – the drilling methods used are appropriate for the style of mineralisation
2 Face samples – the methods are appropriate for the orientation and style of mineralisation
Analytical data is complemented with underground back mapping data.
18.1.2 Analytical and Testing Data
Samples are analysed using AAS and Fire assay methods and these are appropriate for the style of mineralisation. QA/QC procedures are in place at Augusta and this indicates that the analysis is reasonable.
18.1.3 Mineral Resources
Mineral Resource estimation uses a two dimensional approach due to the very thin nature of the lode. The estimation uses both diamond drill data and face sample data. The face sample data appears to be slighter higher in grade when compared to the mill data for the same operating period and this represents a risk in the mineral resource.
18.2 Geotechnical
A well-managed geotechnical database and geotechnical domain model will increase confidence in geotechnical mine design parameters with depth.
The presence of large quantities of groundwater may result in a risk of mud rushes, especially in close proximity to the Mud Fault.
18.3 Environmental
SRK has noted a number of non-compliances with regard to authorised activities. SRK considers that most of these non-compliance issues are easy to rectify without incurring significant costs (estimated to be less than AUD50 000). However, if they are not addressed it may result in fines.
The most significant immediate risks from an environmental point of view to the continual operation of the mine appear to be the exceedance of the waste rock dumps size.
The single most significant long-term environmental risk of the mine is its management and containment of mine and process water which may be contaminated with hazardous concentrations of arsenic, antimony and lead. Inadequate management of this issue might expose the mine and its shareholders to significant legal liabilities.
The current dust and water-monitoring network is ineffective in fully quantifying any pollution risk.
The mine is, and has been, making a concerted effort to engage with the local community and surrounding landowners.
SRK considers it imperative that the mine complies with all permit and licence requirements to ensure that the mine retains its legal and social licence to operate.
No conclusions regarding the accuracy or representativeness of water analyses were made during the review. Major discrepancies between similar water sampling points over time were noted which brings into question the validity and / or effectiveness of the sampling methods currently being employed.

SRK Consulting │ PLI003 Costerfield - Mandalay Resources NI 43-101 Technical Report 14 May 2010
SRK Consulting (Australasia) Pty Ltd RALE/SOMM/DUPL/DUTO/MULL/wulf PLI003_Costerfield_Augusta_RR_Audit_NI 43-101_Technical_Report_Rev3 │18-2
The extremely stringent noise levels to which this mine is subject (imposed by planning permits from the City of Greater Bendigo) appears to be unrealistic especially in the light of a lack of environmental noise guidelines that relate to mining in Australia.
18.4 Mining
The use of larger than necessary mining equipment has increased the dilution.
The application of open stoping methods has resulted in high dilution and reduced recovery.
The recent improvements in the mining operation, particularly in the change to Cut & Fill Mining, are having a significant effect on the operating results of the underground mine.
The mining risk assessments that are regularly carried out for each new or different mining activity are a critical feature of a safe and efficient working environment.
These critical risk assessments occupy significant resources in the technical services area of the operation.
There is no spare capacity in the technical services area of the operation – geology, geotechnical engineering and rock mechanics plus mine planning.
Following the application of dilution and mining recovery factors and with some attached risk associated with the Environmental Modifying Factor the Mineral Reserve, for this short life operation which appears to have significant potential, is considered to be 65,576 t of ore at 13.1 g/t gold and 7.0% antimony.
18.5 Process
The overall plant condition is fair and improving.
The projected plant throughput is aligned with the historical plant throughput.
The projected costs are aligned, but at the lower end, of the historical production costs.
The projected recoveries are achievable, although they are considered to be somewhat optimistic.
The projected antimony tail grade of 0.3% appears achievable. However, based on production data to date, it is unlikely that the projected gold tail grade of 0.7g/t will be achieved on a regular basis.
Production costs are largely fixed, resulting in higher unit costs in recent months when production did not meet the budgeted levels.
18.6 Other Relevant Information
SRK is unaware of any other Relevant Information.

SRK Consulting │ PLI003 Costerfield - Mandalay Resources NI 43-101 Technical Report 14 May 2010
SRK Consulting (Australasia) Pty Ltd RALE/SOMM/DUPL/DUTO/MULL/wulf PLI003_Costerfield_Augusta_RR_Audit_NI 43-101_Technical_Report_Rev3 │19-1
19. Recommendations (Item 22)
19.1 Geological
AGD should carry out the exploration drilling program of the lower (currently Inferred) portions of the deposit, as per the proposed exploration drilling plan.
Subsequent to this drilling a new Mineral Resource estimate should be undertaken to obtain an Indicated Resource to enable detailed mine design and production planning to be carried out for the deeper parts of the mine.
19.2 Geotechnical
AGD should implement a system whereby all headings are mapped according to acceptable geotechnical methods and that data is captured in a geotechnical database that can be used to construct a geotechnical domain model.
Additional geotechnical drilling should be considered to increase confidence in expected geotechnical conditions with depth.
A formal risk assessment should be completed on the likelihood of experiencing mud rushes underground.
The business case for the Augusta underground mine should not be based on longhole open stoping unless greater confidence in geotechnical data with depth suggests otherwise.
The informal record of stope failures and successes that is currently maintained should be properly documented and analysed to establish site-specific stope design criteria.
19.3 Environmental
Non-compliance issues with regard to authorised activities should be rectified immediately.
The water below the old Brunswick Tailings Dam should be sampled to determine the receiving environment water quality before the facility is deemed closed.
The groundwater abstraction licence (#8005313) should be renewed to reflect current and future abstraction volumes.
Any mine water or process water with contaminant levels which exceeds the surrounding environment background concentrations (not background concentrations as found on the mine) should be contained in an impermeable storage facility or be treated to remove all elements to below toxic concentrations. A closed water containment system should be established as soon as possible.
The risk of using mine water for dust suppression and thereby releasing inorganic contaminants into the environment should be assessed.
AGD should consider the development of a hydro-geological model to enable improved management of groundwater issues.
AGD should not provide any untreated mine water to any third party.
A material balance audit should be conducted to confirm volumes of topsoil and subsoil available for rehabilitation.
The mine should compile and put in place an approved environmental management programme that encompasses the whole mine site as well as historical workings. This should replace the numerous smaller EMPs associated with the numerous Work Plans.
The location and construction of ground water monitoring bores around the tails dam should be reviewed for their effectiveness.
AGD should install groundwater monitoring bores to replace the current seepage detection bores as part of the construction of the next lift of the tailings dam.

SRK Consulting │ PLI003 Costerfield - Mandalay Resources NI 43-101 Technical Report 14 May 2010
SRK Consulting (Australasia) Pty Ltd RALE/SOMM/DUPL/DUTO/MULL/wulf PLI003_Costerfield_Augusta_RR_Audit_NI 43-101_Technical_Report_Rev3 │19-2
Monitoring locations, systems and bores that are not relevant to the current operation should be dispensed with, saving on unnecessary bore maintenance, sampling and analysis costs.
Water and dust monitoring and sampling should be done according to internationally acceptable practices. It is recommended that a review of current methods should be undertaken.
A minimum of six months of background data on dust monitoring should be acquired to enable the appropriate positioning of monitoring stations.
An application to the EPA should be made under the State Environment Protection Policy (Control of Noise from Commerce, Industry and Trade)No. N-1, to have the noise restrictions reviewed.
More focus should be placed on the interpretation of the very large quantity of monitoring data available rather than just the reporting of the results.
A risk assessment should be done to quantify the risk associated with the management of mine-, process- and groundwater.
The mine should collate all environmental management information from the numerous Work Plan variations into a separate internal document.
AGD should develop an internal closure document using the conditions stipulated in the rehabilitation sections of the Work Plan variations.
19.4 Mining
The change to narrow vein mining equipment should be expedited and maintained.
The current practice of carrying out risk assessments of new or unusual activities should be maintained.
The ongoing operating results of the change to Cut & Fill mining should be monitored closely to enable continued improvement.
There should be adequate attention paid to the application of geological, geotechnical and mine planning principles and the provision of the appropriate facilities to achieve this.
The full complement of technical staff should be obtained and maintained for the duration of the mining operation.
The mining department should ensure that the appropriate attention is paid to the geological, geotechnical and mine planning advice.
There should be strict monitoring of the operating costs and productivities to enable the key production indicators to be achieved continually.
With ongoing development and evaluation the potential of this deposit should be realised.
19.5 Processing
The carbon regeneration kiln should be returned to service and the bogged leach tank rectified.
The constant antimony tail value of 0.3% should be maintained in the financial model.
The constant gold tail value of 0.7 g/t should be increased to 1.4 g/t in the financial model.
The maintenance budget allowance should be doubled, adding AUD5/t to operating costs until steady operation and better actual operating data is available.
A metallurgical test program should be continued for each new level of ore accessed in the mine to provide updated targets and inputs for the production plan.

SRK Consulting │ PLI003 Costerfield - Mandalay Resources NI 43-101 Technical Report 14 May 2010
SRK Consulting (Australasia) Pty Ltd RALE/SOMM/DUPL/DUTO/MULL/wulf PLI003_Costerfield_Augusta_RR_Audit_NI 43-101_Technical_Report_Rev3 │20-1
20. References (Item 23) Grimes, D J, Ficklin, W H, Meier, A L and Mchugh. J B, 1994. Anomalous gold, antimony, arsenic, and
tungsten in ground water and alluvium around disseminated gold deposits along the Getchell Trend, Humboldt County, Nevada, U S Geological Survey, Denver, Colorado, USA.
Fredericksen, D, 2009a. Costerfield Gold and Antimony Project, Augusta and Brunswick located in Costerfield, Victoria, Australia, Technical Report pursuant to National Instrument 43-101 of the Canadian Securities Commission, report prepared for AGD Mining Pty Ltd.
Fredericksen, D, 2009b. Augusta Project Mineral Resource Estimate, Technical Report prepared for AGD Mining Pty Ltd by Fredericksen Geological Solutions.
McArthur Ore Deposits Assessments Pty Ltd (MODA), 2005. Augusta Project Mineral Resource and Ore Reserve Assessment, September 2005, internal company report prepared for AGD Operations.
Webster, R, 2008. Resource Estimate of the Augusta Deposit, Costerfield, Victoria, Australia, technical report prepared for AGD Operations, internal company report.
Mining Plus Consultants, April 2010, Augusta Life of Mine Plan.
Simulus Pty Ltd, Costerfield Audit, Process Section, 43-101 Report Revision C.

SRK Consulting │ PLI003 Costerfield - Mandalay Resources NI 43-101 Technical Report 14 May 2010
SRK Consulting (Australasia) Pty Ltd RALE/SOMM/DUPL/DUTO/MULL/wulf PLI003_Costerfield_Augusta_RR_Audit_NI 43-101_Technical_Report_Rev3 │21-1
21. Glossary
21.1 Mineral Resources and Reserves
21.1.1 Mineral Resources
The mineral resources and mineral reserves have been classified according to the CIM Standards on Mineral Resources and Reserves: Definitions and Guidelines” (December 2005). Accordingly, the Resources have been classified as Measured, Indicated or Inferred, the Reserves have been classified as Proven, and Probable based on the Measured and Indicated Resources as defined below.
A Mineral Resource is a concentration or occurrence of natural, solid, inorganic or fossilised organic material in or on the Earth‟s crust in such form and quantity and of such a grade or quality that it has reasonable prospects for economic extraction. The location, quantity, grade, geological characteristics and continuity of a Mineral Resource are known, estimated or interpreted from specific geological evidence and knowledge.
An „Inferred Mineral Resource‟ is that part of a Mineral Resource for which quantity and grade or quality can be estimated on the basis of geological evidence and limited sampling and reasonably assumed, but not verified, geological and grade continuity. The estimate is based on limited information and sampling gathered through appropriate techniques from locations such as outcrops, trenches, pits, workings and drillholes.
An „Indicated Mineral Resource‟ is that part of a Mineral Resource for which quantity, grade or quality, densities, shape and physical characteristics can be estimated with a level of confidence sufficient to allow the appropriate application of technical and economic parameters, to support mine planning and evaluation of the economic viability of the deposit. The estimate is based on detailed and reliable exploration and testing information gathered through appropriate techniques from locations such as outcrops, trenches, pits, workings and drillholes that are spaced closely enough for geological and grade continuity to be reasonably assumed.
A „Measured Mineral Resource‟ is that part of a Mineral Resource for which quantity, grade or quality, densities, shape, physical characteristics are so well established that they can be estimated with confidence sufficient to allow the appropriate application of technical and economic parameters, to support production planning and evaluation of the economic viability of the deposit. The estimate is based on detailed and reliable exploration, sampling and testing information gathered through appropriate techniques from locations such as outcrops, trenches, pits, workings and drillholes that are spaced closely enough to confirm both geological and grade continuity.
21.1.2 Mineral Reserves
A Mineral Reserve is the economically mineable part of a Measured or Indicated Mineral Resource demonstrated by at least a Preliminary Feasibility Study. This Study must include adequate information on mining, processing, metallurgical, economic and other relevant factors that demonstrate, at the time of reporting, that economic extraction can be justified. A Mineral Reserve includes diluting materials and allowances for losses that may occur when the material is mined.
A „Probable Mineral Reserve‟ is the economically mineable part of an Indicated, and in some circumstances a Measured Mineral Resource demonstrated by at least a Preliminary Feasibility Study. This Study must include adequate information on mining, processing, metallurgical, economic, and other relevant factors that demonstrate, at the time of reporting, that economic extraction can be justified.
A „Proven Mineral Reserve‟ is the economically mineable part of a Measured Mineral Resource demonstrated by at least a Preliminary Feasibility Study. This Study must include adequate information on mining, processing, metallurgical, economic, and other relevant factors that demonstrate, at the time of reporting, that economic extraction is justified.
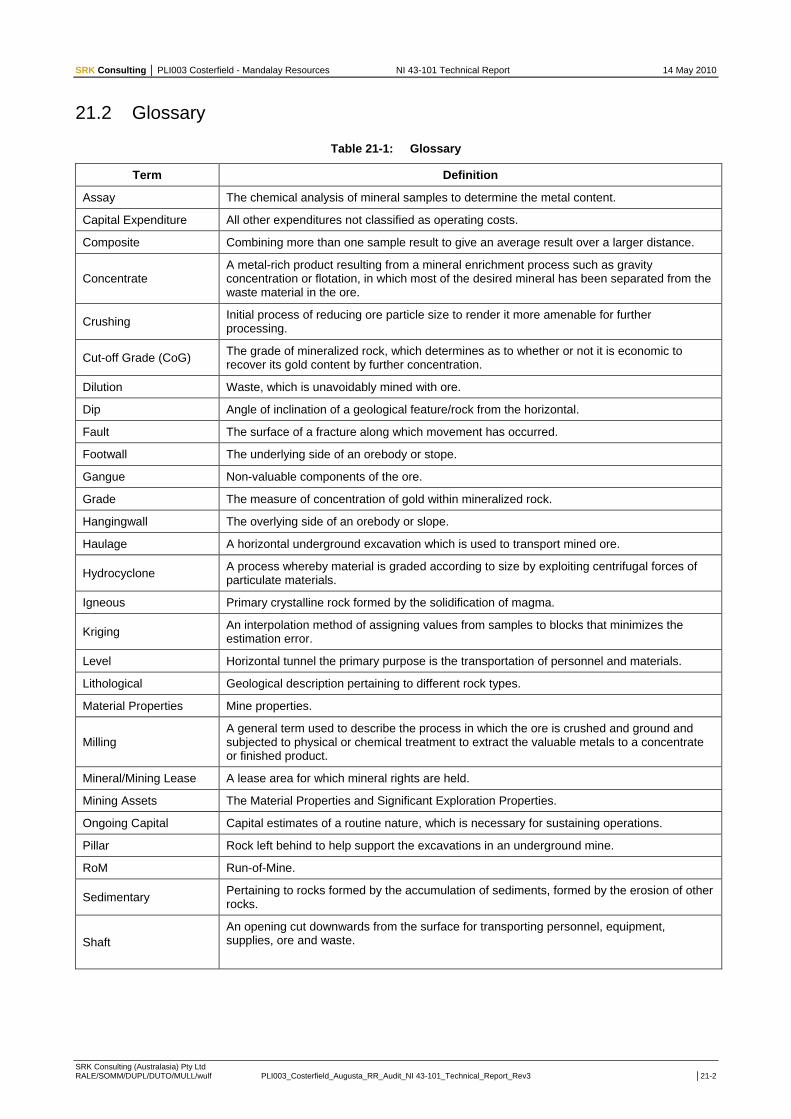
SRK Consulting │ PLI003 Costerfield - Mandalay Resources NI 43-101 Technical Report 14 May 2010
SRK Consulting (Australasia) Pty Ltd RALE/SOMM/DUPL/DUTO/MULL/wulf PLI003_Costerfield_Augusta_RR_Audit_NI 43-101_Technical_Report_Rev3 │21-2
21.2 Glossary
Table 21-1: Glossary
Term Definition
Assay The chemical analysis of mineral samples to determine the metal content.
Capital Expenditure All other expenditures not classified as operating costs.
Composite Combining more than one sample result to give an average result over a larger distance.
Concentrate A metal-rich product resulting from a mineral enrichment process such as gravity concentration or flotation, in which most of the desired mineral has been separated from the waste material in the ore.
Crushing Initial process of reducing ore particle size to render it more amenable for further processing.
Cut-off Grade (CoG) The grade of mineralized rock, which determines as to whether or not it is economic to recover its gold content by further concentration.
Dilution Waste, which is unavoidably mined with ore.
Dip Angle of inclination of a geological feature/rock from the horizontal.
Fault The surface of a fracture along which movement has occurred.
Footwall The underlying side of an orebody or stope.
Gangue Non-valuable components of the ore.
Grade The measure of concentration of gold within mineralized rock.
Hangingwall The overlying side of an orebody or slope.
Haulage A horizontal underground excavation which is used to transport mined ore.
Hydrocyclone A process whereby material is graded according to size by exploiting centrifugal forces of particulate materials.
Igneous Primary crystalline rock formed by the solidification of magma.
Kriging An interpolation method of assigning values from samples to blocks that minimizes the estimation error.
Level Horizontal tunnel the primary purpose is the transportation of personnel and materials.
Lithological Geological description pertaining to different rock types.
Material Properties Mine properties.
Milling A general term used to describe the process in which the ore is crushed and ground and subjected to physical or chemical treatment to extract the valuable metals to a concentrate or finished product.
Mineral/Mining Lease A lease area for which mineral rights are held.
Mining Assets The Material Properties and Significant Exploration Properties.
Ongoing Capital Capital estimates of a routine nature, which is necessary for sustaining operations.
Pillar Rock left behind to help support the excavations in an underground mine.
RoM Run-of-Mine.
Sedimentary Pertaining to rocks formed by the accumulation of sediments, formed by the erosion of other rocks.
Shaft
An opening cut downwards from the surface for transporting personnel, equipment, supplies, ore and waste.

SRK Consulting │ PLI003 Costerfield - Mandalay Resources NI 43-101 Technical Report 14 May 2010
SRK Consulting (Australasia) Pty Ltd RALE/SOMM/DUPL/DUTO/MULL/wulf PLI003_Costerfield_Augusta_RR_Audit_NI 43-101_Technical_Report_Rev3 │21-3
Term Definition
Sill A thin, tabular, horizontal to sub-horizontal body of igneous rock formed by the injection of magma into planar zones of weakness.
Smelting A high temperature pyrometallurgical operation conducted in a furnace, in which the valuable metal is collected to a molten matte or doré phase and separated from the gangue components that accumulate in a less dense molten slag phase.
Stope Underground void created by mining.
Stratigraphy The study of stratified rocks in terms of time and space.
Strike Direction of line formed by the intersection of strata surfaces with the horizontal plane, always perpendicular to the dip direction.
Sulfide A sulfur bearing mineral.
Tailings Finely ground waste rock from which valuable minerals or metals have been extracted.
Thickening The process of concentrating solid particles in suspension.
Total Expenditure All expenditures including those of an operating and capital nature.
Variogram A statistical representation of the characteristics (usually grade).
Abbreviations
The metric system has been used throughout this report unless otherwise stated. All currency is in U.S. dollars. Market prices are reported in USD per troy oz of gold and silver. Tonnes are metric of 1,000 kg, or 2,204.6 lbs. The following abbreviations are used in this report.
Table 21-2: Abbreviations
Abbreviation Unit or Term
A ampere
AAS atomic absorption spectrometry
AGD Australian Gold Development Mining Pty Ltd
AGDO AGD Operations Pty Ltd
ASL above sea level
Au gold
AUD Australian dollars
AuEq gold equivalent grade
°C degrees Centigrade
CIM Canadian Institute of Mining, Metallurgy and Petroleum
CIP carbon in pulp
cm centimeter
CV Coefficient of Variation
dB decibel
DPI Department of Primary Industries, Victorian Government
° degree (degrees)
EBITDA Earnings before Interest, Tax, Depreciation and Amortisation
EL Exploration License
g gram
g/L gram per liter
g/t grams per tonne

SRK Consulting │ PLI003 Costerfield - Mandalay Resources NI 43-101 Technical Report 14 May 2010
SRK Consulting (Australasia) Pty Ltd RALE/SOMM/DUPL/DUTO/MULL/wulf PLI003_Costerfield_Augusta_RR_Audit_NI 43-101_Technical_Report_Rev3 │21-4
Abbreviation Unit or Term
ha hectares
kg kilograms
kL kiloliter
km kilometer
kPa kilopascal
kt thousand tonnes
kVA kilovolt Ampere
kW kilowatt
L liter
L/sec liters per second
L/sec/m liters per second per meter
LHD Long-Haul Dump truck
LoM Life-of-Mine
m meter
m2 square meter
m3 cubic meter
m ASL meters above sea level
mg/L milligrams/liter
mL milliliter
ML megaliter
mm millimeter
MODA McArthur Ore Deposit Assessments Pty Ltd
m RL meters reduced level
NATA National Association of Testing Authorities
NI 43-101 Canadian National Instrument 43-101
NPV net present value
NRPT net revenue per tonne
NTS National Topographic System
oz troy ounce
% percent
QA/QC Quality Assurance/Quality Control
RC rotary circulation drilling
RL relative level
RoM Run-of-Mine
Sb antimony
sec second
SG specific gravity
SMBS sodium metabisulphite – a method of cyanide destruction
SRK SRK Consulting (Australasia) Pty Ltd
t tonne (metric ton) (2,204.6 pounds)

SRK Consulting │ PLI003 Costerfield - Mandalay Resources NI 43-101 Technical Report 14 May 2010
SRK Consulting (Australasia) Pty Ltd RALE/SOMM/DUPL/DUTO/MULL/wulf PLI003_Costerfield_Augusta_RR_Audit_NI 43-101_Technical_Report_Rev3 │21-5
Abbreviation Unit or Term
t/h tonnes per hour
t/m tonnes per month
tpa tonnes per annum
USD United States dollars
µm micron or microns, micrometer or micrometers
V volts
W watt
wmt wet metric tonne


![CompSci516 Database Systems...Duke CS, Fall 2019 CompSci 516: Database Systems 2 Reading Material •[GUW] –Chapter 17.2.1-17.2.4 (UNDO) –Chapter 17.3.1-17.3.4 (REDO) –17.4:](https://static.fdocuments.us/doc/165x107/5f948a9f91fe910a6c77379d/compsci516-database-systems-duke-cs-fall-2019-compsci-516-database-systems.jpg)