Nhtsa Aeb Report
97
U.S. Department of Transportation National Highway Traffic Safety Administration Automatic Emergency Braking System (AEB) Research Report An Update of the June 2012 Research Report Titled, “Forward-Looking Advanced Braking Technologies Research Report” August 2014 This report is free of charge at http://www.regulations.gov
-
Upload
manuel-aguado-echeverria -
Category
Documents
-
view
245 -
download
0
description
RCS measurements of some cars
Transcript of Nhtsa Aeb Report

U.S. Department of Transportation National Highway Traffic Safety Administration
Automatic Emergency Braking System (AEB) Research Report
An Update of the June 2012 Research Report Titled,
“Forward-Looking Advanced Braking Technologies Research Report”
August 2014
This report is free of charge at http://www.regulations.gov

Contents
LIST OF ACRONYNMS .............................................................................................................................................. 1
EXECUTIVE SUMMARY ........................................................................................................................................... 3
1.0 INTRODUCTION ........................................................................................................................................... 6
Purpose of this Report ........................................................................................................................................ 6 1.1.
July 2012 RFC Summary ................................................................................................................................... 7 1.2.
Forward Collision Avoidance and Mitigation (FCAM) Technologies .............................................................. 8 1.3.
1.3.1. Forward Collision Warning (FCW) ........................................................................................................... 8
1.3.2. Dynamic Brake Support (DBS) .................................................................................................................. 8
1.3.3. Crash Imminent Braking (CIB) .................................................................................................................. 8
2.0 SAFETY CHALLENGES, TECHNOLOGY, AND MARKET OVERVIEW ............................................... 9
Target Population ............................................................................................................................................... 9 2.1.
Target Population by Crash Type .................................................................................................................... 10 2.2.
FCAM Market and Technology Overview ...................................................................................................... 11 2.3.
FCAM Field Experience .................................................................................................................................. 12 2.4.
2.4.1. NHTSA FCAM Field Studies .................................................................................................................. 13
2.4.1.1. Long-Term Exposure Study ............................................................................................................. 13
2.4.1.2. NHTSA Crash Avoidance Technology Field Data Collection Study ............................................... 13
2.4.2. Summary of Industry FCAM Field Studies.............................................................................................. 14
Costs ................................................................................................................................................................ 14 2.5.
Preliminary Safety Benefits ............................................................................................................................. 15 2.6.
2.6.1. Approach .................................................................................................................................................. 15
2.6.2. Estimated Injuries/Lives Saved ................................................................................................................ 15
3.0 RECENT REFINEMENTS OF NHTSA’S CIB AND DBS DRAFT TEST PROCEDURES ...................... 18
History ............................................................................................................................................................. 18 3.1.
Developments since Publication of the July 2012 RFC and June 2012 Research Report ................................ 18 3.2.
3.2.1. Strikeable Surrogate Vehicle (SSV) ......................................................................................................... 18
3.2.1.1. Overview .......................................................................................................................................... 18
3.2.1.2. Design Attributes .............................................................................................................................. 19
3.2.1.3. Design Revisions .............................................................................................................................. 21
3.2.2. Changes to the CIB/DBS Test Methodologies ......................................................................................... 24
3.2.2.1. Inclusion of New Test Scenarios ...................................................................................................... 24
3.2.2.2. Revision of Brake Application Methods Used for DBS Evaluation ................................................. 30
3.2.3. Non-Ideal Environmental Condition Tests ............................................................................................... 38
3.2.3.1. Moderate Rain .................................................................................................................................. 38
3.2.3.2. Darkness ........................................................................................................................................... 39
3.2.3.3. High Glare ........................................................................................................................................ 40
3.2.3.4. Non-Ideal Environmental Condition Test Observations .................................................................. 41

4.0 2013 FCAM TESTS ...................................................................................................................................... 43
Introduction ...................................................................................................................................................... 43 4.1.
Test Matrix ....................................................................................................................................................... 43 4.2.
Test Maneuvers ................................................................................................................................................ 43 4.3.
4.3.1. LVS and LVM Tests ................................................................................................................................ 44
4.3.2. LVD Tests ................................................................................................................................................ 45
4.3.3. False Positive Tests .................................................................................................................................. 46
Brake Applications (for DBS Evaluation) ....................................................................................................... 46 4.4.
4.4.1. Foundation Brake Characterization .......................................................................................................... 46
4.4.2. DBS Performance Evaluation .................................................................................................................. 47
4.4.2.1. Displacement Feedback Control ....................................................................................................... 47
4.4.2.2. Hybrid Feedback Control ................................................................................................................. 47
Test Vehicles.................................................................................................................................................... 48 4.5.
Surrogate Vehicles ........................................................................................................................................... 48 4.6.
Draft Assessment Reference Values (ARVs) .................................................................................................. 49 4.7.
Test Results ...................................................................................................................................................... 51 4.8.
4.8.1. CIB Maneuver Performability .................................................................................................................. 51
4.8.1.1. CIB LVS Scenario ............................................................................................................................ 52
4.8.1.2. CIB LVM Scenario .......................................................................................................................... 52
4.8.1.3. CIB LVD Scenario ........................................................................................................................... 52
4.8.1.4. CIB False Positive Scenario ............................................................................................................. 52
4.8.2. CIB Test Track Performance.................................................................................................................... 54
4.8.2.1. Effect of Performing a Complete FMVSS No. 135 Brake Burnish .................................................. 57
4.8.2.2. Comments Regarding the Infiniti Q50 Forward Collision Warning................................................. 58
4.8.3. DBS Maneuver Performability ................................................................................................................. 60
4.8.3.1. DBS LVS Scenario ........................................................................................................................... 60
4.8.3.2. DBS LVM Scenario ......................................................................................................................... 62
4.8.3.3. DBS LVD Scenario .......................................................................................................................... 62
4.8.3.4. DBS False Positive Scenario ............................................................................................................ 63
4.8.4. DBS Test Track Performance .................................................................................................................. 64
4.8.4.1. Overall and Displacement Feedback Results Summary ................................................................... 64
4.8.4.2. Hybrid Feedback Results Summary ................................................................................................. 66
4.8.4.3. Effect of Hybrid-Feedback Brake Applications on the 2013 FCAM Test Vehicles ......................... 71
4.8.4.4. Hybrid-Feedback-Based Brake Application Observations ............................................................... 73
2013 FCAM Research Observations ................................................................................................................ 73 4.9.
5.0 SUMMARY OF CIB AND DBS DRAFT TEST PROCEDURE REFINEMENTS ..................................... 74
Use of the FCW Alert ...................................................................................................................................... 74 5.1.
Throttle Management Specification ................................................................................................................. 74 5.2.
5.2.1. Throttle Management During CIB Evaluations ....................................................................................... 74

5.2.2. Throttle Management During DBS Evaluations ...................................................................................... 77
Brake Application Specifications ..................................................................................................................... 77 5.3.
5.3.1. Hybrid Feedback Magnitude Adjustment ................................................................................................ 77
5.3.2. Brake Application Feedback Mode Selection .......................................................................................... 78
SV Load Specification ..................................................................................................................................... 78 5.4.
Test Tolerance Revision .................................................................................................................................. 79 5.5.
6.0 REFERENCES .............................................................................................................................................. 82
7.0 APPENDICES ............................................................................................................................................... 84

List of Figures
Figure 2-1. Rear-end crashes by crash type ................................................................................................................. 11
Figure 3-1. Important design elements of NHTSA's SSV ........................................................................................... 20
Figure 3-2. Components installed to improve SSV durability ..................................................................................... 22
Figure 3-3. Wideband radar-absorbing material installed on first section of the SSV towed rail................................ 23
Figure 3-4. Wideband radar-absorbing material installed on the SSV load frame ...................................................... 23
Figure 3-5. Steel plate used to evaluate unintended CIB/DBS activations .................................................................. 29
Figure 3-6. Brake applications used by drivers in emergency and non-emergency situations .................................... 31
Figure 3-7. Conceptual comparison of displacement versus hybrid feedback brake applications ............................... 33
Figure 3-8. Hybrid feedback brake applications performed with the Mercedes ML320 ............................................. 35
Figure 3-9. Displacement and hybrid feedback brake applications performed with the Mercedes ML320 ................ 36
Figure 3-10. Hybrid feedback brake applications performed with the Mercedes ML320 and Subaru Outback .......... 37
Figure 3-11. Subaru Outback CIB test performed in moderate rain ............................................................................ 38
Figure 3-12. Volvo S60 CIB test performed in the dark .............................................................................................. 39
Figure 3-13. Volvo S60 CIB test performed with high glare ....................................................................................... 40
Figure 3-14. Vehicle responses observed during high-glare CIB tests performed with the Volvo S60 ...................... 42
Figure 4-1. NHTSA SSV (left) and ADAC (right) test targets .................................................................................... 49
Figure 4-2. CIB maneuver performability; validity violations by test scenario. .......................................................... 53
Figure 4-3. Infiniti Q50 CIB tests performed with two throttle release methods ........................................................ 59
Figure 4-4. DBS LVS maneuver performability .......................................................................................................... 60
Figure 4-5. DBS maneuver performability; validity violations by test scenario.......................................................... 61
Figure 4-6. Displacement versus hybrid feedback brake applications performed with the Mitsubishi Outlander ...... 72
Figure 5-1. Release from constant throttle after SV deceleration reaches 0.1g ........................................................... 76
Figure 5-2. Throttle position violation after SV deceleration reaches 0.1g ................................................................. 76

List of Tables
Table 2-1. Number of MY 2011-2014 Vehicle Models Offering FCW ...................................................................... 12
Table 2-2. Number of MY 2012-2014 Vehicles Offering CIB, DBS, or Both ............................................................ 12
Table 2-3. Preliminary Benefit Estimates for FCAM Systems That Satisfy NHTSA’s Draft ARVs .......................... 17
Table 3-1. LVD Development Test Matrix.................................................................................................................. 25
Table 3-2. LVD Draft Assessment Reference Values (ARVs) – SV CIB Speed Reductions ...................................... 27
Table 3-3. Number of Trials with Speed Reductions Greater Than or Equal to the Draft ARV ................................. 27
Table 3-4. Number of Trials with Crash Avoidance .................................................................................................... 27
Table 3-5. Crash Avoidance Summary from Tests Performed in Moderate Rain ....................................................... 39
Table 3-6. Crash Avoidance Summary From Tests Performed In Darkness. .............................................................. 40
Table 3-7. Crash Avoidance Summary from Tests Performed in High Glare. ............................................................ 41
Table 4-1. 2013 FCAM CIB Test Matrix .................................................................................................................... 44
Table 4-2. 2013 FCAM DBS Test Matrix ................................................................................................................... 44
Table 4-3. Results from NHTSA’s EDR Analysis Of Rear-End Crashes ................................................................... 47
Table 4-4. 2013 FCAM Test Vehicle List ................................................................................................................... 48
Table 4-5. CIB and DBS Draft Assessment Reference Values (ARVs) ...................................................................... 50
Table 4-6. CIB and DBS Test Tolerance Overview .................................................................................................... 51
Table 4-7. Number of Trials Able to Satisfy CIB Draft ARVs ................................................................................... 55
Table 4-8. Number of Trials Able to Satisfy CIB Draft ARVs ................................................................................... 56
Table 4-9. Cadillac ATS LVM_25_10 mph Tests Performed After Two Different FMVSS Brake Burnishes ........... 58
Table 4-10. LVD1_35_35 Validity Violation Count and Magnitudes......................................................................... 62
Table 4-11. LVD2_25_25 Validity Violation Count and Magnitudes......................................................................... 63
Table 4-12. Number of Trials Able to Satisfy DBS Draft ARVs with Displacement Feedback ................................. 67
Table 4-13. Number of Trials Able to Satisfy DBS Draft ARVs with Displacement Feedback ................................. 68
Table 4-14. Number of Trials Able to Satisfy DBS Draft ARVs with Hybrid Feedback ............................................ 69
Table 4-15. Number of Trials Able to Satisfy DBS Draft ARVs with Hybrid Feedback ............................................ 70
Table 5-1. CIB and DBS Test Tolerance Overview and Change History.................................................................... 80

CONVERSION FACTORS

1
LIST OF ACRONYNMS
ADAC Allgemeiner Deutscher Automobil-Club
AEB Automatic Emergency Brake
AIS Abbreviated Injury Scale
ARV Assessment Reference Value
BA Brake Assist
BC Brake Controller
CA Crash Avoidance
CIB Crash Imminent Braking
COTR Contracting Officer’s Technical Representative
DAS Data Acquisition System
DBS Dynamic Brake Support
EDR Event Data Recorder
FCAM Forward Collision Avoidance and Mitigation
FCW Forward Collision Warning
GAWR Gross Axle Weight Rating
GVWR Gross Vehicle Weight Rating
IIHS Insurance Institute for Highway Safety
LVS Lead Vehicle Stopped
LVM Lead Vehicle Moving
LVD Lead Vehicle Decelerating (general case)
LVD1 Lead Vehicle Decelerating (throughout duration of maneuver)
LVD2 Lead Vehicle Decelerating to a Stop
MAIS Maximum Abbreviated Injury Scale
MTRI Michigan Transportation Research Institute
NASS-CDS National Automotive Sampling System: Crashworthiness Data System
NASS-GES National Automotive Sampling System: General Estimates System
NCAP New Car Assessment Program
NHTSA National Highway Traffic Safety Administration
NMVCCS National Motor Vehicle Crash Causation Study
POV Principal Other Vehicle

2
RCS Radar Cross Section
RFC Request for Comment
SSV Strikeable Surrogate Vehicle
SV Subject Vehicle
STP Steel Trench Plate
TPS Throttle Position Sensor (data reported as a percentage of wide open throttle)
TTC Time to Collision
UMTRI University of Michigan Transportation Research Institute
UVW Unloaded Vehicle Weight

3
EXECUTIVE SUMMARY
This document describes recent progress made by National Highway Traffic Safety
Administration (NHTSA) to better understand the safety potential of Automatic Emergency
Brake (AEB) system technologies and discusses advances in the agency’s objective measures
used to quantify their test track performance. AEB systems are a subset of what the agency
refers to as Forward Crash Avoidance and Mitigation (FCAM) systems. Whereas the FCAM
designation includes systems that provide Forward Collision Warning (FCW) only, AEB systems
such as Crash Imminent Braking (CIB) and Dynamic Brake Support (DBS) are specifically
designed to help drivers avoid, or mitigate the severity of, rear-end crashes. CIB systems provide
automatic braking when forward-looking sensors indicate that a crash is imminent and the driver
has not braked, whereas DBS systems provide supplemental braking when sensors determine
that driver-applied braking is insufficient to avoid an imminent crash.
To better understand the potential benefits of CIB and DBS, NHTSA in late 2010 began an
examination of the current state of the development, functionality, and deployment of these
technologies. The agency performed a literature review, met with vehicle manufacturers and
FCAM system suppliers, and conducted a series of vehicle tests to quantify the capabilities of
then-current CIB and DBS systems. This work culminated in a June 2012 report titled,
“Forward-Looking Advanced Braking Technologies Research Report,” and publication of a
Request for Comment (RFC) in July 2012.
Twenty-four (24) organizations responded to the July 2012 RFC. Most agreed that FCAM
technologies will provide positive safety benefits. Automobile manufacturers and suppliers
provided detailed feedback on NHTSA’s draft test procedures referenced in the RFC, and several
recommended specific changes. Additionally, most commenters acknowledged the importance
of preventing false activations, but did not believe all potential false-positive scenarios could be
evaluated on a test track.
According to data from NHTSA’s Traffic Safety Facts 2011, a total of 1,721,000 rear-end
crashes occurred in 2011, of which the agency determined 897,000 could have been favorably
affected by CIB/DBS. This target population is essentially the same size as that noted in the
June 2012 research report.
The preliminary benefit estimates provided in this document were calculated by assuming that all
light vehicles would be equipped with a Forward Collision Warning (FCW), CIB and DBS, and
that CIB and DBS systems would provide speed reductions at levels that would satisfy the draft
Assessment Reference Values (ARVs), metrics developed by NHTSA researchers and given in
this report. The agency estimates that the combined effect of FCW, CIB, and DBS on all light
vehicles would prevent approximately 200,000 minor injuries (Abbreviated Injury Scale (AIS) 1
- 2), 4,000 serious injuries (AIS 3 – 5), and save approximately 100 lives annually.
In addition to updating preliminary estimates of benefits associated with FCAM technologies,
this document also summarizes refinements made to the draft test procedures since their
concurrent publication with the June 2012 research report. Revisions include:
4
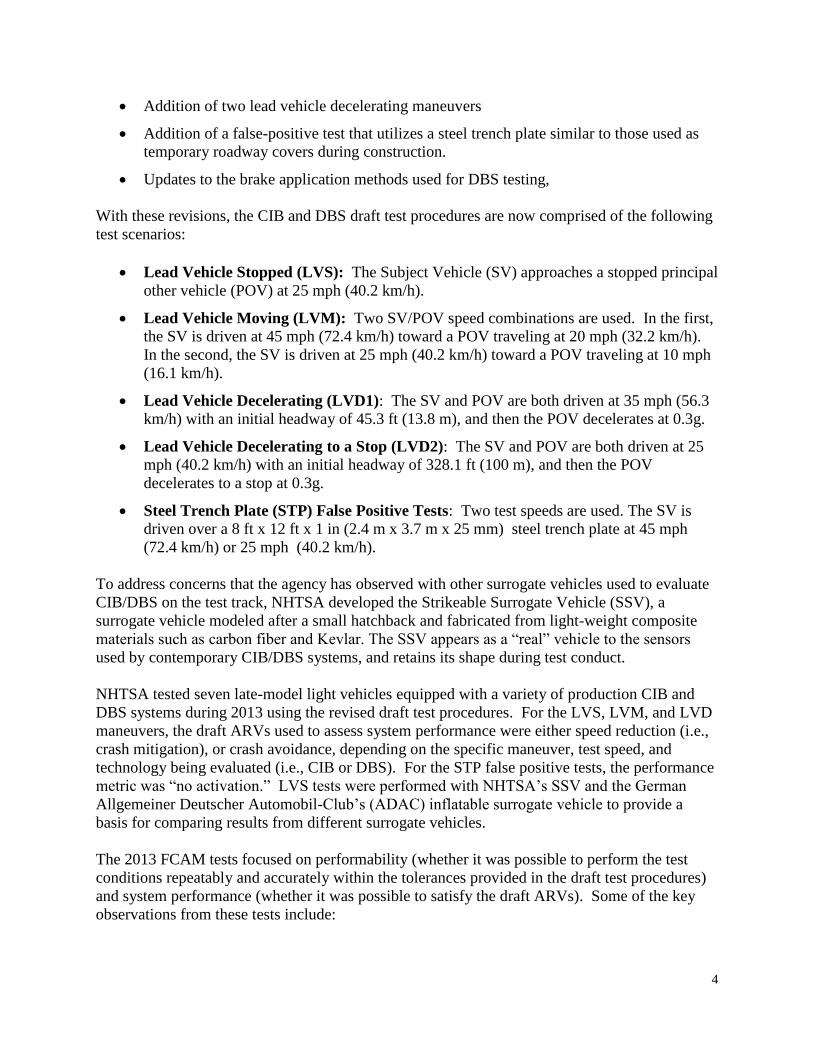
Addition of two lead vehicle decelerating maneuvers
Addition of a false-positive test that utilizes a steel trench plate similar to those used as
temporary roadway covers during construction.
Updates to the brake application methods used for DBS testing,
With these revisions, the CIB and DBS draft test procedures are now comprised of the following
test scenarios:
Lead Vehicle Stopped (LVS): The Subject Vehicle (SV) approaches a stopped principal
other vehicle (POV) at 25 mph (40.2 km/h).
Lead Vehicle Moving (LVM): Two SV/POV speed combinations are used. In the first,
the SV is driven at 45 mph (72.4 km/h) toward a POV traveling at 20 mph (32.2 km/h).
In the second, the SV is driven at 25 mph (40.2 km/h) toward a POV traveling at 10 mph
(16.1 km/h).
Lead Vehicle Decelerating (LVD1): The SV and POV are both driven at 35 mph (56.3
km/h) with an initial headway of 45.3 ft (13.8 m), and then the POV decelerates at 0.3g.
Lead Vehicle Decelerating to a Stop (LVD2): The SV and POV are both driven at 25
mph (40.2 km/h) with an initial headway of 328.1 ft (100 m), and then the POV
decelerates to a stop at 0.3g.
Steel Trench Plate (STP) False Positive Tests: Two test speeds are used. The SV is
driven over a 8 ft x 12 ft x 1 in (2.4 m x 3.7 m x 25 mm) steel trench plate at 45 mph
(72.4 km/h) or 25 mph (40.2 km/h).
To address concerns that the agency has observed with other surrogate vehicles used to evaluate
CIB/DBS on the test track, NHTSA developed the Strikeable Surrogate Vehicle (SSV), a
surrogate vehicle modeled after a small hatchback and fabricated from light-weight composite
materials such as carbon fiber and Kevlar. The SSV appears as a “real” vehicle to the sensors
used by contemporary CIB/DBS systems, and retains its shape during test conduct.
NHTSA tested seven late-model light vehicles equipped with a variety of production CIB and
DBS systems during 2013 using the revised draft test procedures. For the LVS, LVM, and LVD
maneuvers, the draft ARVs used to assess system performance were either speed reduction (i.e.,
crash mitigation), or crash avoidance, depending on the specific maneuver, test speed, and
technology being evaluated (i.e., CIB or DBS). For the STP false positive tests, the performance
metric was “no activation.” LVS tests were performed with NHTSA’s SSV and the German
Allgemeiner Deutscher Automobil-Club’s (ADAC) inflatable surrogate vehicle to provide a
basis for comparing results from different surrogate vehicles.
The 2013 FCAM tests focused on performability (whether it was possible to perform the test
conditions repeatably and accurately within the tolerances provided in the draft test procedures)
and system performance (whether it was possible to satisfy the draft ARVs). Some of the key
observations from these tests include:

5
Performability: Some test scenarios require complex choreography, but the agency has
demonstrated that each is performable. Careful attention to SV and POV speeds, SV throttle
release timing, and SV brake application range was found to be particularly important during test
conduct, as these were the most common sources of validity violations overall. Based on these
research findings, the agency expects that the number of validity violations realized during
testing could be reduced by providing test drivers with better test-to-test feedback about whether
a given trial had been acceptably performed, and by improving brake controller programming to
correctly initiate brake applications at the desired range.
System Performance: Several vehicles were able to satisfy the overall draft ARVs; however,
CIB performance was not always indicative of that realized with DBS:
CIB speed reduction draft ARV: 3 of 7 vehicles met criteria
DBS speed reduction draft ARV: 3 of 7 vehicles met criteria
CIB false positive suppression: all 7 vehicles met criteria
DBS false positive suppression: 6 of 7 vehicles met criteria
Brake Application: For some vehicles, DBS activation can cause the brake pedal to move
beyond a commanded position (i.e., toward the floor without additional force from the driver’s
foot or programmable brake controller). When combined with a brake application designed to
maintain a constant pedal position throughout a test (known as “displacement feedback”), the
vehicle’s DBS system can be adversely affected. To address this, the DBS draft test procedure
now includes a “hybrid-feedback” control option that uses a combination of position and force
control logic.
During the 2013 FCAM tests, hybrid feedback helped certain vehicles realize better performance
than that observed by using displacement feedback. However, the limited data collected indicate
use of hybrid-based braking will not benefit most vehicles. With few exceptions, vehicles
achieved better DBS performance with displacement-feedback-based brake applications as
opposed to hybrid brake applications.
False Positives: No CIB false-positive events were recorded during the 2013 tests. However,
DBS false positives occurred during evaluations of two vehicles.
Surrogate Vehicle: No consistent differences in SV response were observed between tests
performed with the SSV versus the ADAC surrogate vehicle in the LVS scenario.

6
1.0 INTRODUCTION
Purpose of this Report 1.1.
Automatic Emergency Brake (AEB) systems are a subset of what the agency refers to as
Forward Crash Avoidance and Mitigation (FCAM) systems. Whereas the FCAM designation
includes systems that provide Forward Collision Warning (FCW) only, AEB systems such as
Crash Imminent Braking (CIB) and Dynamic Brake Support (DBS) are specifically designed to
help drivers avoid, or mitigate the severity of, rear-end crashes. CIB systems provide automatic
braking when forward-looking sensors indicate that a crash is imminent and the driver has not
braked, whereas DBS systems provide supplemental braking when sensors determine that driver-
applied braking is insufficient to avoid an imminent crash.
The purpose of this report is to summarize recent research conducted by the National Highway
Traffic Safety Administration (NHTSA) on AEB system technologies and to update a June 2012
NHTSA report titled, “Forward-Looking Advanced Braking Technologies Research Report” [1].
The agency published the June 2012 Report1 to:
Provide a technical development and market status of CIB and DBS technologies.
Present a preliminary estimate of the target crash population that could be addressed by
these technologies.
Present preliminary estimates of system effectiveness and resulting safety benefits.
Discuss draft test procedures and maneuvers used to evaluate CIB- and DBS-equipped
vehicles.
Present preliminary performance measures for CIB and DBS systems, as well as early
test results from production vehicles.
Simultaneous with the release of the June 2012 research report, the agency also released CIB and
DBS performance-based draft test procedures and issued a Request for Comment (RFC)2 in the
Federal Register [2,3,4].
In late 2012, the agency began a further study of FCAM technologies, specifically CIB and DBS
systems. This report contains the results of these research efforts, which focused primarily on
NHTSA’s testing of production systems, the refinement of the target population analysis, as well
as changes to the draft test procedures. Changes to the draft test procedures were based on
industry feedback received in response to the July 2012 RFC, as well as on continuing analysis
and research of FCAM technologies.
1 Subsequently referred to as the “June 2012 research report” for the remainder of this document.
2 Subsequently referred to as the “July 2012 RFC” for the remainder of this document.

7
July 2012 RFC Summary 1.2.
In the July 2012 RFC, the agency posed 27 questions to seek comments on a variety of areas
related to testing, performance, and benefits of advanced crash avoidance braking technology,
specifically:
Minimum performance requirements for such systems
Various aspects of the DBS test protocol, particularly brake application methods
Design elements of a surrogate vehicle or vehicles that could be used for CIB and DBS
testing, and improvements to the surrogate vehicle towing systems used thus far by
NHTSA
How to accommodate system suppression features (included in some manufacturers’
systems) in executing the proposed test procedures
General feedback in other areas of research included in the June 2012 research report
(benefits, crash population, international research, etc.)
Twenty-four (24) organizations provided comments in response to the July 2012 RFC.3 Most
commenters agreed with the agency’s belief that FCAM technologies will provide positive safety
benefits. Automobile manufacturers and suppliers of these advanced crash avoidance
technologies provided detailed technical feedback on the draft test procedures. Several
commenters recommended changes to the draft test procedures, such as replacing the lead
vehicle stopped (LVS) scenario with a lead vehicle decelerating to-a-stop scenario, allowing a
passing rate of less than 100 percent, and modifying the DBS brake-pedal-application method
and rate. Commenters were split on whether or not false-positive tests should be included.
While most commenters acknowledged the importance of preventing false activations, they did
not believe that all potential false-positive scenarios could be evaluated on a test track.
The July 2012 RFC and all comments received can be accessed at www.regulations.gov in
Docket NHTSA-2012-0057. The agency reviewed the target population and test protocols in
response to July 2012 RFC feedback. Changes made by the agency after the FCAM research
report and June 2012 draft test procedures are explained in the relevant sections of Sections 3, 4,
and 5 of this document.
3 Those who submitted comments in response to the RFC are: Advocates for Highway and Auto Safety (Advocates),
American Motorcyclist Association, Automotive Safety Council, Autoliv North America (Autoliv), BMW of North
America (BMW), Continental Automotive Systems, Inc. (Continental), Delphi Automotive (Delphi), Denso
Corporation (Denso), Dynamic Research, Inc. (DRI), Ford Motor Company (Ford), Global Automakers, Inc.
(Global), General Motors LLC (GM), Insurance Institute for Highway Safety (IIHS), Magna Electronics (Magna),
Mercedes-Benz USA (Mercedes), Mitsubishi Motors R&D of America, Inc. (Mitsubishi), Motorcycle Safety
Foundation, National Transportation Safety Board (NTSB), Robert Bosch LLC (Bosch), TK Holdings, Inc. (Takata),
Toyota Motor Corporation (Toyota), Truck and Engine Manufacturers Association (EMA), Volvo Car Corporation
(Volvo), Volkswagen Group of America (VW/Audi).

8
Forward Collision Avoidance and Mitigation (FCAM) Technologies 1.3.
FCAM refers to crash avoidance technologies that help reduce the likelihood of a forward-
moving vehicle being involved in a rear-end crash with another vehicle traveling in the same
direction directly in front of it. Depending on the implementation and driving situation, FCAM
systems are capable of automatically applying a vehicle’s foundation brakes or supplementing
the driver’s brake input in a way that prevents or mitigates the rear-end crash. NHTSA’s recent
FCAM research has focused on three technologies currently in the marketplace, which were
defined in the FCAM research report. They are defined again here, in slightly more detail, for
the convenience of the reader.
1.3.1. Forward Collision Warning (FCW)
FCW utilizes forward-looking sensors4 designed to monitor the distance between a forward
moving vehicle and another vehicle in its lane. If the system determines that the relative speed
of the vehicles and headway distance between the vehicles is such that a collision is likely, the
system alerts the driver by means of auditory, visual (e.g., on the dash board, heads up display
(HUD), and/or haptic (e.g., vibrations or movement in the seat, pedals, or steering wheel) alerts.
The timing of an FCW alert relative to an imminent rear-end collision is intended to provide the
driver with enough time to assess the potential hazard and respond with the appropriate
combination of braking or steering needed to avoid the crash.
1.3.2. Dynamic Brake Support (DBS)
DBS applies supplemental braking in situations in which the system has determined that the
braking applied by the driver is insufficient to avoid a collision. Typically, DBS relies on
information provided by forward-looking sensor(s) to determine when supplemental braking
should be applied. FCW most often works in concert with DBS by first warning the driver of the
situation and thereby providing the opportunity for the driver to initiate the necessary braking. If
the driver’s brake application is insufficient, DBS provides the additional braking needed to
avoid or mitigate the crash.
1.3.3. Crash Imminent Braking (CIB)
CIB systems also use forward-looking sensors to provide the information needed to determine
when automatic braking is necessary to avoid or mitigate the effects of a crash in those situations
in which the driver fails to apply any braking or steering in response to an FCW warning. In
such a situation, a CIB system will automatically apply braking (between partial and full braking
depending on system design and circumstances) in an attempt to avoid or mitigate the crash.
4 FCAM system sensors presently include radar, lidar (laser-based), camera(s), or combinations thereof. Future
sensing technologies may include infrared and dedicated short-range communication (DSRC) radios.

9
2.0 SAFETY CHALLENGES, TECHNOLOGY, AND MARKET OVERVIEW
This chapter reviews NHTSA’s preliminary estimate of the target crash population which may be
addressed by FCAM technologies, provides an overview of marketplace availability, briefly
discusses FCAM field data studies, and presents high-level summaries for preliminary estimated
FCAM system cost and preliminary safety benefits.
Target Population 2.1.
Approximately 1.7 million rear-end crashes occur each year. Not all of these would be expected
to benefit from FCAM technologies. The target population is the subset of crashes that could
potentially be avoided or mitigated by FCAM technologies.
The agency developed a detailed target population in the in the June 2012 research report,
finding that 910,000 crashes per year could potentially be avoided or mitigated. These crashes
involve an estimated 2,700,000 persons per year, and a total annual cost of $47 billion. More
than 400,000 people are injured and over 200 people are killed in these crashes each year.
This target population was arrived at through the following process:
First, the agency identified through known limitations of the technology that the target
population should be limited to crashes in which the front of a passenger vehicle (the
subject vehicle, or SV), which was going straight in a travel lane in a controlled fashion at
a speed of 9 mph or higher, strikes a motor vehicle (the lead vehicle, also referred to as the
principal other vehicle, or POV) that was stopped or going straight in the same lane and
direction as the SV, and the SV driver did not steer to try to avoid the crash.
Next, the agency conducted an in-depth review of a sample of rear end crashes from the
agency’s National Automotive Sampling System - Crashworthiness Data System (NASS-
CDS) and National Motor Vehicle Crash Causation Study (NMVCCS). Through this
review, the agency determined that crashes involving the following situations should not be
considered part of the target population of crashes expected to potentially have a favorable
effect by CIB and/or DBS:
o Crashes with a relative impact speed greater than 80 km/h (50 mph) in which a
fatality or fatalities occurred in the lead vehicle.
o Crashes in which a fatality or fatalities occurred in the following vehicle after an
impact with a large truck or trailer.
o Crashes involving the lead vehicle cutting into the lane of the following vehicle in
which the system would not have had time to detect and react to the crash threat.
The review of NASS-CDS and NMVCCS cases found that crashes involving these three
situations were so severe that current FCAM technology performance would not be able to
prevent, or favorably affect the outcomes, of these crashes.

10
As the number of rear end crashes is fairly constant at about 1.7 million per year, we have not
updated the target population estimation for this report.
Target Population by Crash Type 2.2.
Rear-end crashes are coded within NASS-GES into the following major categories that denote
the kinematic relationship between the striking and struck vehicle:
Lead Vehicle Moving (LVM) - struck vehicle was moving at a constant but slower speed,
compared to the striking vehicle.
Lead Vehicle Decelerating (LVD) - struck vehicle was decelerating at the time of impact.
Lead Vehicle Stopped (LVS) - struck vehicle was stopped at the time of impact.
NHTSA’s analysis of the crash data in support of the June 2012 research report on CIB and DBS
technologies showed that the target population of rear-end crashes by the above-listed categories
was approximately as follows:
LVM: 12%
LVD: 24%
LVS: 64%
In part because of the large percentage of rear-end crashes involving stopped lead vehicles,
NHTSA included such a scenario in its testing protocols for CIB and DBS technologies. In
response to the July 2012 RFC, several commenters noted that in real-world situations, many
lead vehicles that are coded in NASS-GES as “stopped” at the time of the collision were in fact
moving just prior to the collision. These commenters suggested that in many of those crashes the
lead vehicle would have been decelerating at the time it first came into the SV’s sensor tracking
range (i.e., its radar and/or camera range) and therefore would have been classified as a moving
or decelerating lead vehicle by the SV’s crash avoidance system. In other words, commenters
suggested there were fewer “true” LVS crashes (in which the struck vehicle was in fact
stationary before it was in the range of the SV’s tracking ability) than NHTSA had originally
estimated.
To better understand the rear-end crash population, and to respond to the above industry
feedback, the agency reviewed a sample of the NMVCCS crash cases coded as “lead vehicle
stopped” to determine whether they may in fact have been “lead vehicle decelerating to a stop.”
The review included examinations of case files containing scene descriptions; interviews with
drivers, passengers, or witnesses (if available); and the accompanying police accident reports.
This review revealed that in many of the crashes coded “lead vehicle stopped,” while the lead
vehicle was in fact stopped at the moment of impact, it had been decelerating while within the
tracking capability of the SV’s sensors. Based on the sample selection characteristics, NHTSA
was able to leverage crash descriptors in the NASS-GES database to estimate the percentage of
crashes coded as lead vehicle stopped (LVS) that were actually lead vehicle decelerating to a
stop crashes (subsequently referred to as the LVD2 scenario in this document) versus those for

11
which the lead vehicle had been stopped well before the SV sensors would have been able to
detect it (subsequently referred to as the LVD1 scenario in this document). In this preliminary
analysis, the agency showed that approximately half of the LVS-coded crashes were likely
LVD2 crashes, as shown in Figure 2-1.
FCAM Market and Technology Overview 2.3.
In 2011, NHTSA added FCW to its list of Recommended Advanced Technology Features in the
New Car Assessment Program (NCAP). Since the 2011 model year, NHTSA has asked
manufacturers to voluntarily indicate in an annual submission of vehicle-safety-related
information whether or not the vehicles they manufacture are equipped with certain advanced
crash avoidance technologies and, if so, whether or not those technologies meet the agency’s
applicable NCAP performance criteria for those technologies. Table 2-1 indicates the number of
vehicle models from model years 2011-2014 reported by manufacturers as offering FCW and
which of those models met NHTSA’s performance criteria (typically offered as optional
equipment, but in some instances included as a standard feature). Note that the actual number of
vehicle models in the marketplace offering FCW may be higher since it is possible some
manufacturers elect not to inform NHTSA of the availability of these systems on the vehicles
they manufacture. Also indicated in the chart is the total number of different vehicle models5
5 Vehicle models on www.safercar.gov are listed according to what is generally referred to as “trim lines.” So, for
example, 4x2 and 4x4 versions of a vehicle from a manufacturer marketed under a particular name are listed as
separate vehicles, but are the same “vehicle model”. As another example, four door, two door, and convertible
versions are listed as separate vehicles, but all are the same “vehicle model.”
Figure 2-1. Rear-end crashes by crash type
0
10
20
30
40
50
60
70
80
90
100
2012 Estimates Revised 2014 Estimate
Pe
rce
nt
LVM
LV Moving LV Moving
LVDecelerating
LV Decelerating
(LVD1)
LVStopped
LV Decelerating
to a Stop (LVD2)
LVStopped
64%
32%
24%
12%
24%
32%
Rear-End Crashes by Crash Type (avg. 2005-2009)
12%

12
listed on www.safercar.gov for the model year involved. Advanced crash avoidance
technologies, such as FCAM technologies, are typically first available commercially in a
relatively small number of new luxury vehicles. However, as shown in Table 2-1, the percent of
models offering FCW has increased substantially over the last four years.
Table 2-1. Number of MY 2011-2014 Vehicle Models Offering FCW
Model Year Vehicle Models Listed on
Safercar.gov
Vehicle Models
Offering FCW
Vehicle Models Meeting
NCAP FCW Criteria
2011 704 82 (12%) 37 (5%)
2012 760 83 (11%) 79 (10%)
2013 772 183 (24%) 166 (22%)
2014 713 314 (44%) 229 (32%)
Table 2-2 summarizes information received from vehicle manufacturers indicating whether CIB,
DBS, or both was available on vehicles they manufacture. The information shows a steady
increase in the number of vehicle models offering active braking technologies from 2012-2014.
Table 2-2. Number of MY 2012-2014 Vehicles Offering CIB, DBS, or Both6
Technology Model Year
2012 2013 2014
Both DBS and CIB Optional 90 131 173
Both DBS and CIB Standard 1 9 10
DBS Optional (and CIB not available) 39 12 18
DBS Standard (and CIB not available) 8 5 1
CIB Optional (and DBS not available) - 5 -
DBS Standard and CIB Optional - - 16
Total Vehicle Offering CIB, DBS, or Both 138 157 225
Total Vehicles 760 772 713
Percent of Models Offering CIB, DBS, or Both 18% 20% 32%
FCAM Field Experience 2.4.
The evaluation of FCAM technology in real-world operational settings (i.e. field testing) is an
important complement to test track, laboratory, simulation, and other analytical research, and
may provide the most realistic measure of performance, reliability, and customer acceptance.
6 The numbers in this chart reflect only that the manufacturer indicated that CIB, DBS, or both was available on a
vehicle, not whether the particular system performs up to any given set of performance criteria.

13
FCAM technology is, however, comparatively new to the marketplace and only limited field
testing has been completed by NHTSA. NHTSA is increasing its real-world assessment
activities with two new studies: a long-term exposure study involving 20 vehicles equipped with
FCW, CIB, and DBS; and a field test of over 2,000 vehicles equipped with FCW. Also, while
vehicle manufacturers engage in substantial real-world testing in the course of product
development, limited information on field testing of FCAM systems can be found in published
technical articles in the public domain.
2.4.1. NHTSA FCAM Field Studies
NHTSA is conducting field studies of FCAM technologies to better understand driver adaptation
issues and operational/performance characteristics. A summary of the on-going research is
discussed in the following sections.
2.4.1.1. Long-Term Exposure Study
In February 2013, NHTSA initiated a field-operational study that includes FCAM systems with
CIB and DBS capability. The key objective of the study is to determine driver adaptation to
FCAM systems and to better understand their impact on driver behavior. The study will result in
capturing driver-vehicle performance data over various time periods (from 3 months to 12
months) to determine driver-behavior adaptation and risk compensation.
The study includes a total of 20 model year 2013 vehicles equipped with FCW, CIB, and DBS
technologies operated by a total of 36 drivers. Each vehicle is instrumented with an on-board
data collection system that is linked to the vehicle’s CAN bus. Four video cameras are also
installed in each vehicle to capture the forward, side, and cockpit views. A variety of vehicle data
elements are recorded for pre-defined events (including system alerts and brake activations).
Such data include brake, steering, throttle and turn signal inputs, as well as vehicle speed,
acceleration, yaw rate and other kinematic data. Goals of the study include:
Identify the conditions that result in safety benefits to drivers using FCAM systems
Identify unintended consequences (e.g., driver distraction or risk compensation)
Understand role of user acceptance and its effect on system use and driving behavior
The study is also expected to help identify instances of false positives, false negatives, nuisance
alarms, as well driver usage and operational patterns. A final report is expected in 2015.
2.4.1.2. NHTSA Crash Avoidance Technology Field Data Collection Study
NHTSA is currently working with a vehicle manufacturer to collect field-operational data on
approximately 2,000 model year 2013 vehicles equipped with a camera-based (single-sensor)
crash avoidance system that includes FCW and lane departure warning (LDW) functionality.
The vehicles included in the study are production models purchased by customers from
dealerships across the country. Study participants were volunteers and provided written consent
for all data collection efforts. Vehicle kinematic and driver response data are collected for crash
avoidance system warning events through the production telematics system included on the

14
vehicles. Data are collected for approximately three seconds before and three seconds after each
predefined event (e.g., system warnings) and include information such as vehicle speed,
acceleration, as well as driver response to warnings (such as steering, brake, and throttle inputs).
Other “normal driving” data are also collected including on/off status and user-selected
sensitivity setting for the FCAM system. Analysis of the data will help NHTSA to better
understand how drivers utilize the crash avoidance system functionality, relative to traffic and
speed conditions, trip length, environmental factors, time of day, and other parameters.
Information on drivers’ reactions to warnings and if/how such reactions change over time will
also be collected.
2.4.2. Summary of Industry FCAM Field Studies
The field test data that have been documented by OEMs and others (and available in the public
domain) show that FCAM technologies reduce rear-end crashes, deaths and injuries. More
specifically:
A large study of insurance claims by the Highway Loss Data Institute indicates a
significant reduction in claim frequency for vehicles equipped with FCAM technology,
including vehicles equipped with FCW-only as well as those equipped with FCW
together with automatic braking features [7].
A multi-year, seven-million kilometer field study by Mercedes-Benz suggests that over
one-half of all rear-end crashes could be mitigated to some degree by FCAM
technologies [8].
A study of a low-speed automatic braking system indicates a reduction of 23 percent in
insurance claims related to rear-end crashes [9].
A study by the University of Adelaide in Australia predicted that FCAM systems (having
FCW together with automatic braking features) would reduce fatal crashes by 20 to 25
percent and injury crashes by 25 to 35 percent [10].
While continued collection of real-world performance data is needed to better understand
benefits and long-term driver-behavioral changes associated with FCAM systems, these early
studies provide insight into the safety potential of forward collision warning and automatic
braking systems.
Costs 2.5.
NHTSA contracted with Ricardo, Inc. to complete a cost tear-down study of FCW and related
automatic crash avoidance braking systems for light vehicles. The final report of this study was
published on May 16, 2012 and is titled, “Cost & Weight Analysis of Forward Collision
Warning System (FCWS) and Related Braking Systems for Light Vehicles” [11].
15
In the five vehicles analyzed by Ricardo, the retail costs7 for FCW, CIB, and DBS systems
varied widely, depending on the sensing technology implemented. Systems using a combination
of vision and radar sensing technologies were estimated to cost up to $459 while single-sensor
radar or camera (vision) systems were estimated at $115.
Trade journals and NHTSA’s own observations and experience with camera, radar, and
combined sensor systems indicate that these technologies will not only continue to improve
(mature), but also become more integrated within the vehicle. As such, the agency believes there
is a potential for cost change over time as manufacturers learn more about producing these units
and economies of scale develop with wider application. As the Ricardo research was completed
on model year 2011/12 vehicles, NHTSA will consider updating its cost tear-down study in the
future.
Preliminary Safety Benefits 2.6.
2.6.1. Approach
The agency developed preliminary benefit estimates for FCW, CIB, and DBS systems. These
preliminary estimates used the forward collision target population from the June 2012 research
report in combination with system performance assumptions implied by CIB/DBS draft
assessment reference values (ARV). The draft ARVs are performance metrics (i.e., speed
reductions or crash avoidance goals) associated with each of the various forward collision test
scenarios established for purposes of characterizing overall system performance (see Section 4.7
for additional details related to the draft ARVs). The preliminary estimates were also based on
assumptions that included the following:
All light vehicles will be equipped with FCW8
, CIB, and DBS. These CIB and DBS
systems will perform at levels equivalent to the minimum assessment reference values
listed in Section 4.7.
FCW will prevent 15 percent [12] of all injuries in the target population [13].
CIB and DBS target populations are mutually exclusive, that is, they include crashes in
which the driver braked (DBS), or did not brake (CIB).
No passenger vehicles currently in use are equipped with FCW, CIB, and/or DBS.9
2.6.2. Estimated Injuries/Lives Saved
Crash severity is often characterized by the “delta-v” measurement associated with the collision.
It is a measure of the change in velocity of the striking and struck vehicles just before and just
after the impact occurs. Delta-v reductions10
from the FCAM technologies were calculated based
on speed reductions associated with the CIB/DBS system draft ARVs presented in Section 4.7.
7 See docket NHTSA-2011-0066-0011 for details related to cost definitions and analyses.
8 The agency believes that manufacturers will not install CIB and DBS without FCW and for the purpose of
estimating benefits will assume FCW will provide a warning prior to any automatic brake intervention.

16
The corresponding reduction in injuries11,12
was estimated using injury risk versus delta-v curves
that have been previously used by the agency for its light vehicle tire pressure monitoring system
rulemaking.13
NASS-CDS [14] police-reported estimates of tow-away crashes were adjusted to
reflect all police-reported rear-end crashes.14
Using these assumptions and applying them to the target population, the agency tentatively
found that if CIB functionality alone were on all light vehicles, it could potentially prevent
approximately 40,000 minor/moderate injuries (Abbreviated Injury Scale (AIS) levels 1 and 2),
640 serious-to-critical injuries (AIS 3 – 5) and save approximately 40 lives, annually. DBS
alone on all light vehicles on the road could potentially prevent approximately 107,000
minor/moderate injuries (AIS 1 – 2), 2,100 serious-to-critical injuries (AIS 3 – 5), and save
approximately 25 lives, annually. These safety benefits from CIB and DBS would be
incremental to the benefits from an FCW alert.
FCW, CIB, and DBS combined on all light vehicles could potentially prevent approximately
200,000 minor injuries (AIS 1 - 2), 4,000 (AIS 3 – 5) serious injuries, and save approximately
100 lives annually, as shown in Table 2-3.
9 We assumed that no passenger vehicles currently in use are equipped with these technologies since the current
market penetration remains low at approximately 1 to 2 percent.
10 For the delta-v reduction estimate, the effective deceleration was derived from the initial system activation time-
to-collision (TTC) and the reduction in striking speed of the SV. The effective deceleration was assumed to be
constant during the CIB and DBS applications. In addition, we assumed that the initial TTC remains constant
regardless of the initial braking speed.
11 We assume that all rear-end collisions are perfectly plastic and the vehicles in them have the same mass, so that
their (shared) velocity after impact can be calculated by the conservation of momentum.
12 Delta-v is defined as a change in velocity of a vehicle in a front to rear-end crash. The reduction in delta-v was
calculated from the delta-v’s with and without the technologies. Due to limited NHTSA test data for each vehicle
tested, for the analysis, we used a regression line/curve to calculate the percent reduction in delta-v at a given delta-v
without the technologies.
13 For the safety benefit estimate, the delta-v with the technology (either CIB or DBS) at a given delta-v was
calculated with the percent reduction delta-v curve. For example, if we assume that a vehicle experiences a delta-v
of 20 mph without the technology and that CIB decreases the delta-v by 30 percent, the delta-v with the technology
would be 14 mph. According to the injury-risk curve, the risk of having an MAIS 2+ injury (a moderate injury
level based on the Maximum Abbreviated Injury Scale) would be 16 percent at a delta-v of 20 mph and 6 percent
with at a delta-v of 14 mph. Therefore, the percent reduction in MAIS 2+ injury would be 63 percent (1 - 6/16 =
63%). In addition, if we assume there are 30 MAIS 2+ injured occupants at a delta-v of 20 mph, the technology
would prevent 19 MAIS 2+ injuries (30 x 63% = 19 MAIS 2+).
14 According to the NASS-CDS, there were a total of 160,000 injuries in towed rear-end crashes. The NASS-GES
[15] showed that a total of 367,000 injuries in towed and non-towed rear-end crashes. Among the 367,000 NASS-
GES injuries, 204,000 were in towed crashes and the remaining 163,000 were non-towed crashes.

17
Table 2-3. Preliminary Benefit Estimates for FCAM Systems That Satisfy NHTSA’s Draft ARVs15
Injuries and Lives Saved, FCW+CIB+DBS
Minor Injuries Serious Injuries Fatal
200,000 4,000 100
NHTSA plans to complete additional research projects that could help the agency improve its
benefits assessment of AEB technology. These research projects include additional studies with
drivers using production vehicles equipped with the technology, studies of available crash data
for vehicles with and without the technology, and, additional studies that the agency has
underway with respect to crash warning systems. For example, NHTSA plans to gather
operational and performance information on several hundred production vehicles equipped with
optional AEB technology. The data from this study will provide information related to how
drivers respond to warnings in various conditions, the prevalence of false positives, overall
reliability and availability of the systems, and customer acceptance and usage data. NHTSA is
also planning a study to build off of previous work performed by the Insurance Institute for
Highway Safety. This study will use real world crash data to gain insight into system
performance, and will be completed with the cooperation of OEMs to determine the crash
avoidance technology content on specific vehicles using vehicle identification coding. Finally,
the injury risk curves used for the preliminary estimates in this report were based on older
vehicles. The agency is working to determine whether additional refinement of the risk curves
used to calculate injury reduction for this technology is required.
15
See Section 4 for details pertaining to CIB/DBS draft ARVs.

18
3.0 RECENT REFINEMENTS OF NHTSA’S CIB AND DBS DRAFT TEST PROCEDURES
History 3.1.
In the June 2012 research report, the agency explained its understanding of the current state of
forward-looking advanced braking technologies and described various key areas in which
additional information or refinements were needed. Section 3.2 of this document discusses the
agency’s work relating to the technical aspects of understanding and evaluating forward-looking
advanced braking technologies, specifically:
Test Protocols:
Reasonableness, Repeatability and Reproducibility
Brake Application Methodology
Vehicles and Tow Apparatus
False Positives/Non-activations
Evaluation Criteria Test Protocols
Speed Reduction
System Suppression
Developments since Publication of the July 2012 RFC and June 2012 3.2.Research Report
Between publication of the July 2012 RFC and the beginning of the agency’s 2013 FCAM test
track evaluations described in Section 4, advances in how NHTSA evaluated CIB/DBS systems
were made. Sections 3.2.1 through 3.2.3 describe the agency’s Strikeable Surrogate Vehicle
(SSV), changes to the CIB/DBS test methodologies, and briefly describes a series of CIB
evaluations performed in non-ideal environmental conditions, respectively.
3.2.1. Strikeable Surrogate Vehicle (SSV) 3.2.1.1.Overview
NHTSA uses surrogate vehicles (also known as strikeable artificial vehicles or test targets) to
safely, accurately, and objectively perform CIB and DBS performance evaluations on the test
track. The agency believes that a surrogate vehicle should ideally:
Be “realistic” (i.e., be interpreted the same as an actual vehicle) to systems using radar,
lidar, cameras, and/or infrared sensors to assess the potential threat of a rear-end crash;
Be robust (able to withstand repeated impacts with little to no change in shape over time);

19
Not impose harm to the test driver(s) or damage to the test vehicle under evaluation; and
Be capable of being accurately and repeatably constructed.
The agency has evaluated several surrogate vehicle designs in recent years (e.g., inflatable and
foam-based cars) and believes each possesses some potentially undesirable attributes. Of
particular concern are two elements capable of confounding track-based performance
assessments:
Non-realistic radar return and/or visual characteristics (i.e., the surrogate does not present
as an actual vehicle); and
A propensity for the surrogate’s shape to physically change throughout the testing
timeline (e.g., due to panel buffeting while in motion, sensitivity to changes in ambient
temperature, or due to damage sustained from repeated impacts). The shape of an actual
vehicle does not vary in the real-world; it remains dimensionally stable.
In 2012, NHTSA designed and manufactured the SSV, a carbon fiber-based surrogate vehicle
intended to address the design concerns described above. The extensive use of carbon fiber
provides a rigid structure that is stable under dynamic maneuvers and provides a consistent
presence for the following test vehicle to identify, classify, and respond appropriately to. The
body structure of the SSV simulates the rear end of a 2011 Ford Fiesta, so its physical
appearance is representative of a high-volume passenger car sold worldwide. The SSV
preliminary design specifications have been documented in a NHTSA report, “NHTSA’s
Strikeable Surrogate Vehicle Preliminary Design Overview” [5].
The following paragraphs discuss in more detail some of the important design attributes of the
SSV. Additional details about how the SSV is used during the conduct of CIB and DBS test
track evaluations are available within (1) the respective draft test procedures, and (2) the design
specifications available in the docket.
3.2.1.2. Design Attributes
a. Appearance
The SSV provides visual and dimensional characteristics representative of an actual vehicle
when approached from the rear to promote accurate identification and classification by the
CIB/DBS system of the vehicle being evaluated. Since the SSV body was based on a
dimensional scan of a 2011 Ford Fiesta, its height and width dimensions are inherently realistic.
To maximize visual realism, the SSV shell is wrapped with commercially available vinyl
material to simulate paint on the body panels and rear bumper, and a tinted glass rear window.
The SSV is equipped with a simulated United States specification rear license plate. The
taillights, rear bumper reflectors, and third brake light installed on the SSV are original
equipment from the production vehicle (see Figure 3-1). The SSV is rigid so it maintains the
same shape (i.e., visually, dimensionally, and from a radar-sensing perspective) over time.

20
Original equipment taillights, reflectors, and
third brake light. Lights
can be illuminated.
Simulated license
plate covered in
reflective material
Gap between rear wheels
Bumper with reflective strip
between foam and cover. The bumper shape is convex
with a 60 in (1.5 m) radius.
Vinyl wrap simulates paint
and a tinted rear window
Radar absorber used to “hide” towed rail and certain
slider/load frame elements
Hitch-equipped tow vehicle
Kevlar used behind simulated
tinted rear window (not visible) in lieu of carbon fiber
(radar transparent)
UHMW Lateral Restraint Track
(LRT) functions as a monorail to
guide the towed rail
Foam cushion dampens the impact of the SSV reaching
the end of the towed rail
after being struck
Towed rail assembly
Figure 3-1. Important design elements of NHTSA's SSV

21
b. Robustness
To reduce the potential of damage to the striking vehicle during an impact, the SSV is
constructed from carbon fiber, Kevlar, and Nomex honeycomb, lightweight composite materials
with favorable strength-to-weight characteristics. A foam bumper is attached to the rear of the
SSV to reduce the peak forces realized shortly after an impact occurs.
c. Radar Characteristics
The contour of the SSV rear bumper has been designed with a flat face to accommodate impacts
from vehicles with a wide range front bumper heights. However, the vertical orientation of this
face increased the radar cross section (RCS) of the rear aspect beyond that representative of most
light vehicles. Additionally, the radar-reflective carbon fiber shell of the SSV did not accurately
simulate a vehicle’s rear window when evaluated at certain frequency bands (for some bands the
window glass is radar-transparent). Therefore, tuning (attenuation) was performed to make the
SSV’s characteristics more representative of most light vehicles:
Bumper corners were rounded
The simulated rear window was made from Kevlar (a radar-transparent material) rather
than carbon fiber (highly radar-reflective)
A radar-absorbing mat was secured to the inside of the SSV’s rear bulkhead behind the
simulated rear window
Using highly accurate test equipment and scans performed at frequency bands representative of
those presently used by the automotive industry (i.e., 24 GHz and 77GHz), the Michigan
Transportation Research Institute (MTRI) and the University of Michigan Transportation
Research Institute (UMTRI) assessed the radar-return characteristics for the SSV, other surrogate
vehicles, and actual vehicles at different elevation aspects and azimuths. Results from this
evaluation were documented in a report titled, “Radar Measurements of NHTSA’s Surrogate
Vehicle SSV” [16]. This report indicates that the SSV exhibits automobile-like radar-scattering
characteristics at tail-aspect for both radar bands of interest, and that it is suitable for evaluating
radar-based detection systems.
3.2.1.3. Design Revisions
Since the public release of the preliminary SSV design specifications, the design has remained
largely unchanged. However, some adjustments have been made to improve durability and to
address concerns expressed by some vehicle manufacturers regarding how the SSV’s towed rail
presents to radar-based systems.
a. Durability Improvements
With regards to durability, three elements were changed during the 2013 testing season:

22
The brackets used to support load frame movement along the towed rail assembly have
been redesigned. The new brackets are stronger, lighter, and now connected
longitudinally.
Shock absorbers were added between the load frame and the energy-absorbing nylon
straps connecting the load frame to the slider assembly
Reinforcements were made to the SSV shell in front of the simulated wheels
The design intent of the SSV is to withstand repeated impacts at relative speeds of up to 25 mph
(40.2 km/h). With the provisions listed above, the SSV has successfully withstood repeated
impacts of approximately 20 mph (32.2 km/h) without damage, 4.8 mph (7.7 km/h) greater than
the highest nominal impact speed the SSV would be expected to sustain during a test in which
the SV satisfies the minimum CIB performance defined by the draft ARVs described in Section
4.7. While NHTSA believes higher-speed impacts can be supported and that the SSV provides
the agency with most of the attributes needed to objectively evaluate FCAM technologies,
concerns remain about the durability of the unit should repeated impacts at the maximum relative
speed be imposed in the LVS scenario. For this reason, the SSV appears to be most
appropriately used at this time for providing the test track data in evaluation programs for
vehicles whose CIB systems are expected to provide speed reductions of at least 5 mph (8.0
km/h). Research programs requiring a surrogate vehicle with higher impact speed capability, but
with potentially less absolute realism, may be better suited to consider use of an SSV alternative.
Note: None of the components added to improve SSV durability, shown in Figure 3-2, are
expected to alter the SSV radar-return characteristics (e.g., RCS), as they are concealed by its
carbon fiber shell or behind radar-absorbing material.
Figure 3-2. Components installed to improve SSV durability
Shock absorber installed between the slider and
load frame
Improved load frame
supports (7075 aluminum) and longitudinal connecter
(carbon fiber)
Location of SSV
shell reinforcement (carbon fiber)

23
b. More Appropriate Radar Reflectivity
Multiple vehicle manufacturers, suppliers, and testing organizations have performed short,
collaborative SSV evaluations with NHTSA. The intent of this work was not to provide the
agency with insight into proprietary CIB/DBS algorithms or design, but rather to understand how
contemporary systems perceive the SSV and its peripherals. To do this, a series of scans were
performed, with a focus on answering three questions:
1. At what longitudinal distance was the SSV first detected?
2. At what longitudinal distance was the SSV first classified as a vehicle?
3. Did the SSV classification remain stable (i.e., continuously identified as a vehicle
throughout the pre-crash timeline)?
The vehicles used to perform the scans were equipped with automotive-grade radar and camera-
based sensors, most of which were part of commercially available FCW/CIB/DBS systems.
However, unlike the standard production implementation, these systems were configured in a
way that allowed sensor data and system measurements to be monitored and recorded for later
Radar absorber conceals the line-of-
sight RCS of the towed rail
Figure 3-3. Wideband radar-absorbing material installed on first section of the SSV towed rail
Figure 3-4. Wideband radar-absorbing material installed on the SSV load frame

24
review. Under confidentiality agreements, system performance summaries were then submitted
to the agency for analysis. This provided valuable information the agency would not have
otherwise been able to obtain.
Generally speaking, the feedback provided by the participants in the collaborative research effort
was favorable. With few exceptions, the SSV was detected and classified as if it was an actual
vehicle. However, one participant indicated that the towed rail assembly that the SSV rides on
was detected by their vehicle’s radar system due to the gap present between the simulated tires of
the SSV. As explained by the participant, the rail assembly, which visually looks like a long
ladder set flat on the ground, has the potential of being misclassified as a guardrail at the
entrance of a curved road. Should such misclassification occur, inconsistent and/or sub-optimal
performance may be realized, including the suppression of automatic/supplementary braking. In
the real world, such control logic is intended to reduce the incidence of false positives.
However, such suppression would likely prevent the vehicle from achieving satisfactory speed
reductions during the agency’s test-track evaluations.
To address this issue, NHTSA has installed a combination of shallow ramps and wideband radar-
absorbing material to the first section of the towed rail assembly (Figure 3-3) and additional
radar-absorbing material to the rear of the SSV load frame (Figure 3-4). Although these
countermeasures were not validated prior to performing the 2013 FCAM tests, the intent was to
prevent radar waves from traveling under the SSV (i.e., between the simulated tires), thereby
preventing the sensor from detecting the RCS of the towed rail’s horizontal members.
3.2.2. Changes to the CIB/DBS Test Methodologies
With regard to improved test methodology, the agency has focused on two areas: the inclusion
of two new test scenarios to further evaluate CIB/DBS system robustness, and brake application
revisions intended to better allow DBS systems to demonstrate their speed reduction capabilities.
3.2.2.1. Inclusion of New Test Scenarios
a. Lead Vehicle Decelerating (LVD)
The rear-end crash problem is dominated by three pre-crash scenarios: the SV encounters either
a stationary lead vehicle (LVS); the SV encounters a slower moving lead vehicle (LVM); and SV
encounters a decelerating lead vehicle (LVD). In early 2013, the agency developed LVD
maneuvers to complement the LVS and LVM maneuvers already used to objectively evaluate
CIB/DBS system performance on the test track. Prior to this time, NHTSA had not used LVD
maneuvers for this purpose for three reasons: (1) it was not possible to perform LVD maneuvers
with sufficient accuracy and repeatability with the tow apparatus associated with the balloon and
foam-based surrogate vehicles previously used by NHTSA during its CIB/DBS test track
evaluations; (2) the agency believed the LVD target population was relatively small (due to an
over-estimation of the LVS target population, as discussed in Section 2.3); and (3) the agency
believed that the test track performance observed during conduct of the LVM maneuvers
provided a reasonable indication of a vehicle’s capability in the LVD scenario. However, results
from a 2012 ADAC report documenting their CIB and DBS performance evaluations
contradicted this belief [17]. Using ten late-model European-specification vehicles and a series

25
of LVS, LVM and LVD test scenarios, the ADAC found that vehicles with the best LVM speed
reductions did not always have the best (or even comparable) speed reductions during their
respective LVD evaluations. Based on the ADAC data, and the fact that NHTSA’s recent
advances in surrogate vehicle and tow apparatus design now enable accurate and repeatable LVD
test conduct, the agency decided to include LVD scenarios in 2013 FCAM test matrix.
In developing its LVD maneuvers, the agency considered the pre-crash circumstances of real-
world lead vehicle decelerating scenarios. The first maneuver (LVD1) simulates the scenario
where a lead vehicle decelerates to a slower speed in front of the SV and a crash between the two
vehicles occurs while the lead vehicle is still decelerating. The second maneuver (LVD2)
simulates the scenario where a lead vehicle decelerates to a stop before being struck by the SV.
Each NHTSA LVD maneuver specifies that the lead vehicle decelerate at 0.3g, the same
deceleration magnitude used in the agency’s FCW NCAP program. To maximize the accuracy
and consistency by which the POV deceleration was achieved, a second brake controller was
installed in the SSV tow vehicle.
Subject Vehicle (SV) and Principal Other Vehicle (POV) Speed Considerations
Multiple combinations of SV and POV speeds and headways were evaluated before selecting the
initial conditions ultimately used for NHTSA’s LVD test maneuvers (see Table 3-1). During
each test condition, the nominal POV deceleration of 0.3g was achieved 1.5 seconds after its
brakes were applied.
Table 3-1. LVD Development Test Matrix
SV and POV Speed Initial Headway Nominal
POV
Decel
(g)
Nominal Impact
Speed* Comment
(mph) (km/h) (ft) (m) (mph) (km/h)
35 56.3
26.0 7.9
0.3g
15 24.1 LVD1_35_26.0
45.3 13.8 20 32.2 LVD1_35_45.3
70.5 21.5 25 40.2 LVD1_35_70.5
25 40.2
26.0 7.9 15 24.1 LVD1_25_26.0
45.3 13.8 20 32.2 LVD1_25_45.3
25 40.2
147.3 44.9
0.3g
25 40.2
LVD2_25_147.3;
intended to have the POV
be stopped for 2.1 s before
impact
98.4 30.0 25 40.2 LVD2_25_98.4; NCAP
FCW LVD headway
*Nominal impact speed is relative and assumes no SV brake application or CIB/DBS speed reductions.

26
As with the agency’s LVM maneuvers, NHTSA wanted to include multiple vehicle speeds to
evaluate CIB/DBS system robustness over a range of vehicle speeds, as well as the use of the
LVM maneuver’s 25 and 45 mph (40.2 and 72.4 km/h) test speeds. However, because the initial
conditions of the LVD maneuver specify that both the SV and the surrogate POV travel at the
same speed prior to the POV brake application, the agency had to consider the maximum speed
the surrogate vehicle could be safety accelerated to and towed at. These factors are related not
only to the design of the SSV itself, but also the length of the SSV monorail16
and available
testing area.
In the scenario where the SV’s CIB/DBS system needs to respond to a decelerating lead vehicle
that is still moving (LVD1), the SV and POV initial travel speeds tested were 25 and 35 mph
(40.2 and 56.3 km/h), respectively. With the correct headway, use of these scenario/speed
combinations imposed a nominal impact speed no higher than 25 mph (40.2 km/h), which was
the upper impact design threshold of the agency’s SSV. It was not possible to conduct the LVD1
scenario with a SV and POV initial travel speed of 45 mph (72.4 km/h), due to test equipment
and test track length limitations.
For the scenario where the lead vehicle decelerates to a stop (LVD2), the only SV and POV
initial travel speed tested was 25 mph (40.2 km/h). The reason for this was twofold: it was the
maximum relative speed supported by the design of SSV17
, and it was the same SV speed used in
the slower LVM scenario. Due to the lower speeds, these tests were safe to perform and imposed
acceptable facility length requirements.
SV-to-POV Headway Considerations
The headway specified for a given LVD maneuver determines maneuver severity, quantified by
the nominal impact speed. During the development of the LVD maneuvers, multiple headways
shown in Table 3-1 were selected to include a wide range of operating conditions (i.e., very close
to far away) while still ensuring that the maximum nominal relative impact speed was less than
25 mph (40.2 km/h).
Test Vehicles
Two production vehicles equipped with commercially available CIB systems were used for the
LVD test development: a 2012 Volvo S60 (equipped with a mono camera, a 77 GHz radar, and
lidar) and a 2013 Subaru Outback (equipped with a stereo camera system).
LVD Speed and Headway Selection
The CIB speed reductions associated with each LVD1 and LVD2 variant shown in Table 3-1 are
shown in Table 3-2. Nominally, these speed reductions could be achieved by a vehicle that
instantly achieves a deceleration of 0.6g at a time-to-collision (TTC) of 0.6s. Note that the name
16
A long plastic guide used to prevent nearly all lateral lane deviation when the SSV is in motion. 17
Recall that if the SV brakes are not applied in the LVD2 scenario (e.g., CIB does not operate), it will nominally
impact the POV at same speed used at the beginning of the test.

27
convention used for each scenario listed in Tables 3-2, 3-3, and 3-4 describes the speed and
headway used (e.g., LVD1 35_26.0 refers to a LVD1 test maneuver performed with the SV and
POV both initially moving at 35 mph (56.3 mph) with a headway of 26.0 ft (7.9 m)).
Table 3-2. LVD Draft Assessment Reference Values (ARVs) – SV CIB Speed Reductions
LVD1
35_26.0
LVD1
35_45.3
LVD1
35_70.5
LVD1
25_26.0
LVD1
25_45.3
LVD2
25_147.3
LVD2
25_98.4
13.2 mph
(21.2 km/h)
10.5 mph
(16.9 km/h)
9.7 mph
(15.6 km/h)
13.2 mph
(21.2 km/h)
10.5 mph
(16.9 km/h)
9.8 mph
(15.8 km/h)
9.8 mph
(15.8 km/h)
Tables 3-3 and 3-4 summarize the LVD development tests performed with each combination of
vehicle, maneuver, speed, and headway. Table 3-3 provides a summary of how many individual
trials performed per scenario were able to satisfy the respective draft ARVs, whereas Table 3-4
summarizes crash avoidance capability to further quantify system performance.
Table 3-3. Number of Trials with Speed Reductions Greater Than or Equal to the Draft ARV
Vehicle LVD1
35_26.0
LVD1
35_45.3
LVD1
35_70.5
LVD1
25_26.0
LVD1
25_45.3
LVD2
25_147.3
LVD2
25_98.4
Volvo
S60
Not
Performed 3/3 1/2
1 5/5 5/5 5/5 6/6
Subaru
Outback 0/4 3/3 3/3 0/8 4/4 5/5 5/5
1CIB did not engage during one of four tests performed, however only two of these tests produced data due
to a data acquisition problem.
Table 3-4. Number of Trials with Crash Avoidance
Vehicle LVD1
35_26.0
LVD1
35_45.3
LVD1
35_70.5
LVD1
25_26.0
LVD1
25_45.3
LVD2
25_147.3
LVD2
25_98.4
Volvo
S60
Not
Performed 0/3 0/2
1 5/5 5/5 0/5 3/6
Subaru
Outback 0/4 1/3 2/3 0/8 4/4 5/5 5/5
1CIB did not engage during one of four tests performed, however only two of these tests produced data due
to a data acquisition problem.
With the exception of the LVD1 scenario performed from 35 mph with the longest headway
(70.5 ft (21.5 m)), the Volvo S60 was able to achieve the desired speed reductions for each
scenario tested. In the case of the Subaru Outback, the vehicle was able to achieve the desired
speed reductions for each scenario except the two LVD1 tests performed with the shortest
headway (26 ft (7.9 m)).

28
Ultimately, the final LVD1 and LVD2 maneuvers were selected on the basis of the following
four evaluation factors:
The LVD development test results shown in Tables 3-3 and 3-4
Acknowledging that it may be difficult for CIB/DBS systems to effectively respond to a
scenario performed with a 26 ft (7.9 m) headway at the near limit of the 8 ft tolerance
specified in the FCW NCAP test procedure. This would be unreasonably close, as the
SV-to-POV headway would be only 14 ft (4.3 m) when the POV initiated braking
A desire to be reasonable with the test burden imposed by incorporation of the LVD tests
into the CIB/DBS draft test procedures
A desire to differentiate the LVD1 and LVD2 maneuvers to the greatest extent possible.
With respect to the LVD1 maneuver, the combination of a 35 mph (56.3 km/h) SV and POV
initial speed and 45.3 ft (13.8 m) initial headway was selected. This combination uses the
highest speed at which NHTSA is able to safely perform LVD evaluations in conjunction with a
headway that results in (1) a relatively tight SV-to-POV proximity, and (2) a nominal impact
speed of 20 mph (32.2 km/h) should the SV CIB system not provide any braking prior to impact.
For the LVD2 maneuver, the combination of a 25 mph (40.2 km/h) SV and POV initial speed
and 328 ft (100.0 m) initial headway was selected. The test speed used in this scenario was the
maximum supported by the SSV (i.e., the maximum collision design speed of 25 mph (30.2
km/h) if the test vehicle’s CIB system did not activate) at the time the tests were performed. At
328 ft (100.0 m), the selected LVD2 headway is much longer than even the longest evaluated
experimentally (98.4 ft (30.0 m)). However, it ensures the POV has come to a complete stop
prior to any SV brake application. Even with this long headway, the sensor ranges associated
with all contemporary production CIB and DBS systems known to NHTSA are sufficiently high
that they would be expected to detect the POV deceleration well ahead of it being braked to a
complete stop.
b. Inclusion of a False Positive Assessment Using a Steel Trench Plate
NHTSA has been concerned about the safety implications associated with automatic emergency
braking systems that could activate under conditions when no immediate threat exists. The
agency defines this condition as a “false positive” condition because the system could falsely
activate braking when it is unnecessary. Potentially, in a worst-case scenario, a false positive
event could be the cause of a crash. Furthermore, if false activations were to occur in real world
conditions, vehicle operators might decide to turn the systems off.
In 2011, the agency completed a research program intended to evaluate whether CIB false
positives could be consistently induced on the test track using simulated real-world driving
scenarios. The agency also wanted to assess the practicality of these scenarios being executed
accurately and repeatedly. The report, “An Evaluation of CIB System Susceptibility to Non-
Threatening Driving Scenarios on the Test Track” [18] documented this work.

29
The false positive test matrix included eight scenarios and five vehicles. The scenarios were
chosen after review of work performed by other research, testing, and international organizations
such as the Crash Avoidance Metric Partnership (CAMP), the International Organization for
Standardization (ISO), and Euro NCAP [19,20,21], and included the following:
Objects in the roadway (Botts’ dots18
and steel trench plate)
Decelerating vehicles in adjacent lanes on straight and curved roads
Roadside vehicle placement on straightaway and curved roads
Driving under overhead structures
The test vehicles were contemporary passenger cars and sport utility vehicles (model years 2008-
2011) equipped with a variety of single- and multiple-sensor combinations. Of the eight
scenarios tested, only one was found to elicit CIB false positive events. That scenario, driving
over the 8 ft x 12 ft x 1 in (2.4 m x 3.7 m x 25 mm) ASTM A36 steel trench plate shown in
Figure 3-5, was the single false positive test condition included in the agency’s follow-on 2013
FCAM test program described in Section 4 of this document, and in the August 2014 CIB and
DBS draft test procedures.
NHTSA recognizes that each sensing technology used by a particular CIB/DBS system (e.g.,
radar, lidar, cameras, etc.), is likely to have a unique vulnerability. Although the agency has
identified the steel trench plate as a real-world scenario capable of challenging radar-based
systems, it has not defined comparable scenarios relevant for other technologies, namely camera-
18
Round raised pavement markers common on California freeways and highways.
Figure 3-5. Steel plate used to evaluate unintended CIB/DBS activations
30
based systems or those based on combinations of multiple sensing technologies. For these
systems, poor visibility and/or environment conditions (e.g., sun angle, glare, color contrast,
shadows), odd roadway geometries, and/or pavement markings (e.g., curvature, grade, lane
markings, etc.) are challenging factors capable of negatively affecting system performance.
However, recreating these conditions precisely and repeatably on the test track is difficult.
Therefore, NHTSA has only included the steel trench plate in the agency’s current CIB/DBS
draft test procedures.
3.2.2.2. Revision of Brake Application Methods Used for DBS Evaluation
NHTSA uses a programmable brake controller (robot) for all brake inputs applied during DBS
testing. This required the agency to first define what constitutes a “realistic and appropriate”
crash avoidance brake application so that the input conditions specified in the DBS draft test
procedures would relate to those used by real-world drivers. However, this realism also had to
be balanced with the DBS activation criteria used by production algorithms and what
applications are technically achievable with commercially available brake controllers.
Ultimately, NHTSA believes the best brake application is one that offers the best combination
of:
Ability to activate DBS
Input definability (via use of characterization data)
Ability to show improvements over a baseline brake condition
Accuracy
Repeatability
In response to the July 2012 RFC, NHTSA received comments about the brake application
methods specified in the June 2012 DBS draft test procedure. Based on this feedback and on the
agency’s own observations during previous DBS test track evaluations, the agency made
revisions to the brake pedal application speed and control logic used to command the
applications.
a. Increased Brake Pedal Application Rate
The brake pedal application speed specified in the DBS draft test procedure must be sufficiently
high that it satisfies the thresholds required by production DBS systems, yet low enough that the
vehicle’s conventional brake assist (BA)19
is not activated.
Early drafts of NHTSA’s DBS test procedures specified a nominal brake application rate of 12.6
in/s (320 mm/s), a value within a range of pedal rates associated with panic inputs, but near the
end of the distribution associated with “normal” driving, as shown in Figure 3-620
[22].
However, after review of NHTSA’s subsequent track-based test data and consultation with
braking experts from the automakers and FCAM system suppliers, this rate was believed to be
19
Conventional BA is a technology that initiates supplemental braking based on brake pedal application rate without
the use of any forward-sensing information.

31
too high. For at least one vehicle tested by NHTSA21
, an application rate of 12.6 in/s (320 mm/s)
appeared to be sufficient to activate its conventional brake assist. For this vehicle, tests
performed with and without a surrogate vehicle in the SV’s forward path (i.e., DBS vs. baseline
test trials) both produced high decelerations and nearly identical speed reductions. As a result,
although the braking performance observed without the test target could be attributed to
conventional BA alone; it was not possible to distinguish the contribution of DBS from
conventional BA when the target was used.
In response to this concern, NHTSA lowered the nominal application rate by approximately one-
half to 6 in/s (152 mm/s), with a tolerance of ± 1 in/s (25.4 mm/s), and incorporated the revision
into the agency’s publically-available June 2012 DBS draft test procedure. However, numerous
RFC commenters indicated this reduction was too extreme since tuning a DBS system to respond
to such a low application rate could result in DBS activations in real-world driving situations
where they are not needed. To address these concerns, the latest DBS draft test procedure
specifies a nominal pedal application speed of 10 in/s (254 mm/s) with a tolerance of ± 1 in/s
20
This study examined real-world responses of common drivers in both emergency and non-emergency situations,
with the goal of optimizing proper vehicle responses to critical situations and minimizing inappropriate ones during
normal driving. Figure 3-6 replicates a graph from that study, showing the different distributions of emergency and
non-emergency brake pedal speed. By dividing the x-axis into 25 equal parts and interpolating the cumulative
frequency, it is possible to estimate that approximately 99.8 percent of non-emergency brake pedal speeds were 320
mm/s or slower for this particular vehicle and study. Using the same process, it is estimated that 36.1 percent of
emergency brake pedal speeds were 320 mm/s or slower.
A shaded region is superimposed atop the graph which depicts the range of brake pedal rates used to activate
conventional BA [23], using a displacement feedback-based application. These pedal rates ranged from 472.4 –
683.3 mm/s (18.6 – 26.9 in/s). Based on the data presented in [22], selecting a brake pedal speed of 320 mm/s (12.6
in/s) implies that approximately 63.9 percent of drivers could attain this application rate in emergency situations and
still be unlikely to activate conventional BA, as it is only 68 percent of the slowest application rate observed in [23].
21
Results discussed in the 2012 FCAM research report.
Figure 3-6. Brake applications used by drivers in emergency and non-emergency situations

32
(25 mm/s). This produces an allowable range of 9 to 11 in/s (229 to 280 mm/s), and NHTSA
believes this sufficiently addresses industry’s concern of slow brake pedal inputs contributing to
DBS false positives (from an activation speed perspective), while still being much less than what
is required for conventional BA.
b. Hybrid Feedback Control
Historically, NHTSA has used a programmable brake controller and two brake applications
(“displacement feedback” and “force feedback”) to evaluate DBS performance on the test track.
With force feedback, the controller modulates actuator displacement to maintain constant brake
pedal force for the duration of the braking event. Conversely, displacement-feedback control
modulates actuator force to achieve the desired constant brake pedal position.
As explained in Section 3.2.2.2, brake pedal application rate is an important consideration for
DBS evaluations, and for this reason it must be accurately controlled. Displacement feedback-
based applications allow the desired application rate to be directly and accurately specified as
position achieved per unit of time (e.g., mm/s), and it is not affected by brake pedal free play
(mechanical slack present until just after force has been applied to the brake pedal). This is not
necessarily the case when force feedback applications are used since the amount of force
required to overcome free play is typically much less than that needed to produce deceleration.
Therefore, for force feedback to apply a constant force per unit of time during a single
application, brake pedal displacement speed can vary from slow (while the brake pedal is
accelerated from rest) to fast (achieving the desired force gradient requires the pedal to move
more rapidly). This is an important difference when comparing the implications of using a
particular feedback algorithm. Since NHTSA has seen discontinuities of pedal velocity result in
inconsistent DBS activation, the agency has generally favored use of displacement-based brake
applications.
Unfortunately, test track evaluations performed by NHTSA and some vehicle manufacturers
indicate the interaction between displacement-based brake pedal control and the DBS control
algorithms used by certain vehicles may adversely affect system performance. For some
vehicles, DBS activation can cause the brake pedal to physically move towards the floor without
additional force applied from the driver’s foot. However, since the brake pedal is held at a fixed
position during tests performed with displacement feedback control, this motion is not possible
and the constraint can confound the test outcome. For affected vehicles, holding the brake pedal
position constant while DBS is active can induce a pressure gradient within the system
hydraulics similar to that caused by the driver releasing force from the brake pedal. If the system
relies on these pressure data (and not brake pedal position, which would indicate the driver has
not released their application) to determine the driver’s requested brake output, it may decide the
supplemental braking provided by DBS is no longer needed. As a result, DBS is disengaged and
normal unassisted braking resumed.
To evaluate whether alternative brake application methods could be used to accommodate
vehicles with these operational characteristics, NHTSA performed a series of tests to assess the
viability of incorporating “hybrid feedback” brake applications into the agency’s DBS draft test
procedure. These applications use a combination of displacement and force control strategies
rather than displacement feedback alone. To begin a hybrid application, the same application

33
rate and position used for displacement-feedback tests were commanded. However, once at the
desired position, the application force was reduced at a rate of 56.2 lbf/s (250 N/s) to a force
magnitude equal to 50 percent of that capable of achieving an average deceleration of 0.3g
during the vehicle’s brake system characterization. The intent of this strategy is to ensure some
force remains present at the brake pedal for the duration of the test trial, but at a low enough
level that the pedal displacement is not increased substantially22
. Figure 3-7 presents a
conceptual comparison of the displacement and hybrid feedback-based brake applications for a
vehicle whose brake pedal falls towards the floor during DBS activation. Note how the hybrid
application uses displacement feedback to establish the initial pedal position, and then switches
to force-based control.
Prior to performing the 2013 FCAM tests described in Section 4, NHTSA had very little
experience with the use of hybrid feedback-based brake applications. The brake controllers
previously used by NHTSA were not equipped with the necessary functionality. To address this
shortcoming, a brake controller with greater capability was purchased (a “C-Bar” from Anthony
Best Dynamics) and a late-model vehicle with DBS performance affected by use of displacement
feedback was obtained (a 2014 Mercedes ML320).
Since use of displacement feedback to command the initial brake application rate has not been
problematic or criticized by industry, all hybrid feedback development at NHTSA focused on
what happens after the displacement-feedback target magnitude was achieved, when the
controller’s logic changes from displacement to force-based control. From that point,
identification of two specifications was required: (1) the application force target magnitude and
(2) the manner in which force should be applied from the transition point to the force target.
22
Increasing brake pedal displacement generally increases a vehicle’s deceleration. If it is allowed to increase too
much beyond the magnitude used for displacement feedback, there is concern a vehicle could satisfy the DBS draft
ARVs (i.e., speed reductions) by virtue of the increased brake pedal travel, not necessary because of the DBS
intervention.
Figure 3-7. Conceptual comparison of displacement versus hybrid feedback brake applications
Ped
al
Dis
pla
cem
en
t
P
eda
l F
orc
e
Time
Displacement feedback
Hybrid feedback
Shaded region indicates the time interval during which
DBS activations may affect the brake application

34
Although testing was limited, multiple combinations of these factors were evaluated with the
Mercedes ML320. Ultimately, the hybrid-based applications best able to prevent the brake pedal
force from reaching zero while maintaining strong deceleration and no DBS dropouts (i.e.,
instances where the supplemental braking provided by DBS becomes unavailable) were
identified. Specifically, the applications included the following elements:
Displacement feedback used to achieve the desired brake pedal position (i.e., the position
needed to achieve a deceleration of 0.3g during brake system characterization) at a rate of
10 in/s (254 mm/s)
Control logic changed to force feedback
Application force reduced at 56.2 lbf/s (250 N/s) to the desired pedal force (i.e., 50
percent of the force needed to achieve a deceleration of 0.3g during brake system
characterization)
Figure 3-8 compares two trials from Mercedes ML320 tests performed with hybrid-based
applications: with (bold line) and without (thin line) DBS activation. Note that although the
pedal force did not cleanly follow the requested 56.2 lbf/s (250 N/s) force fallback rate during
the test with DBS or rigidly maintain the requested 6.1 lbf (27.2 N) fallback force thereafter,
brake pedal displacement was increased to prevent a zero-force condition, and minimum range
was achieved before deceleration reverted to the foundation brake system level. In this figure,
no surrogate vehicle was used during the baseline tests to prevent DBS from being activated. A
surrogate was used for the other test, however, and DBS was activated. Note that in this figure,
as well as in Figures 3-9 and 3-10, “BC” is defined as “brake controller.”

35
Minimum range
observed during the
hybrid feedback test
performed with a
surrogate vehicle.
Minimum range
occurs while DBS is
in operation.
High DBS-based
deceleration is realized
until minimum range;
deceleration does not
revert to a level
achieved by foundation
brakes alone.
When DBS is
activated, hybrid
feedback increases
the brake pedal
position to prevent
applied pedal force
from relaxing to zero.
Stable DBS operation
(no dropouts)
Figure 3-8. Hybrid feedback brake applications performed with the Mercedes ML320

36
Figure 3-9 compares Mercedes ML320 three trials performed with displacement and hybrid-
based applications. Although DBS was activated during each trial, note that system dropouts
were present during both displacement feedback trials (indicated with blue and blue dotted data
traces), one of which concluded with an impact. No DBS dropout occurred during the hybrid
test (red data trace).
DBS dropouts prior to impact
or minimum range DBS dropout (post minimum range,
not believed to affect test outcome)
Figure 3-9. Displacement and hybrid feedback brake applications performed with the Mercedes ML320

37
Figure 3-10 compares the Mercedes ML320 hybrid-based application shown in Figure 3-9 with
that observed during a similar test performed with a Subaru Outback. The comparison is
important for three reasons: (1) like the Mercedes ML320, tests performed with the Subaru
Outback and displacement feedback can result in applied force falling to zero; (2) unlike the
Mercedes ML320, the reduced application force does not appear to adversely affect test
Pedal displacement increases over
time with the ML350, while
decreasing with the Outback
Both vehicles are free from
DBS dropouts
Figure 3-10. Hybrid feedback brake applications performed with the Mercedes ML320 and Subaru Outback

38
outcome; and (3) even though they are not required to promote proper system operation, use of
hybrid-based applications do not appear to adversely affect the Subaru Outback DBS
performance (i.e., the applications “did no harm”). In other words, when compared to the
Mercedes ML320, the DBS performance observed with the Subaru Outback appeared to be less
sensitive to the manner in which the vehicle’s brakes were applied.
After considering the results of these two vehicles, NHTSA determined that using hybrid
feedback caused one vehicle’s DBS system to operate in a manner consistent with that expected
by its manufacturer, and appeared to have no adverse effect on the other vehicle’s DBS system
functionality. For this reason, hybrid-based brake applications were deemed suitable for
inclusion into the 2013 FCAM test matrix described in Section 4.
3.2.3. Non-Ideal Environmental Condition Tests
In April 2013, the agency evaluated how the two CIB-equipped vehicles used for the LVD
development work previously described in Section 3.2.2.1.a would perform in three non-ideal
environmental conditions. The vehicles were selected because of their different sensor sets (the
Volvo S60 was equipped with a mono camera, lidar, and a 77 GHz radar, whereas the Subaru
Outback was equipped with stereo cameras) and availability (NHTSA-owned vehicles
instrumented for other FCAM-related testing). The test conditions – moderate rain, darkness,
and high-glare – were selected because they frequently occur in the real world and can
compromise the detection capability of the vehicle’s sensors. All evaluations used the LVS
scenario only, and were generally performed at low speed, nominally 15 mph (24.1 km/h).23
On
a dry, high friction paved surface, both of these vehicles are capable of providing crash
avoidance braking through their CIB systems from 15 mph in the LVS scenario.
3.2.3.1. Moderate Rain
The rain tests were performed on April 11, 2013. The rain was moderate and steady for each
evaluation, and the test surface was wet, as shown in Figure 3-11. The nominal SV speed for the
rain tests was 15 mph (24.1 km/h); however, single trials were also performed at SV speeds of
10, 20, and 25 mph (16.1, 32.2, and 40.2 km/h).
23
At the time these tests were performed, the durability of NHTSA’s SSV had not yet been assessed. Since it was
unknown whether and to what extent speeds would be reduced due to the non-ideal test conditions, the test speeds
and number of test trials used for these evaluations were conservative.
Figure 3-11. Subaru Outback CIB test performed in moderate rain

39
No notable performance degradation was observed for either vehicle for SV speeds up to 20 mph
(32.2 km/h). One collision with the SSV was observed during a 25 mph (40.2 km/h) trial
performed with the Volvo S60. However, it is unclear whether this was due to test variability or
the weather conditions, since only a single trial was performed at this speed and no baseline trial
was performed on dry pavement. A crash avoidance summary for the rain tests is provided in
Table 3-5.
Table 3-5. Crash Avoidance Summary from Tests Performed in Moderate Rain
SV Test Speed Subaru Outback Volvo S60
10 mph (16.1 km/h) 1/1 1/1
15 mph (24.1 km/h) 8/8 8/8
20 mph (32.2 km/h) 1/1 1/1
25 mph (40.2 km/h) 1/1 0/11
1 14.1-mph speed reduction produced during the test concluding with an impact
3.2.3.2. Darkness
The darkness tests were performed during early morning, prior to sunrise, as shown in Figure 3-
12. For the Subaru Outback they occurred from 6:20 a.m. to 6:24 a.m. EST on April 15, 2013
(sunrise was at 6:54 a.m.). The Volvo S60 tests were performed on April 22, 2013 from 5:42
a.m. to 6:04 a.m. EST (sunrise was at 6:44 am). Other than the light originated from the SV’s
headlights, the road surface was not illuminated during the darkness tests. The taillights of the
SSF were not illuminated.
While operating in darkness, the Volvo S60 exhibited some CIB performance degradation (crash
avoidance was not achieved during every trial), despite being equipped with multiple sensors.
The Subaru Outback exhibited no performance degradation (see Table 3-6).
Figure 3-12. Volvo S60 CIB test performed in the dark
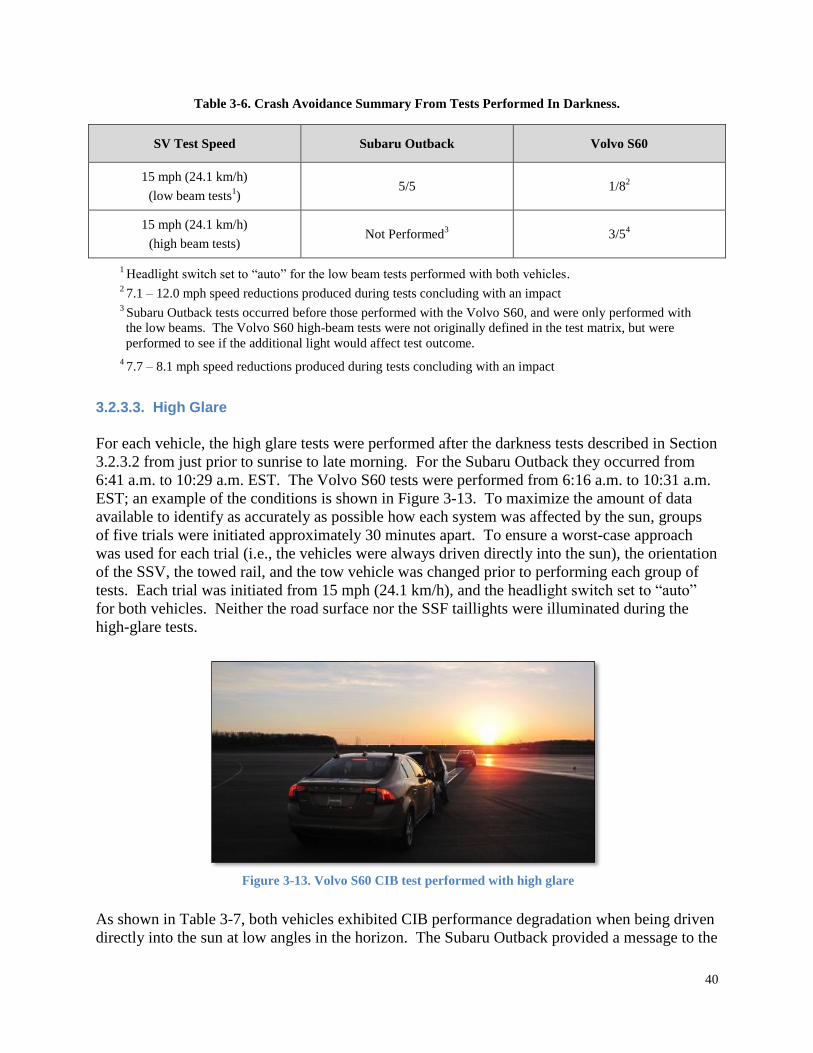
40
Table 3-6. Crash Avoidance Summary From Tests Performed In Darkness.
SV Test Speed Subaru Outback Volvo S60
15 mph (24.1 km/h)
(low beam tests1)
5/5 1/82
15 mph (24.1 km/h)
(high beam tests) Not Performed
3 3/5
4
1 Headlight switch set to “auto” for the low beam tests performed with both vehicles.
2 7.1 – 12.0 mph speed reductions produced during tests concluding with an impact
3 Subaru Outback tests occurred before those performed with the Volvo S60, and were only performed with
the low beams. The Volvo S60 high-beam tests were not originally defined in the test matrix, but were
performed to see if the additional light would affect test outcome.
4 7.7 – 8.1 mph speed reductions produced during tests concluding with an impact
3.2.3.3. High Glare
For each vehicle, the high glare tests were performed after the darkness tests described in Section
3.2.3.2 from just prior to sunrise to late morning. For the Subaru Outback they occurred from
6:41 a.m. to 10:29 a.m. EST. The Volvo S60 tests were performed from 6:16 a.m. to 10:31 a.m.
EST; an example of the conditions is shown in Figure 3-13. To maximize the amount of data
available to identify as accurately as possible how each system was affected by the sun, groups
of five trials were initiated approximately 30 minutes apart. To ensure a worst-case approach
was used for each trial (i.e., the vehicles were always driven directly into the sun), the orientation
of the SSV, the towed rail, and the tow vehicle was changed prior to performing each group of
tests. Each trial was initiated from 15 mph (24.1 km/h), and the headlight switch set to “auto”
for both vehicles. Neither the road surface nor the SSF taillights were illuminated during the
high-glare tests.
As shown in Table 3-7, both vehicles exhibited CIB performance degradation when being driven
directly into the sun at low angles in the horizon. The Subaru Outback provided a message to the
Figure 3-13. Volvo S60 CIB test performed with high glare

41
driver just before each test during the time of sensor washout indicating “Eyesight Inactive,”
where Eyesight refers to the name of Subaru’s CIB system. After each trial, as the vehicle was
driven away from the sun, the system automatically restored its operational state to active.
Table 3-7. Crash Avoidance Summary from Tests Performed in High Glare.
Ambient Condition Subaru Outback Volvo S60
Time of Day (EST) Crash Avoidance Time of Day (EST) Crash Avoidance
Pre-sensor washout 6:41 - 6:58 a.m. 6/6 6:16 - 6:46 a.m. 8/91
During sensor washout 7:16 - 7:48 a.m. 0/6
(no speed reductions) 6:53 - 7:46 a.m. 6/21
2
Post-sensor washout 7:49 - 10:29 a.m. 36/36 7:48 – 10:31 a.m. 36/36
18.8 mph speed reduction produced during the test ending with an impact
26.6 – 9.8 mph speed reductions produced during tests concluding with an impact
The Volvo S60 CIB system never appeared to fully disable itself, and no notification was
provided to the driver that the system was in an inactive or compromised state. However, after
completion of a given trial, one of two messages was presented on the instrument cluster,
indicating either “Auto braking by City Safety” or “Auto braking was activated,” where City
Safety refers to the name of Volvo’s CIB system designed to operate at speeds ≤19 mph (30
km/h). Although it is beyond the scope of this document to determine why different CIB modes
were activated within a common group of trials, the test track data shown in Figure 3-14 clearly
indicate intervention timing differences between the modes exist and help to explain the crash
avoidance variability shown in Table 3-7.
3.2.3.4. Non-Ideal Environmental Condition Test Observations
The objective of this work was to provide NHTSA with CIB performance data beyond that
typically recorded in more idealized testing environments. Since the scope of this work was very
limited (one test scenario performed at low speed, two vehicles, etc.), the test results may, or
may not, be representative of that achieved with other vehicles. In summary:
No apparent performance degradation was observed in the rain
Some performance degradation was present during Volvo S60 tests in the dark
Each system was affected/suppressed during periods of high glare shortly after sunrise
Subaru Outback: for 32 minutes
Volvo S60: for 53 minutes
There are an unlimited number of non-ideal environmental conditions present in the real world,
and it is impossible to precisely and repeatably reproduce most of them within practical

42
constraints on a test track. For these reasons, the current draft test procedures suggest that testing
be conducted under near-ideal conditions. Specifically, the following language is used, with
emphasis added:
“Tests shall not be performed during periods of inclement weather. This includes, but is not limited to, rain, snow, hail, fog, smoke, and/or ash. The tests shall be conducted during daylight hours with good atmospheric visibility, defined as an absence of fog and the ability to see clearly for more than 3.1 mile (5.0 km). The tests shall not be conducted with the SV and POV oriented into the sun during very low sun angle conditions (where the sun is oriented 15 degrees or less from horizontal) as camera “washout” or system inoperability may result.
High peak decelerations from SSV impact, not only from CIB braking
Figure 3-14. Vehicle responses observed during high-glare CIB tests performed with the Volvo S60

43
4.0 2013 FCAM TESTS
Introduction 4.1.
NHTSA’s latest series of CIB and DBS test track evaluations, the 2013 FCAM tests, were
performed from July 15 through November 19, 2013. The objective of this work was to validate
the refinements made to the agency’s methods of objectively evaluating CIB and DBS test track
performance. Specific areas of interest included:
Draft test procedure performability
Effect of different brake application strategies (for DBS tests)
Effect of test targets
Ability to satisfy the assessment reference values
Test Matrix 4.2.
The 2013 FCAM test matrix was designed to provide as many test configurations as possible,
while still maintaining a reasonable test burden for NHTSA researchers. To accomplish this, the
matrix included the following components:
Seven test maneuvers for each technology (CIB and DBS)
Two brake application techniques for DBS tests
Seven light vehicles (subject vehicles)
Two test targets (surrogates used as principal other vehicles)
Test Maneuvers 4.3.
The test maneuvers used to evaluate CIB and DBS are summarized in Tables 4-1 and 4-2,
respectively. Each technology was evaluated using LVS, LVM, LVD124
, LVD225
, and false
positive (FP) tests performed with identical combinations of initial SV and POV speeds and
headways.
With regards to Tables 4-1 and 4-2,
“Initial Headway” describes the SV-to-POV distance (also referred to as “range”) at the
beginning of the maneuver, when the vehicles are to be at the desired speeds, etc., and
can differ depending on whether a CIB or DBS evaluation is specified.
“Nominal Impact Speed” values provided in Table 4-1 provide the relative speed the SV
would be expected to strike the POV if no CIB-based automatic braking occurred.
“Brake Apply Headway” describes the SV-to-POV distance at the onset of the SV brake
application. To ensure accuracy and repeatability, the brake robot initiated these
applications based on GPS triggers during DBS evaluations.
24
As indicated in Section 2.2, the kinematic conditions of an LVD1 scenario are such that the POV will still be
decelerating (moving) at the time of SV CIB/DBS activation.
25 The kinematic conditions of an LVD2 scenario are such that the POV will have decelerated to a stop ahead of SV
CIB/DBS activation.

44
Table 4-1. 2013 FCAM CIB Test Matrix
Maneuver
Speed Initial Headway Nominal
Impact Speed
SV POV
(ft) (m) (mph) (km/h)
(mph) (km/h) (mph) (km/h)
LVS_25_0 25 40.2 0 0 >187 >57 25 40.2
LVM_45_20 45 72.4 20 32.2 >183 >56 25 40.2
LVM_25_10 25 40.2 10 16.1 >110 >34 15 24.1
LVD1_35_35 35 56.3 35 56.3 45.3 13.8 20 32.2
LVD2_25_25 25 40.2 25 40.2 328.1 100 25 40.2
STP_45 (CIB FP) 45 72.4 -- -- >337 >106 45 72.4
STP_25 (CIB FP) 25 40.2 -- -- >187 >57 25 40.2
Table 4-2. 2013 FCAM DBS Test Matrix
Maneuver
Speed Initial Headway Brake Apply
Headway
SV POV
(ft) (m) (ft) (m)
(mph) (km/h) (mph) (km/h)
LVS_25_0 25 40.2 0 0 >150 >46 40 12
LVM_45_20 45 72.4 20 32.2 >147 >45 37 11
LVM_25_10 25 40.2 10 16.1 >88 >27 22 7
LVD1_35_35 35 56.3 35 56.3 45.3 13.8 31.5 9.6
LVD2_25_25 25 40.2 25 40.2 328.1 100 40 12
STP_45 (DBS FP) 45 72.4 -- -- >271 >83 73 22
STP_25 (DBS FP) 25 40.2 -- -- >150 >46 40 12
4.3.1. LVS and LVM Tests
The LVS and LVM maneuvers presented in Tables 4-1 and 4-2 have been used by NHTSA to
evaluate FCAM technologies for years, and variants of the scenarios have been incorporated into

45
the agency’s FCW NCAP. They are straight-forward to perform, and provide a reasonable way
to quantify system performance. The SV and POV speeds specified for these maneuvers are
intended to balance the speeds at which these crash types commonly occur in the real-world with
the 25 mph (40.2 km/h) maximum relative impact speed supported by NHTSA’s test equipment
(i.e., the impact speed realized if no CIB activation were to occur due to a system fault,
suppression, etc.). With few exceptions, the LVS and LVM scenarios used during the 2013
FCAM tests followed the protocols specified in the June 2012 draft test procedures. Note,
however, that the nominal brake application rate used during the 2013 FCAM tests was 10 in/s
(254 mm/s), not 7 in/s (178 mm/s) as stated in the June 2012 DBS procedure draft. As indicated
in Tables 4-1 and 4-2, the 2013 FCAM tests matrix included one LVS and two LVM scenarios.
The LVS maneuver was performed with an SV speed of 25 mph (40.2 km/h). If the SV CIB
does not activate in response to this scenario, it will impact the POV with a relative speed of 25
mph (40.2 km/h).
The LVM_45_20 tests were performed with the SV and POV traveling at 45 and 20 mph (72.4
and 32.2 km/h), respectively. If the SV CIB does not activate in response to the slower moving
POV in this scenario, an impact with a relative speed of approximately 25 mph will occur. The
LVM_45_20 test scenario is also used by the agency’s NCAP to evaluate Forward Collision
Warning (FCW) alert timing.
The LVM_25_10 tests were performed with the SV and POV traveling at 25 and 10 mph (40.2
and 16.1 km/h), respectively. If the SV CIB does not activate in response to the slower moving
POV in this scenario, an impact with a relative speed of approximately 15 mph (24.1 km/h) will
occur. The LVM_25_10 test scenario complements the LVM_45_20 tests by evaluating a
similar driving scenario performed with lower speeds (a provision intended to help quantify
CIB/DBS system robustness).
4.3.2. LVD Tests
The LVD maneuvers were developed just prior to the 2013 FCAM tests, and were included to
provide a better overall quantification of FCAM system performance than possible with LVS and
LVM testing alone. Although these maneuvers were more difficult to accurately perform than
the LVS or LVM tests, they were included in the test matrix because they represent a large
population of real-world rear-end crashes. The POV deceleration used during the 2013 FCAM
tests was nominally 0.3g, which is equivalent to that specified in the FCW NCAP procedure, and
consistent with decelerations seen in the crash data. As indicated in Tables 4-1 and 4-2, the 2013
FCAM test matrix included two LVD scenarios.
The LVD1_35_35 test was performed with the SV and POV traveling closely together (45.3-ft
(13.8 m) initial headway) at 35 mph (56.3 km/h). If the SV CIB does not activate in response to
the decelerating POV in this scenario, it will impact the POV with a relative speed of
approximately 20 mph (32.2 km/h). This test was referred to as the LVD1_35_45.3 variant in
Section 3.2.2.1.a of this document.
The LVD2_25_25 test begins with the SV and POV travelling at a lower speed (25 mph (40.2
km/h)) and a much larger headway of 328 ft (100.0 m). In this case, the POV decelerates to a

46
stop well before any SV CIB intervention would be expected to occur. If the SV CIB does not
activate in response to this scenario, it will impact the POV with a relative speed of 25 mph (40.2
km/h). This test was referred to as the LVD2 variant in Section 3.2.2.1.a of this document.
4.3.3. False Positive Tests
Steel trench plates (STP) are often used in road construction to temporarily cover sections of
pavement that are unsafe to drive over directly (typically during repair). Although the STP is
large and metallic, it is designed to be driven over without risk of injury to the driver or damage
to the SV. Therefore, in this scenario the automatic braking available from CIB, or
supplementary braking provided by DBS, is not necessary and should not occur.
The STP false positive tests were performed by driving over an 8 ft x 12 ft x 1 in (2.4 m x 3.7 m
x 25.4 mm) ASTM A36 steel trench plate at two SV speeds: 25 and 45 mph (40.2 and 72.4
km/h). Conduct of these tests simply required the SV driver to approach the STP at a constant
speed while respecting the tolerances used to assess maneuver validity.
Brake Applications (for DBS Evaluation) 4.4.
The brake applications used during the 2013 FCAM DBS tests consisted of two parts:
characterization and performance evaluation. All brake applications were performed using
programmable brake robot using displacement- or hybrid-control feedback algorithms. Use of
force feedback alone (i.e., controlling SV brake applications on the basis of applied pedal force
only) was not included in the 2013 FCAM test matrix.
4.4.1. Foundation Brake Characterization
To objectively determine the commanded brake application magnitude to be used for DBS
performance evaluations, a characterization process was used. To begin, the SV was driven in a
straight line at 45 mph. The driver fully released the throttle pedal and, using displacement
feedback, a brake application capable of achieving a deceleration of 0.7g was applied at a rate of
1 in/s (25.4 mm/s). A total of eight characterization trials were performed per vehicle. For each
trial, a first-order regression was applied to the brake pedal position versus SV deceleration data
from 0.25g to 0.55g to determine the pedal displacement needed to produce a deceleration of
0.3g. The 0.3g deceleration rate value is consistent with real-world crash data as identified by the
agency in its review of electronic data recorder (EDR) data, summarized in Table 4-3. Results
from the individual trials were then averaged and used for the tests described in Section 4.4.2.

47
Table 4-3. Results from NHTSA’s EDR Analysis Of Rear-End Crashes
Description Cases Avg. Deceleration
# of rear end EDR cases, on dry pavement applying brake (<1g) 73 0.383g
# of rear end EDR cases, on dry pavement applying brake (<1g, weighted*) 48,331 0.316g
# of rear end EDR cases, on dry pavement applying partial brake (<0.75g) 65 0.324g
# of rear end EDR cases, on dry pavement applying partial brake (<0.75g, weighted*) 44,975 0.275g
* NASS-CDS case weights were applied to the EDR-based sample to estimate values for the total crash
population. See DOT Report HS 811 807 for NASS-CDS case weight methodology.
4.4.2. DBS Performance Evaluation
Regardless of the control feedback algorithm used, displacement or hybrid-based, the
applications each share the following attributes:
The SV brake pedal began at rest. The brake controller was not used to preload the SV
brake pedal or to remove free play.
Each application was triggered by a GPS-based headway signal. Since the DBS draft test
procedure indicates that the onset of SV braking occurs when brake pedal force is 2.5 lbf
(11.1 N), some iterative tuning was needed to ensure this force was realized at the correct
headway; the command to activate the brake controller was sent prior to reaching the
desired trigger point to account for signal latency and mechanical delays.
The application rate was 10 in/s (254 mm/s) until the brake pedal reached the position
capable of achieving 0.3g during brake system characterization.
4.4.2.1. Displacement Feedback Control
With “displacement feedback,” the brake controller was used to modulate applied force to
achieve the desired brake pedal position. Use of this algorithm allowed the application ramp rate
from zero (i.e., at rest) to the desired magnitude to be directly programmed into, and accurately
realized by, the controller. Once at the position capable of achieving 0.3g during brake system
characterization, the brake pedal position was held constant until the end of the test trial.
4.4.2.2. Hybrid Feedback Control
As previously mentioned in Section 3.2.2.2.b, hybrid-feedback control logic includes a
combination of position- and force-control strategies. For the hybrid applications used during
the 2013 FCAM tests, the same application rate and position used for displacement-feedback
tests were commanded. However, once at the desired position, application force was reduced at
a rate of 56.2 lbf/s (250 N/s) to a force magnitude equal to 50 percent of that capable of
achieving an average deceleration of 0.3g during the vehicle’s brake system characterization.
The intent of this strategy was to ensure that some force remains present at the brake pedal for

48
the duration of the test trial, but at a low enough level that the pedal displacement was not
increased significantly.
Test Vehicles 4.5.
The vehicles selected for the 2013 FCAM tests, shown in Table 4-4, are representative of
contemporary offerings in the United States (U.S.), and were generally equipped with different
sensor combinations. Only the Infiniti Q50 and Mitsubishi Outlander were equipped with the
same type of sensing package (a single long-range radar). Time and funding allowed for only a
limited number of vehicles to be evaluated with the 2013 FCAM tests. There was an interest in
including vehicles from manufacturers that the agency had not included in previous test efforts.
Many of these systems were not available for sale in the U.S. until the 2014 model year. As a
result, samples from other manufacturers that produce vehicles equipped with CIB/DBS were not
included (e.g., Honda/Acura and Volvo).
Table 4-4. 2013 FCAM Test Vehicle List
Vehicle
Sensing Technology
Radar Cameras
SRR
(24 GHz) LRR
(77 GHz) Mono Stereo
2014 Audi A8L
2
2014 Cadillac ATS 2 1
2014 Infiniti Q50
1
2014 Mercedes E350 2 1
2014 Mitsubishi Outlander
1
2013 Lexus LS460
1
2013 Subaru Outback
Surrogate Vehicles 4.6.
The NHTSA SSV and ADAC inflatable surrogate, shown in Figure 4-1, were the most highly
developed surrogate vehicles available to NHTSA for the 2013 FCAM tests. At the time the
2013 FCAM test matrix was conceived, a comparison of each vehicle’s CIB/DBS performance
as a function of test target was desired. Unfortunately, the number of such comparisons was
limited. Although NHTSA owns the SSV, the ADAC target had to be leased from the Insurance
Institute for Highway Safety (IIHS). When IIHS procured their ADAC target, they did not
purchase the tow apparatus needed to support slower-moving or decelerating lead vehicle tests.
For this reason, only the LVS scenario was used to evaluate the effect of surrogate vehicle on test
outcome.

49
Draft Assessment Reference Values (ARVs) 4.7.
Table 4-5 presents the draft ARVs used to evaluate the 2013 FCAM test results. In the case of
the LVS, LVM, and LVD maneuvers, the performance metric was speed reduction. For the false
positive tests, no autonomous (CIB) or supplementary (DBS) braking was allowed.
Figure 4-1. NHTSA SSV (left) and ADAC (right) test targets
18.9 mph relative impact speed 18.8 mph relative impact speed

50
Table 4-5. CIB and DBS Draft Assessment Reference Values (ARVs)
1CIB activation is said to occur if SV deceleration ≥ 0.25g within the validity period
2DBS activation is said to occur if SV deceleration ≥ 125% of a baseline average
The LVS and LVM draft ARVs were provided within the June 2012 CIB and DBS draft test
procedures, were described in the June 2012 research report, and were mentioned in the July
2012 RFC. The LVD and false positive tests are recent additions to the draft test procedures, and
their respective evaluation criteria are included in the August 2014 CIB and DBS draft test
procedures. The speed reductions specified for the LVD tests are based on the same
performance levels applied to the LVS and LVM maneuvers.
For CIB, the speed reductions criteria with the draft ARVs presented in the Table 4-5 correspond
to an effective deceleration of 0.6g from a TTC of 0.6 s. These criteria were developed using
NHTSA test data collected during 2011, and were intended to promote safety-beneficial and
attainable performance.
For DBS, the draft ARVs are full crash avoidance for the LVS, LVM, and LVD maneuvers.
Although the absolute speed reductions needed to meet these criteria are higher than those of
CIB, the effective deceleration is slightly lower since braking is initiated at an earlier TTC.
The June 2012 CIB and DBS draft test procedures specified that the LVS and LVM draft ARVs
presented in Table 4-5 were to be satisfied during 100 percent of the tests performed (i.e., during
each of the eight trials performed per scenario). In response to the RFC, many commenters cited
the difficulty in meeting the performance criteria during every trial performed. At the time this
feedback was provided, the CIB draft test procedure included only one LVS and two LVM
conditions, or 24 individual test trials. Since that time, the test burden of the 2013 FCAM test
matrix increased 133 percent to 56 trials per technology.
The ARVs described in Table 4-5 represent meeting at least 7 of 8 trials for each scenario, as 7
of 8 was considered a useful performance benchmark for the purposes of this research.
FCAM
Technology
SV Speed Reduction or Crash Avoidance
LVS
25_0 LVM
45_20 LVM
25_10 LVD1
35_35 LVD2
25_25 STP_45
(FP) STP_25
(FP)
CIB ≥ 9.8 mph
(15.8 km/h)
≥ 9.8 mph
(15.8 km/h)
Crash
Avoidance
≥ 10.5 mph
(16.9 km/h)
≥ 9.8 mph
(15.8 km/h) No Activation1
DBS Crash Avoidance No Activation2

51
Test Results 4.8.
With regards to the 2013 FCAM test results, NHTSA determined two factors were the most
important:
Performability. Can each test scenario be repeatably and accurately performed within
the tolerances provided in the draft test procedures?
System Performance. Can the draft ARVs be achieved by current production vehicles?
With respect to performability, the test tolerances associated with the seven (CIB) to eight (DBS)
parameters shown in Table 4-6 were compared to the actual deviations from the specified
parameters observed in testing. The validity violations (i.e., instances where a parameter
exceeded its allowable tolerance) for each vehicle were combined across test condition and
summarized. System performance was quantified by comparing the ability of each 2013 FCAM
test vehicle to achieve the performance previously specified in Table 4-5.
Table 4-6. CIB and DBS Test Tolerance Overview
Parameter Tolerance
SV speed ±1 mph (1.6 km/h)
POV speed ±1 mph (1.6 km/h)
SV lateral position from road center ±2 ft (0.6 m)
SV-to-POV lateral orientation relative to each other ±2 ft (0.6 m)
SV-to-POV headway (applicable to LVD tests only) ±8 ft (2.4 m)
SV yaw rate ±2 deg/s
SV brake application range to POV (DBS) ±2 ft (0.6 m)
SV throttle release timing (CIB) Fully released after SV deceleration ≥ 0.1g permitted
SV throttle release timing (DBS) >1 s prior to brake application
4.8.1. CIB Maneuver Performability
The ability to successfully perform each CIB test scenario is summarized in the pie charts
presented in Figure 4-2. For each scenario, the expression “n = x of y” is defined as follows:
x = total number of trials performed with a validity violation, collapsed across test
scenario
y = total number of trials performed, collapsed across test scenario
Of the “n” trials, the cause of the violation is presented in the Figure 4-2 pie charts.
52
4.8.1.1. CIB LVS Scenario
No LVS validity violations were observed during the 2013 FCAM CIB tests.
4.8.1.2. CIB LVM Scenario
For the LVM maneuvers, the only validity violations were for SV and POV speed. In both cases,
POV speed exceeding the ±1 mph (1.6 km/h) tolerance specified in Table 4-6 was the most
common violation. Interestingly, there were only three non-valid CIB trials of the 59 performed
in the LVM_45_20 condition (5.1 percent), far fewer than the 14 recorded for the slower
LVM_25_10 tests (22.2 percent).
4.8.1.3. CIB LVD Scenario
The LVD maneuvers were the most difficult to execute during the 2013 FCAM tests. This was
largely because the SV and POV speeds and headway need to be quickly established and
maintained within the confines of the relatively short test surface. As a result, 37.3 percent of the
LVD1_35_35 trials had at least one validity violation. In the case of the LVD2_25_25 tests, this
increased to 43.8 percent.
Like the LVM maneuvers, the most common LVD validity violations were due to speed
violations. Unlike the LVM tests, most were due to SV speed problems associated with the SV
driver trying to “catch up” to the POV when the headway was outside of the ±8 ft (2.4 m) tolerance
specified on Table 4-6. This issue is believed to be an isolated problem attributed to a specific
driver since most of these violations occurred during the Subaru Outback LVD trials, which were
all performed by the same test driver. SV speed infractions occurred during fifteen LVD1_35_35
tests overall, and eight (53.3 percent) involved the Subaru Outback. For the LVD2_25_25
scenario, nine of the thirteen overall SV speed violations (69.2 percent) involved the Subaru
Outback, where eight of the fifteen (53.3 percent) SV speed infractions occurred during the
LVD1_35_35 tests, and during nine of the thirteen (69.2 percent) LVD2_25_25 tests. When
they occurred for this vehicle, the SV speed violations ranged from 0.2 to 1.6 mph (0.3 to 2.8
km/h) greater than the ±1 mph (±1.6 km/h) allowable tolerance.
Since the LVD maneuver imposes a tolerance on SV-to-POV headway, it was not surprising that
headway violations occurred during some trials. However, since the tolerance is not particularly
strict at 8 ft (2.4 m), the number of violations for this parameter was lower than the number of
SV or POV speed tolerance violations for each maneuver: 12.0 and 21.4 percent of all 35 and 25
mph (56.3 and 40.2 km/h) LVD test violations, respectively. 4.8.1.4. CIB False Positive Scenario
From an ease of conduct perspective, the STP tests were expected to be equivalent to the LVS
maneuver. Although no validity violations occurred during the CIB LVS evaluations, a small
number of SV speed violations were observed during the STP tests (9.5 and 3.4 percent of the
STP_45 and STP_25 tests, respectively).

53
Figure 4-2. CIB maneuver performability; validity violations by test scenario.
n = number of all trials performed with a validity violation, per maneuver. Of the “n” trials, the cause of the violation is presented.

54
4.8.2. CIB Test Track Performance
Tables 4-7 and 4-8 present overall summaries of how well the 2013 FCAM test vehicles were
able to satisfy the CIB draft ARVs. The data shown in Table 4-7 are inclusive of non-valid
trials, whereas those in Table 4-8 only contain valid results: i.e., those performed within the
tolerances specified in Table 4-6 and in the August 2014 CIB draft test procedures [24].
Some of the tolerances used to screen the tests for validity were established after data collection
of the 2013 FCAM tests (i.e., after the vehicles had been de-instrumented and/or were no longer
available), some trials initially considered to be acceptable were later deemed non-valid during
the final post-processing of the test data. In some cases, the later validity screen reduced the
number of valid tests per vehicle and condition to be less than eight. For this reason, the
assessments described within Section 4.8.2 are based on valid trials where possible, but with
consideration of non-valid trials where necessary. When data from non-valid trials were
considered, their contribution is noted.
Inclusion of results from non-valid test trials, when needed to achieve eight trials per scenario,
provided a way to increase the amount of data available to describe how a given vehicle
performed. For a test trial to be deemed non-valid, it is important to recognize that only one test
tolerance (e.g., as previously specified in Table 4-6) for one data channel must be violated.
Often, these violations were very small, and affected a single data channel. If data from a non-
valid trial were used to quantify a vehicle’s performance, the cause of the violation was first
screened to ensure it would not be expected to affect the ability of the vehicle to satisfy an ARV.
NHTSA believes there is value to the data produced by non-valid test trials provided the validity
infraction would not be expected to affect test outcome. In the context of this research report, an
appropriate consideration of non-valid trials improves the ability of the agency to present a
representative overall account of a vehicle’s test track performance.
If a test trial was performed so poorly that the corresponding data did not accurately represent the
scenario being performed (e.g., a wind gust caused the SSV to move out of position during a
LVS test), it was classified as egregious, not just non-valid. Egregious trials were not included in
the Tables 4-7 or 4-8 and were not used to discuss vehicle performance.
Summarizing the results in Table 4-7 and 4-8:
Three vehicles were able to satisfy all CIB draft ARVs (the Mercedes E350, Lexus
LS46026
and Subaru Outback27
). These vehicles also achieved full crash avoidance
during the LVS, LVM, and LVD2_25_25 tests.
26
An assessment of the Lexus LS460 required consideration of non-valid trials for the LVM and LVD maneuvers,
and for the STP_25 tests. However, all Lexus LS460 trials performed, regardless of test validity, were able to
satisfy the respective draft ARVs.
27 An assessment of the Subaru Outback required consideration of non-valid trials for the LVM and LVD
maneuvers. However, all Subaru Outback trials performed, regardless of test validity, were able to satisfy the
respective draft ARVs.

55
Two vehicles were able to satisfy all but one of the CIB draft ARVs. The Mitsubishi
Outlander did not satisfy the LVS draft ARV, whereas the Infiniti Q50 did not satisfy the
LVD1_35_35 draft ARV.
No CIB false positive events were recorded.
The ability of the vehicles to satisfy the LVS CIB draft ARV was not affected by the
surrogate vehicle used.
The vehicles equipped with the largest number of sensors did not necessarily perform
better than those equipped with a single sensing technology.
Three vehicles were not evaluated in the LVS condition, as these vehicles were not
designed to respond to stationary objects at the speed specified in the draft test procedure
(Audi A8L, Cadillac ATS, and Mitsubishi Outlander).
Table 4-7. Number of Trials Able to Satisfy CIB Draft ARVs
(Data not screened for test validity; bright yellow indicates an inability to satisfy the draft ARVs.)
Vehicle
Number of Tests Satisfying the CIB Performance Assessment Reference Values
LVS
25_0 LVM
45_20
LVM
25_10
LVD1
35_35
LVD2
25_25
STP_45
( FP)
STP_25
(FP) SSV ADAC
2014 Audi
A8L -- -- 8/8 0/9 12/12 7/8 8/8 9/9
2014 Cadillac
ATS -- --
8/8
8/82
6/131
7/92
0/10
2
8/82
11/11 9/9
2014 Infiniti
Q502 9/9
4
8/84
9/94
5/10
3
3/8
4
9/94
9/9 8/8 8/9
4
2014 Mercedes
E350 9/9 8/8 8/8 9/9 8/8 8/8 8/8 8/8
2014 Mitsubishi
Outlander -- -- 10/10 10/10 9/9 8/8 9/9 8/8
2013 Lexus
LS460 8/8 8/8 8/8 8/8 9/9 9/9 13/13 10/10
2013 Subaru
Outback 8/8 8/8 8/8 8/8 10/10 14/14 8/8 9/9
-- = test not performed because the vehicle’s CIB system was not designed to respond to stationary objects at
the 25-mph test speed 1
Minimum range was less than 1 ft for all tests where no impact occurred 2
Result achieved with full FMVSS No. 135 burnish 3
Driver attempted to maintain constant throttle position before and after FCW-based throttle pedal pushback 4
Result achieved with throttle release after FCW-based throttle pedal pushback
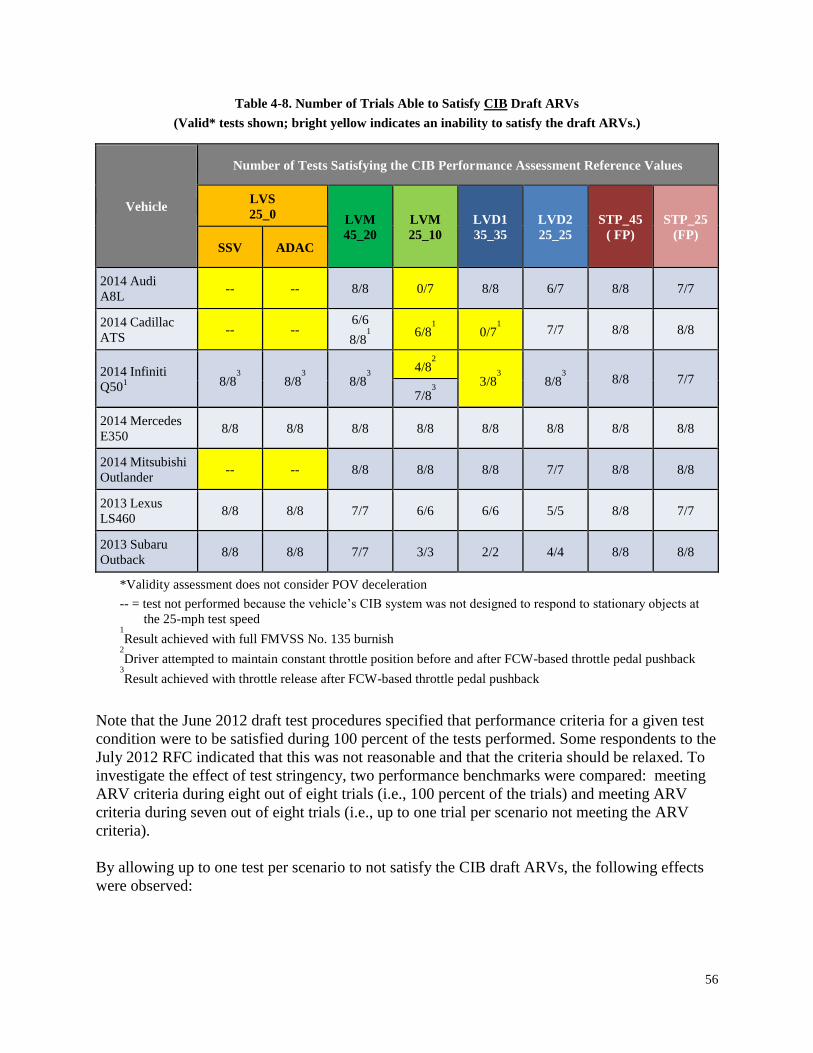
56
Table 4-8. Number of Trials Able to Satisfy CIB Draft ARVs
(Valid* tests shown; bright yellow indicates an inability to satisfy the draft ARVs.)
Vehicle
Number of Tests Satisfying the CIB Performance Assessment Reference Values
LVS
25_0 LVM
45_20
LVM
25_10
LVD1
35_35
LVD2
25_25
STP_45
( FP)
STP_25
(FP) SSV ADAC
2014 Audi
A8L -- -- 8/8 0/7 8/8 6/7 8/8 7/7
2014 Cadillac
ATS -- --
6/6
8/81
6/8
1
0/71
7/7 8/8 8/8
2014 Infiniti
Q501 8/8
3
8/83
8/83
4/8
2
3/8
3
8/83
8/8 7/7
7/83
2014 Mercedes
E350 8/8 8/8 8/8 8/8 8/8 8/8 8/8 8/8
2014 Mitsubishi
Outlander -- -- 8/8 8/8 8/8 7/7 8/8 8/8
2013 Lexus
LS460 8/8 8/8 7/7 6/6 6/6 5/5 8/8 7/7
2013 Subaru
Outback 8/8 8/8 7/7 3/3 2/2 4/4 8/8 8/8
*Validity assessment does not consider POV deceleration
-- = test not performed because the vehicle’s CIB system was not designed to respond to stationary objects at
the 25-mph test speed 1
Result achieved with full FMVSS No. 135 burnish 2
Driver attempted to maintain constant throttle position before and after FCW-based throttle pedal pushback 3
Result achieved with throttle release after FCW-based throttle pedal pushback
Note that the June 2012 draft test procedures specified that performance criteria for a given test
condition were to be satisfied during 100 percent of the tests performed. Some respondents to the
July 2012 RFC indicated that this was not reasonable and that the criteria should be relaxed. To
investigate the effect of test stringency, two performance benchmarks were compared: meeting
ARV criteria during eight out of eight trials (i.e., 100 percent of the trials) and meeting ARV
criteria during seven out of eight trials (i.e., up to one trial per scenario not meeting the ARV
criteria).
By allowing up to one test per scenario to not satisfy the CIB draft ARVs, the following effects
were observed:
57
Audi A8L: now able to satisfy the LVD2_25_25 draft ARV28
(but was still unable to
satisfy the LVM_25_10 draft ARV)
Cadillac ATS: no change
Infiniti Q50: now able to satisfy the LVM_25_10 draft ARV (but was still unable to
satisfy the LVD1_35_35 draft ARV)
Mercedes E350: no change
Mitsubishi Outlander: no change
Lexus LS460: no change
Subaru Outback: no change
4.8.2.1. Effect of Performing a Complete FMVSS No. 135 Brake Burnish
To ensure the SV brake pads, linings, rotors, and/or drums have been adequately conditioned,
one July 2012 RFC commenter indicated the NHTSA CIB/DBS draft test procedures should
include the brake burnish and temperature maintenance schedules defined in the current light
vehicle brake standard, FMVSS No. 135, and not those adopted from the light vehicle standard
on electronic stability control systems, FMVSS No. 126. The burnish procedure in FMVSS No.
135 specifies 200 stops with a deceleration of 9.8 ft/s2 (3.0 m/s
2) from a speed of 49.7 mph (80.0
km/h), whereas the burnish procedure in FMVSS No. 126 specifies 10 stops with a deceleration
of 16.1 ft/s2 (4.0 m/s
2) from a speed of 35 mph (56.3 km/h) in addition to three stops from 45
mph (72.4 km/h). The commenter’s rationale was that CIB and DBS effectiveness rely more
heavily on the state of the SV’s foundation brake system than does electronic stability control
(ESC) since the duration of the brake application (automatic or otherwise) during a particular test
trial is much longer.
The CIB evaluations of two vehicles, the Cadillac ATS and Infiniti Q50, occurred after a
FMVSS No. 135 brake burnish had been performed. However, while all Infiniti Q50 tests were
performed after this more rigorous burnish, only the LVM and LVD maneuvers were with the
Cadillac ATS. Furthermore, two series of LVM evaluations were performed with the Cadillac
ATS: first after a FMVSS No. 126 burnish, then after a FMVSS No. 135 burnish. Both of these
series used the same brake pads, rotors, and tires.
For the LVM_45_20 tests, the speed reductions realized by the vehicle satisfied the draft ARV
evaluation criteria during each test trial regardless of which burnish was performed. Differences
in the speed reductions achieved with each burnish (13.5 to 19.8 mph after the FMVSS No 126
burnish, versus 16.7 to 24.6 mph after the FMVSS No 135 burnish) were not statistically
significant. Analysis of the LVM_25_10 tests is confounded by the lack of any valid tests being
28
An assessment of the Audi A8L required consideration of a non-valid LVD_25_25 trial. However, although the
non-valid test was performed with an SV speed 0.2 mph greater than the allowable tolerance, it was still able to
satisfy the speed reduction defined by the LVD_25_25 draft ARV.

58
performed (POV speed was 0.1 to 0.6 mph too high for each trial performed in this series),
however the data are still useful and are presented in Table 4-9.
Table 4-9. Cadillac ATS LVM_25_10 mph Tests Performed After Two Different FMVSS Brake Burnishes
FMVSS
Burnish
Number of Trials Number of
Impacts
(a draft ARV
violation)
SV-to-POV
Impact
Speeds
(mph)
Number of
Collisions
Avoided
SV-to-POV
Avoidance
Distance
(ft) Valid Non-Valid
No. 126 0 13 7 0.6 – 2.7 6 0.2 – 0.9
No. 135 8 0 2 0.9 – 5.5 6 0.2 – 1.2
Even if the effects of the minor validity infractions observed during the tests performed after the
FMVSS No. 126 burnish are discounted (which would have the effect of making the maneuver
less severe since the SV closing velocity was nominally less), identifying whether the additional
burnishing of the FMVSS No. 135 procedure improved the foundation brake system
effectiveness was not possible.
Although a higher percentage of the 13 trials performed after the FMVSS No. 126
burnish resulted in a collision (a test failure condition), the range of impact speed
magnitudes overlaps that realized during the test series performed after the FMVSS No.
135 burnish.
For the tests that concluded with the SV avoiding the POV, the avoidance magnitude (the
minimum range observed during each trial associated with each burnish) overlapped.
The maximum overall impact speed and maximum avoidance range were both realized
during the test series performed after the FMVSS No. 135 burnish.
In summary, the FMVSS No. 135 burnish may potentially affect a vehicle’s braking performance
beyond that achieved by the FMVSS No. 126 procedure, as indicated by a 2012 RFC
commenter. However, in the case of the Cadillac ATS, the effect was not pronounced and does
not appear to affect the vehicle’s ability to satisfy the draft ARVs discussed in this section.
4.8.2.2. Comments Regarding the Infiniti Q50 Forward Collision Warning
Generally speaking, the results shown in Tables 4-7 and 4-8 were achieved by simply performing
the various tests in the manner described in the June 2012 draft test procedures. However, a
notable exception was the Infiniti Q50. As part of its FCW, this vehicle includes a haptic throttle
pedal that pushes back against the driver’s foot29
.
When performing the 2013 FCAM CIB tests, the driver was instructed to gently modulate the
throttle pedal to maintain constant speed from a TTC ≈ 5 to 3 seconds. From a TTC ≈ 3 seconds
29
This occurs coincident with an auditory alert and a message on the instrument cluster.
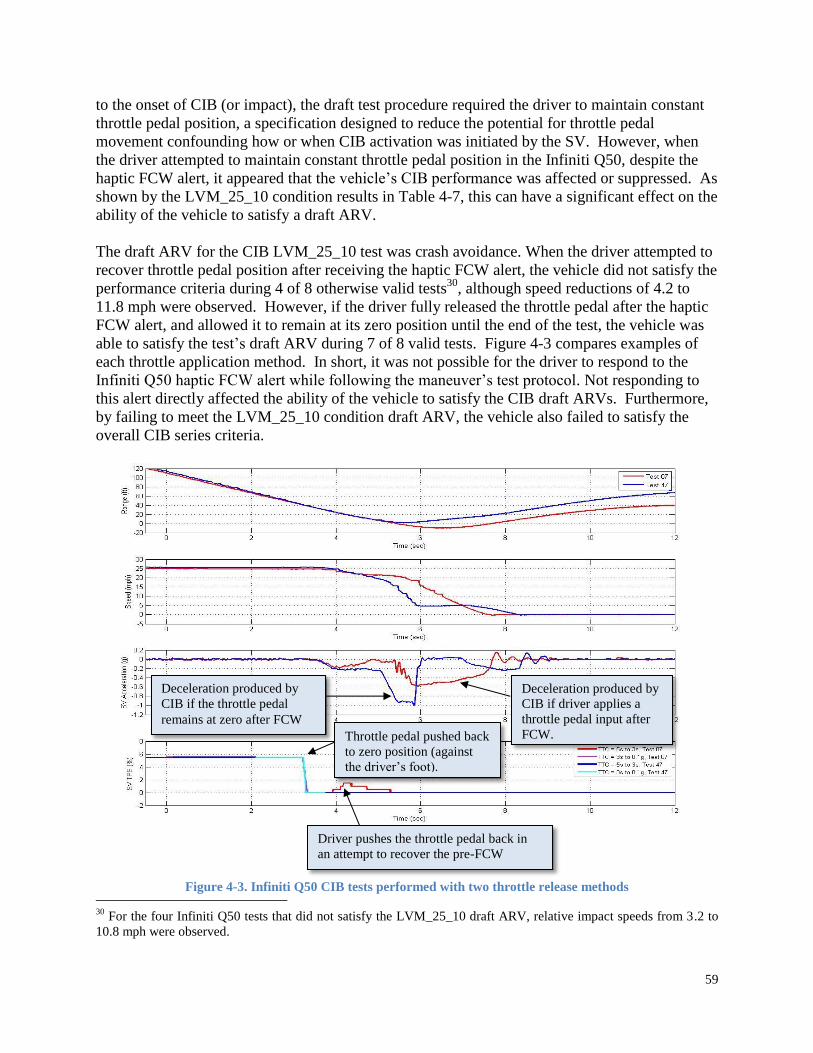
59
to the onset of CIB (or impact), the draft test procedure required the driver to maintain constant
throttle pedal position, a specification designed to reduce the potential for throttle pedal
movement confounding how or when CIB activation was initiated by the SV. However, when
the driver attempted to maintain constant throttle pedal position in the Infiniti Q50, despite the
haptic FCW alert, it appeared that the vehicle’s CIB performance was affected or suppressed. As
shown by the LVM_25_10 condition results in Table 4-7, this can have a significant effect on the
ability of the vehicle to satisfy a draft ARV.
The draft ARV for the CIB LVM_25_10 test was crash avoidance. When the driver attempted to
recover throttle pedal position after receiving the haptic FCW alert, the vehicle did not satisfy the
performance criteria during 4 of 8 otherwise valid tests30
, although speed reductions of 4.2 to
11.8 mph were observed. However, if the driver fully released the throttle pedal after the haptic
FCW alert, and allowed it to remain at its zero position until the end of the test, the vehicle was
able to satisfy the test’s draft ARV during 7 of 8 valid tests. Figure 4-3 compares examples of
each throttle application method. In short, it was not possible for the driver to respond to the
Infiniti Q50 haptic FCW alert while following the maneuver’s test protocol. Not responding to
this alert directly affected the ability of the vehicle to satisfy the CIB draft ARVs. Furthermore,
by failing to meet the LVM_25_10 condition draft ARV, the vehicle also failed to satisfy the
overall CIB series criteria.
30
For the four Infiniti Q50 tests that did not satisfy the LVM_25_10 draft ARV, relative impact speeds from 3.2 to
10.8 mph were observed.
Throttle pedal pushed back
to zero position (against
the driver’s foot).
Driver pushes the throttle pedal back in
an attempt to recover the pre-FCW
position.
Deceleration produced by
CIB if the throttle pedal
remains at zero after FCW
Deceleration produced by
CIB if driver applies a
throttle pedal input after
FCW.
Figure 4-3. Infiniti Q50 CIB tests performed with two throttle release methods

60
As a result of the challenges described above, researchers subsequently decided to perform all
remaining Infiniti Q50 CIB tests using a throttle pedal application method that would allow the
vehicle to realize the maximum potential of its CIB. This method was incorporated into the
revised CIB draft test procedures to accommodate the demands of vehicles such as the Infiniti
Q50, and is described in Section 5.2.1.
4.8.3. DBS Maneuver Performability
The ability to successfully perform each DBS test scenario is summarized with the pie charts
presented in Figures 4-4 and 4-5. For each scenario, the expression “n = x of y” is defined as
follows:
x = total number of trials performed with a validity violation, collapsed across test
scenario
y = total number of trials performed, collapsed across test scenario
Of the “n” trials, the cause of the violation is presented in the pie charts of Figures 4-4 and 4-5.
Note that in addition to the parameters used to assess CIB performability, the DBS analysis adds
a consideration of SV brake application range and SV throttle release timing. Due to the limited
number of tests performed with hybrid-based brake applications, only results from the
displacement-feedback-based trials are discussed.
4.8.3.1. DBS LVS Scenario
15.6 percent of all LVS DBS tests performed with displacement feedback had at least one
tolerance violation. As shown in Figure 4-4, 90 percent of those involved the SV throttle pedal
not being fully released for a full one second prior to the SV brakes being applied. 10 percent of
the LVS tests included trials during which the SV brakes were applied outside of the ±2-ft (0.6-
m) tolerance.
n = number of all trials performed with a validity violation, per maneuver.
Of the “n” trials, the cause of the violation is presented.
Figure 4-4. DBS LVS maneuver performability

61
Figure 4-5. DBS maneuver performability; validity violations by test scenario
n = number of all trials performed with a validity violation, per maneuver. Of the “n” trials, the cause of the violation is presented.

62
4.8.3.2. DBS LVM Scenario
At least one validity violation was present during 27.9 and 18.2 percent of the LVM_45_20 and
LVM_25_10 tests, respectively (see Figure 4-5). Although some SV and/or POV speed
violations were present during the LVM DBS evaluations, most LVM validity problems were
due to throttle release timing and the SV brakes being applied outside of the allowable tolerance.
4.8.3.3. DBS LVD Scenario
Of all the evaluations performed during the 2013 FCAM tests, the DBS LVD trials were the
most challenging to perform. At least one validity violation occurred during 74.1 percent of the
trials performed at 35 mph, and during 62.1 percent of the trials initiated from 25 mph (40.2
km/h) (see Figure 4-5). To further evaluate the high number of violations per test condition, a
more detailed breakdown of the infractions is presented in Tables 4-10 and 4-11.
A majority of the LVD validity violations occurred because of throttle release timing, and in the
case of the LVD1_35_35 tests, at least one such infraction occurred for each vehicle. In
agreement with the other LVD test conditions, SV-to-POV brake application range was the
second most common source of validity violations. SV and POV speed tolerances were
exceeded during both LVD maneuvers performed during the DBS evaluations, but were often
isolated to a particular vehicle or only occurred once. For example, of the nine SV speed
violations that occurred in the LVD1_35_35 condition, six (66.7 percent) occurred during tests
performed with the Infiniti Q50.
Table 4-10. LVD1_35_35 Validity Violation Count and Magnitudes
Parameter
(Nominal ±Tolerance)
Vehicle
Audi
A8L
Cadillac
ATS
Infiniti
Q50
Mercedes
E350
Mitsubishi
Outlander
Lexus
LS460
Subaru
Outback
SV speed
(35 mph ±1 mph) -- --
6;
0.02-0.7
mph
-- -- 2;
0.2-0.7 mph
1;
0.2 mph
POV speed
(35 mph ±1 mph) -- -- --
1;
0.2 mph
1;
1.7 mph
3;
0.07-0.6 mph
--
SV-to-POV brake apply range
(31.5 ±2 ft) -- -- -- --
3;
1.3-2.1 in
12;
0.4-9.5 in
1;
4.3 in
SV throttle release timing
(>1 s before brake application)
2;
70-225 ms
1;
170 ms
5;
71-442 ms
1;
90 ms
6;
390-1095
ms
8;
710-1765
ms
5;
80-845 ms
SV-to-POV headway
(45.3 ± 8 ft) -- -- -- -- --
2;
0.7-3.3 ft --

63
Table 4-11. LVD2_25_25 Validity Violation Count and Magnitudes
Parameter
(Nominal ±Tolerance)
Vehicle
Audi
A8L
Cadillac
ATS
Infiniti
Q50
Mercedes
E350
Mitsubishi
Outlander
Lexus
LS460
Subaru
Outback
SV speed
(25 mph ±1 mph) --
1;
0.2 mph -- --
1;
0.1 mph
1;
0.1 mph
2;
0.2-1.7 mph
POV speed
(25 mph ±1 mph) -- -- -- -- --
1;
2.1 mph
1;
0.1 mph
SV-to-POV brake apply range
(40 ±2 ft) -- -- -- --
9;
0.6-5.4 in
8;
1.9-9.5 in --
SV throttle release timing
(>1 s before brake application) -- --
3;
191-335 ms --
7;
120-1295 ms
6;
70-675 ms --
SV-to-POV headway
(328.1 ± 8 ft) -- -- -- -- -- --
1;
1.1 ft
Generally speaking, the magnitudes of the validity infractions shown in Tables 4-10 and 4-11
were small. It may be possible to reduce the incidence of SV and POV speed violations, as well
as those associated with SV-to-POV headway, by providing the drivers with better test-to-test
feedback about whether a given trial had been performed acceptably (e.g., by using a data
processing script to evaluate each test immediately after it had been performed or by further
automating the actual test conduct). Similarly, driver feedback could assist the driver with
achieving more consistent throttle pedal release timing; however, validity violations associated
with this parameter are expected to be less problematic after the new FCW-based release strategy
described in Section 5 of this document is implemented. Improving the ability of the brake
controller to correctly initiate its applications at the desired range is also possible, albeit at the
expense of the additional time and resources needed to support iterative tuning prior to actual test
conduct.
4.8.3.4. DBS False Positive Scenario
In a manner consistent with the other DBS test conditions, at least one of the SV-to-POV brake
application ranges, throttle release timing, and SV speed tolerances was exceeded during 40
percent of the STP_45 tests. Twelve brake application range violations occurred during conduct
of this maneuver overall (55 percent of all STP_45 violations), seven of which occurred with the
Audi A8L due to a brake controller configuration error. For this vehicle, the brake application
range infractions occurred 2.7 to 12.0 in (69 to 304 mm) outside of the allowable 2-ft (0.6-m)
tolerance. With regards to throttle release timing, four of the eight violations occurred during
tests performed with the Lexus LS460, where the SV driver released the throttle pedal between
70 to 310 ms too late.
64
The STP_25 validity violations were generally consistent with those seen during conduct of the
other DBS maneuvers, and they occurred during 31.6 percent of the tests performed. In this
condition, the most common violation was throttle release timing. Four of the eight violations
occurred during tests performed with the Lexus LS460, where the SV driver released the throttle
pedal between 140 to 300 ms too late. For this maneuver, the SV lateral position from road
center (SV Lat Pos Road) and SV-to-POV lateral orientation relative to each other (SV Lat Pos
SV_POV) violations occurred during the same (i.e., single) test trial. Here, the POV is actually
the STP, which does not move during the evaluations. Since the plate is located in the center of
the test lane, any SV lateral deviation from the center of the STP is the same as that observed
relative to the STP.
4.8.4. DBS Test Track Performance
Tables 4-12 and 4-13 present overall summaries of how well the 2013 FCAM test vehicles were
able to satisfy the DBS draft ARVs using displacement-feedback-based brake applications.
Similarly, Tables 4-14 and 4-15 present the hybrid-feedback-based brake application summaries.
The data shown in Tables 4-12 and 4-14 are inclusive of non-valid trials, whereas those in Tables
4-13 and 4-15 contain only valid results (those performed within the tolerances specified in the
August 2014 DBS draft test procedures [25]).
In agreement with the CIB draft ARVs, acceptable speed reductions for the LVS, LVM, and
LVD scenarios, and false-positive suppression for the STP-based tests, were to be achieved
during at least seven of eight individual trials performed within the respective test group.
However, because some of the tolerances used to screen the tests for validity were established
well after data collection of the 2013 FCAM tests (i.e., after the vehicles had been de-
instrumented and/or became unavailable), some trials initially considered to be acceptable were
later deemed non-valid during the final post-processing of the test data.
As previously explained in Section 4.8.2, the later validity screen reduced the number of valid
tests per vehicle and condition to be less than eight in some cases. For this reason, the
assessments described within this section (i.e., Section 4.8.4) are based on valid trials where
possible, but with consideration of non-valid trials where appropriate. When data from non-valid
trials are considered, their contribution is noted. Egregious trials were not included in the Tables
4-12 through 4-15 and were not used to discuss vehicle performance.
4.8.4.1. Overall and Displacement Feedback Results Summary
Based on the results specified in 4-13 (and 4-12 where appropriate), the following observations
were made:
Where directly comparable data were available, the vehicles were better able to achieve
the DBS draft ARVs with displacement-feedback-based brake applications.

65
The Mitsubishi Outlander31
, Subaru Outback32
, and Infiniti Q5033
appear to be capable of
satisfying all DBS draft ARVs, provided displacement feedback was used in the LVS
scenario.
Two of the three vehicles unable to respond to the LVS condition with CIB did so during
their respective DBS evaluations. Using displacement-feedback-based brake
applications, the Mitsubishi Outlander and Cadillac ATS not only responded to the LVS
scenario, but were able to satisfy the DBS assessment reference values. Although the
Audi A8L responded to the LVS scenario during its DBS evaluation, it did not satisfy the
draft ARVs.
Despite satisfying all the CIB draft ARVs (regardless of surrogate vehicle used), the
Lexus LS46034
was unable to achieve the DBS draft ARVs (1) during the LVD1_35_35
evaluation or (2) in the LVS condition when evaluated with the ADAC target.
DBS false positives occurred during Infiniti Q50 and Mercedes E350 evaluations.
One DBS false positive event was observed during STP_25 tests series performed
with the Infiniti Q50. During this valid trial, the vehicle achieved a peak
deceleration of 0.62g (versus a mean of 0.42g during comparable baseline trials)
and avoided the steel trench plate.
63 percent of the valid STP_45 trials performed with the Mercedes E350 induced
DBS false positives. These tests produced decelerations of 1.12g to 1.26g versus a
mean of 0.52g during comparable baseline trials. When evaluated at 25 mph (40.2
km/h), DBS false positives were induced during 71 percent of the valid trials.
While these events did not produce the decelerations seen during the STP tests
performed at the higher speed, they too were enough to stop the vehicle before
reaching the steel trench plate (0.73 to 0.84 g versus a mean of 0.56g during
comparable baseline trials).
With one exception, the ability of the vehicles to satisfy the LVS DBS draft ARV was not
affected by the surrogate vehicle used. During Lexus LS46035
LVS tests performed with
displacement feedback, 50 percent of all trials performed with the ADAC surrogate were
31
An assessment of the Mitsubishi Outlander required consideration of non-valid trials for each LVM, LVD, and
STP test condition. However, all trials performed with the vehicle, regardless of test validity, were able to satisfy the
respective draft ARVs. 32
An assessment of the Subaru Outback required consideration of non-valid trials for the LVM_45_20 and STP_45
test conditions. However, all LVM, STP, and 25 mph LVD trials performed with the vehicle, regardless of test
validity, were able to satisfy the respective draft ARVs.
33 Of the thirteen overall Infiniti Q50 trials performed in the 35 mph LVD condition with displacement feedback,
eleven satisfied the evaluation criteria. After screening for validity, all five trials produced acceptable speed
reductions.
34 An assessment of the Lexus LS460 required consideration of non-valid trials for each test condition. However, all
LVM, STP, and 25 mph LVD trials performed with the vehicle, regardless of test validity, were able to satisfy the
respective draft ARVs. In the case of the 35 mph LVD evaluation, 83 percent of the tests performed (valid and non-
valid) were unable to achieve the necessary speed reduction.
35 An assessment of the Lexus LS460 required consideration of non-valid trials for each LVS test condition.
66
able to achieve the draft ARV speed reductions, compared with 89 percent of the LVS
tests performed with the SSV.
Consistent with the trend established by the CIB test results, the vehicles equipped with
the largest number of sensors did not necessarily perform better in the DBS tests than
those equipped with a single sensing technology.
4.8.4.2. Hybrid Feedback Results Summary
Based on the results specified in 4-15 (and 4-14 where appropriate), the following observations
were made:
Despite being able to satisfy the DBS draft ARV during 100 percent of the LVS test trials
performed with displacement feedback (regardless of surrogate vehicle), the Mitsubishi
Outlander36
was unable to do so in any of the tests performed with hybrid feedback.
With one exception, the ability of the vehicles to satisfy the LVS DBS draft ARV was not
affected by the surrogate vehicle used. None of the Subaru Outback LVS trials
performed with hybrid feedback were able to satisfy the DBS draft ARV with the SSV,
despite doing so during each of the five comparable trials performed with the ADAC
surrogate. This finding was particularly surprising given the vehicle’s performance
during (1) comparable DBS tests performed with displacement feedback and (2) CIB
evaluations. During these tests, the Subaru Outback’s ability to satisfy the respective draft
ARVs was not affected by the surrogate vehicle used.
36
An assessment of the Mitsubishi Outlander required consideration of non-valid trials for the LVS tests performed
with hybrid feedback and the SSV. However, all trials performed with the vehicle, regardless of test validity, were
unable to satisfy the respective draft ARVs.

67
Table 4-12. Number of Trials Able to Satisfy DBS Draft ARVs with Displacement Feedback
(Data not screened for test validity; bright yellow indicates an inability to satisfy the draft ARVs.)
Vehicle
Number of Tests Satisfying the DBS Performance Assessment Reference Values
LVS
25_0 LVM
45_20
LVM
25_10
LVD1
35_35
LVD2
25_25
STP_45
( FP)
STP_25
(FP) SSV ADAC
2014 Audi
A8L 0/8 2/12 8/9 0/8 5/9 8/8 8/8 8/8
2014 Cadillac
ATS2
11/11 7/8 8/8 9/9 1/12 7/8 8/8 8/8
2014 Infiniti
Q502
8/8 8/8 9/9 9/9 11/13 9/9 9/9 8/9
2014 Mercedes
E350 9/9 10/10 8/8 10/10 10/10 8/8 3/10 2/8
2014 Mitsubishi
Outlander 10/10 8/8 9/9 9/9 11/11 10/10 3/3
1
8/8
2013 Lexus
LS460 8/9 4/8 9/9 10/10 2/12 8/8 9/9 9/9
2013 Subaru
Outback 8/8 11/11 9/9 9/9 14/14 15/16 9/9 9/9
1
Only three tests performed
2
Result achieved with full FMVSS No. 135 burnish

68
Table 4-13. Number of Trials Able to Satisfy DBS Draft ARVs with Displacement Feedback
(Valid* tests shown; bright yellow indicates an inability to satisfy the draft ARVs.)
Vehicle
Number of Tests Satisfying the DBS Performance Assessment Reference Values
LVS
25_0 LVM
45_20
LVM
25_10
LVD1
35_35
LVD2
25_25
STP_45
( FP)
STP_25
(FP) SSV ADAC
2014 Audi
A8L 0/8 1/8 7/8 0/7 4/7 8/8 1/1 8/8
2014 Cadillac
ATS1
8/8 7/8 8/8 8/8 1/8 6/7 6/6 8/8
2014 Infiniti
Q501
8/8 8/8 8/8 8/8 5/5 6/6 7/7 4/5
2014 Mercedes
E350 8/8 8/8 8/8 8/8 8/8 8/8 3/8 2/7
2014 Mitsubishi
Outlander 8/8 8/8 6/6 6/6 4/4
no valid
tests
no valid
tests* 7/7
2013 Lexus
LS460 1/2 4/5 5/5 6/6
no valid
tests
no valid
tests 3/3 2/2
2013 Subaru
Outback 8/8 8/8 2/2 8/8 8/8 7/8 7/7 8/8
*Only three tests performed
1
Result achieved with full FMVSS No. 135 burnish

69
Table 4-14. Number of Trials Able to Satisfy DBS Draft ARVs with Hybrid Feedback
(Data not screened for test validity; bright yellow indicates an inability to satisfy the draft ARVs.)
Vehicle
Number of Tests Satisfying the DBS Performance Assessment Reference Values
LVS
25_0 LVM
45_20
LVM
25_10
LVD1
35_35
LVD2
25_25
STP_45
( FP)
STP_25
(FP) SSV ADAC
2014 Audi
A8L -- -- -- -- -- -- -- --
2014 Cadillac
ATS1
10/11 7/8 8/8 9/9 -- 8/8 -- --
2014 Infiniti
Q501
9/9 8/8 8/8 9/9 -- -- -- --
2014 Mercedes
E350 10/10 8/8 8/8 8/8 -- -- -- --
2014 Mitsubishi
Outlander 0/9 0/9 9/9 8/8 -- -- -- --
2013 Lexus
LS460 7/9 7/8 9/9 11/12 -- -- 10/10 9/9
2013 Subaru
Outback 1/11 5/5
2
8/8 9/9 -- -- -- --
-- = test not performed 1
Result achieved with full FMVSS No. 135 burnish 2
Only five tests performed due to instrumentation issues

70
Table 4-15. Number of Trials Able to Satisfy DBS Draft ARVs with Hybrid Feedback
(Valid* tests shown; bright yellow indicates an inability to satisfy the draft ARVs.)
Vehicle
Number of Tests Satisfying the DBS Performance Assessment Reference Values
LVS
25_0 LVM
45_20
LVM
25_10
LVD1
35_35
LVD2
25_25
STP_45
(FP)
STP_25
(FP) SSV ADAC
2014 Audi
A8L -- -- -- -- -- -- -- --
2014 Cadillac
ATS1
7/8 7/8 8/8 8/8 -- 6/6 -- --
2014 Infiniti
Q501
8/8 8/8 8/8 8/8 -- -- -- --
2014 Mercedes
E350 8/8 8/8 8/8 8/8 -- -- -- --
2014 Mitsubishi
Outlander 0/4 0/8 8/8 8/8 -- -- -- --
2013 Lexus
LS460 3/3 4/5 8/8 6/7 -- -- 2/2 4/4
2013 Subaru
Outback 0/8 5/5
2
2/2 8/8 -- -- -- --
*Validity assessment does not consider POV deceleration
-- = test not performed 1
Result achieved with full FMVSS No. 135 burnish 2
Only five tests performed due to instrumentation issues
Note that the June 2012 draft test procedures specified that performance criteria for a given test
condition were to be satisfied during 100 percent of the tests performed. Some respondents to the
July 2012 RFC indicated that this was not reasonable and that the criteria should be relaxed. To
investigate the effect of test stringency, two performance benchmarks were compared: meeting
ARV criteria during eight out of eight trials (i.e., 100 percent of the trials) and meeting ARV
criteria during seven out of eight trials (i.e., up to one trial per scenario not meeting the ARV
criteria).
By allowing up to one test per scenario to not satisfy the respective draft ARV, the following
effects were observed for tests performed with displacement feedback-based brake applications:
Audi A8L: now satisfies the LVM_45_20 draft ARV37
(but still failed to satisfy the LVS,
LVM_25_10, and LVD1_35_35 criteria).
37
An assessment of the Audi A8L required consideration of non-valid trials for the STP_45 test condition.

71
Cadillac ATS: now satisfies the LVS draft ARV, and became more likely to satisfy
LVD2_25_25 draft ARV38
(but still failed to satisfy the LVD1_35_35 criteria).
Infiniti Q50: became more likely to satisfy the LVD1_35_35 and STP_25 conditions39
.
Mercedes E350: no change.
Mitsubishi Outlander: no change.
Lexus LS460: the effect cannot be accurately ascertained because of the lack of valid
trials. Even if the least invalid tests were considered (i.e., two trials where the SV brakes
were applied 8.7 to 9.5 inches (221 to 241 mm) beyond the allowable tolerance), the
impact speeds were still 4.9 to 6.0 mph (7.9 to 9.7 km/h). Conclusively determining the
effect of allowing one trial unable to satisfy the LVD1_35_35 ARV on the vehicle’s
ability to satisfy the overall LVD1_35_35 ARV requires data from more valid trials.
Subaru Outback no longer failed to satisfy the LVD2_25_25 draft ARV, therefore
satisfying the draft ARVs for each DBS test scenario.
4.8.4.3. Effect of Hybrid-Feedback Brake Applications on the 2013 FCAM Test Vehicles
For most 2013 FCAM test vehicles, hybrid feedback was used for LVS and LVM evaluations40
.
Generally speaking, its use did not improve DBS performance beyond that realized with
displacement feedback, and in some cases the performance was much worse. One possible
reason for this is explained in the Mitsubishi Outlander comparison shown in Figure 4-6.
However, it appears most of the vehicles tested simply did not respond to hybrid-based
applications the way the 2014 Mercedes ML350 used in the agency’s development research
did.41
In Figure 4-6, note that pedal forces realized during tests with DBS activations (labeled “HF”
and “DF” for hybrid and displacement feedback brake applications, respectively) are greater than
their respective baseline trials, and that the application force realized during the displacement
feedback test with DBS (DF) does not fall to zero; it remains high until the vehicle stops (at
which point pedal force falls to the foundation brake system level approximately two seconds
38
Of the eight overall Cadillac ATS trials performed in the LVD2_25_25 condition with displacement feedback,
seven satisfied the performance criteria. After screening for validity, six of the seven trials produced acceptable
speed reductions.
39 Of the thirteen overall Infiniti Q50 trials performed in the LVD1_35_35 condition with displacement feedback,
eleven satisfied the performance criteria. After screening for validity, five valid trials were found to be valid and all
five trials produced acceptable speed reductions. Of the nine overall STP_25 trials performed, one produced a DBS
false positive (11 percent). Since this trial was deemed valid (i.e., one of five valid trials produced a false positive),
the likelihood of realizing such an event increased to 20 percent. However, the fact one mistrial is allowed per test
condition increases the likelihood the vehicle performance will be deemed acceptable.
40 In an attempt to keep the 2013 FCAM test burden reasonable, LVD evaluations included only very limited use of
hybrid-based brake applications.
41 As previously explained in S2.2.2.2, a 2014 Mercedes ML350 was used to develop NHTSA’s hybrid brake
application strategy.

72
after braking was initiated). Together, these elements indicate that the vehicle’s brake pedal
attempts to push up against the driver’s foot when DBS is activated, not fall towards the floor.
Since hybrid feedback is designed to gradually reduce applied force from the instant commanded
pedal position is reached to a small nominal value, the only way the brake controller can realize
the commanded fallback force and rate is to also reduce brake pedal displacement, as seen in
Differences from baseline due
to DBS activation
With displacement feedback,
differences from the
Outlander baseline remain for
the duration of the brake
application.
With hybrid feedback,
differences from the
Outlander baseline decay
over the duration of the brake
application.
Figure 4-6. Displacement versus hybrid feedback brake applications performed with the Mitsubishi Outlander

73
Figure 4-6. NHTSA believes that the vehicle’s DBS system interprets this reduction of applied
force and position as the driver requesting less braking torque, not requiring the supplemental
braking available by DBS. This is supported by the brake force and vehicle deceleration realized
by the time of impact at t 1.5 s, as by this time they had fallen to the magnitudes associated
with baseline levels (i.e., indicating DBS was no longer active).
4.8.4.4. Hybrid-Feedback-Based Brake Application Observations
Hybrid feedback has been shown to help certain vehicles reach their DBS-enhanced braking
levels by preventing applied brake force from falling to zero. However, the limited data
collected by NHTSA (n = 8) indicate use of hybrid-feedback-based braking will not benefit most
vehicles. Although a provision for hybrid braking has been added to the latest DBS draft test
procedures, it is unclear whether it will necessarily improve braking performance beyond that
achieved via use of displacement feedback.
2013 FCAM Research Observations 4.9.
NHTSA’s 2013 FCAM tests were performed to validate refinements made to the agency’s CIB
and DBS draft test procedures and the corresponding evaluation criteria. In summary:
Some test scenarios require complex choreography, but the agency believes that each
should be performable. Careful attention to SV and POV speeds, SV throttle release
timing, and SV brake application range are particularly important factors to monitor
during test conduct, as they were the most common sources of validity violations overall.
The ARVs specified in the August 2014 CIB and DBS draft test procedures are
achievable, although this assessment sometimes required consideration of non-valid trials
(in which minor infractions were not believed to affect test outcome).
Multiple 2013 FCAM test vehicles appear to be capable of satisfying the evaluation
factors described in the respective draft procedures.
CIB speed reduction criteria: 3 of 7 vehicles met criteria
DBS speed reduction criteria: 3 of 7 vehicles met criteria
CIB false positive suppression: all 7 vehicles met criteria
DBS false positive suppressions: 6 of 7 vehicles met criteria
CIB performance was not always indicative of that realized with DBS.
With few exceptions, the vehicles achieved better DBS performance with displacement-
feedback-based, as opposed to hybrid-feedback-based brake applications.
No consistent SV response differences were observed as a function of surrogate vehicle
for the LVS scenario tested.

74
5.0 SUMMARY OF CIB AND DBS DRAFT TEST PROCEDURE REFINEMENTS
Although the scenarios performed during the 2013 FCAM testing were each found to be
performable, further refinement to test tolerances and evaluation processes are expected to
provide better clarification and to improve efficient test conduct. Section 5 describes the key
changes made to the CIB and DBS draft test procedures after completion of the 2013 FCAM
tests in the areas of:
Use of the SV FCW alert
Revised throttle management specification
Brake application specifications (for DBS evaluations)
SV load specification
Test tolerance revision
NHTSA will use the refined draft test procedures to assess additional vehicles for research
purposes during calendar year 2014.
Use of the FCW Alert 5.1.
Based on its review of the 2013 FCAM test results, the agency believes that performability could
be improved if the throttle release schedules defined in the CIB/DBS procedures were based on
when the FCW alert occurred (further discussed in Section 5.2) rather than headway (used in the
past). This is because NHTSA expects the FCW alert to be more apparent, and more simply
interpreted, than a monitor numerically displaying a decaying headway to the test driver. To
describe how the SV FCW will be quantified, the August 2014 CIB and DBS draft test
procedures now include language indicating:
“The Forward Collision Warning (FCW) activation flag shall indicate when the system
has issued an alert to the SV driver. The FCW modality shall be either the auditory
alert, or the alert indicated to the test conductor by a NHTSA representative. The FCW
activation flag shall be recorded from a discrete signal and/or other methods that
clearly indicate when the alert has been issued provided there is no damage to the SV.”
Throttle Management Specification 5.2.
5.2.1. Throttle Management During CIB Evaluations
The validity screen used by NHTSA for its 2013 FCAM tests required that each maneuver
include (1) a period of constant SV speed, followed by (2) a period of constant SV throttle
position. Specifically, constant SV throttle position was to remain between ±3 percent of the
average throttle position calculated between the end of the constant SV speed interval to the
instant CIB automatically braked the SV with a deceleration ≥0.1g. Specifying a period of
constant throttle position prior to CIB activation (included in prior draft procedures) was

75
implemented in an attempt to reduce test variability observed from two sources: suppression
algorithms triggered by throttle pedal movement and throttle pedal-based brake system
precharge.
NHTSA has been told by both vehicle manufacturers and suppliers that the manner in which the
SV driver modulates the throttle pedal is very important. For some vehicles, this movement can
cause the CIB system to infer the driver is “active and attentive” and therefore not in need of
automatically-applied crash mitigation or avoidance braking. From a testing perspective, this is
undesirable since such suppressions confound, or even prevent, the ability to objectively and
repeatably assess CIB system performance.
Brake system precharge is designed to reduce the response time needed to apply brake torque in
emergency braking situations, regardless of whether the request is initiated by the driver or a
safety system such as CIB or DBS. Precharging is designed to reduce brake system response
time by allowing system pressure to build much faster than commanded by the driver’s brake
pedal movement alone, and for some vehicles it can be initiated by rapidly releasing the throttle
pedal. In the past, NHTSA has been concerned that modulating the throttle to maintain SV speed
has the potential to activate precharge. Of particular concern was that it may not be realized in
the same way during each trial performed within a given test series. Therefore, to minimize the
potential for throttle pedal-based precharge to confound the test outcome, previous draft test
procedures specified a period of constant throttle pedal position prior to CIB activation, as
demonstrated in Figure 5-1.
Although the intent of specifying periods of constant throttle position was to minimize test-to-
test variability, NHTSA ultimately concluded that the action was too difficult for the SV driver
to perform consistently. One of the most common reasons for this was that the deceleration
produced by CIB activation was great enough to move the driver’s leg/foot into the throttle pedal
prior to them being able to initiate a release, as shown in Figure 5-2.
To address this problem, the August 2014 draft test procedures no longer specify periods of
constant SV throttle position for any scenario. The revised procedure now states that the SV
shall maintain constant speed up to the onset of either the FCW auditory alert, or to the FCW
alert modality indicated to the test conductor by the NHTSA representative42
. From that instant,
the SV driver has up to 500 ms to fully release the throttle pedal. Any speed reduction that
occurs from the release of the throttle pedal to the onset of CIB activation is acceptable.
42
At the time when the June 2014 CIB/DBS draft test procedures were written, the FCW systems known to the
agency each had an auditory component, and NHTSA believes the determination of their respective onsets to be
straight-forward. This is not always the case for haptic cues such as throttle pedal pushback (confounded by driver
modulation) or brake application pulses (requires measurement of brake line pressures).

76
Throttle pedal is released and falls to
zero without first exceeding the 3% upper tolerance.
Throttle pedal is increases beyond the 3% upper tolerance before being
released (a validity violation).
Figure 5-1. Release from constant throttle after SV deceleration reaches 0.1g
(due to a haptic FCW alert in this example)
Figure 5-2. Throttle position violation after SV deceleration reaches 0.1g
(due to CIB activation in this example)
77
5.2.2. Throttle Management During DBS Evaluations
To be consistent with the CIB procedures, the SV will now be specified to maintain speed up to
the onset of either the FCW auditory alert, or to the FCW alert modality indicated to the test
conductor by a NHTSA representative during DBS evaluations. At that point, throttle is released
and a short while later the brake controller applies the brakes. Applicable sections now state:
“Within 500 ms after tFCW, but prior to the onset of the SV brake applications…the SV
throttle pedal shall be fully released. The throttle pedal release rate is not restricted.”
Note: The brake application timing/headway in the DBS procedure is still based on fixed TTC
values (which originate from the TTCs specified in the FCW NCAP), so the timing between
throttle release and brake application is expected to vary depending on what vehicle is evaluated.
This is different from the Euro NCAP procedure, which specifies the SV brakes are to be applied
1 second after the FCW is presented. Conceptually, the Euro NCAP method provides a way to
normalize the SV brake application timing. However, the headway at which the application
occurs (and therefore the subsequent speed reduction) is directly affected by FCW variability.
NHTSA has not evaluated the extent to which this variability may affect DBS performance.
Note: If FCW-based throttle release timing is used and a late FCW alert occurs, it is possible the
throttle (human input) and brake (robot input) could be applied at the same time. This could
suppress DBS and is the reason that the “Within 500 ms after tFCW, but prior to the onset of the
SV brake applications …” language was specified in the above draft test procedure excerpt.
Brake Application Specifications 5.3.
5.3.1. Hybrid Feedback Magnitude Adjustment
For the hybrid brake applications used during 2013 FCAM tests, the same application rate and
position used for displacement feedback tests were commanded. However, once at the desired
position, application force was reduced at a rate of 56.2 lbf/s (250 N/s) to a force fallback
magnitude equal to 50 percent of the brake force required to achieve an average deceleration of
0.3g during the vehicle’s brake system characterization. This fallback magnitude has been
increased to 100 percent of that capable of achieving an average deceleration of 0.3g during the
vehicle’s brake system characterization in the August 2014 DBS draft test procedures. The
reasons for this are two-fold:
Earlier versions of NHTSA’s DBS draft test procedures included an option to use
displacement or force feedback to evaluate system performance. Regardless of which
feedback control was specified, the magnitude of the commanded input was based on that
required to produce average deceleration of 0.3g during the vehicle’s brake system
characterization. By basing the applications on a common deceleration, maneuver
severity was intended to be equal, regardless of the application method selected.
Applications based only on force (i.e., force feedback applications) are no longer present
in the DBS draft test procedures; they have been superseded by hybrid-based

78
applications. During the 2013 FCAM tests, the fallback force magnitude associated with
hybrid applications was only one-half of that which would have been used with force
feedback. Therefore, to better align the magnitude of displacement and hybrid-based
applications, the hybrid force fallback will be equal to that which would have been used
for force feedback-based evaluations.
5.3.2. Brake Application Feedback Mode Selection
The August 2014 DBS draft test procedure includes the provision to evaluate an SV using
displacement- or hybrid-feedback-based brake applications. However, since DBS performance
evaluations are time-consuming, it is not practical for the agency to utilize both application
strategies per vehicle tested. For this reason, the August 2014 DBS draft test procedure includes
language stating that:
“…a NHTSA representative may specify to the Contractor which programmable brake
controller mode shall be used for a vehicle’s respective evaluation.”
To determine the most appropriate brake application strategy for a given vehicle, NHTSA may
need to consult with the respective vehicle manufacturer prior to test conduct. The August 2014
DBS draft test procedure states that the SV must satisfy all draft ARVs using one brake
application method. Applicable language states:
“[DBS test procedure] Tables 11 and 12 provide a summary of acceptable SV performance
for each test scenario. The performance requirements specified in [DBS test procedure]
Table 11 and the non-activation requirements specified in [DBS test procedure] Table 12
must be satisfied using the same NHTSA-specified brake application method (i.e.,
displacement or hybrid feedback).”
SV Load Specification 5.4.
The June 2012 draft test procedures described the SV loading condition as:
“The SV shall be loaded with one driver and all required equipment during the testing.
Where possible, the equipment shall be placed on the front passenger seat of the SV.”
Some RFC commenters requested that this description be more explicitly defined, and one
suggested the loading condition provided in FMVSS No. 135 be adopted43
. Based on the amount
of instrumentation required to perform the tests, NHTSA expects the lightly loaded condition
specified in FMVSS No. 135will be exceeded if an in-vehicle experimenter is used to support the
test driver (allowed in the August 2014 draft test procedures). However, to better define the load
condition NHTSA expects to use in its evaluations, the previous language has been changed.
The new language provided in the August 2014 CIB and DBS draft test procedures explicitly
allows an in-vehicle experimenter in the SV and states the vehicle’s loading should not exceed
43
NHTSA assumes this commenter intended to recommend the “Lightly Loaded” condition defined in FMVSS No.
135 (the vehicle’s unloaded weight plus the weight of a mass of 396 lbs (180 kg) including driver and instruments).

79
the front or rear Gross Axle Weight Ratings (GAWRs) or the vehicle’s Gross Vehicle Weight
Rating (GVWR):
“Inclusion of an in-vehicle experimenter to assist the SV driver with test conduct (e.g.,
data acquisition, completion of logs, etc.) is permitted. Where possible, the in-vehicle
experimenter shall be seated in the first seating position behind the front passenger’s
seat.
Vehicle load shall include the unloaded vehicle weight (UVW) plus driver, experimenter
(if required), and instrumentation without exceeding vehicle Gross Vehicle Weight Rating
(GVWR) and all Gross Axle Weight Ratings (GAWR).”
Test Tolerance Revision 5.5.
Table 5-1 provides a comparison of the three major CIB and DBS draft test procedure tolerance
specifications. Each change present in this table has been made in response to a request for
clarification by 2012 RFC commenters and/or to improve test performability based on NHTSA’s
experience with test track evaluations to date.

80
Table 5-1. CIB and DBS Test Tolerance Overview and Change History
(Changes from a previous version are indicated in red.)
Parameter
Draft Test Procedure Version
June 2012
2013 FCAM testing
(not publicly released, only used internally
by NHTSA for CIB/DBS testing in 2013)
August 2014
SV and POV speed ±1 mph (1.6 km/h) No change No change
Constant SV speed range (CIB) LVS: TTC = 5.1 3.1s
LVM: TTC = 5.0 3.0s
LVS: TTC = 5.1 3.1s
LVM: TTC = 5.0 3.0s
LVD_35_35: Validity onset POV brake
LVD_25_25: Validity onset POV brake
STP: TTC = 5.1 3.1 s
LVS: TTC = 5.1 tFCW
LVM: TTC = 5.0 tFCW
LVD1_35_35: Validity onset tFCW
LVD2_25_25: Validity onset tFCW
STP: 5.1 tFCW (or to end-of-test if
the SV FCW is not presented)
Constant SV speed range (DBS) LVS: TTC = 4.1 2.1s
LVM: TTC = 4.0 2.0s
LVS: TTC = 4.1 2.1s
LVM: TTC = 4.0 2.0s
LVD1_35_35: Validity onset POV brake
LVD2_25_25: Validity onset POV brake
STP: TTC = 4.1 2.1 s
LVS: TTC = 5.1 tFCW
LVM: TTC = 5.0 tFCW
LVD1_35_35: Validity onset tFCW
LVD2_25_25: Validity onset tFCW
STP: TTC = 5.1 tFCW (or
TTC = 5.1 2.1 s if TTC =
2.1s occurs before tFCW)
SV and POV lateral position from road center Not specified Not specified ±2 ft (0.6 m)
SV-to-POV lateral orientation relative to each other ±1 ft (0.3 m) No change ±2 ft (0.6 m)
SV-to-POV headway (applicable to LVD tests only) n/a ± 8 ft (2.4 m) No change
SV yaw rate ±1 deg/s No change ±2 deg/s up to the instant SV
deceleration exceeds 0.25g
Constant SV throttle position (CIB) Within +/- 2% from applicable1 TTC
to end of test
Within +/- 3% of an average position from
applicable2 TTC to end of test or SV
deceleration ≥ 0.1g
No longer required
tFCW = Onset of the SV FCW alert
POV Brake = onset of the POV brake application, defined as the instant when POV deceleration ≥ 0.05g
2For LVS, TTC = 3.1 s; for LVM, TTC = 3.0 s
3For LVS, TTC = 3.1 s; for LVM, TTC = 3.0 s; for LVD, TTC = 3.4 s

81
Table 5-1. CIB and DBS Test Tolerance Overview And Change History (continued)
(Changes from a previous version are indicated in red.)
Parameter
Draft Test Procedure Version
June 2012
2013 FCAM Testing
(not publicly released, only used internally
by NHTSA for CIB/DBS testing in 2013)
August 2014
SV throttle release timing (CIB) Not permitted Permitted to be fully released after SV
deceleration ≥ 0.1g
LVS, LVM, LVD: Fully released
within 500 ms of tFCW
STP: Fully released within 500 ms
of tFCW. If the SV FCW is not
presented, SV throttle pedal is not
released until end-of-test.
SV throttle release timing (DBS) >1 s prior to brake application No change
LVS, LVM, LVD: Fully released
within 500 ms of tFCW but prior to
the onset of the SV brake
application.
STP: Fully released within 500 ms
of tFCW or TTC = 2.1s (whichever
occurs first) but prior to the onset of
the SV brake application.
SV brake application range to POV (DBS) Not specified Not specified ±2 ft (±0.6 m)
SV brake application rate (DBS) 7 ± 1 in/s (178 ± 25.4 mm/s) No change 10 + 1in/s (254 ± 25.4 mm/s)
POV deceleration (applicable to LVD tests only) Not specified
FCW NCAP criteria; minimum and
maximum values must remain within 0.3g
±0.03g overall; an initial overshoot up to
0.375g allowed for 50 ms
Mean must fall within 0.3g ± 0.03g
Ambient temperature range 32° F (0° C) to 100° F (38° C) No change 45° F (7° C) to 104° F (40° C)

82
6.0 REFERENCES
[1] “Forward-Looking Advanced Braking Technologies Research Report,” Docket NHTSA-2012-0057-0001
[2] “Crash Imminent Brake System Performance Evaluation, June 2012 Working Draft,” Docket NHTSA-
2012-0057-0001
[3] “Dynamic Brake Support Performance Evaluation, June 2012 Working Draft,” Docket NHTSA-2012-
0057-0001
[4] Request for Comment in the Federal Register seeking responses to the public release of its CIB/DBS
research efforts (77 FR 39561, July 3, 2012); Docket NHTSA-2012-0057-0002
[5] “NHTSA’s Strikeable Surrogate Vehicle Preliminary Design Overview,” Docket NHTSA-2012-0057-0032
[6] National Highway Traffic Safety Administration. (2013). “Traffic Safety Facts 2011.” Washington DC:
U.S. Department of Transportation, DOT HS 811 754
[7] IIHS/HLDI ESV paper number 13-0126, 2013 ESV Conference
[8] “Advanced Brake Assist – Real World effectiveness of current implementations and next generation
enlargements,” presented by Mercedes-Benz at the 2013 ESV Conference. (Paper Number 13-0194).
[9] Irene Isaksson-Hellman (IF Insurance Company P&C Ltd.) and Magdalena Lindman (Volvo Car
Corporation) in connection with the Association for the Advancement of Automotive Medicine (AAAM)
conference in Seattle, Washington, 2012.
[10] Centre for Automotive Safety Research, The University of Adelaide, AUSTRALIA; Paper Number 13-
0152 presented at the 2013 ESV Conference in Seoul Korea.
[11] “Cost & Weight Analysis of Forward Collision Warning System (FCWS) and Related Braking Systems for
Light Vehicles;” Docket NHTSA-2011-0066-0011
[12] Final decision notice to upgrade NCAP. 73 FR 40016 (July 11, 2008).
[13] Najm, W. G., Stearns, M. D., Howarth, H., Koopmann, J., and Hitz, J., “Evaluation of an Automotive Rear-
End Collision Avoidance System,” U.S. Department of Transportation, National Highway Traffic Safety
Administration, DOT HS 810 569, March 2006.
[14] NASS-CDS: National Automotive Sampling System-Crashworthiness Data System. NASS-CDS
[15] NASS-GES: National Automotive Sampling System: General Estimates System. NASS-GES
[16] “Radar Measurements of NHTSA’s Surrogate Vehicle SSV,” Docket NHTSA-2012-0057-0034
[17] Allgemeiner Deutscher Automobil-Club (ADAC), “Comparative Test of Advanced Emergency Braking
Systems,” August 2012.
[18] “An Evaluation of CIB System Susceptibility to Non-Threatening Driving Scenarios on the Test Track,”
Docket NHTSA-2012-0057-0035
[19a] “Objective Tests for Automatic Crash Imminent Braking (CIB) Systems - Final Report,” DOT HS 811 521,
September 2011
[19b] “Objective Tests for Automatic Crash Imminent Braking (CIB) Systems - Appendix,” DOT HS 811 521A,
September 2011

83
[20] International Standards Organization (ISO), “Intelligent Transport System – Forward Vehicle Collision
Mitigation Systems – Operation, Performance, and Verification Requirements,” ISO / NP 22839 draft,
September 26, 2011.
[21] Euro NCAP protocol website (http://www.euroncap.com/technical/protocols.aspx)
[22] Perron T., Kassaagi M. and Brissart G., “Active Safety Experiments with Common Drivers for the
Specification of Active Safety Systems”, Proceedings of the 17th International Technical Conference on the
Enhanced Safety of Vehicles, Amsterdam, 4-7 June 2001, Paper Number 427 (Paper available at
http://www-nrd.nhtsa.dot.gov/pdf/esv/esv17/proceed/00004.pdf).
[23] Forkenbrock, G.J., Snyder, A., Jones, R.E., “An Evaluation of Light Vehicle Brake Assist,” NHTSA
Technical Report, DOT HS 810 989, May 2009. Report is available at
http://www.nhtsa.gov/DOT/NHTSA/NVS/Crash%20Avoidance/Technical%20Publications/2010/811371.p
df
[24] “Crash Imminent Brake System Performance Evaluation, August 2014 Working Draft,” Docket NHTSA-
2012-0057- TBD
[25] “Dynamic Brake Support Performance Evaluation, August 2014 Working Draft,” Docket NHTSA-2012-
0057- TBD

84
7.0 APPENDICES
APPENDIX A-1: 2013 FCAM CIB and DBS Test Summaries – Draft ARV Performance
APPENDIX A-2: 2013 FCAM CIB and DBS Test Summaries – SV Speed Reduction
APPENDIX A-3: 2013 FCAM CIB and DBS Test Summaries – SV Crash Avoidance

85
APPENDIX A-1a: 2013 FCAM CIB Test Summary – Draft ARV Performance (Valid Trials)
Vehicle Tech
Maneuver (speeds in mph)
LVS 25_SSV LVS 25_ADAC LVM 45_20 LVM 25_10 LVD1 35_35 LVD2 25_25 STP 45 STP 25
2014 Audi A8L
CIB
Not performed Not performed 8/8 0/7 8/8 6/7 8/8 7/7
2014 Cadillac ATS Not performed Not performed 8/8 6/8 0/7 7/7 8/8 8/8
2014 Infiniti Q50 8/8 8/8 8/8 7/8 3/8 8/8 8/8 7/7
2014 Mercedes E350 8/8 8/8 8/8 8/8 8/8 8/8 8/8 8/8
2014 Mitsubishi Outlander Not performed Not performed 8/8 8/8 8/8 7/7 8/8 8/8
2013 Lexus LS460 8/8 8/8 7/7 6/6 6/6 5/5 8/8 7/7
2013 Subaru Outback 8/8 8/8 7/7 3/3 2/2 4/4 8/8 8/8
Note: Infiniti Q50 CIB results obtained during tests where the SV driver released the throttle after the FCW haptic throttle pedal pushback occurred.
Note: No throttle position sensor (TPS) data for Cadillac ATS CIB STP tests; throttle release validity could not be assessed.
Note: POV decelerations recorded during the LVD evaluations were not screened for validity.
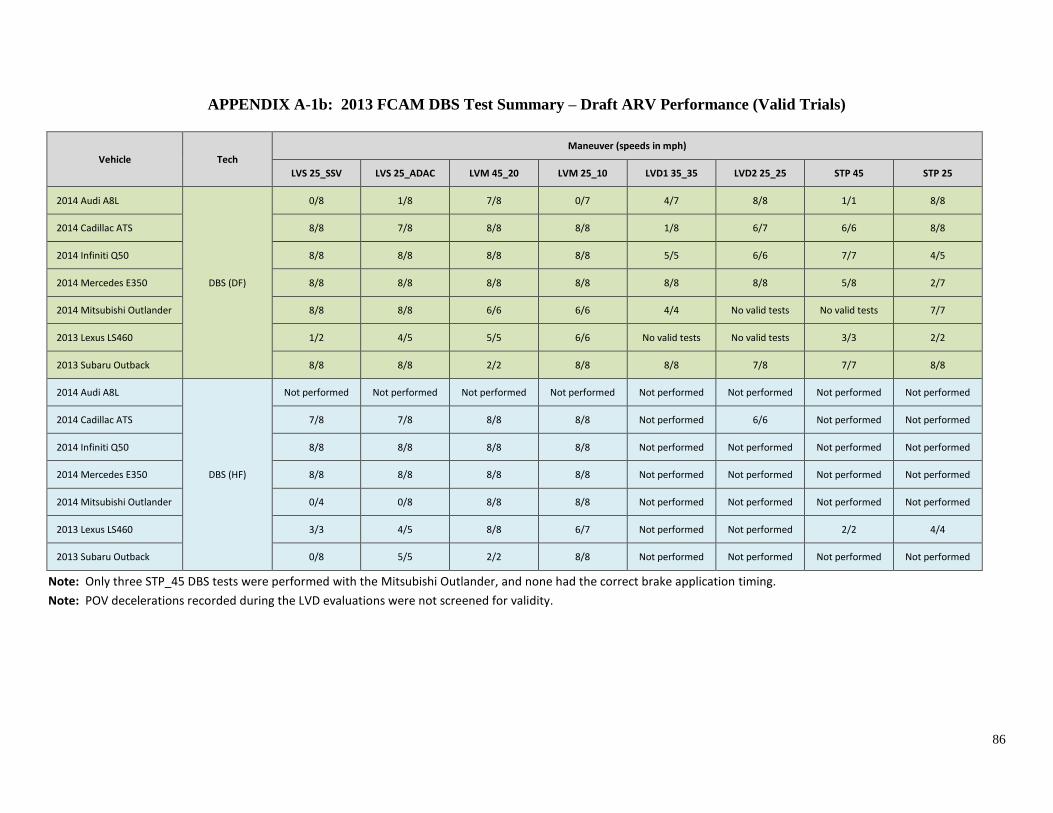
86
APPENDIX A-1b: 2013 FCAM DBS Test Summary – Draft ARV Performance (Valid Trials)
Vehicle Tech
Maneuver (speeds in mph)
LVS 25_SSV LVS 25_ADAC LVM 45_20 LVM 25_10 LVD1 35_35 LVD2 25_25 STP 45 STP 25
2014 Audi A8L
DBS (DF)
0/8 1/8 7/8 0/7 4/7 8/8 1/1 8/8
2014 Cadillac ATS 8/8 7/8 8/8 8/8 1/8 6/7 6/6 8/8
2014 Infiniti Q50 8/8 8/8 8/8 8/8 5/5 6/6 7/7 4/5
2014 Mercedes E350 8/8 8/8 8/8 8/8 8/8 8/8 5/8 2/7
2014 Mitsubishi Outlander 8/8 8/8 6/6 6/6 4/4 No valid tests No valid tests 7/7
2013 Lexus LS460 1/2 4/5 5/5 6/6 No valid tests No valid tests 3/3 2/2
2013 Subaru Outback 8/8 8/8 2/2 8/8 8/8 7/8 7/7 8/8
2014 Audi A8L
DBS (HF)
Not performed Not performed Not performed Not performed Not performed Not performed Not performed Not performed
2014 Cadillac ATS 7/8 7/8 8/8 8/8 Not performed 6/6 Not performed Not performed
2014 Infiniti Q50 8/8 8/8 8/8 8/8 Not performed Not performed Not performed Not performed
2014 Mercedes E350 8/8 8/8 8/8 8/8 Not performed Not performed Not performed Not performed
2014 Mitsubishi Outlander 0/4 0/8 8/8 8/8 Not performed Not performed Not performed Not performed
2013 Lexus LS460 3/3 4/5 8/8 6/7 Not performed Not performed 2/2 4/4
2013 Subaru Outback 0/8 5/5 2/2 8/8 Not performed Not performed Not performed Not performed
Note: Only three STP_45 DBS tests were performed with the Mitsubishi Outlander, and none had the correct brake application timing.
Note: POV decelerations recorded during the LVD evaluations were not screened for validity.

87
APPENDIX A-2a: 2013 FCAM CIB Test Summary – SV Speed Reduction (Valid Trials)
Vehicle Tech
Maneuver (speeds in mph)
LVS 25_SSV LVS 25_ADAC LVM 45_20 LVM 25_10 LVD1 35_35 LVD2 25_25 STP 45 STP 25
2014 Audi A8L
CIB
Not performed Not performed 12.3 - 17.5 4.3 - 5.7 14.7 - 21.7 9.3 - 11.8 n/a n/a
2014 Cadillac ATS Not performed Not performed 16.7 - 24.6 8.6 - 14.9 1.9 - 7.6 10.6 - 12.4 n/a n/a
2014 Infiniti Q50 11.2 - 25.6 15.1 - 25.5 11.4 - 25.4 12.0 - 14.9 4.5 - 12.2 24.3 -25.6 n/a n/a
2014 Mercedes E350 10.5 - 25.1 24.3 - 25.4 23.9 - 25.5 13.6 - 15.9 21.1 - 29.3 24.6 - 25.7 n/a n/a
2014 Mitsubishi Outlander Not performed Not performed 17.3 - 20.1 14.1 - 15.7 17.8 - 22.3 14.6 - 16.6 n/a n/a
2013 Lexus LS460 24.5 - 25.2 24.2 - 25.5 23.6 - 25.1 13.8 - 15.6 16.2 - 24.4 24.7 - 25.6 n/a n/a
2013 Subaru Outback 24.6 - 25.7 24.6 - 25.4 23.8 - 25.8 13.9 - 15.6 20.6 - 21.1 25.0 - 25.4 n/a n/a
Note: Infiniti Q50 CIB results obtained during tests where the SV driver released the throttle after the FCW haptic throttle pedal pushback occurred.
Note: No throttle position sensor (TPS) data for Cadillac ATS CIB STP tests; throttle release validity could not be assessed.
Note: POV decelerations recorded during the LVD evaluations were not screened for validity.

88
APPENDIX A-2b: 2013 FCAM DBS Test Summary – SV Speed Reduction (Valid Trials)
Vehicle Tech
Maneuver (speeds in mph)
LVS 25_SSV LVS 25_ADAC LVM 45_20 LVM 25_10 LVD1 35_35 LVD2 25_25 STP 45 STP 25
2014 Audi A8L
DBS (DF)
8.8 - 14.7 11.8 - 25.4 18.4 - 25.2 6.7 - 10.7 16.5 - 29.3 24.2 - 25.3 6.1 6.8 - 9.3
2014 Cadillac ATS 24.5 - 25.3 21.7 - 25.4 23.7 - 25.4 13.4 - 15.2 13.1 - 30.8 24.2 - 25.9 8.7 - 10.1 10.2 - 11.8
2014 Infiniti Q50 23.5 - 25.0 23.9 - 25.1 22.3 - 24.8 13.1 - 14.9 24.6 - 31.9 24.3 - 25.3 9.1 - 10.6 10.3 - 24.3
2014 Mercedes E350 24.6 -25.6 24.6 - 25.8 24.2 - 25.6 14.0 - 14.7 26.4 - 31.6 24.2 - 25.4 11.2 - 28.7 13.4 - 24.6
2014 Mitsubishi Outlander 24.3 - 25.3 23.7 - 25.7 23.7 - 25.2 13.7 - 15.0 24.3 - 27.3 No valid tests No valid tests 15.0 - 21.0
2013 Lexus LS460 21.3 - 24.5 16.5 - 25.5 23.6 - 24.6 14.2 - 15.8 No valid tests No valid tests 9.8 - 10.6 9.9 - 10.2
2013 Subaru Outback 24.1 - 25.2 24.2 - 25.3 25.0 - 25.4 14.5 - 16.6 26.6 - 35.4 14.6 - 25.3 8.9 - 10.3 8.3 - 9.5
2014 Audi A8L
DBS (HF)
Not performed Not performed Not performed Not performed Not performed Not performed Not performed Not performed
2014 Cadillac ATS 21.7 - 25.4 19.8 - 25.1 23.8 - 25.2 14.0 - 15.1 Not performed 24.1 - 25.2 Not performed Not performed
2014 Infiniti Q50 24.2 - 25.1 23.4 - 25.0 23.6 - 25.4 13.8 - 15.9 Not performed Not performed Not performed Not performed
2014 Mercedes E350 23.9 - 25.6 24.6 - 25.6 23.0 - 25.0 13.8 - 14.9 Not performed Not performed Not performed Not performed
2014 Mitsubishi Outlander 15.4 - 19.4 19.1 - 22.5 24.5 - 25.5 14.0 - 15.1 Not performed Not performed Not performed Not performed
2013 Lexus LS460 24.8 - 25.9 17.4 - 25.5 23.8 - 25.3 13.0 - 15.2 Not performed Not performed 7.5 - 8.6 7.6 - 8.2
2013 Subaru Outback 19.6 - 25.0 24.5 - 25.4 25.4 - 25.5 15.1 - 15.9 Not performed Not performed Not performed Not performed
Note: Only three STP_45 DBS tests were performed with the Mitsubishi Outlander, and none had the correct brake application timing.
Note: POV decelerations recorded during the LVD evaluations were not screened for validity.

89
APPENDIX A-3a: 2013 FCAM CIB Test Summary – SV Crash Avoidance (Valid Trials)
Vehicle Tech
Maneuver
LVS 25_SSV LVS 25_ADAC LVM 45_20 LVM 25_10 LVD1 35_35 LVD2 25_25 STP 45 STP 25
2014 Audi A8L
CIB
Not performed Not performed 0/8 0/7 0/8 0/7 0/8 0/7
2014 Cadillac ATS Not performed Not performed 8/8 6/8 0/7 0/7 0/8 0/8
2014 Infiniti Q50 7/8 7/8 4/8 7/8 0/8 8/8 0/8 0/7
2014 Mercedes E350 6/8 8/8 8/8 8/8 0/8 8/8 0/8 0/8
2014 Mitsubishi Outlander Not performed Not performed 0/8 8/8 0/8 0/8 0/8 0/8
2013 Lexus LS460 8/8 8/8 7/7 6/6 5/6 5/5 0/8 0/7
2013 Subaru Outback 8/8 8/8 7/7 3/3 0/2 4/4 0/8 0/8
Note: Infiniti Q50 CIB results obtained during tests where the SV driver released the throttle after the FCW haptic throttle pedal pushback occurred.
Note: No throttle position sensor (TPS) data for Cadillac ATS CIB STP tests; throttle release validity could not be assessed.
Note: POV decelerations recorded during the LVD evaluations were not screened for validity.

90
APPENDIX A-3b: 2013 FCAM DBS Test Summary – SV Crash Avoidance (Valid Trials)
Vehicle Tech
Maneuver
LVS 25_SSV LVS 25_ADAC LVM 45_20 LVM 25_10 LVD1 35_35 LVD2 25_25 STP 45 STP 25
2014 Audi A8L
DBS (DF)
0/8 1/8 7/8 0/7 4/7 8/8 0/1 0/8
2014 Cadillac ATS 8/8 7/8 8/8 8/8 1/8 6/7 0/6 0/8
2014 Infiniti Q50 8/8 8/8 8/8 8/8 5/5 6/6 0/7 1/5
2014 Mercedes E350 8/8 8/8 8/9 8/8 8/8 8/8 0/8 5/7
2014 Mitsubishi Outlander 8/8 8/8 6/6 6/6 4/4 No valid tests No valid tests 0/7
2013 Lexus LS460 1/2 4/5 5/5 6/6 No valid tests No valid tests 0/3 0/2
2013 Subaru Outback 8/8 8/8 2/2 8/8 8/8 7/8 0/7 0/8
2014 Audi A8L
DBS (HF)
Not performed Not performed Not performed Not performed Not performed Not performed Not performed Not performed
2014 Cadillac ATS 7/8 7/8 8/8 8/8 Not performed 6/6 Not performed Not performed
2014 Infiniti Q50 8/8 8/8 8/8 8/8 Not performed Not performed Not performed Not performed
2014 Mercedes E350 8/8 8/8 8/9 8/8 Not performed Not performed Not performed Not performed
2014 Mitsubishi Outlander 0/4 0/8 8/8 8/8 Not performed Not performed Not performed Not performed
2013 Lexus LS460 3/3 4/5 8/8 6/7 Not performed Not performed 0/2 0/4
2013 Subaru Outback 0/8 5/5 2/2 8/8 Not performed Not performed Not performed Not performed
Note: Only three STP_45 DBS tests were performed with the Mitsubishi Outlander, and none had the correct brake application timing.
Note: POV decelerations recorded during the LVD evaluations were not screened for validity.