NHS Pay Review Body twenty-seventh report 2013 Cm 8555 (PDF)
98
NHS Pay Review Body Twenty-Seventh Report 2013 Chair: Jerry Cope Cm 8555 £21.25 NHS Pay Review Body
Transcript of NHS Pay Review Body twenty-seventh report 2013 Cm 8555 (PDF)
Chair: Jerry Cope
NHS Pay Review Body
Twenty-Seventh Report 2013
Chair: Jerry Cope
Cm 8555 £21.25
NHS Pay Review Body

NHS Pay Review Body
Twenty-Seventh Report 2013
Chair: Jerry Cope
Presented to Parliament by the Prime Minister and the Secretary of State for Health
by Command of Her Majesty
Presented to the Scottish Parliament by the First Minister and the Cabinet Secretary for Health and Wellbeing
Presented to the National Assembly for Wales by the First Minister and the Minister for Health and Social Services
Presented to the Northern Ireland Assembly by the First Minister, Deputy First Minister and Minister for Health, Social Services
and Public Safety
March 2013
Cm 8555 £21.25
ii
© Crown copyright 2013
You may re-use this information (excluding logos) free of charge in any format or medium, under the terms of the Open Government Licence. To view this licence, visit http://www.nationalarchives.gov.uk/doc/open-government-licence/ or e-mail: [email protected].
Where we have identified any third party copyright information you will need to obtain permission from the copyright holders concerned.
Any enquiries regarding this publication should be sent to:Office of Manpower EconomicsVictoria HouseSouthampton RowLondonWC1B 4ADhttp://www.ome.uk.com/enquiry/default.aspx
This publication is available for download at www.official-documents.gov.uk
This document is also available from www.ome.uk.com
ISBN: 9780101855525
Printed in the UK by The Stationery Office Limited on behalf of the Controller of Her Majesty’s Stationery Office
ID 2543930 03/13 27405 19585
Printed on paper containing 75% recycled fibre content minimum.
iii
NHS Pay Review Body
The NHS Pay Review Body (NHSPRB) is independent. Its role is to make recommendations to the Prime Minister, the Secretary of State for Health, the First Minister and the Cabinet Secretary for Health and Wellbeing in Scotland, the First Minister and the Minister for Health and Social Services in the National Assembly for Wales, and the First Minister, Deputy First Minister and Minister for Health, Social Services and Public Safety of the Northern Ireland Executive, on the remuneration of all staff paid under Agenda for Change (AfC) and employed in the National Health Service (NHS)*.
In reaching its recommendations, the Review Body is to have regard to the following considerations:
the need to recruit, retain and motivate suitably able and qualified staff;
regional/local variations in labour markets and their effects on the recruitment and retention of staff;
the funds available to the Health Departments, as set out in the Government’s Departmental Expenditure Limits;
the Government’s inflation target;
the principle of equal pay for work of equal value in the NHS;
the overall strategy that the NHS should place patients at the heart of all it does and the mechanisms by which that is to be achieved.
The Review Body may also be asked to consider other specific issues.
The Review Body is also required to take careful account of the economic and other evidence submitted by the Government, Trades Unions, representatives of NHS employers and others.
The Review Body should take account of the legal obligations on the NHS, including anti-discrimination legislation regarding age, gender, race, sexual orientation, religion and belief, and disability.
Reports and recommendations should be submitted jointly to the Prime Minister, the Secretary of State for Health, the First Minister and the Cabinet Secretary for Health and Wellbeing in Scotland, the First Minister and the Minister for Health and Social Services of the National Assembly for Wales, and the First Minister, Deputy First Minister and Minister for Health, Social Services and Public Safety of the Northern Ireland Executive.
*References to the NHS should be read as including all staff on AfC in personal and social care service organisations in Northern Ireland.
Members of the Review Body are:
Mr Jerry Cope (Chair)Professor David BlackabyDame Denise HoltMrs Joan IngramMr Graham JaggerMrs Janet RubinMrs Maureen ScottProfessor Anna Vignoles
The secretariat is provided by the Office of Manpower Economics.
v
Contents
Page
Executive Summary vii
Chapter 1: Introduction 1
2: The Economy, Inflation, Labour Market, Earnings and Pay 9Settlements
3: Recruitment, Retention and Motivation 25
NHS Workforce, Vacancies and Turnover 25
Shortage Occupations 31
Recruitment and Retention Premia 32
Workforce Planning 34
Training and Development 37
Appraisal and the Knowledge and Skills Framework 38
Staff Engagement 39
4: Funds Available to the Health Departments 44
5: Pay Proposals and Recommendations for 2013/14 54
Basic Pay Uplift 54
Compression of AfC Pay Points 15 and 16 61
High Cost Area Supplements 62
6: A Forward Look 65
Appendix A: Remit Letters 71
B: Recommended Agenda for Change Pay Scales with Effect from 771 April 2013
C: Composition of Our Remit Group 78
D: The Department of Health’s Pay Metrics 81
E: The Parties’ Website Addresses 86
F: Previous Reports of the Review Body 87
G: Abbreviations 89
vii
NHSPRB Twenty-Seventh Report 2013
Executive Summary
Our 2013/14 Recommendations
• A 1% increase to all Agenda for Change (AfC) pay points from 1 April 2013.• A 1% increase to the high cost area supplement (HCAS) minima and
maxima from 1 April 2013.
Our Remit
Our remit for 2013/14 was conditioned by the UK Government’s public sector pay policy which limits pay uplifts to an average of 1% and the Department of Health’s invitation to consider recommendations of up to an average of 1%. The Welsh Government and the Northern Ireland Executive confirmed in evidence the application of the UK Government’s policy within their Devolved Administrations. In addition, the Scottish Government in its remit outlined its 2013/14 public sector pay policy as a 1% cap, a pay freeze for staff earning over £80,000, a minimum £250 increase for staff earning less than £21,000, and an increase to the Scottish Living Wage.
Notwithstanding these constraints within our remit, we gave full consideration to the evidence presented in reaching our recommendations. We believe our process has most value when we are able to bring independent and expert judgment to bear on all factors within our terms of reference. The UK Government’s approach not only pre-judged our deliberations but influenced the expectations of staff and effectively set both a ceiling and a baseline to our considerations.
Economy, Inflation, Labour Market, Earnings and Pay Settlements
Our assessment suggests that labour market indicators and pay settlements generally are not currently putting pressure on AfC pay. We recognise the Staff Side’s arguments that inflation rates have reduced real wages, although we note the effects have been felt across all sectors, not uniquely in the NHS. As and when the labour market picks up, the NHS will need to remain a competitive employer and be ready to respond quickly to ensure continued recruitment and retention of the quality of staff needed to deliver both quality of care to patients and the major changes required across the NHS. Against this labour market background, we urge the UK Government and the Devolved Administrations to plan their pay strategies for and after this period of pay restraint.
Recruitment, Retention and Motivation
Based on the available data, we conclude that AfC recruitment and retention is not a current concern but we intend to keep longstanding shortage occupations under review. To maintain an appropriate AfC workforce, we reiterate our concerns on the importance of: effective workforce planning to avoid imbalances in supply and demand as new arrangements take shape; training and development to help address skill shortages and to support changing skill mix; and well-functioning appraisals linked to the Knowledge and Skills Framework. There is, importantly, some evidence of an emerging and worrying trend that AfC staff engagement and motivation is in decline. As a priority, NHS leaders should develop and improve staff engagement to deliver the transformational change required for better and more cost effective patient care.

viii
Funds Available to the Health Departments
Constrained NHS finances will necessitate difficult decisions on service developments, activity growth and pay. Nonetheless, the Department of Health and the Devolved Administrations confirmed that the NHS was funded for a 1% pay award in 2013/14 and the Scottish Government confirmed its policy was affordable. We therefore conclude that, across the NHS, employers should be in a position to fund an AfC pay award of 1%. In reaching this conclusion, we have relied on the Department of Health’s methodology to calculate pay drift. Others presented differing figures and we urge all the parties to adopt the Department’s methodology. On the wider issue of efficiency savings, recent research suggests that Trusts have been, perhaps understandably, focused on short term savings rather than combining these with the longer term transformational change required to deliver major savings. This is not sustainable for the medium term.
Pay Proposals and Recommendations for 2013/14
Our pay recommendation is driven by the constraints of the UK Government’s public sector pay policy, staff expectations of a 1% pay award, our assessment of affordability, and the need to support AfC staff motivation and engagement as an essential ingredient to underpin better quality of care to patients. There are no general AfC recruitment and retention problems. However, staff engagement and motivation is in decline as pressures are building putting at risk staff goodwill and their willingness to contribute to necessary improvements in the design, delivery and quality of services to patients. A pay award of less than 1% would have an additional detrimental effect on staff motivation given expectations and the major challenges in the NHS. On affordability, we recognise the financial pressures in the NHS. Incremental pay progression (averaging 3.4% when weighted by the number of staff eligible) was available to the majority (58%) of AfC staff, although we note that overall pay drift is estimated at 1% per annum. Taking the affordability factors together, we conclude that, across the NHS, a 1% award is affordable.
We are not persuaded by the labour market evidence that there is a case for a differential pay award for the lower paid. Public sector pay policies have offered some protection for the lower paid and our analysis of illustrative AfC take-home pay since April 2010 confirms that staff in lower pay bands have had better protection through annual pay awards, pension contribution rates and tax changes in comparison with other AfC staff in recent years. Appropriate pay levels in relation to the Minimum Income Standard and the Living Wage are matters for each of the four Governments and, in the absence of recruitment and retention problems, we make no comment on these.
Regarding the Scottish Government’s proposals, we have also seen no direct labour market evidence relating to AfC staff in Scotland either to support targeting of the lower paid or freezing the pay of staff earning over £80,000. In fact, our analysis for the latter suggests those staff in the higher pay bands have fared relatively less well in comparison with other AfC staff in recent years and research shows that public sector pay is behind the private sector at the higher percentiles. Based on all the evidence under our terms of reference, we consider that our recommendation for AfC staff should apply on a consistent basis across the UK.
Overall, we and most parties consider a uniform pay uplift is the most appropriate response and is a greater priority than any targeting of pay awards. A uniform approach is also appropriate given that all AfC staff are expected to contribute to significant changes across the NHS. We recommend a 1% increase to all AfC pay points from 1 April 2013.
We also considered the compression of AfC pay points 15 and 16 following two years of £250 rises for staff earning £21,000 or less. The parties have made little progress in resolving the compression. However, we received no evidence that it has resulted in any specific concerns at this stage. We therefore make no recommendation on this point but request further evidence in our next pay round.
ix
We recommended in our Market-Facing Pay Report that the parties conduct a fundamental review of HCAS and we look forward to that review informing our next pay round. In the meantime, our Market-Facing Pay Report found that recruitment and retention indicators for AfC staff were relatively less favourable in London and surrounding areas. The evidence supports a return to our usual practice, as set out in the NHS Terms and Conditions of Service Handbook, of uprating the HCAS minima and maxima by the overall pay uplift which is taken into account in the staff element of the Market Forces Factor. We recommend a 1% increase to the HCAS minima and maxima from 1 April 2013.
A Forward Look
On AfC developments in 2013/14, we look forward to further progress on the recommendations in our Market-Facing Pay Report and negotiations in the NHS Staff Council. In our view, a more cohesive approach to the AfC framework is required involving reward and engagement strategies at all appropriate levels, the HR capacity and capability to implement these strategies, and effective staff involvement and management at all levels of the NHS.
The following key messages cover the priority actions for the NHS going forward so that the AfC framework can play its full part in supporting the significant changes underway in the NHS:
• Delivering transformational change – pay restraint has played a significant role in delivering efficiency savings so far. This is not sustainable. So, for the future, greater focus will be required on service redesign, workforce reconfiguration and productiv-ity improvements in increased partnership with staff;
• Comprehensive staff engagement strategies – developing and improving staff en-gagement nationally and locally will support motivation and maximise the essential contribution of staff to delivering better and more cost effective patient care and to enable transformational change;
• An effective AfC framework – pay represents a high proportion of NHS expenditure and AfC pay needs to represent value for money. We welcome recent AfC develop-ments at national level in England and look forward to their effective implementa-tion at local level. We have already recognised, in our Market-Facing Pay Report, the need for further evolution of the AfC framework and, for our next pay round, we expect to see employers, nationally and locally, develop reward and engagement strategies in partnership with staff; and
• Pay remit – an unrestricted remit for our next pay round would enable us to consider the full range of evidence and to continue to arrive at independent recommenda-tions and help us to maintain the parties’, and AfC staff’s, trust and confidence in our process.
MR JERRY COPE (Chair) PROFESSOR DAVID BLACKABY DAME DENISE HOLT MRS JOAN INGRAM MR GRAHAM JAGGER MRS JANET RUBIN MRS MAUREEN SCOTT PROFESSOR ANNA VIGNOLES
14 February 2013

1
Chapter 1 – Introduction
Introduction
1.1 For 2013/14, we have been presented with a remit by the UK Government based on its public sector pay policy which limits pay uplifts to an average of 1%. The Devolved Administrations in Wales and Northern Ireland sought no variation from this remit but separate pay proposals have been made by the Scottish Government.
1.2 In the light of the 2013/14 remit from the UK Government, we have applied the considerations under our standing terms of reference. Alongside the overall pay uplift, we were also invited to consider whether high cost area supplements (HCAS) or other allowances within our remit, such as national recruitment and retention premia (RRP), should be changed. In this report we set out the evidence presented on these matters by the parties, and our conclusions and recommendations under the various elements of our terms of reference. Our recommendations apply to all NHS staff paid under Agenda for Change (AfC).
Twenty-Sixth Report 20121
1.3 Our Twenty-Sixth Report was submitted to the Prime Minister, Secretary of State for Health and the relevant Ministers for the Devolved Administrations on 3 February 2012. Our recommendations were constrained by the second year of the UK Government’s and Devolved Administrations’ policies of a public sector pay freeze for those earning more than £21,000. We recommended an uplift of £250 to AfC spine points 1 to 15 from 1 April 2012. The UK Government accepted our recommendations in full on 13 March 20122 with the Devolved Administrations also confirming their acceptance of our report.
Remit for Our Twenty-Seventh Report 2013
1.4 The remit for this report was first announced by the Chancellor of the Exchequer in his Autumn Statement3 in November 2011. The Chancellor said that the public sector pay freeze would end after 2012/13 but that, in order to support fiscal consolidation, for each of the following two years the UK Government would seek public sector pay awards that average at 1%. The Chancellor also stated that Departmental budgets would be adjusted in line with this policy, with the exception of health and schools budgets where money would be recycled. The 2011 Autumn Statement added that the UK Government did not control pay awards within local government or the Devolved Administrations, budgets would be adjusted on the assumption of comparable action being taken and in line with devolved funding principles.
1.5 The Chief Secretary to the Treasury (CST) wrote to us on 24 September 2012 reiterating the UK Government’s public sector pay policy. He confirmed that pay awards would average 1% for the two years following the pay freeze and set out how the UK Government intended that we should approach the 2013/14 round. The UK Government believed that the case for continued pay restraint across the public sector remained strong. The CST said that, at the highest level, there were unlikely to be significant recruitment and retention issues for the majority of public sector workers over the next year. In relation to affordability, he said that pay restraint remained a crucial part of the
1 NHSPRB (2012), Twenty-Sixth Report, TSO (Cm 8298).2 Written Ministerial Statement, Secretary of State for Health, 13 March 2012 (Hansard Column 13WS).3 HM Treasury (2011), Autumn Statement 2011, TSO (Cm 8231).
2
consolidation plans helping to put the UK back onto the path of fiscal sustainability and that continued restraint in relation to public sector pay would help to protect jobs in the public sector and support the quality of public services.
1.6 For 2013/14, the CST told us that the UK Government would limit uplifts to an average of 1% in each workforce and asked us to consider how the 1% would be divided within our remit group and, additionally, to consider the level of progression pay provided to the workforce and the potential for payments to be more generous for certain groups of staff.
1.7 The remit was further clarified by the Parliamentary Under Secretary of State for Health who wrote to us on 17 October 2012. For 2013/14, he asked us to make recommendations of up to an average 1% for the basic pay of NHS staff within our remit and, in doing so, we should consider the evidence received in respect of our terms of reference. He asked that, in making recommendations, we should also consider:
• Whether some staff groups warranted pay increases of more or less than 1% as long as, overall, the increase did not exceed an average of up to 1%;
• That 60% of our remit group received incremental progression of, on average, about 3.5%;
• The impact of AfC pay differentials as a result of the £250 increase for staff earning less than £21,000 during the pay freeze period;
• Whether high cost area supplements or any other allowances within our remit should be changed, noting that any changes would have to be funded within the 1% cap; and
• Whether any further work would be required on any issues to help our consideration of evidence in the future.
1.8 We did not receive specific remit letters from the Welsh Government or the Northern Ireland Executive regarding the 2013/14 pay round. However, in written evidence they both confirmed application of the UK Government’s public sector pay policy within their Devolved Administrations.
1.9 The Cabinet Secretary for Health and Wellbeing in the Scottish Government wrote to us on 26 September 2012 outlining its remit and the Scottish Government’s public sector pay policy for 2013/14 as follows:
• A 1% cap on the cost of the increase in basic pay for staff earning under £80,000;• A pay freeze to apply to all staff earning over £80,000;• A commitment to the Scottish Living Wage set to increase by April 2013;• All staff earning less than £21,000 per annum should receive a minimum basic pay
increase of £250; and• The commitment to no compulsory redundancies would apply in 2013/14.
1.10 In outlining the Scottish Government’s public sector pay policy, the Cabinet Secretary recognised that it was broadly in line with what had been announced across the rest of the UK.
1.11 The remit letters from the CST, Department of Health and the Scottish Government are at Appendix A.
Our Comment on the 2013/14 Remit
1.12 While the remit for 2013/14 allows us to consider overall pay awards following a period of a public sector pay freeze, we remain concerned that our remit was conditioned by the UK Government’s approach to public sector pay. In our last two reports4, we commented
4 NHSPRB (2011), Twenty-Fifth Report, TSO (Cm 8029), paragraph 1.11. NHSPRB (2012), Twenty-Sixth Report, TSO (Cm 8298), paragraphs 1.13 and 6.14.
3
on the importance of: our independent process; our ability to consider the full range of evidence; our role in making independent recommendations to the four Governments; and maintaining the confidence in the process among AfC staff. A constrained remit from the UK Government may limit the scope of the evidence we receive from all parties thereby reducing our ability to produce recommendations drawing on the widest evidence-base.
1.13 We continue to believe that our process has most value when we are able to bring independent and expert judgment to bear on all factors within our terms of reference. These standing terms of reference include the latest economic and labour market conditions and the affordability of pay awards – all factors which have driven the UK Government’s continuing approach to public sector pay. We consider and balance all these factors in reaching our independent judgments.
1.14 The UK Government’s approach to limiting public sector pay awards pre-judged the outcome of our deliberations and also influenced the expectations of the public sector staff affected. By seeking pay awards that average at 1%, the UK Government, based largely on affordability grounds, effectively set not only a ceiling but also, in practice, a baseline to our considerations. We have a range of other factors to take into account.
1.15 In the light of constrained remits, the chairs of the Pay Review Bodies (PRBs) wrote to the CST on 27 September 2012. The chairs believed that the PRBs add more value, and operate with the trust and confidence of all parties, when they produce their reports under their normal terms of reference, without the UK Government placing specific restrictions on the scope of their recommendations. The PRB chairs accepted that the UK Government has the right to reject or modify recommendations, although they hoped that, in view of the independent, evidence-based nature of the PRBs’ work, this would not be a decision reached routinely or lightly. The chairs commented that remits had been expressed in a way which led to the PRBs’ independence being increasingly questioned by the remit groups and, as a result, the trust and confidence they had in the PRBs was at risk. The chairs concluded that they would have much preferred unrestricted remits which would have led to greater trust in the system. The chairs urged the CST to consider that approach in future remits.
1.16 The CST replied on 19 October 2012 agreeing that the independence of the PRBs was of paramount importance and that the views of the PRB chairs would be taken fully on board when considering future remits.
1.17 In his letter setting out the UK Government’s policy, the CST reaffirmed that the UK Government continued to value greatly our contribution in delivering robust, evidence-based pay outcomes for public sector workers. The Parliamentary Under Secretary of State for Health also emphasised the importance he and ministerial colleagues placed on the vital and expert work we did in considering pay for NHS non-medical staff.
Our Market-Facing Pay Report 2012
1.18 In addition to our annual remits to consider pay for AfC staff, the Chancellor of the Exchequer announced in the 2011 Autumn Statement5 that certain PRBs would be asked to consider how public sector pay could be made more responsive to local labour markets. The Chancellor wrote to us on 7 December 2011 reiterating the points in the Autumn Statement. On 23 December 2011, the Secretary of State for Health set out more information on how to make pay more market-facing in local areas for NHS AfC staff and the specific factors to take into account. This remit was for England only.
5 HM Treasury (2011), Autumn Statement 2011, TSO (Cm 8231).
4
1.19 We submitted our report Market-Facing Pay: How Agenda for Change pay can be made more appropriate to local labour markets6 on 4 July 2012. Our key conclusions were:
• We support market-facing pay for AfC staff to support recruitment and retention of good quality staff to deliver patient care and where it can be shown to make more effective and efficient use of NHS funds;
• The AfC system is comparable with current private and public sector practice for large national employers and has a number of flexibilities and key market-facing elements. AfC is perceived as fair and objective by all parties, supports stable industrial relations, and is viewed by the parties as compliant with equal pay principles;
• Our analysis of recruitment, retention and geographical pay variation does not provide the firm evidence which would be essential to justify further investment in additional market-facing pay in the NHS at this time, although further development of AfC is needed to meet the challenges and cost pressures in the NHS;
• AfC is the appropriate vehicle through which to develop market-facing pay as it already has positive market-facing features – we therefore specifically recommend a fundamental review of high cost area supplements, appropriate use of local RRP, and regular review of AfC, including its flexibilities, with any necessary negotiations brought to a conclusion at a reasonable pace; and
• Trusts should have transparent pay and reward policies which clearly state their approach to the use of AfC flexibilities.
1.20 In the Autumn Statement7 on 5 December 2012, the Chancellor of the Exchequer announced that the UK Government intended to accept the recommendations of the four PRBs that reported on market-facing pay. He added that there should be no new centrally-determined local pay rates or zones but that there should be greater use of existing flexibilities. In his Written Ministerial Statement8, the Secretary of State for Health confirmed the UK Government’s acceptance of all our recommendations including taking forward a review of HCAS. He commented on the priority to continue to develop the AfC system and to ensure that national terms and conditions were fit for purpose and supported the recruitment and retention of good quality staff in the most cost-effective and efficient way.
1.21 We comment in Chapter 6 on the importance of the Department of Health, employers and unions making quick progress on our recommended work to make pay more market-facing and how this might feed into the evidence for our next pay round.
Parties Giving Evidence for Our Twenty-Seventh Report
1.22 On 1 August 2012, the Secretary of State for Health wrote to us outlining new arrangements for evidence submission for England. The UK Government’s White Paper of July 2010 Equity and Excellence: Liberating the NHS set out that “pay decisions should be led by healthcare employers rather than imposed by Government”. Previously, the Department of Health gave comprehensive evidence on recruitment, retention, motivation and morale of staff but the role of the Department was changing and it would no longer be responsible for day to day management of the NHS. Following discussions with interested parties, the Secretary of State informed us that from the 2013/14 pay round onwards:
• The Department of Health will produce separate high level evidence for us focusing on the economic and financial (NHS funding) context and strategic policy;
6 NHSPRB (2012), Market-Facing Pay: How Agenda for Change pay can be made more appropriate to local labour markets, TSO (Cm 8501).
7 HM Treasury (2012), Autumn Statement 2012, TSO (Cm 8480).8 Hansard, 5 December 2012, Column 64WS.
5
• NHS Employers (NHSE) will provide separate and more detailed evidence about the recruitment, retention and morale of staff subject to the AfC system; and
• The Department of Health will however retain overall accountability for the evidence provided by NHSE and will ensure that it meets our quality expectation.
1.23 The Secretary of State informed us that the Department of Health was also discussing with new NHS national organisations to explore whether they might submit evidence directly to us on issues that affect their workforce. In this regard, we welcomed the opportunity to discuss appropriate matters with the NHS Commissioning Board and the Centre for Workforce Intelligence (CfWI) who attended one of our meetings in September 2012. We look forward to further discussions with other NHS organisations of relevance to our business.
1.24 We established our schedule for this round in order to deliver our report in February 2013. We were pleased to receive the majority of the parties’ evidence on the date we set for its submission. We are also grateful to the Department of Health, NHSE, Devolved Administrations, Staff Side and individual unions who produced timely responses to our supplementary questions on their written evidence.
1.25 Written evidence was provided by the following organisations:
Government departmentsDepartment of Health (DH), England;Department of Health, Social Services and Children (DHSSC), Wales;Department of Health, Social Services and Public Safety (DHSSPSNI), Northern Ireland;Scottish Government Health and Social Care Directorates (SGHSCD);
Bodies representing NHS staffJoint Staff Side9;Royal College of Midwives (RCM);Royal College of Nursing (RCN);UNISON;Unite the Union;Northern Ireland Public Service Alliance (NIPSA);
Employers’ bodiesNHS Employers (NHSE);Foundation Trust Network (FTN).
1.26 We held five separate oral evidence sessions in December 2012 with: the Parliamentary Under Secretary of State for Health, HM Treasury and the four Health Departments’ officials; the Cabinet Secretary for Health and Wellbeing and officials from the Scottish Government (held in Edinburgh); NHS Employers; the Foundation Trust Network; and the Joint Staff Side. We note that the Parliamentary Under Secretary of State now has responsibility for NHS pay and workforce matters and we welcomed his attendance to give oral evidence. We hope in the future that the Secretary of State for Health would also attend if the nature of our remit demands a strategic overview of the UK Government’s position.
1.27 Our work programme included 11 Review Body meetings in which we considered the written and oral evidence, examined regular information on the economy and labour market, and formed our conclusions and recommendations. We offer our thanks to the parties for submitting written evidence and attending our sessions.
9 The Joint Staff Side comprises: British Association of Occupational Therapists; British Dietetic Association; British Orthoptic Society; Chartered Society of Physiotherapists; Federation of Clinical Scientists; GMB; Royal College of Midwives; Royal College of Nursing; Society of Chiropodists and Podiatrists; Society of Radiographers; UCATT; UNISON; and Unite the Union.

6
Review Body Visits in 2012
1.28 Our annual programme of visits to NHS organisations continues to be an important addition to the parties’ evidence. During these visits, which take place across a range of NHS organisations in England, Scotland, Wales and Northern Ireland, we meet and discuss issues with members of our remit group and NHS management. We extend our thanks to all those who gave generously of their time in order to meet us and to those staff organising our visits.
1.29 Between July and September 2012 we visited the following NHS organisations:
England• Royal Devon and Exeter NHS Foundation Trust;• Barnet, Enfield and Haringey Mental Health NHS Trust;• Colchester University Hospital NHS Foundation Trust;
Scotland• NHS Western Isles Health Board;
Wales• Powys Teaching Health Board;
Northern Ireland• Northern Ireland Ambulance Service Health and Social Care Trust.
NHS Developments
1.30 We provide a brief update below on a range of developments across the NHS in England which currently or in the near future will impact on the employment and pay arrangements of NHS AfC staff.
NHS Reforms
1.31 The Health and Social Care Act 2012 received Royal Assent on 27 March 2012. For the NHS in England, the Department of Health told us that it will introduce: clinically led commissioning; provider regulation to support innovative services; greater voice for patients; new focus for public health; greater accountability locally and nationally; and streamlined Arms Length Bodies which will help release resources to the frontline.
1.32 In the light of the Act, the Department of Health reiterated that the UK Government did not believe that it should be responsible for setting the pay of staff in every NHS organisation in England and that individual employers should be free, as Foundation Trusts are now, to set their own pay, terms and conditions to recruit, retain and motivate their staff. The Department added that the maintenance of national contracts for pay, terms and conditions for those employers that wished to use them was nonetheless an important part of its pay strategy and that the PRBs had an equally important role in recommending the annual uplift for these contracts.
1.33 The Department informed us of its intention to develop a total reward strategy for the NHS in England covering pay, conditions of service and pensions policy. The strategy also aimed to comply with the UK Government’s public sector pay strategy and to support the Department’s Quality, Innovation, Productivity and Prevention (QIPP) agenda.
1.34 Developments in the organisation of the NHS in England could have implications for AfC staff and those presenting evidence to us. We note that the UK Government intends all Trusts to achieve foundation status by 2014, supported by the NHS Trust Development Agency and regulated by Monitor. This will mean that all Trusts will have freedoms on pay and conditions for AfC staff. In this respect, we welcome receiving evidence

7
for the first time from the Foundation Trust Network. Organisations such as the NHS Commissioning Board, Clinical Commissioning Groups, Health Education England, Local Education and Training Boards, and the CfWI will increasingly have information on pay and workforce matters of interest to our deliberations.
Pensions
1.35 We commented in our Twenty-Sixth Report10 on the importance of the NHS Pension Scheme in the total reward package which could influence recruitment, retention and motivation of staff. We are therefore grateful to the parties for updating us on pensions in their evidence.
1.36 In 2011, the UK Government announced plans to increase member contribution rates by an average of 3.2 percentage points for all public sector pension schemes, including the NHS Pension Scheme. From April 2012, NHS Pension Scheme contribution increases were introduced which involved no increase for those earning up to £26,557 (2010/11 full time pay), a 1.5 percentage point increase in gross contribution rates for those earning between £26,558 and £48,982, and a 2.4 percentage point increase for those earning over £48,983. The Government Actuary’s Department estimated that 630,000 (or approximately 48%) of members of the NHS Pension Scheme would pay no extra increase in 2012/13. Discussions on increases to pension contribution rates for 2013/14 and 2014/15 continued – the Department of Health has proposed to implement the indicative 2013/14 contribution rates through the draft statutory instrument11 which is being consulted upon at the time of submission of this report. The Staff Side provided an assessment of the impact of contribution increases which indicated that staff earning over £15,000 would experience rises between 0.6% and 6.0% from 2012 to 2015. In cash terms, the Staff Side estimated that NHS staff on Band 5 would experience a decrease in take-home pay of £319 in 2012/13 and £212 in 2013/14.
1.37 Proposals to reform the NHS Pension Scheme from April 2015 were published in March 201212. In July 2012, the CST confirmed to the House of Commons that the UK Government would take forward legislation to implement NHS Pension Scheme reforms. The Department of Health and NHSE provided information on the new scheme including being based on career average earnings, normal pension age equal to state pension age, and some protection arrangements for existing members.
Legal Obligations on the NHS
1.38 We were told by the parties in oral evidence that, for the 2013/14 remit, there were no issues around the requirement in our standing terms of reference to take account of legal obligations on the NHS including anti-discrimination legislation.
Key Themes for this Report
1.39 Developments in the NHS across the UK, combined with financial pressures, bring into sharp relief the importance of effective management of NHS pay and workforce matters both nationally and locally. We recognise the role that pay and workforce change will play in supporting the ambitious programme of NHS developments. In England, the focus is on the structural change being introduced under the NHS reforms and the push for efficiency savings under the QIPP initiative. The NHS in the Devolved Administrations
10 NHSPRB (2012), Twenty-Sixth Report, TSO (Cm 8298), paragraphs 1.23-1.29 and 6.9-6.11.11 Draft NHS Pension Scheme, Additional Voluntary Contributions and Injury Benefits (Amendment) Regulations 2013.
Available at: http://www.nhsbsa.nhs.uk/3778.aspx.12 Department of Health (March 2012), Reforming the NHS Pension Scheme for England and Wales – Proposed Final
Agreement. Available at: http://www.dh.gov.uk/health/2012/03/final-agreement/.
8
also faces similar pressures from service and organisational change, and efficiency savings targets. Against this background, our report is influenced by a number of themes applying across the UK as follows:
• Delivering transformational change – evidence to us suggests that, so far, there appears to have been a short term approach to achieving efficiency savings and pay restraint has played a significant role in these. Pay, over time, will need to move with recruitment and retention pressures, so this is not sustainable. We understand the necessity of addressing immediate efficiencies but we have heard and endorse the argument that the major prize for the NHS should be the efficiency savings to be gained from a shift towards transformational change including service redesign, workforce reconfiguration and the need for significant productivity improvements in increased partnership with staff;
• Comprehensive staff engagement strategies – we highlight the importance of developing and improving staff engagement nationally and locally to support motivation to deliver better and more cost effective patient care and to enable the transformational change required in the NHS. Well-motivated AfC staff can make a substantial contribution to delivering change. Not all the leadership in the NHS has been quick enough to respond effectively in this area;
• An effective AfC framework – we have seen no evidence that the UK Government and Devolved Administrations have taken a longer term view on a pay strategy during and after this period of pay restraint. Pay represents a high proportion of Trusts’ expenditure and needs to represent value for money. We welcome recent AfC developments at national level in England and look forward to their effective implementation at local level. We have already recognised, in our Market-Facing Pay Report, the need for further evolution of the AfC framework and, for our next pay round, we expect to see employers, nationally and locally, develop reward and engagement strategies in partnership with staff; and
• Pay remit – our view is that we can best contribute to a well-run NHS, to the benefit of staff, patients and taxpayers, when we are free to consider the full range of evidence and to continue to arrive at independent recommendations helping us to maintain the parties’, and AfC staff’s, trust and confidence in our process.

9
Chapter 2 – The Economy, Inflation, Labour Market, Earnings and Pay Settlements
Introduction
2.1 We analyse below the latest available data on economic and labour market indicators (as at January 2013). They provide an essential backdrop to our consideration of pay recommendations for AfC staff. The parties’ evidence was presented in October 2012 and therefore reflects the position at that time. We conclude this chapter with an assessment of the earnings of AfC staff drawing on NHS information and data from the 2012 Annual Survey of Hours and Earnings (ASHE). We also monitor data on membership of the NHS Pension Scheme.
2.2 In summary:
• Economic growth is expected to be sluggish in the near term with a slow recovery over the next three years;
• Inflation is expected to remain above the 2% target through 2013;• The numbers of people employed has risen, particularly for those working part time.
Private sector employment continues to grow and public sector employment to fall. Unemployment has fallen but is expected to rise gradually over the next two years; and
• Average earnings growth remains modest, forecast growth is weak and median pay settlements are expected to remain at around 2.5%.
Economic Growth
2.3 Gross Domestic Product (GDP) was flat, averaged over the four quarters of 2012 (Figure 2.1). GDP ended 2012 3.3% smaller than its peak in the first quarter of 2008, but 3.2% higher than its trough in the second quarter of 2009.
Figure 2.1: GDP growth 2007 to 2012 (chained volume measure at market prices)
Source: Office for National Statistics.
% c
han
ge
2007
Q1
2007
Q2
2007
Q3
2007
Q4
2008
Q1
2008
Q2
2008
Q3
2008
Q4
2009
Q1
2009
Q2
2009
Q3
2009
Q4
2010
Q1
2010
Q2
2010
Q3
2010
Q4
2011
Q1
2011
Q2
2011
Q3
2011
Q4
2012
Q1
2012
Q2
2012
Q3
2012
Q4
Change from a year earlier (IHYQ)Change from a previous quarter (IHYR)
-8
-6
-4
-2
0
2
4
6
10
2.4 The Bank of England published its latest inflation report and forecast in November 20121. It expected economic growth to remain sluggish in the near term, with the economy likely to see a sustained, but slow, recovery over the next three years. The Bank of England expected that GDP growth was more likely to be below than above its historical average rate over the next three years and output was likely to remain below its pre-crisis level until 2015. The HM Treasury panel of independent forecasts2 predicted that GDP would grow by 1.0% over 2013. The Office for Budgetary Responsibility (OBR) published its economic and fiscal outlook on 5 December 20123, concluding that the economy had performed less strongly in 2012 than it expected primarily reflecting the weakness of net exports. The OBR forecast GDP to grow by 1.2% in 2013.
Inflation
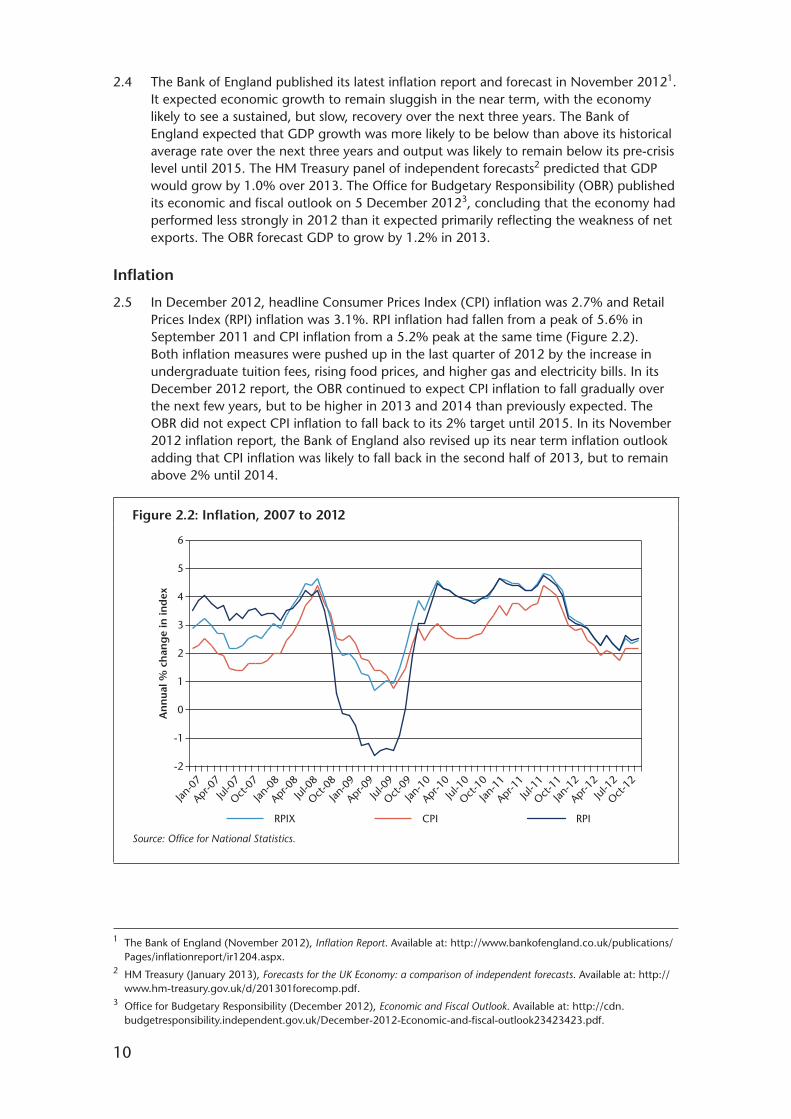
2.5 In December 2012, headline Consumer Prices Index (CPI) inflation was 2.7% and Retail Prices Index (RPI) inflation was 3.1%. RPI inflation had fallen from a peak of 5.6% in September 2011 and CPI inflation from a 5.2% peak at the same time (Figure 2.2). Both inflation measures were pushed up in the last quarter of 2012 by the increase in undergraduate tuition fees, rising food prices, and higher gas and electricity bills. In its December 2012 report, the OBR continued to expect CPI inflation to fall gradually over the next few years, but to be higher in 2013 and 2014 than previously expected. The OBR did not expect CPI inflation to fall back to its 2% target until 2015. In its November 2012 inflation report, the Bank of England also revised up its near term inflation outlook adding that CPI inflation was likely to fall back in the second half of 2013, but to remain above 2% until 2014.
Figure 2.2: Inflation, 2007 to 2012
Source: Office for National Statistics.
An
nua
l % c
han
ge
in in
dex
6
5
4
3
2
1
0
-1
-2
Oct-07
Jul-0
7
Apr-0
7
Jan-0
7
RPIRPIX CPI
Oct-08
Jul-0
8
Apr-0
8
Jan-0
8
Oct-09
Jul-0
9
Apr-0
9
Jan-0
9
Oct-10
Jul-1
0
Apr-1
0
Jan-1
0
Oct-11
Jul-1
1
Apr-1
1
Jan-1
1
Oct-12
Jul-1
2
Apr-1
2
Jan-1
2
1 The Bank of England (November 2012), Inflation Report. Available at: http://www.bankofengland.co.uk/publications/Pages/inflationreport/ir1204.aspx.
2 HM Treasury (January 2013), Forecasts for the UK Economy: a comparison of independent forecasts. Available at: http://www.hm-treasury.gov.uk/d/201301forecomp.pdf.
3 Office for Budgetary Responsibility (December 2012), Economic and Fiscal Outlook. Available at: http://cdn.budgetresponsibility.independent.gov.uk/December-2012-Economic-and-fiscal-outlook23423423.pdf.
11
Table 2.1: Inflation forecasts, fourth quarter
OBR (December)
Bank of England central
projection (November)
Treasury independent average (January)
CPI RPI CPI CPI RPI
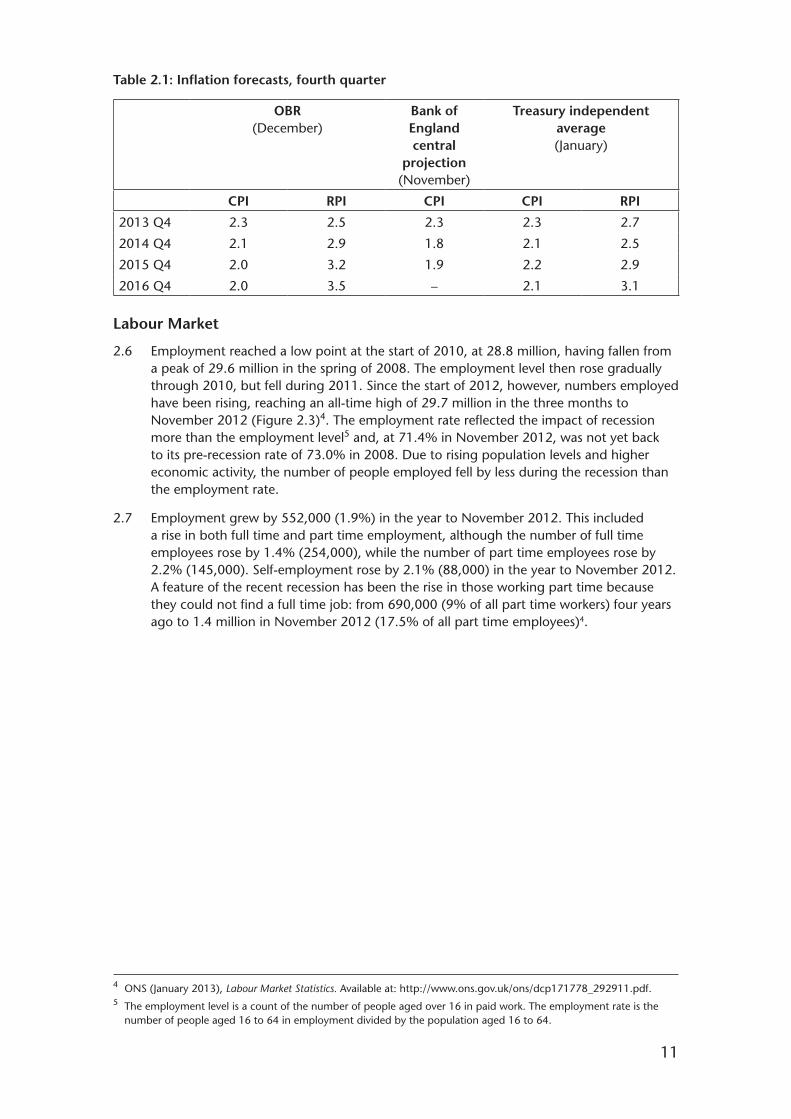
2013 Q4 2.3 2.5 2.3 2.3 2.7
2014 Q4 2.1 2.9 1.8 2.1 2.5
2015 Q4 2.0 3.2 1.9 2.2 2.9
2016 Q4 2.0 3.5 – 2.1 3.1
Labour Market
2.6 Employment reached a low point at the start of 2010, at 28.8 million, having fallen from a peak of 29.6 million in the spring of 2008. The employment level then rose gradually through 2010, but fell during 2011. Since the start of 2012, however, numbers employed have been rising, reaching an all-time high of 29.7 million in the three months to November 2012 (Figure 2.3)4. The employment rate reflected the impact of recession more than the employment level5 and, at 71.4% in November 2012, was not yet back to its pre-recession rate of 73.0% in 2008. Due to rising population levels and higher economic activity, the number of people employed fell by less during the recession than the employment rate.
2.7 Employment grew by 552,000 (1.9%) in the year to November 2012. This included a rise in both full time and part time employment, although the number of full time employees rose by 1.4% (254,000), while the number of part time employees rose by 2.2% (145,000). Self-employment rose by 2.1% (88,000) in the year to November 2012. A feature of the recent recession has been the rise in those working part time because they could not find a full time job: from 690,000 (9% of all part time workers) four years ago to 1.4 million in November 2012 (17.5% of all part time employees)4.
4 ONS (January 2013), Labour Market Statistics. Available at: http://www.ons.gov.uk/ons/dcp171778_292911.pdf.5 The employment level is a count of the number of people aged over 16 in paid work. The employment rate is the
number of people aged 16 to 64 in employment divided by the population aged 16 to 64.

12
Figure 2.3: Total employment, rate and level, 2002 to 2012
Source: Office for National Statistics.
Mill
ion
% o
f w
orki
ng
ag
e p
opul
atio
n
Employment level (all age 16+) RH scale
Employment rate (age 16-64) LH scale
66
68
70
72
74
76
25
26
27
28
29
30
2002 2003 2004 2005 2006 2007 2008 2009 2010 2011 2012
2.8 Figures from the Labour Force Survey (LFS) showed that private sector employment grew by 823,000 in the year to September 2012, while public sector employment fell by 324,000. This included the effects of the reclassification of further education from the public to the private sector from June 2012, reducing public sector employment by 200,000 and increasing private sector employment by the same amount.
2.9 The level of unemployment, measured by the LFS, had been falling since 2011, but by much less than the rise in employment (Figure 2.4). For the three months to November 2012, unemployment was at 2.49 million (7.7%), having fallen by 185,000 on the year. The claimant count measure of unemployment had shown a smaller fall of 40,500 over 2012 (4.9% to 4.8%).

13
Figure 2.4: LFS unemployment and claimant count, 1992 to 2012
Source: Office for National Statistics.
Mill
ion
%
Claimant count (LH scale)
LFS unemployment (LH scale)
LFS unemployment rate (RH Scale)
0.0
0.5
1.0
1.5
2.0
2.5
3.0
3.5
0
2
4
6
8
10
12
14
1992
1993
1994
1995
1996
1997
1998
1999
2000
2001
2002
2003
2004
2005
2006
2007
2008
2009
2010
2011
2012
2.10 Job vacancies (Figure 2.5) fell to a low of 430,000 in June 2009, having previously peaked at 694,000 in March 2008. The number of vacancies measured by ONS increased by 33,000 (7.2%) in 2012, to 494,000 in December 2012 but remained down on the longer term average of around 560,000. This suggested that opportunities for job seekers improved a little in 2012 but remain at relatively low levels.
Figure 2.5: Job vacancies, three-month average, 2007 to 2012
Source: Office for National Statistics.
Thou
san
ds
800
200
300
400
500
600
700
2007 2008 2009 2010 2011 2012
10-year average562,000
2.11 The redundancy level rose dramatically from mid 2008 to the spring of 2009 reaching a peak of 310,000 in the three months to April 2009, a level substantially above any measured previously (the series goes back to 1995). The number of redundancies fell almost as sharply to the beginning of 2011, to 116,000 in the three months to April 2011, with the impact of public sector redundancies seen through the rest of 2011

14
(although other sectors also saw an increase). The level of redundancies fell back during 2012 below its long term average of around 160,000, although the latest figures, for the three months to November 2012, showed a notable increase.
2.12 OBR forecasts published in December 2012 expected ILO unemployment to rise from 7.9% at the end of 2012 to 8.3% by the end of 2013. The OBR then expected unemployment to recover gradually from 2014, falling to 6.9% by the end of 2017. Between 2011 and 2018, the OBR expected a rise in total private sector employment of around 2.4 million, partly offset by a reduction in general government employment of around 1.1 million.
Average Earnings Growth and Pay Settlements
2.13 Average earnings growth was low throughout 2012 and below the rate of inflation (Figure 2.6). In the three months to November 2012, annual earnings growth was 1.4% in the private sector and 2.2% in the public sector (excluding financial services). Earnings growth in the public sector was pushed up by the reclassification of further education from the public to the private sector from June 2012. Because further education is relatively low paid on average, compared to the rest of the public sector, this led to an increase in the level of average earnings in the public sector and a concomitant increase in earnings growth that will persist for 12 months6.
Figure 2.6: Average weekly earnings (total pay), three-month average, 2007 to 2012
Source: Office for National Statistics.
% a
nn
ual g
row
th
8
-6
-2
0
2
4
6
Whole economyPrivate sector
Public sector ex financial servicesPublic sector
2007 2008 2009 2010 2011 2012
-4
2.14 OBR forecasts were for whole economy nominal wages to grow by around 2.2% in 2013, rising gradually over the course of 2014 and 2015 before reaching 4.0% in 2016. Annual real wage growth (adjusted for inflation) was expected to remain weak in 2013, before gradually picking up in 2014 and settling at around 2% by 2016. The HM Treasury’s latest average of independent forecasts at January 2013 expected average earnings growth of 2.1% in 2013.
6 ONS estimated that, if the reclassification had not occurred, the public sector single month growth rates from June 2012 would be between 0.6 and 0.8 percentage points lower and the corresponding private sector growth rates would be between 0.1 and 0.2 percentage points higher.

15
2.15 The median pay settlement was 2.5% in 2012, on IDS’s figures, the same as in 2011 (see Figure 2.7). A number of pay deals linked to autumn 2011’s high inflation rate pushed the median up to 3% at the start of 2012, but falling inflation and an absence of recruitment and retention pressures brought the median to 2% at the end of the 2012. Pay settlement medians have been below inflation for three years. One in ten of IDS’s 2012 private sector reviews were pay freezes, a similar proportion to 2011.
Figure 2.7: Pay settlements, 2008 to 2012 (three-month average)
Sources: Incomes Data Services, Office for National Statistics.
%
6
-2
-1
0
1
2
3
4
5
Jan-0
8
Apr-0
8Ju
l-08
Oct-08
Jan-0
9
Apr-0
9Ju
l-09
Oct-09
Jan-1
0
Apr-1
0Ju
l-10
Oct-10
Jan-1
1
Apr-1
1Ju
l-11
Oct-11
Jan-1
2
Apr-1
2Ju
l-12
Oct-12
Median RPI inflationUpper and lower quartiles
2.16 An Incomes Data Services (IDS) survey conducted in September 20127 suggested that most organisations (67%) were looking to award pay increases in 2013 at the same level as those made in 2012 (when the median increase was 2.5%). The proportion of organisations intending to pay higher awards had fallen from 32% in 2011 to 18%, while the proportion intending to pay lower rises was up slightly to 15%. An October 2012 survey by XpertHR8 also reported that the median private sector pay award would be 2.5% in 2013. Pay awards were expected to be tightly bunched, with seven in ten awards in the next year likely to be worth between 2% and 3%. Manufacturing and production companies were forecasting a higher increase (3.0%) than service sector companies (2.4%). Pay freezes were predicted to account for less than 10% of awards.
2.17 The Chartered Institute of Personnel and Development’s (CIPD) Labour Market Outlook in November 2012 reported that the expected mean basic pay settlement, among those employers that were planning a pay review in next 12 months, was 1.7%. This was 2.6% in the private sector and 0.6% in the public sector.
2.18 In our Market-Facing Pay Report9, we summarised recent research into estimated public-private sector pay differentials. From that research, we concluded that such differentials were dynamic and varied significantly over time. We noted that there were risks in choosing data based on a short period on which to base major public policy, that the results were sensitive to the methodology, and that the differential was forecast to be eroded by 2015, as indicated by IFS, although some regional variations might remain.
7 IDS Pay Report 1015, October 2012.8 XpertHR, Annual Review of Pay Prospects 2013.9 NHSPRB (2012), Market-Facing Pay: How Agenda for Change pay can be made more appropriate to local labour markets,
TSO (Cm 8501), paragraphs 2.8-2.22.

16
We also highlighted that such estimates have a number of limitations including: sampling error; sensitivity to the choice of model and dataset (e.g. the LFS and ASHE); regional and sub-regional estimates being subject to wider margins of error; pay and non-pay benefits not being captured fully by the surveys; and other factors across various workforces. Some new research10 on public-private sector pay differentials has emerged since we submitted our report in July 2012.
2.19 In November 2012, the Office for National Statistics (ONS) published new analysis11 of the public-private sector pay differential using the 2011 Annual Survey of Hours and Earnings expanding on its earlier work12 which found that, allowing for differences in job and employee characteristics, public sector employees were paid on average between 7.7% and 8.7% more than private sector employees. This new analysis took into account organisational size (which ONS had not included in its earlier estimates and an important factor we highlighted in our Market-Facing Pay Report13) because large organisations tend to pay more on average than small organisations and public sector employees tend to be concentrated in large organisations with at least 500 employees, whereas private sector employees tend to be more evenly split between large and small organisations. ONS also sought to include a better reflection of the proportions of bonus payments paid in each industry over the course of a year. However, ONS could not include adjustment for differences in employee qualifications while including organisation size. The ONS analysis suggested that in 2011:
• Using raw, unadjusted ASHE data on mean gross hourly earnings (excluding overtime), the public sector earned 14.9% more than the private sector;
• Taking into account differences between the sectors in gender, age, occupation, region that the job is located in, full time/part time, permanent/temporary, job tenure plus an adjustment to reflect bonus payments, the public sector earned 7.3% more per hour (excluding overtime) than the private sector;
• Additionally taking into account organisation size resulted in an estimated differential in favour of the public sector of 2.2% on average. At the 5th percentile (i.e. the bottom end of the pay distribution) public sector employees earned 11.2% more than private sector employees, but at the 95th percentile (i.e. the top end of the pay distribution) public sector workers earned 10.3% less than private sector workers. In London, at the 5th percentile the public sector earned 16.3% more than the private sector, but at the 95th percentile the differential was 29% in favour of the private sector.
2.20 In January 2013, Blackaby et al14 published updated analysis of public-private sector wage differentials using new data from the Labour Force Survey. They divided the data into two time periods, the first (2009/10) covering the first quarter 2009 to the fourth quarter 2010 and the second (2011/12) covering the first quarter 2011 to the third quarter 2012. Their preliminary results showed that:
• In a fairly basic wage specification, after controlling for factors such as age and age left full time education, the hourly wage premium for public sector workers in 2011/12 was 7.8% for men and 15.6% for women;
10 In addition, the Institute for Fiscal Studies published its Green Budget in February 2013 after we had concluded our deliberations for this report. Available at: http://www.ifs.org.uk/publications/6562.
11 ONS (November 2012), Estimating differences in public and private sector pay at the national and regional level. Available at: http://www.ons.gov.uk/ons/dcp171776_288081.pdf.
12 ONS (March 2012), Estimating Differences in Public and Private Sector Pay, 2012. Available at: http://www.ons.gov.uk/ons/dcp171776_261716.pdf.
13 NHSPRB (2012), Market-Facing Pay: How Agenda for Change pay can be made more appropriate to local labour markets, TSO (Cm 8501), paragraph 2.13.
14 Blackaby D.H, Murphy P.D, O’Leary N.C, and Staneva A.V (January 2013), Public-private sector pay differentials in the UK: a recent update; preliminary work, Swansea University, Discussion Paper No. 2013-01.
17
• As with their previous work, there is a reduction in the public sector differential after controlling more fully for a range of additional characteristics15 such as age, qualification, region, plant size, and whether an individual was working part time or full time. Using a regression model to account for these, they estimated that men in the public sector earned 3.7% below their peers in the private sector in 2009/10 and this difference had become insignificant in 2011/12. The differential between the two periods for women was reduced in size from 5.9% to 3.5% but remained positive;
• Comparing how the wage differential varies across the earnings distribution over the two time periods and taking into account the full range of control variables, the pay disadvantage for men in the public sector at the top of the earnings distribution (90th percentile) changed from 12.2% in 2009/10 to 8.8% in 2011/12. However, the pay premium at the bottom of the distribution (10th percentile) increased from 3.7% in 2009/10 to 6% in 2011/12. For women over the same period the pay premium decreased for those at the bottom of the pay distribution i.e. the 10th percentile (from 12.1% to 9.7%) and for those at the median (from 6.3% to 4.5%). However, the differential was found to be not significant at the 90th percentile for each period.
Evidence from the Parties
Department of Health
2.21 The Department of Health stated that the UK was among the hardest hit by the financial crisis of 2008 and 2009. The OBR estimated that by 2016, the economy will be 11% smaller than it would have been had the pre-crisis trend continued. The OBR expected GDP growth to build gradually in 2012 and 2013 but that the recovery would only gather pace in 2014 as tensions in the financial markets eased and the banking sector returned to strength.
2.22 The Department commented that, despite the difficult current conditions, inflation had more than halved since its peak in September 2011. In the third quarter of 2012, falling energy prices and broader-based weakness in price pressures caused inflation to fall faster than the OBR forecast in March 2012. The Bank of England’s August 2012 Inflation Report forecast inflation to be below the 2.0% target for a large part of the period to 2015.
2.23 The UK Government’s evidence noted that, having worsened in the second half of 2011, headline labour indicators had been more positive since the beginning of 2012. The level of employment increased in the first half of 2012 and, having reached 8.4% in the final quarter of 2011, ILO unemployment fell to 7.9% in the three months to August 2012. There had been a large shift towards part time employment. In the UK Government’s view, many labour market indicators had a long way to go to recover to their pre-recession conditions and some indicators (such as the level of vacancies and subdued average earnings growth) suggested that underlying labour demand remained tentative. There was still some uncertainty surrounding the labour market outlook which was likely to be impacted by the outlook for growth. Recruitment potential had remained strong in the economy as a whole, reducing some of the upward pressure on pay.
Employer Bodies
2.24 NHS Employers (NHSE) considered that the trend in pay levels across the UK workforce in recent years might be significant; since 2008, private sector pay levels had fallen behind the public sector – although it appeared that this gap was closing as the private
15 The full specification controls for age, age left full time education, qualification, job tenure, married, managerial responsibilities, plant size, part time, ethnicity, region of work and occupation.

18
sector recovered and public sector pay restraint continued. Comparisons between public sector earnings and private sector earnings might not be very useful in relation to health professionals, as the characteristics of these two workforces could be very different.
Devolved Administrations
2.25 The Scottish Government Health and Social Care Directorates (SGHSCD) stated that the recovery in Scotland remained fragile with GDP contracting by 0.4% in Q2 2012. That was the third consecutive quarter of contraction indicating that Scotland had re-entered recession. The SGHSCD reported that the Scottish economy was predicted to experience a modest recovery in the coming years. Independent forecasts predicted Scottish GDP growth of around 0.3% in 2012. However, significant uncertainty surrounded these forecasts as the strength of the recovery in Scotland would be heavily dependent on conditions in the global economy, the stability of the euro area, and developments in the UK economy as a whole.
2.26 The decline in Scottish output during the recession led to a sharp deterioration in the Scottish labour market. After some months of improvement, labour market data had shown some weakening returning. Over the three-month period June-August 2012, Scottish unemployment increased by 7,000, resulting in a rise in the unemployment rate to 8.2%, 0.3 percentage points higher than the UK rate. In September 2012, the claimant count in Scotland fell by 1,300 to 139,900, with the rate unchanged at 5.1%. In addition, the Bank of Scotland Barometer for September 2012 reported the 23rd consecutive month of improvement in labour market conditions in Scotland.
2.27 The Department of Health, Social Services and Public Safety (DHSSPSNI) stated that the global economic downturn continued to have a severe impact on the Northern Ireland labour market. The decline in private sector business activity, persistent economic inactivity and increases in claimant count unemployment were causes for concern.
Staff Bodies
2.28 The Staff Side noted that the private sector had shown signs that it was beginning to pick up, with both employment and pay awards starting to recover.
2.29 The Staff Side and UNISON stated that NHS pay had been consistently outstripped by rising prices over the last four years. The HM Treasury average of independent forecasts for the remainder of 2012 suggested that inflation measures would fall a little further, with RPI hitting an average of 2.6% and CPI running around the 2.1% mark16. Looking further ahead to 2013, inflation was expected to stabilise, with RPI at 2.5% and CPI at 2% by the fourth quarter.
2.30 The Staff Side and UNISON noted that, since April 2010 when public and private pay settlement growth was equal at 1%, median public sector pay settlements had dropped to 0% while private sector settlements had climbed to 2.5%. This deterioration in the competitive position of public sector pay rates was likely to continue given forecasts of private sector pay settlements that predicted the private sector rate would grow at 2.5% over the coming year17.
2.31 The Staff Side considered that average earnings had been growing faster in the private sector than the public sector during 10 of the last 14 months. Forecasts of average earnings predicted that average earnings growth for 2012 would stand at 1.7% (above the current 0.6% earnings growth rate in the health and social care sector) and expand
16 HM Treasury (September 2012), Forecasts for the UK Economy. Available at: http://www.hm-treasury.gov.uk/d/201209forcomp.pdf.
17 Private sector pay forecasts for 2012: the XpertHR survey.
19
to 2.4% in 201318. When earnings of key NHS occupational groups in England were compared by the Staff Side against the public sector average, they concluded that over the last three years most occupational groups had lagged behind the public sector average.
2.32 The Staff Side noted that the backdrop of chief executive pay within the NHS and the wider economy would have a potential impact on staff perceptions of fairness and consequently morale. In 2011, when the majority of NHS staff were still enduring a pay freeze, NHS chief executives on median salaries in the £156,000 range saw their salary rise by 1.6%19. In Scotland and Northern Ireland, average rises were 1.7% and 2.1% respectively.
2.33 The Staff Side highlighted that the principal negative factor bearing on household incomes in 2012/13 was the CPI linking of most benefits and tax credits. 2013 would also see the major impact deriving from withdrawal of child benefit from families containing a higher rate income taxpayer. Households with children were set to lose about 1.4% of their net income as a result of the 2012/13 tax and benefit reforms, which meant a net loss of £530 a year20.
2.34 Unite felt that public sector employees were going through an assault on their terms and conditions. Unite members in health were reporting “Greek style” cuts to terms and conditions of up to 30% of pay.
2.35 Northern Ireland Public Service Alliance (NIPSA) highlighted that in recent years pay increases had not kept pace with inflation with the RPI running above 5% through almost the entirety of 2011. During 2012, inflation had gone through a steady decline. However, the huge gap between the public pay awards and the rate of increase in the cost of living that opened up during 2010 had been sustained over the last year.
Earnings of Our Remit Group
Median Earnings
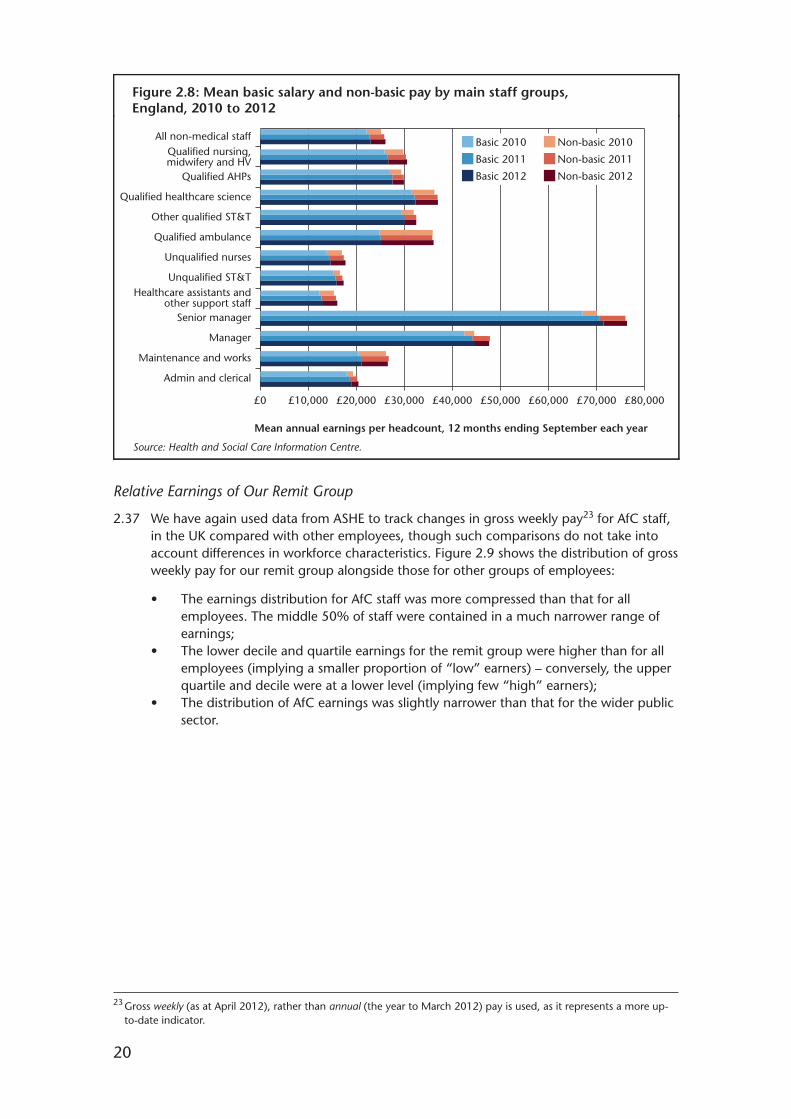
2.36 Figure 2.8 shows changes in mean annual basic salary21 and non-basic pay22 per headcount in England by AfC staff group between 2010 and 2012:
• Healthcare assistants (HCAs) and other support staff, and unqualified nurses, had the largest increases in mean annual basic salary for the 12 months ending September 2012 (2.3% and 2.2% respectively);
• Unqualified nurses had the largest increase in mean annual total earnings (2.1%). Managers and maintenance and works staff had decreases in mean annual total earnings.
18 HM Treasury (August 2012), Forecasts for the UK Economy. Available at: http://www.hm-treasury.gov.uk/d/201208forcomp.pdf.
19 IDS (February 2012), NHS Boardroom Pay Report 2012.20 Institute for Fiscal Studies (March 2012), Tax and Benefit Reforms due in 2012-13 and the Outlook for Household
Incomes.21 Basic salary is an individual’s Agenda for Change spine point.22 Total earnings include: hours-related pay, such as on-call, shift working and overtime; location payments such as
location allowances and other local payments; recruitment and retention premia; and ”other” payments such as occupational absence and protected pay.
20
Figure 2.8: Mean basic salary and non-basic pay by main staff groups, England, 2010 to 2012
Source: Health and Social Care Information Centre.
Mean annual earnings per headcount, 12 months ending September each year
All non-medical staffQualified nursing,midwifery and HV
Qualified AHPs
Qualified healthcare science
Other qualified ST&T
Qualified ambulance
Unqualified nurses
Unqualified ST&THealthcare assistants and
other support staffSenior manager
Manager
Maintenance and works
Admin and clerical
£0 £10,000 £20,000 £30,000 £40,000 £50,000 £60,000 £70,000 £80,000
Basic 2012
Basic 2011
Basic 2010
Non-basic 2012
Non-basic 2011
Non-basic 2010
Relative Earnings of Our Remit Group
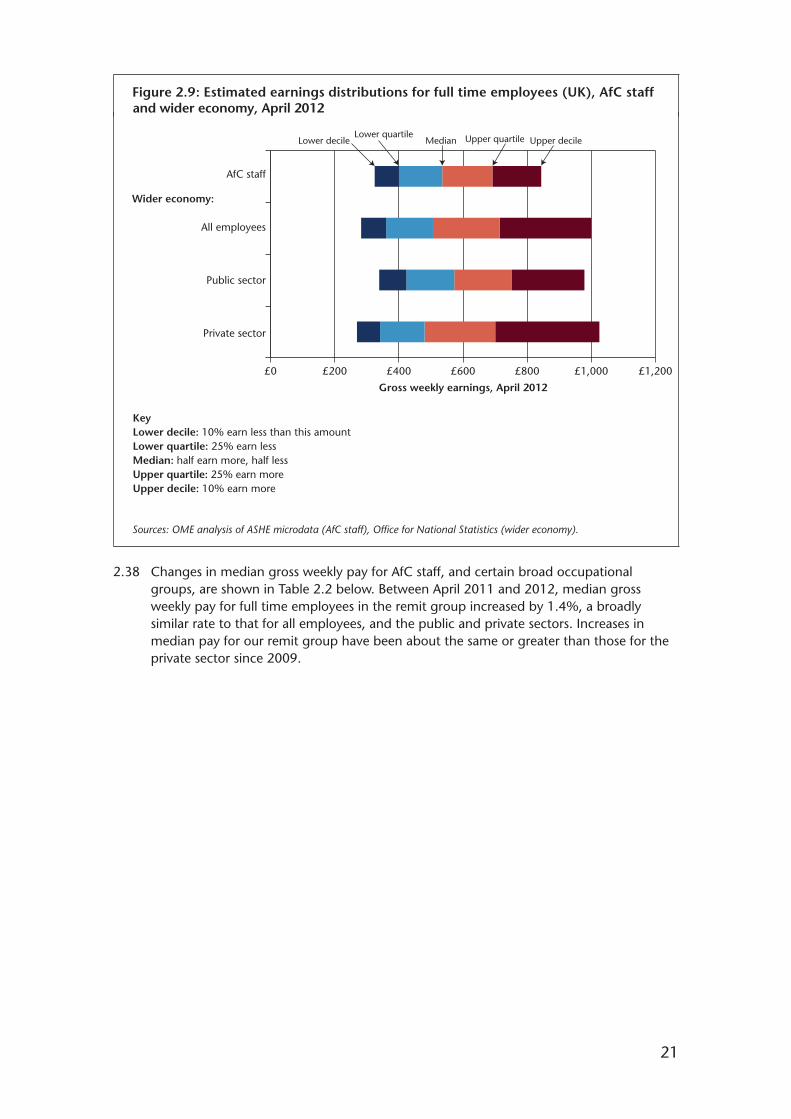
2.37 We have again used data from ASHE to track changes in gross weekly pay23 for AfC staff, in the UK compared with other employees, though such comparisons do not take into account differences in workforce characteristics. Figure 2.9 shows the distribution of gross weekly pay for our remit group alongside those for other groups of employees:
• The earnings distribution for AfC staff was more compressed than that for all employees. The middle 50% of staff were contained in a much narrower range of earnings;
• The lower decile and quartile earnings for the remit group were higher than for all employees (implying a smaller proportion of “low” earners) – conversely, the upper quartile and decile were at a lower level (implying few “high” earners);
• The distribution of AfC earnings was slightly narrower than that for the wider public sector.
23 Gross weekly (as at April 2012), rather than annual (the year to March 2012) pay is used, as it represents a more up-to-date indicator.
21
Upper decileLower decile MedianLower quartile
Figure 2.9: Estimated earnings distributions for full time employees (UK), AfC staffand wider economy, April 2012
Gross weekly earnings, April 2012
Sources: OME analysis of ASHE microdata (AfC staff), Office for National Statistics (wider economy).
Upper quartile
£0 £200 £400 £600 £800 £1,000 £1,200
AfC staff
All employees
Public sector
Private sector
Wider economy:
KeyLower decile: 10% earn less than this amountLower quartile: 25% earn lessMedian: half earn more, half lessUpper quartile: 25% earn moreUpper decile: 10% earn more
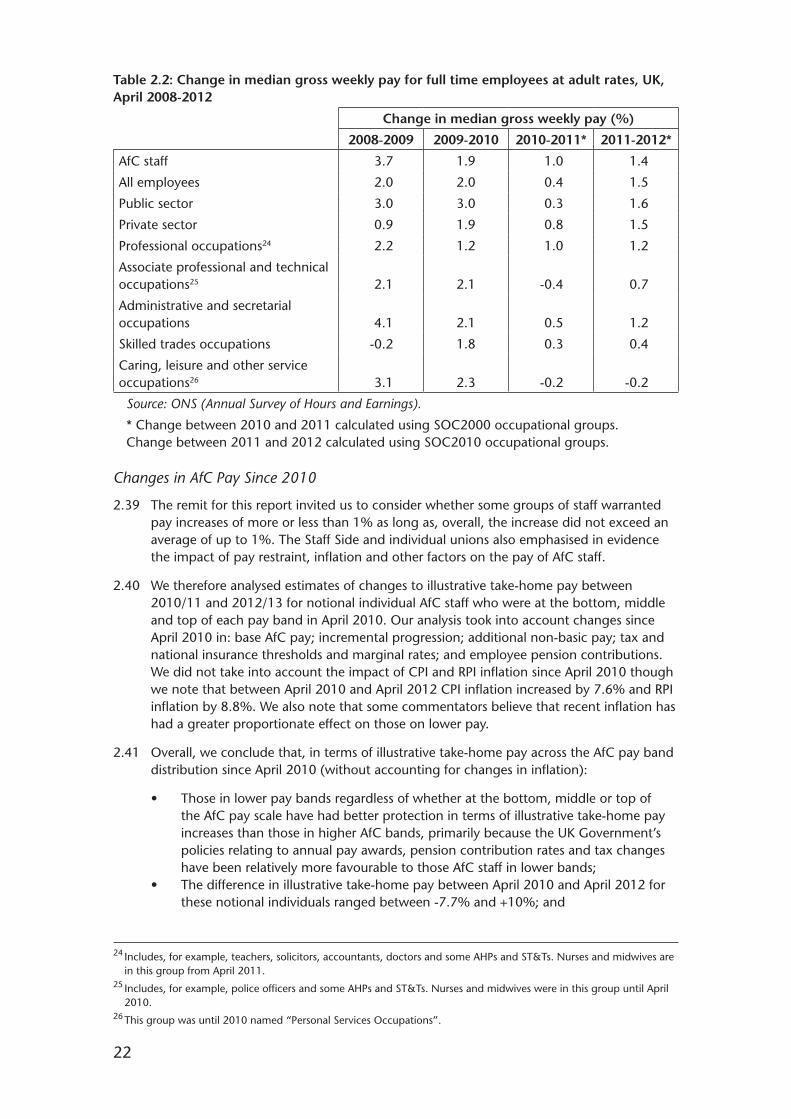
2.38 Changes in median gross weekly pay for AfC staff, and certain broad occupational groups, are shown in Table 2.2 below. Between April 2011 and 2012, median gross weekly pay for full time employees in the remit group increased by 1.4%, a broadly similar rate to that for all employees, and the public and private sectors. Increases in median pay for our remit group have been about the same or greater than those for the private sector since 2009.
22
Table 2.2: Change in median gross weekly pay for full time employees at adult rates, UK, April 2008-2012242526
Change in median gross weekly pay (%)
2008-2009 2009-2010 2010-2011* 2011-2012*
AfC staff 3.7 1.9 1.0 1.4
All employees 2.0 2.0 0.4 1.5
Public sector 3.0 3.0 0.3 1.6
Private sector 0.9 1.9 0.8 1.5
Professional occupations24 2.2 1.2 1.0 1.2
Associate professional and technical occupations25 2.1 2.1 -0.4 0.7
Administrative and secretarial occupations 4.1 2.1 0.5 1.2
Skilled trades occupations -0.2 1.8 0.3 0.4
Caring, leisure and other service occupations26 3.1 2.3 -0.2 -0.2
Source: ONS (Annual Survey of Hours and Earnings).
* Change between 2010 and 2011 calculated using SOC2000 occupational groups. Change between 2011 and 2012 calculated using SOC2010 occupational groups.
Changes in AfC Pay Since 2010
2.39 The remit for this report invited us to consider whether some groups of staff warranted pay increases of more or less than 1% as long as, overall, the increase did not exceed an average of up to 1%. The Staff Side and individual unions also emphasised in evidence the impact of pay restraint, inflation and other factors on the pay of AfC staff.
2.40 We therefore analysed estimates of changes to illustrative take-home pay between 2010/11 and 2012/13 for notional individual AfC staff who were at the bottom, middle and top of each pay band in April 2010. Our analysis took into account changes since April 2010 in: base AfC pay; incremental progression; additional non-basic pay; tax and national insurance thresholds and marginal rates; and employee pension contributions. We did not take into account the impact of CPI and RPI inflation since April 2010 though we note that between April 2010 and April 2012 CPI inflation increased by 7.6% and RPI inflation by 8.8%. We also note that some commentators believe that recent inflation has had a greater proportionate effect on those on lower pay.
2.41 Overall, we conclude that, in terms of illustrative take-home pay across the AfC pay band distribution since April 2010 (without accounting for changes in inflation):
• Those in lower pay bands regardless of whether at the bottom, middle or top of the AfC pay scale have had better protection in terms of illustrative take-home pay increases than those in higher AfC bands, primarily because the UK Government’s policies relating to annual pay awards, pension contribution rates and tax changes have been relatively more favourable to those AfC staff in lower bands;
• The difference in illustrative take-home pay between April 2010 and April 2012 for these notional individuals ranged between -7.7% and +10%; and
24 Includes, for example, teachers, solicitors, accountants, doctors and some AHPs and ST&Ts. Nurses and midwives are in this group from April 2011.
25 Includes, for example, police officers and some AHPs and ST&Ts. Nurses and midwives were in this group until April 2010.
26 This group was until 2010 named “Personal Services Occupations”.

23
• Our analysis suggests that the greatest relative reductions in illustrative take-home pay across the AfC pay band distribution have been for those at the top of higher pay bands.
2.42 We comment in Chapter 5 on how this analysis influences our conclusions on the overall recommended pay uplift and the Staff Side’s cases presented for pay differentiation for lower paid AfC staff including comparisons with inflation, the Minimum Income Standard and the Living Wage.
Membership of the NHS Pension Scheme
2.43 NHS Employers provided estimates of the percentage of non-medical staff in England who were members of the NHS Pension Scheme. Figure 2.10 shows that, overall, 84% of staff contributed to the scheme in 2012, unchanged on the 2011 figure27. The percentage of staff contributing to the scheme tended to increase with AfC bands.
Figure 2.10: Estimated pension membership rate by AfC Band, England, September2009-2012
Source: NHSE.
2009 2010 2011 2012
AfC Band
Perc
enta
ge
of h
ead
coun
t st
aff
in B
and
1 2 3 4 5 6 7 8a 8b 8c 8d 9 Total0%
10%
20%
30%
40%
50%
60%
70%
80%
90%
100%
Our Comment
2.44 We note that, while there have been some signs of economic recovery during 2012, the latest figures indicate that economic growth was flat during 2012 and forecasts suggest it will be sluggish in the near term and that economic recovery will be slow for the next three years. Against this background, the labour market is beginning to show some positive signs with numbers employed increasing particularly for those working part time. However, there are continuing signs of weak demand too: as many of those working part time do so because they could not find a full time job; unemployment has fallen but is expected to rise slightly peaking at the end of 2013; and the number of vacancies remains stable, but at relatively low levels, across the economy.
27 In our Twenty-Sixth Report, we included similar data provided by the Department of Health which suggested that 86% of staff were scheme members in 2010. NHS Employers have used a different method for 2011 and have provided figures for 2009 and 2010 on the same basis for comparison purposes.
24
2.45 Turning to pay, we note the modest growth in average earnings with private sector growth held down by lower bonus payments and public sector growth pushed up by the reclassification of further education from the public to the private sector. Forecasts point to weak growth in annual real wages in 2013. Pay settlements also reflect the economy with median settlements falling to 2% in 2012 with the public sector at zero. We also note the latest ONS analysis on public-private sector pay differentials which suggests the differential is 2.2% in 2011 when taking into account organisation size. Our Market-Facing Pay Report commented that such differentials were dynamic, varied over time, were sensitive to the methodology used and could be eroded by 2015 though some regional differences might remain.
2.46 In the context of the economy and labour market, we continue to recognise the Staff Side’s arguments that inflation rates have reduced real wages for AfC staff. The effect on real terms wages has been felt across the public and private sector and not uniquely in the NHS.
2.47 Our assessment suggests that labour market indicators and pay settlements generally are not currently putting pressure on AfC pay. Nonetheless, we need to ensure that the NHS remains a competitive employer as and when the labour market picks up. Employers need to be sensitive to levels of staff motivation and engagement at a time of significant change. It is not clear from current forecasts when or to what extent the labour market will pick up. When it does, the NHS needs to be ready to respond quickly to ensure continued recruitment and retention of the quality of staff needed to deliver both quality of care to patients and the major changes required across the NHS.
25
Chapter 3 – Recruitment, Retention and Motivation
Introduction
3.1 This chapter includes the parties’ evidence and our analysis of the recruitment and retention position of our remit group, including: shortage occupations; recruitment and retention premia (RRP); workforce planning; training and development; appraisal and the Knowledge and Skills Framework (KSF); and staff engagement.
NHS Workforce, Vacancies and Turnover
Changes in Staffing Levels
3.2 Figure 3.1 and Table 3.1 show recent changes in the non-medical NHS workforce:
• The Full Time Equivalent (FTE) non-medical NHS workforce decreased by 2.2% (26,200 FTE) between September 2010 and September 2011, to a total of 1.17 million FTE (1.36 million headcount);
• The non-medical workforce decreased in all four UK countries between September 2010 and September 2011: in England by 2.2%; Scotland, 3.4%; Wales, 1.2%; and Northern Ireland, 0.6%;
• At UK level, there were decreases across all broad staff groups. The largest percentage decrease was observed for administrative, estates and management staff (5.1%), and the smallest decrease was observed for professional, technical and social care staff (0.1%);
• Since September 2011, the total FTE workforce has decreased in England1 by a further 0.3%, but has increased by 0.4% in Scotland2 and by 2.1% in Northern Ireland3.
1 HSCIC (2013), Provisional NHS HCHS Monthly Workforce Statistics in England, October 2012.2 ISD Scotland (2012), NHSScotland Workforce Statistics, September 2012. There has been a large increase in the number
of “other” staff in Scotland, because of the transfer of 1,062 FTE staff from The Highland Council to NHS Highland in June 2012. The total workforce excluding these staff decreased by 0.5% between September 2011 and September 2012.
3 DHSSPSNI (2012), Key Facts Workforce Bulletin, Quarter Ending September 2012.
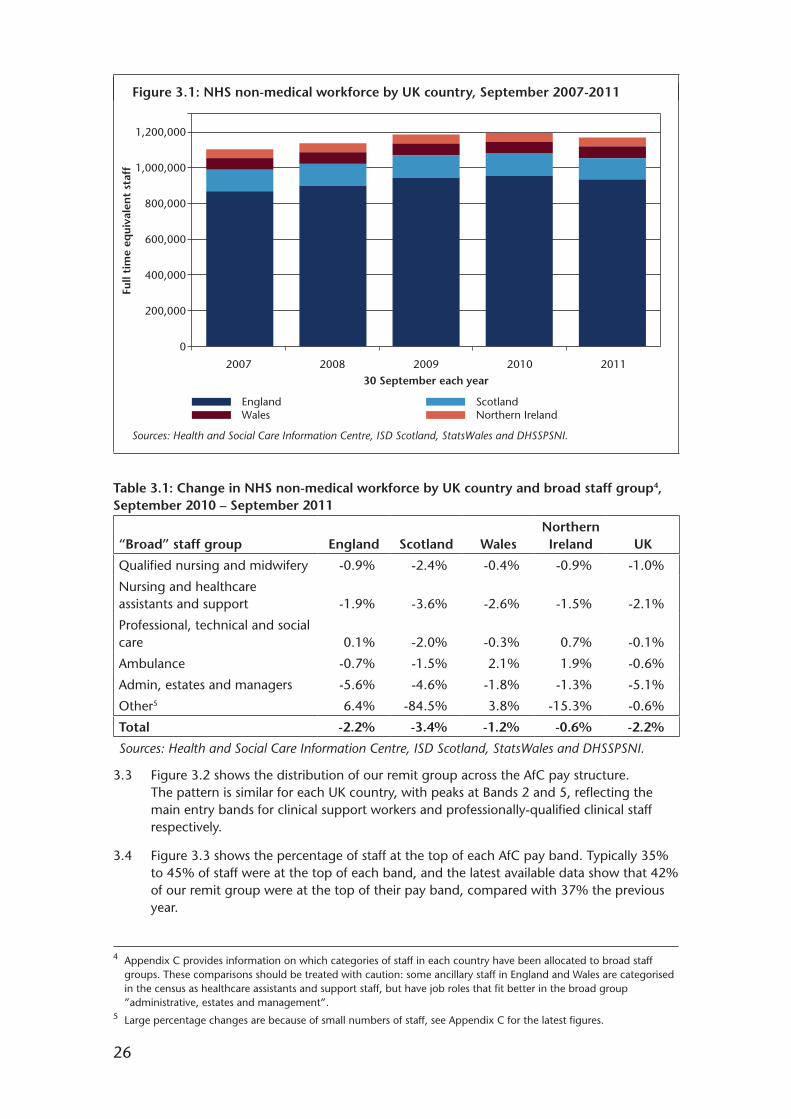
26
Figure 3.1: NHS non-medical workforce by UK country, September 2007-2011
Sources: Health and Social Care Information Centre, ISD Scotland, StatsWales and DHSSPSNI.
Full
tim
e eq
uiva
len
t st
aff
30 September each year
1,200,000
1,000,000
800,000
600,000
400,000
200,000
0
2007 2008 2009 2010 2011
Wales Northern IrelandEngland Scotland
Table 3.1: Change in NHS non-medical workforce by UK country and broad staff group4, September 2010 – September 2011
Northern “Broad” staff group England Scotland Wales Ireland UK
Qualified nursing and midwifery -0.9% -2.4% -0.4% -0.9% -1.0%
Nursing and healthcare assistants and support -1.9% -3.6% -2.6% -1.5% -2.1%
Professional, technical and social care 0.1% -2.0% -0.3% 0.7% -0.1%
Ambulance -0.7% -1.5% 2.1% 1.9% -0.6%
Admin, estates and managers -5.6% -4.6% -1.8% -1.3% -5.1%
Other5 6.4% -84.5% 3.8% -15.3% -0.6%
Total -2.2% -3.4% -1.2% -0.6% -2.2%
Sources: Health and Social Care Information Centre, ISD Scotland, StatsWales and DHSSPSNI.
3.3 Figure 3.2 shows the distribution of our remit group across the AfC pay structure. The pattern is similar for each UK country, with peaks at Bands 2 and 5, reflecting the main entry bands for clinical support workers and professionally-qualified clinical staff respectively.
3.4 Figure 3.3 shows the percentage of staff at the top of each AfC pay band. Typically 35% to 45% of staff were at the top of each band, and the latest available data show that 42% of our remit group were at the top of their pay band, compared with 37% the previous year.
4 Appendix C provides information on which categories of staff in each country have been allocated to broad staff groups. These comparisons should be treated with caution: some ancillary staff in England and Wales are categorised in the census as healthcare assistants and support staff, but have job roles that fit better in the broad group ”administrative, estates and management”.
5 Large percentage changes are because of small numbers of staff, see Appendix C for the latest figures.

27
Figure 3.2: Distribution of FTE staff on Agenda for Change pay bands by UK country, latest available data*
Source: Health Departments.* Data for England relate to September 2011; Scotland, 2011/12 average; Wales, April 2012; Northern Ireland, June 2012.
30%
25%
20%
15%
10%
5%
0%
Band1
Band2
Band3
Band4
Band5
Band6
Band7
Band8a
Band8b
Band8c
Band8d
Band9
England ScotlandWales Northern IrelandUnited Kingdom
Figure 3.3: Percentage of AfC staff at the top of pay bands by UK country, latest available data*
Source: Health Departments.* Data for England relate to September 2011; Scotland, 2011/12 average; Wales, April 2012; Northern Ireland, June 2012.
Band1
Band2
Band3
Band4
Band5
Band6
Band7
Band8a
Band8b
Band8c
Band8d
Band9
Total
England ScotlandWales Northern IrelandUnited Kingdom
0%
10%
20%
30%
40%
50%
60%
70%
80%
90%
100%

28
Vacancy Rates
3.5 Vacancy statistics relating to our remit group are currently only produced for Scotland and Northern Ireland. In Scotland in June 2012, the total vacancy rate for nursing staff in AfC Bands 5-9 was 1.7%, and for Bands 1-4 was 1.9%. Three-month vacancy rates for these groups were 0.3% and 0.4% respectively, and three-month and total vacancy rates had all increased since June 2011. Total and three-month vacancy rates for Allied Health Professionals (AHPs) were higher, at 3.2% and 0.8% respectively.
3.6 In Northern Ireland in March 2012, the total vacancy rate for our remit group as a whole was 2.6%, compared with 2.0% a year earlier, and the three-month vacancy rate increased from 0.6% to 1.0% over the same period.
Turnover
3.7 Leaving rates in England for the year ending June 2012 were 8.0%6, with joining rates lower at 6.8%, reflecting the recent decrease in the size of the workforce. In Scotland, leaving and joining rates were 7.1% and 5.3% respectively in the year ending March 2012, and in Northern Ireland over the same period, the joining rate (4.7%) slightly exceeded the leaving rate (4.3%). In all countries, leaving rates tended to be highest for administrative staff, managers and other support staff, and lowest for qualified nurses and AHPs.
Evidence from the Parties
3.8 In preparing their written evidence to us, the parties have drawn on the same data sources that we have highlighted above, as well as their own research. We summarise below the key conclusions the parties have drawn from these data.
Department of Health
3.9 The Department of Health noted that during 2000 to 2010 the NHS had expanded rapidly with a 27% increase in Hospital and Community Health Service (HCHS) staff, but there had been a decline in productivity of just over 1% between 2000 and 2009, a position the Department considered unsustainable given the difficult financial position. Since the economic crisis of 2008/09, the outlook for the workforce had changed significantly, with a focus on rebalancing the workforce to improve efficiency and protect services, which had resulted in a number of changes in the shape of the workforce including a reduction of 2.2% in HCHS staff between 2010 and 2011, but an overall increase in professionally qualified clinical staff (including doctors).
3.10 The Department of Health had led the Fundamental Review of Data Returns and was due to publish its response in March 2013. The Health and Social Care Information Centre (HSCIC) had proposed, in collaboration with the Department, that existing vacancy surveys should be stopped given concerns about their reliability. Subject to the outcome of the Review, it was expected that vacancy surveys would end and the Review would offer a steer about how vacancy data could be improved to offer better support to workforce planning by providing a better balance of information at national and local level. In particular, the HSCIC continued to investigate using the new NHS Jobs website to provide some substitute figures on vacancies, and would aim to source the vacancy information from this new administrative system which was due to be implemented in December 2012 and launched in 2013, with vacancy information available shortly afterwards. This was expected to allow NHS vacancy figures to be collected for 2013.
6 Including medical and dental staff but excluding bank staff, trainee doctors and locums.
29
Employer Bodies
3.11 NHSE said that there had been an overall decrease in the size of the AfC workforce between 2010 and 2011, specifically for qualified nursing staff; support to clinical staff; and NHS infrastructure support. The numbers of senior managers and managers had decreased by 8.9% and 8.6% between September 2010 and September 2011. There had been increases for qualified scientific, therapeutic and technical staff, and qualified ambulance staff. Overall, the non-medical workforce was smaller at the end of each quarter of 2012 than it had been in 2011.
3.12 NHSE, using data from the current NHS Jobs website, commented that the number of vacancies had been relatively stable over the period January 2010 to August 2012, with a small increase in recent months. The number of applications per vacancy had also remained relatively stable. In NHSE’s view, multiple applications per vacancy were reflective of the high unemployment and reduced job vacancies across the economy.
3.13 NHSE commented that, as at March 2012, both the three-month joining and leaving rate stood at around 2%. As turnover was low, increasing numbers of staff had reached the top of their band, which resulted in an increased pay bill for employers.
Devolved Administrations
3.14 The Health Departments in Scotland and Wales described the decreases in the size of our remit group between 2010 and 2011, as shown in the data presented in Figure 3.1.
3.15 The SGHSCD told us that nursing and midwifery vacancies in Scotland at June 2012 were slightly higher than the previous year (1.7%, compared with 1%) but this still represented a historically low level. The majority of vacancies had lasted for less than three months, and the long term vacancy rate was at 0.3% in June 2012, unchanged since June 2011. The vacancy rate for AHPs in Scotland was 3.2% in June 2012, an increase of 1.7% from June 2011.
3.16 The SGHSCD said there had been a downward trend in turnover in Scotland over the last five years. The gross figure (including movement between NHS Boards) had decreased steadily from a high of 11.8% in 2007/08 to 8.5% in 2011/12, while the net rate (excluding inter-Board movement) had decreased from 9.2% to 7.1% over the same period.
3.17 The Welsh Government (WG) told us that the turnover trend in Wales had continued at a low rate of 5.9% during the financial year 2011/12. The WG said that turnover would remain low during 2012/13, projected at 4.6%.
3.18 The DHSSPSNI told us that there had been an increase of 1.3% in WTE staff in Northern Ireland between March 2011 and March 2012 but only a 0.5% increase in headcount. The increase in WTE staff resulted from the transfer of former civil servants to Health and Social Care (HSC) organisations. More recently, Prison Healthcare staff had also transferred to the South Eastern HSC Trust after March 2012. The DHSSPSNI considered that staff turnover rates in Northern Ireland remained at an “acceptable” level.
Staff Bodies
3.19 The Staff Side and individual unions also commented on the reductions in the non-medical workforce. The Staff Side told us that Freedom of Information requests from the TUC to NHS Employers in early 2011 suggested that employers had planned job cuts of 53,000 within the next five years, but the real figure might be closer to 80,000, amounting to 5% of the workforce.

30
3.20 The Royal College of Nursing (RCN) highlighted debates around staffing levels and nurse to patient ratios. The RCN strongly supported the use of minimum staffing levels, though it recognised that this matter was outside our remit. The RCN said there was a direct link between nursing staffing levels and patient and quality outcomes, which depended on having a highly trained, motivated, supported and fairly-paid workforce with enough time for duties and development.
3.21 The RCN in its Labour Market Review pointed to a reduction in commissioned places for pre-registration nursing, which had fallen by 8.7% between 2010/11 and 2011/12, and which would reduce further by 5.6% to 2012/13. It highlighted the impact of previous “boom and bust” approaches to workforce planning, with reduced intakes to training creating staff shortages, with a subsequent need to “scale up training and rely on high levels of active international recruitment to make good domestic training capacity shortfalls”.
3.22 UNISON drew attention to the ageing profile of the NHS workforce in England, with most age groups under the age of 45 showing a decline in numbers between 2010 and 2011, but staff under 25 declining in a greater number. UNISON was concerned that this would create long term issues in attracting younger staff to work in the NHS. UNISON also drew attention to reductions in commissioning of pre-registration healthcare education in England between 2010/11 and 2011/12: nursing and midwifery commissions fell by 8.9%; AHPs by 6.4%; technicians by 12%; and healthcare scientists by 21.1%. The exception was community nursing, where commissions rose because of the commitment to raise the number of health visiting staff. In UNISON’s view, short term, cost driven reductions were taking place.
3.23 The Staff Side noted the continued absence of data on vacancies, and asked us to reiterate our concerns and press for an early resumption of data collection. Two-thirds of respondents to the 2012 Staff Side IDS Survey reported frequent staff shortages in the previous year.
Our Comment
3.24 We note the recent decreases in the size of our remit group, which are not unexpected in the current climate. We comment elsewhere in this report on approaches to delivering efficiencies and transformational change in the NHS, but here we make the following observations on the overall recruitment and retention position of our remit group:
• The largest reductions in staffing levels have been in administrative and other support roles, rather than in direct clinical care – nonetheless, we note that these roles contribute to patient care and experience, either directly in the case of healthcare assistants and hotel services, or indirectly through freeing up clinicians’ time;
• The number of qualified nursing posts has decreased, which the RCN has warned could have an adverse impact on patient care and service quality. It is not easy to find robust evidence of such a direct impact. Indeed, we note that there have always been changes in workforce size and composition according to shifts in demand and service priority. However, such workforce reductions need: to be based on careful workforce planning and strategic analysis of needs; to be integrated with plans for transformational changes to services; and their rationale to be communicated more effectively to stakeholders, not least staff. During our visits to NHS establishments, we have not always found clear evidence of effort being put into developing and communicating a wider picture;
• Our overall assessment of the recruitment and retention situation continues to be constrained by the lack of vacancy data for England and Wales. Based on the available data, our conclusion is that recruitment and retention is not a current

31
concern, though this may be a reflection of the economic environment – this position may change as the economic, and therefore the labour market, recovery strengthens.
Shortage Occupations
Evidence from the Parties
Department of Health
3.25 The Department of Health noted that a number of health professions remained on the Migration Advisory Committee’s (MAC) Shortage Occupation List, and told us that the CfWI was reviewing actions to reduce the number on the list.
3.26 The Department told us that the number of midwives had increased to 21,092 to June 2012 with training numbers at a record high. The focus for the workforce would be increasingly on supporting the whole maternity team to make best use of their contributions by using innovation and new technology to drive up the quality of care and deliver value for money. The Department had asked CfWI to undertake an in-depth study of the nursing and maternity workforce.
3.27 The Department said the UK Government had committed to increase the number of health visitors by 4,200 by April 2015 to transform services for families. The number had increased by 339 (4.2%) since May 2010 and was in line with plans.
3.28 The Department told us that preliminary results of the Pharmacy Establishment and Vacancy Survey 2012 showed three-month vacancy rates of 6% to 7% for junior pharmacists, marginally lower than in 2011 and substantially lower than in previous years. In the new NHS architecture, Health Education England (HEE) and Local Education and Training Boards (LETBs) would both need to engage with, and take account of, the community pharmacy workforce, to plan and develop the overall pharmacist workforce. Community pharmacy contractors would be required to cooperate in the planning of the healthcare workforce and this would ensure that more than 90% of registered pharmacists would be considered and planned as a single workforce.
Employer Bodies
3.29 NHSE said that the MAC’s Shortage Occupation List currently reflected the shortage professions identified by employers. NHSE commented that employers reported recruitment issues around: some specialist nursing roles, for example accident and emergency, theatre and neo-natal; sonographers; and some scientific roles. There were also recruitment and retention problems in some places for health visitors and pharmacists. NHSE considered these shortages as national in nature but noted they would differ depending on locality and local circumstances. In NHSE’s view, lack of training for particular specialist roles had led to supply problems which could not, in the short term, be addressed by changes to national pay rates.
Devolved Administrations
3.30 The WG told us that the number of pharmacist posts in Wales had remained fairly static, but the number of posts filled had increased resulting in a drop in overall vacancy rates from 7% in 2011 to 3% in 2012.
32
Staff Bodies
3.31 The Royal College of Midwives (RCM), using its Birthrate Plus method to determine minimum staffing levels for maternity units, calculated a shortage of 4,976 midwives in England and 154 in Wales.
3.32 The Staff Side reported a 7.6% vacancy rate in therapeutic radiography, with attrition from education programmes running at 35% since 2007, and NHS activity levels in England expected to increase by 50% by 2016. The Staff Side said the vacancy rate for sonographers was around 11%, and criticised what it saw as a lack of central workforce planning and fragmentation of the ultrasound service under the NHS reforms.
3.33 Unite noted the improving trend in vacancy rates for pharmacists, but was concerned about evidence emanating from the IDS Staff Survey – pharmacists were the occupational group second-most likely to “always” work in excess of their contracted hours and 60% of pharmacists reported that these additional hours were unpaid. Pharmacists were also most likely to report problems in recruiting staff and, in Unite’s view, the evidence from the IDS Staff Survey suggested that there was still an issue of staff shortages in pharmacy even if these were not being advertised as vacancies.
Our Comment
3.34 In our last report we noted that the recruitment and retention position for shortage groups may be easing slightly, and asked the parties to highlight where pay plays a specific role in such groups’ recruitment and retention. As such evidence has not been drawn to our attention, we do not consider it necessary to take any specific action in respect of these groups, but will continue to review the position as appropriate.
3.35 We have commented in previous reports that some AfC occupational shortages, notably those on the MAC Shortage Occupation List, are longstanding. These could be the first to suffer retention problems should the labour market pick up. While we welcome efforts by the CfWI to review the actions to address these longstanding skill shortages, we remain concerned that, unless addressed, there is a risk that expensive pay solutions could be required in the longer term.
Recruitment and Retention Premia
3.36 The AfC Agreement7 includes a mechanism whereby RRP can be awarded on a national basis to particular groups based on our recommendation where it can be demonstrated that there are national recruitment and retention pressures. However, we have no role in decisions on the continuation of existing national RRP – this rests with the NHS Staff Council.
3.37 Following a review of national RRP, we noted in our Twenty-Sixth Report8 that the NHS Staff Council had agreed that: the national RRP for maintenance craft workers should cease after 31 March 2011 for new starters with transitional protection arrangements for two years; the national RRP for chaplains should be withdrawn and replaced, where appropriate, with a local RRP; and employers should review the need for national RRP paid to groups under Annex R of the NHS Terms and Conditions Handbook including the need for local RRP.
7 Section 5 and Annex R of NHS Staff Council NHS Terms and Conditions of Service Handbook (Amendment Number 27), Pay Circular (AforC) 3/2012.
8 NHSPRB (2012), Twenty-Sixth Report, TSO (Cm 8298), paragraphs 4.11-4.14.
33
Evidence from the Parties
Employer Bodies
3.38 NHSE considered that there was no requirement for any new nationally determined RRP and that local employers were best able to decide how to respond to any issues that arise. NHSE commented that any additional pay supplements in the form of RRP had to be justified by evidence that these were needed to support recruitment and retention and that this requirement was reaffirmed in the employment tribunal judgment in the Hartley9 equal pay test case.
3.39 NHSE said that national RRP were paid to some maintenance craft workers as a transitional measure when the AfC pay system was introduced. However, the parties on the NHS Staff Council agreed a phased withdrawal of the national RRP over two years with payments to existing recipients paid at 50% of the original value from April 2012 and will be phased out completely by March 2013. As part of that agreement, it was agreed that the position would be reviewed again in the future to determine whether changing labour market conditions could mean a national RRP for maintenance craft workers were necessary again. NHSE reported that the NHS Staff Council was currently considering this review.
3.40 NHSE told us that the use of local RRP was intended to address market problems where there was evidence that the reason for the difficulty in recruiting and retaining staff was directly linked to levels of pay and that pay supplements would help a local employer to compete in the local labour market. NHSE emphasised that the use of local RRP was not an appropriate response where the reason for failing to recruit was due to a lack of supply of health related specialists. NHSE recognised that recruitment and retention issues were not always reliant on pay levels and a range of other issues could all have an impact.
3.41 NHSE observed that the flexibility to use local RRP was not being widely used at present due largely to the prevailing depressed labour market. NHSE said that in most part of the country employers reported no particular recruitment problems and that some had reported large numbers of applicants for vacancies which might suggest that in certain posts pay was higher than the market rate. NHSE provided data which showed that on average 4.9% of AfC staff were in receipt of RRP in September 2011 down from 5.8% in June 2010.
Devolved Administrations
3.42 The SGHSCD commented that in line with the rest of the UK it was following the agreement on national RRP within the NHS Staff Council and that national RRP would “disappear” on 31 March 2013. The SGHSCD reported that Scotland had an established process whereby NHS Boards could make an application for a local RRP through the Scottish Terms and Conditions Committee. The withdrawal of the national RRP for maintenance craft workers had led to a number of NHS Boards making local RRP applications – of the five applications submitted, one had been rejected but applications from NHS Orkneys, NHS Shetland, NHS Highland and NHS Grampian had all been approved.
3.43 DHSSPSNI also confirmed that the national RRP payment to maintenance craft workers in Northern Ireland would cease on 1 April 2013. DHSSPSNI told us that the local arrangement for addressing recruitment and retention difficulties was fully operational and effective. A Northern Ireland Recruitment and Retention Framework was introduced in 2007 and there were three long term local RRP in place: Band 7 embryologists
9 Reserved Judgment of the Employment Tribunal, Newcastle upon Tyne, Ms S C Hartley and Others v Northumbria Healthcare NHS Foundation Trust, Unison and other Unions, the Secretary of State for Health, NHS Confederation (Employers) company Ltd, and the GMB, 2009.

34
employed in the Regional Fertility Clinic; Band 7 nurses on Rathlin Island; and Band 8D Head of the Leadership Centre. DHSSPSNI also confirmed that there was no evidence to support a local RRP for maintenance craft workers.
Staff Bodies
3.44 The Staff Side emphasised that there was a lack of adequate data collected on the use of RRP across the UK and that this hindered the ability of the service to judge how well utilised the RRP mechanism was in addressing recruitment issues.
3.45 Unite commented that morale in estates and maintenance was extremely low with 67% of staff saying that they would not recommend their own occupation or profession as a career in the NHS and staff being the most likely to report reductions in overtime and loss of the national RRP. Unite added that NHS Employers had started to collect data for a review of national RRP arrangements with an interim report submitted to the NHS Staff Council Executive. Unite said that, in response to the removal of the estates and maintenance national RRP, there was strong evidence that individual NHS Trusts were negotiating local RRP arrangements due to concerns about the impact on their workforce. It noted that Scotland had agreed four local RRP. Unite also commented on the loss of the national RRP for chaplains directly employed by the NHS. Unite sought to restore the housing allowance for chaplains through the NHS Staff Council and estimated that NHS chaplains earned around £20,000 less than similar faith workers employed outside the NHS.
Our Comment
3.46 We have a continuing role under Section 5 of the AfC Agreement to consider any new cases for national RRP although none were presented for this report. We note NHSE’s overall view that there was no requirement for new national RRP. We repeat our view that shortages in specific occupational groups often arise from inadequate supply as a result of ineffective workforce planning and shortfalls in training commissions which may require expensive pay solutions in the future. Any cases for new national RRP must be accompanied by substantial, and where possible joint, evidence. In the meantime, we ask that the parties keep us informed of the NHS Staff Council’s review of the national RRP for maintenance craft workers which is due to be withdrawn by March 2013.
3.47 We commented extensively on local RRP in our Market-Facing Pay Report10. Our analysis of the usage of local RRP indicated that the majority were likely to be pre-AfC Cost of Living Supplements converted to long term RRP when AfC was introduced in 2004. Excluding these legacy payments suggested that the usage of local RRP was rare and did not show a distinct geographical pattern which might have been a reflection of the lack of recruitment and retention problems or constrained funding for local RRP.
3.48 We therefore reiterate the recommendation in our Market-Facing Pay Report on the appropriate use of local RRP as a key market-facing element of AfC and that local RRP should: have appropriate review mechanisms in place; reflect employers’ local needs; be supported by robust data; be simple to operate; be fully understood by staff; and that good practice be shared.
10 NHSPRB (2012), Market-Facing Pay: How Agenda for Change pay can be made more appropriate to local labour markets, TSO (Cm 8501).
35
Workforce Planning
Evidence from the Parties
Department of Health
3.49 The Department of Health stated that local healthcare organisations, with their knowledge of the patients that they serve, were best placed to plan and deliver a workforce appropriate to the needs of their patients, based on clinical need and sound evidence. The Department considered that where changes were planned to the size and shape of the workforce, local healthcare organisations must provide assurance that the safety and quality of patient care was maintained or improved. Workforce planning in a more diverse NHS would require continued access to workforce information to enable HEE, LETBs and the CfWI to fulfil their roles.
3.50 The Department noted that, under the framework, healthcare providers would work collaboratively, forming LETBs overseen by HEE. Strategic Health Authorities and LETBs would work together to develop plans for commissions in 2013/14, which reflected the needs of local employers and the expected output from training programmes taking account of attrition. The Department stated that in the past the NHS had relied on immigration to bolster domestic workforce supply.
Employer Bodies
3.51 NHSE noted that it was widely acknowledged that current workforce planning arrangements were complex, expensive and had not been able to deliver the right number of appropriately trained healthcare professionals with the right skill sets to meet local needs. NHSE said that the system for commissioning education and training, national and local, must be led and managed by employers in constructive dialogue with the professions if it was to be effective in meeting the needs of patients.
3.52 NHSE stated that employers fully supported the reforms as presenting a unique opportunity to maximise the benefits to patients and in placing them at the front of decision making in planning and commissioning the education, training and development requirements of the health service workforce.
3.53 NHSE observed that the UK Government believed that the creation of HEE and LETBs aimed to ensure that education, training and workforce development drove the highest quality public health and patient outcomes and achieved good value for money.
3.54 The Foundation Trust Network (FTN) welcomed the development of LETBs as it gave employers direct control over the shape of their own workforces to meet the needs of the changing NHS.
Devolved Administrations
3.55 The SGHSCD described its Six Steps Methodology to Integrated Workforce Planning in NHSScotland. It added that work was continuing on Nursing and Midwifery Workload and Workforce Planning Tools for each workforce area. Similar work was being undertaken for Allied Health Professions and Health Care Science Professions.
3.56 Regional workforce planning is intended to enable the DHSSPSNI to gain workforce intelligence on the trends in employment for each professional group and this in turn will inform planning of needs over subsequent years. The methodology for carrying out workforce reviews had been altered recently with a greater onus being placed on Trusts to undertake organisational level workforce planning, integrating financial, service development and workforce planning streams to help better inform the regional workforce planning process.

36
Staff Bodies
3.57 UNISON highlighted that the NHS Workforce Review Team for England formerly produced regular projections of supply and demand for major occupational groups until its replacement by the CfWI. UNISON considered that the absence of such rigorous analysis meant that commissions were shrinking without reference to the vacancy rates, increasing the risk that particular specialties within the healthcare workforce might be in increasingly short supply.
3.58 UNISON stated that whilst the CfWI had not yet produced such detailed forecasts of supply and demand, it had produced a paper on the workforce risks and opportunities facing the nursing and midwifery workforce11. The paper identified two factors that were set to constrict supply of nursing and midwifery staff to the NHS. The international admissions of nurses to the Nursing and Midwifery Council register had reduced while the migration of UK nurses had risen to the point that the outflow of nurses was over five times higher than the inflow. UNISON considered that the ageing of the NHS workforce had also been long apparent in the field of nursing and midwifery.
3.59 UNISON considered that these reductions in the registered workforce needed either to be addressed at source, with better workforce data driving more accurate commissioning of healthcare education places, or with commensurate attention being paid to re-engineering of the workforce within occupational groups. In UNISON’s view, there was much that could be done within individual organisations to engage staff with this agenda, ensuring that there was a standard process for any workforce re-profiling and that this was done with the needs of the service having been fully mapped. Emphasis should be given to relevant clinical governance and with reference to the Job Evaluation Scheme and the KSF.
3.60 The RCN stated that its Labour Market Review concluded that “without more complete data on temporary nursing staff usage, workforce planning assumptions will continue to be based on an underestimation of the workforce supply required to meet current demands”. It also highlighted the risks of the “employer led” approach which was to be used in workforce planning. The RCN considered that this approach previously created an undersupply in the nursing workforce. The Labour Market Review warned that cost containment pressures often led to local employers taking a narrow, local view of their future requirements, without taking sufficient account of changed demand and of labour market dynamics and staff flows. As these narrow views were aggregated up to regional and national level, the end result could be a significant underestimate of future requirements for nursing staff.
Our Comment
3.61 We are grateful for the further information on workforce planning arrangements in the parties’ evidence. As HEE, CfWI and LETBs establish their roles, we reiterate the importance of effective workforce planning and monitoring to avoid imbalances in supply and demand for non-medical staff. We particularly note the RCN’s and the RCM’s concerns around securing sufficient supply of qualified nurses and midwives. With financial constraints across the NHS and reconfigurations of services and workforces, accurate workforce planning has increasing significance. The NHS should not be presented with expensive pay solutions to ensure appropriate recruitment and retention of staff because demand and supply of particular skills had been inaccurately determined. It is also clear to us that the success of the new workforce planning arrangements will rely on the availability of accurate and up to date workforce information.
11 Centre for Workforce Intelligence (July 2011), Nursing and Midwifery Workforce Risks and Opportunities, Laura Dunkley and Saira Haider.
37
3.62 We would welcome further updates, particularly from employer bodies, on how the new arrangements are taking shape during 2013, their effectiveness in supporting NHS developments and how our and others’ concerns are being addressed.
Training and Development
Evidence from the Parties
Department of Health
3.63 The Department of Health said that its longstanding policy was to work closely with the professions and other key partners to ensure that the non-medical workforce was appropriately trained and had access to realistic and achievable career pathways. The focus for the workforce at AfC Pay Bands 1-4 will be based on improving training and development as a means of empowering and enabling talented and motivated staff to progress.
3.64 The Department was committed to supporting NHS apprenticeships and had commissioned NHS Employers to oversee the implementation of the National Apprenticeship Advisory Committee report12 and recommendations. At AfC Bands 1-4, the Department of Health had worked in partnership with Skills for Health to prioritise several clinical support roles and develop clear frameworks for career progressions supported by defined competencies and robust education and training pathways.
Devolved Administrations
3.65 The SGHSCD informed us that the NHSScotland Staff Governance Standard set out what employers must do to develop and manage their staff, and to ensure that all staff had a positive employee experience. The Standard required all NHS Boards in Scotland to demonstrate that staff were appropriately trained and developed and required all staff to keep themselves up to date with developments relevant to their job within the organisation and commit to continuous personal and professional development.
Staff Bodies
3.66 UNISON noted, in the 2011 NHS Staff Survey, that there was a deterioration in the number of staff receiving job-relevant training, learning or development in the last twelve months.
3.67 The RCM considered that budget cuts were forcing Heads of Midwifery to cut all but mandatory training and in some cases this was being cancelled due to staffing shortages. Overall, the RCM saw a picture of maternity services where there was a lack of training and development opportunities.
3.68 On registration fees, the RCN stated that nursing staff faced a proposed increase in Nursing and Midwifery Council fees from £76 to £120 per year. Unite considered that the costs of professional registration should be borne by the employer.
Our Comment
3.69 Access to relevant training and development is an essential part of the overall package to recruit and retain AfC staff. We are concerned that individual unions are reporting reductions in activity and we remind Trusts that they should be careful not to undermine staff engagement by failing to deliver on commitments to training and development
12 National Apprenticeship Advisory Committee (October 2010), Making Apprenticeships an Important and Sustainable Part of the Health Sector Workforce. Available at: http://www.dh.gov.uk/prod_consum_dh/groups/dh_digitalassets/@dh/@en/@ps/documents/digitalasset/dh_121705.pdf.

38
which can also help to address skill shortages. Training and development of staff is an important element in enabling Trusts to change their skill mix to deliver services in new and efficient ways thereby ensuring patients receive the best care possible. Employers will need to consider how training and development contributes to their staff engagement strategies. We welcome the national oversight provided by HEE13 and ask the parties to keep us informed about accountability and responsibility for training and development as LETBs are established through to April 2013.
3.70 In the context of training and development, we note Unite’s concerns that the costs of professional registration should be borne by the employer. However, as we stated in our Twenty-Sixth Report14 we consider this a matter for the NHS Staff Council.
Appraisal and the Knowledge and Skills Framework
Evidence from the Parties
Employer Bodies
3.71 NHSE highlighted the previous publication of simplified KSF guidance and had placed a library of good practice on the NHSE website. NHSE was pleased that the results from the 2011 NHS Staff Survey continued to show steady progress in appraisal coverage. 80% of staff, compared to 77% in 2010, reported having had an appraisal. However, only a third of staff (34%) reported that their review was well-structured. NHSE responded that employers needed to focus on improving the quality of the reviews in order to fully realise the benefits of the appraisal process for supporting the delivery of quality patient care.
Devolved Administrations
3.72 The SGHSCD said that NHSScotland continued to see the KSF as a valuable tool for staff development, ensuring that staff had the right learning and skills to enable them to do their job effectively. The SGHSCD expected Health Boards, as exemplary employers and in delivering their responsibilities under the Staff Governance Standard, to continue to ensure that staff had Personal Development Plans in place and that they had yearly Development Reviews.
3.73 The DHSSPSNI observed that Health and Social Care (HSC) employers in Northern Ireland remained committed to the KSF in line with the AfC national agreement. The NHS Staff Council had endorsed new simplified guidance on the KSF and employers locally had welcomed this development. A regional group, comprising management and trade union representation from all HSC organisations met on a regular basis to share knowledge, develop and disseminate good practice and monitor progress. Progress across HSC organisations was variable ranging from 45% cover to over 99% for KSF outlines and 38% of the current workforce with a completed Personal Development Review.
Staff Bodies
3.74 UNISON also highlighted the 2011 NHS Staff Survey findings and added that in terms of staff having clearly defined roles and responsibilities, eight out of ten staff (unchanged from 2010) said that they knew their work responsibilities but only 37% of all staff said that they received “clear” feedback on how they were doing in their job.
13 NHSPRB (2012), Twenty-Sixth Report 2012, TSO (Cm 8298), paragraph 5.52.14 NHSPRB (2012), Twenty-Sixth Report 2012, TSO (Cm 8298), paragraph 5.53.

39
3.75 UNISON also stated that NHS Wales reported that there was still a gap in achieving full implementation of the KSF and that results for the year 2011/12 indicated a downward trend rather than an increase in the level of appraisals/performance development reviews. UNISON continued that NHS Wales had now adopted a series of measures to help achieve full implementation, that PDRs would form part of their national workforce statistics and monitoring improvements would become part of the Annual Quality Framework review process.
Our Comment
3.76 As the parties have highlighted in evidence, there has been some progress regarding the completion rates for staff appraisals. However, the number of staff who reported in the NHS Staff Survey that they received well-structured appraisals remains disappointingly low and needs to improve. We again state that a well-functioning staff appraisal system, linked to the job competency requirements outlined in the Knowledge and Skills Framework, is important to the effective management and training of staff to ensure that patients receive both safe and effective care.
3.77 The NHS Staff Council is discussing proposals to make incremental pay progression through all pay points conditional upon individuals demonstrating the requisite knowledge and skills/competencies for their role based on standards of performance and delivery as determined locally. If agreed these proposals would be implemented from April 2013. NHS Trusts will need to ensure that they have sufficient HR capacity and that appraisal systems and the supporting KSF arrangements are robust if they are to realise the benefits employers seek of better alignment between staff performance and productivity, responsiveness to local needs and developing a flexible workforce.
Staff Engagement
3.78 One of the strongest themes in our evidence-gathering process – both through the written and oral evidence and especially through our programme of visits – has been the importance of developing and improving staff engagement to deliver better and more cost effective patient care and to enable the transformational change required in the NHS. In this section we highlight the parties’ evidence and other research in this area.
Background Research
3.79 Between 2009 and 2011, Aston University conducted a number of analyses linking results from the annual NHS Staff Surveys with various outcome measures for the NHS in England. These reports were drawn together and summarised in August 2011, and published on the Department of Health’s website15.
3.80 The overarching conclusion arising from the various supporting reports was that “the more positive the experience of staff within an NHS Trust, the better the outcomes for that Trust”. Higher levels of staff engagement, in particular, were statistically significantly associated with:
• Higher patient satisfaction;• Lower patient mortality;• Lower MRSA infection rates;• Better Annual Health Check scores (quality of services and quality of financial
performance);• Lower staff absenteeism; and• Lower staff turnover.
15 Aston Business School (2011), NHS Staff Management and Health Service Quality: Results from the NHS Staff Survey and Related Data, Department of Health. Available at: http://www.dh.gov.uk/en/publicationsandstatistics/publications/publicationspolicyandguidance/DH_129643.
40
3.81 Other indicators of good management of NHS staff, which were statistically significantly associated with some or all of the above outcome measures16 included:
• The percentage of staff receiving well-structured appraisals (and indeed, having no appraisal at all appeared to give better results than having a poor-quality appraisal);
• Staff intention to leave their jobs;• The percentage of staff receiving job-relevant training, learning and development;
and• Work pressure felt by staff (which was negatively associated with outcomes).
NHS Staff Survey
3.82 Table 3.2 provides summary information on changes in staff attitudes between autumn 2007 and autumn 2011. We note that all indicators in the survey relating to engagement and job satisfaction showed slight deteriorations on previous years. For non-medical staff in England, between 2010 and 2011:
• There were very slight deteriorations in average scores for work-life balance, work pressure and job satisfaction, staff motivation and intention to leave;
• The rate of improvement in the percentage of staff who were appraised in the 12 months prior to the survey has slowed;
• There was a further slight decrease in the percentage of staff who undertook job-relevant training, learning or development in the 12 months prior to the survey;
• The percentage of staff who felt valued by their work colleagues decreased slightly;• The percentage of staff reporting good communication between senior
management and staff decreased; and• There was a reduction in the percentage of staff satisfied or very satisfied with their
level of pay; the first such reduction since this question was first asked in 2007, but satisfaction remained above 2009 levels.
16 These factors were also correlated with overall staff engagement (or with its component factors), so it is unsurprising that they were also associated with outcome measures.

41
Table 3.2: Summary results from the National NHS Staff Survey, 2007-2011, England, excluding medical and dental staff
Measure 2007 2008 2009 2010 2011 Trend1
Workload
Work pressure felt by staff2,3
Trust commitment to work-life balance3
% staff working extra hours2
% staff suffering work-related stress in last 12 months2
3.17
3.45
65.6
33.1
3.09
3.50
65.5
28.4
3.07
3.51
64.3
28.5
3.06
3.52
64.5
29.4
3.09
3.48
64.1
30.4
Training and appraisals
% staff receiving job-relevant training, learning or development in last 12 months
% staff appraised in last 12 months
% staff having well structured appraisals in last 12 months
% staff appraised with personal development plans in last 12 months
77.1
60.6
24.5
51.8
80.7
64.7
27.9
56.0
79.2
69.8
32.0
60.5
77.8
77.1
35.2
67.0
76.6
79.0
34.8
67.7
Engagement and job satisfaction
% staff feeling valued by their work colleagues
Support from immediate managers3
% staff reporting good communication between senior management and staff
% staff able to contribute towards improvements at work
Staff recommendation of the Trust as a place to work or receive treatment3
Staff motivation at work3
Staff job satisfaction3
Staff intention to leave jobs2,3
3.64
3.43
2.74
3.64
28.1
66.0
3.52
3.50
2.60
77.8
3.68
28.9
65.0
3.51
3.85
3.53
2.56
77.5
3.70
30.5
65.0
3.50
3.80
3.54
2.63
76.6
3.68
28.4
63.2
3.47
3.78
3.51
2.65
Source: National NHS Staff Survey. Data excluding medical and dental staff produced on request by Picker Institute.Notes:1 Trend lines do not have a common scale; they each show the general direction of travel of individual key findings (which may exaggerate fairly small changes), and must be viewed both in the context of the data in the preceding columns and the full range of possible scores for each measure.2 Lower scores are better.3 Results are on a scale from 1 to 5.
42
Evidence from the Parties
Employer Bodies
3.83 NHSE noted that the NHS Staff Survey 2011 showed that, despite the challenges facing the service, staff satisfaction remained high and staff were committed to high quality patient care. Overall, staff satisfaction levels fell slightly, which NHSE suggested was driven by concern over perceptions of increasing workload. There had also been a small rise in staff intention to leave and in perceived work pressure, and a reduction in the commitment seen to work-life balance.
3.84 NHSE observed that individuals were not only driven by the monetary gains they received, but also those non-financial elements which employers needed to develop and promote if they were to improve morale, motivation and retention of talent in the workforce. NHSE said that the overall value of the NHS reward package was not understood or communicated, and told us that from 2013 staff would receive a total reward statement showing both individual’s pay and additional benefits provided by local employers.
Staff Bodies
3.85 The Staff Side highlighted the main points from the survey of staff conducted by Incomes Data Services (IDS)17:
• Two-thirds of staff stated that morale was worse or a lot worse than a year ago, which was attributed to workplace stress, NHS restructuring, pension changes and the falling value of take-home pay;
• Only 8% of staff would recommend their occupation as a profession in the NHS;• One-third of staff had “very seriously” considered leaving their NHS post, compared
with a quarter of respondents to the 2007 survey – these findings were similar to the 2011 NHS Staff Survey;
• 75% of those considering leaving the NHS cited workload and stress as among their reasons, 62% the changing nature of the NHS, 61% staff shortages and 60% changes to NHS pensions;
• One of the key themes from the survey was apprehension around NHS restructuring and reorganisation, with many interview respondents concerned they would lead to “privatisation by the back door”;
• Nurses, midwives and maternity support workers in particular, and 52.8% of survey respondents overall, said their workload had increased “a lot” in the last 12 months. The main reasons given for increased workloads were taking on additional duties and responsibilities (stated by 75% of respondents), lack of cover (47%), and vacancy freezes (38%); and
• 72% of survey respondents reported that increased workload had a negative impact on morale.
3.86 The Staff Side also told us that the 2011 NHS Staff Survey found that 75% of staff did not usually work additional paid hours, but 55% reported regularly working unpaid hours. The Staff Side added that 41% of staff regularly worked up to five unpaid hours a week revealing the widespread reliance on staff working unpaid overtime within the NHS.
3.87 UNISON considered that the strain may be beginning to show in terms of service delivery. It referred to the King’s Fund publication of the results of the British Social Attitude Survey18 in June 2012 which showed that public satisfaction with the way the
17 Incomes Data Services (September 2012), NHS Staff Survey on Pay and Conditions – A Research Report for the Joint Staff Side NHS Trade Unions.
18 Available at: www.kingsfund.org.uk/current_projects/bsa_survey_results_2011/index.html.
43
NHS runs had fallen from 70% in 2010 to 58% in 2011. The report suggested the most likely explanation lay in concerns about the UK Government’s health reforms and reaction to funding pressures.
3.88 The RCN told us that 63% of nursing staff, responding to the IDS Staff Survey, attributed their falling morale to dissatisfaction with the quality of care they felt able to provide. 83% felt that declining morale was a result of increased stress.
Our Comment
3.89 It should be self-evident that a well-motivated, engaged workforce – in any industry – is likely to be more productive and effective in their work. We were therefore interested, though not surprised, by the findings of Aston University’s research which found a link between staff engagement and patient experience and outcomes19. It is clear to us that, in a period of substantial organisational change and financial challenge, a priority for NHS leaders should be to develop and improve the engagement of their staff in order to deliver better and more cost effective patient care and to enable the transformational change required. Such staff engagement is even more important in the light of a prolonged period of pay restraint and consequent reductions in real pay. NHS leaders should be particularly concerned that less than 30% of staff feel there is good communication between them and senior managers. We were disappointed by the paucity of evidence from the Health Departments and NHSE on their staff engagement strategies.
3.90 We also observe both from the National NHS Staff Survey, and the Staff Side’s survey conducted by IDS, a growing feeling of work pressure and stress among staff. As highlighted by the Staff Side, our remit group has played a major role in meeting the expanding demands of the NHS in the context of restricted resources. We concur with the various survey findings, the Staff Side’s view and our own visits to NHS establishments that there is some evidence of an emerging and worrying trend that AfC staff engagement and motivation is in decline. If not addressed as a priority, these factors could begin to influence staff recruitment and retention. The evidence presented to us suggests pressures are building putting at risk staff goodwill and, in consequence, their willingness to deliver necessary changes to the system and quality patient care. We return to the impact of declining staff motivation in the context of our overall pay recommendation in Chapter 5.
19 Correlation does not imply causation (which in this field could act in either direction, both or neither).
44
Chapter 4 – Funds Available to the Health Departments
Introduction
4.1 This chapter sets out the parties’ evidence and our conclusions on the funds available to the Health Departments. The issue of affordability of pay awards is a significant factor within our terms of reference and a key element of the UK Government’s and Devolved Administrations’ overall approach to public sector pay.
4.2 We consider below the evidence presented by the UK Government on the overall position of public finances, the specific financial considerations for the four Health Departments and employers’ organisations, and views of the Staff Side and individual unions on NHS finances. We also summarise recent reports on NHS finances and productivity.
Evidence from the Parties
Department of Health
4.3 The Department of Health commented that the UK Government remained committed to fiscal consolidation. The UK Government’s fiscal mandate was to achieve cyclically-adjusted current balance by the end of the rolling five-year forecast period. In March 2012, the OBR concluded that the UK Government remained on course to meet the fiscal mandate but there remained substantial uncertainty over the medium term and significant risks until fiscal sustainability was restored. In the light of these factors, the UK Government believed there remained a strong case for continued pay restraint in the public sector.
4.4 The Department stated that the UK Government had provided sufficient funding for the NHS to support an average annual headline pay increase of up to 1% for NHS staff in 2013/14. It invited us to take into account that: recruitment, retention and motivation remained strong; 60% of AfC staff received annual incremental pay rises of between 0.6% and 6.7%; and any element of these funds not used for pay will be retained in the NHS and might be better employed on other issues such as increasing staff numbers or improving patient services.
4.5 The Department commented that the NHS saw large increases in funding between 2000/01 and 2011/12 with average real terms growth in revenue expenditure of 5.3% per year. Cash growth in NHS revenue expenditure would be 2.5% in 2013/14 (real terms growth 0.0%) and 2.7% in 2014/15 (real terms growth 0.2%) – see table 4.1. The Department estimated that between 2000/01 and 2011/12 increases in pay bill prices had on average accounted for 29.8% of the cash increases in revenue expenditure. For 2011/12, despite the pay freeze and reductions in non-clinical staff numbers, increases in pay bill prices still accounted for a revenue increase of 18.3%. Pay was the most significant cost pressure accounting for more than 40% of NHS revenue expenditure.
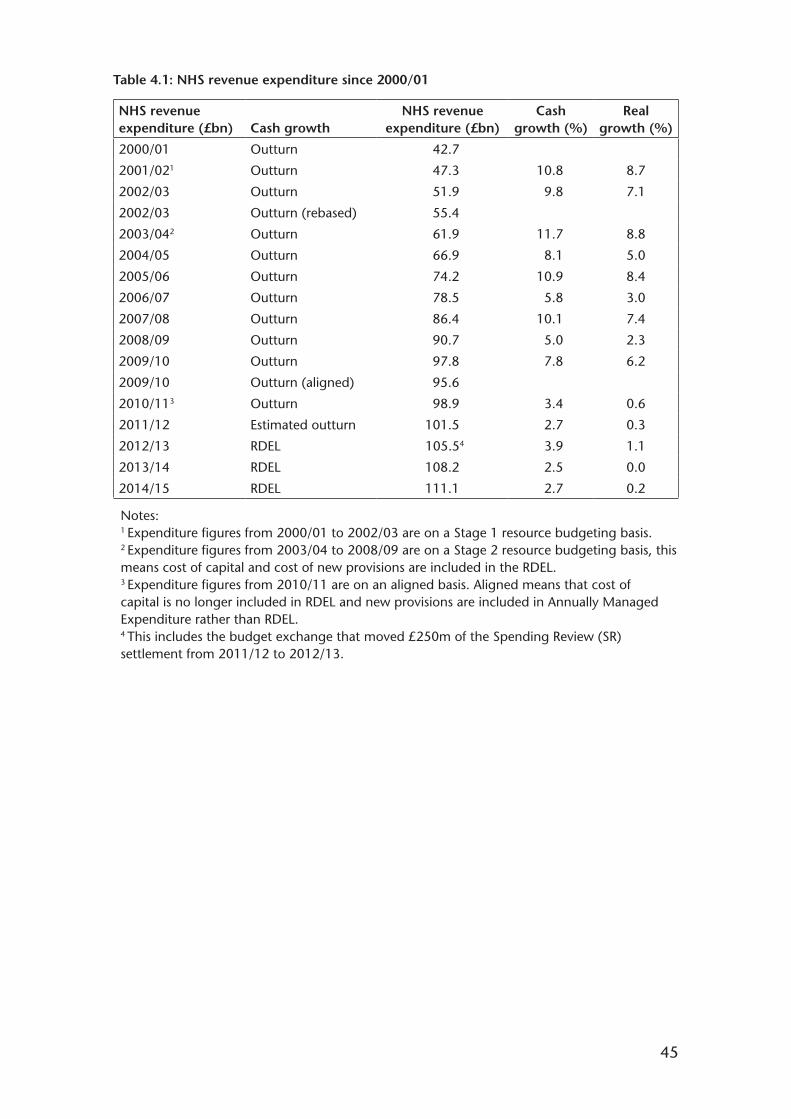
45
Table 4.1: NHS revenue expenditure since 2000/01
NHS revenue expenditure (£bn) Cash growth
NHS revenue expenditure (£bn)
Cash growth (%)
Real growth (%)
2000/01
2001/021
2002/03
2002/03
2003/042
2004/05
2005/06
2006/07
2007/08
2008/09
2009/10
2009/10
2010/113
2011/12
2012/13
2013/14
2014/15
Outturn
Outturn
Outturn
Outturn (rebased)
Outturn
Outturn
Outturn
Outturn
Outturn
Outturn
Outturn
Outturn (aligned)
Outturn
Estimated outturn
RDEL
RDEL
RDEL
42.7
47.3
51.9
55.4
61.9
66.9
74.2
78.5
86.4
90.7
97.8
95.6
98.9
101.5
105.54
108.2
111.1
10.8
9.8
11.7
8.1
10.9
5.8
10.1
5.0
7.8
3.4
2.7
3.9
2.5
2.7
8.7
7.1
8.8
5.0
8.4
3.0
7.4
2.3
6.2
0.6
0.3
1.1
0.0
0.2
Notes: 1 Expenditure figures from 2000/01 to 2002/03 are on a Stage 1 resource budgeting basis.2 Expenditure figures from 2003/04 to 2008/09 are on a Stage 2 resource budgeting basis, this means cost of capital and cost of new provisions are included in the RDEL.3 Expenditure figures from 2010/11 are on an aligned basis. Aligned means that cost of capital is no longer included in RDEL and new provisions are included in Annually Managed Expenditure rather than RDEL.4 This includes the budget exchange that moved £250m of the Spending Review (SR) settlement from 2011/12 to 2012/13.
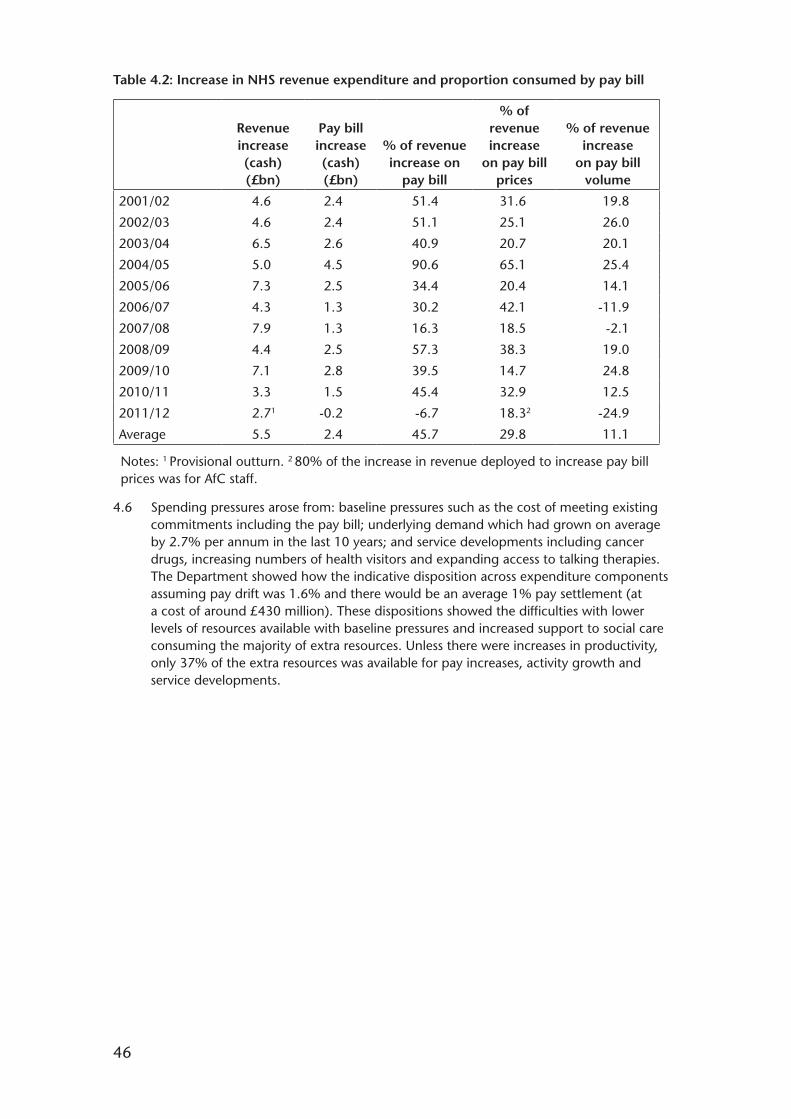
46
Table 4.2: Increase in NHS revenue expenditure and proportion consumed by pay bill
Revenue increase (cash) (£bn)
Pay bill increase (cash) (£bn)
% of revenue increase on
pay bill
% of revenue increase
on pay bill prices
% of revenue increase
on pay bill volume
2001/02
2002/03
2003/04
2004/05
2005/06
2006/07
2007/08
2008/09
2009/10
2010/11
2011/12
Average
4.6
4.6
6.5
5.0
7.3
4.3
7.9
4.4
7.1
3.3
2.71
5.5
2.4
2.4
2.6
4.5
2.5
1.3
1.3
2.5
2.8
1.5
-0.2
2.4
51.4
51.1
40.9
90.6
34.4
30.2
16.3
57.3
39.5
45.4
-6.7
45.7
31.6
25.1
20.7
65.1
20.4
42.1
18.5
38.3
14.7
32.9
18.32
29.8
19.8
26.0
20.1
25.4
14.1
-11.9
-2.1
19.0
24.8
12.5
-24.9
11.1
Notes: 1 Provisional outturn. 2 80% of the increase in revenue deployed to increase pay bill prices was for AfC staff.
4.6 Spending pressures arose from: baseline pressures such as the cost of meeting existing commitments including the pay bill; underlying demand which had grown on average by 2.7% per annum in the last 10 years; and service developments including cancer drugs, increasing numbers of health visitors and expanding access to talking therapies. The Department showed how the indicative disposition across expenditure components assuming pay drift was 1.6% and there would be an average 1% pay settlement (at a cost of around £430 million). These dispositions showed the difficulties with lower levels of resources available with baseline pressures and increased support to social care consuming the majority of extra resources. Unless there were increases in productivity, only 37% of the extra resources was available for pay increases, activity growth and service developments.
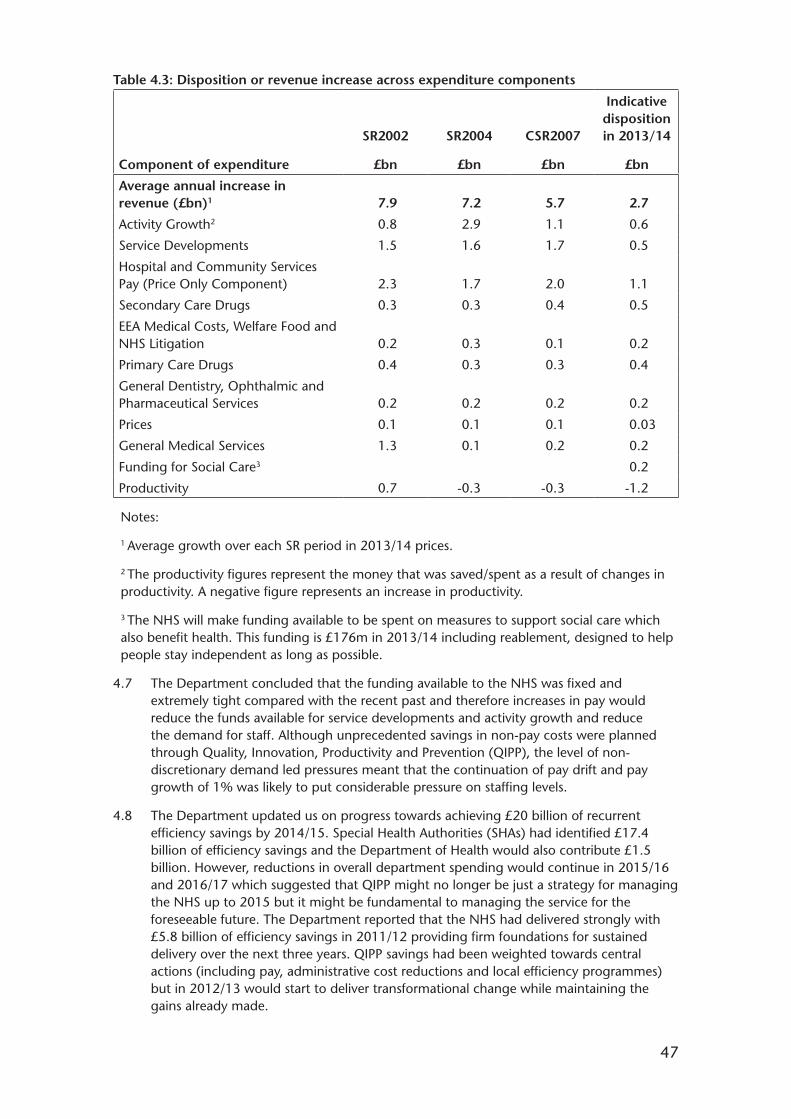
47
Table 4.3: Disposition or revenue increase across expenditure components
Component of expenditure
SR2002
£bn
SR2004
£bn
CSR2007
£bn
Indicative disposition in 2013/14
£bn
Average annual increase in revenue (£bn)1
Activity Growth2
Service Developments
Hospital and Community Services Pay (Price Only Component)
Secondary Care Drugs
EEA Medical Costs, Welfare Food and NHS Litigation
Primary Care Drugs
General Dentistry, Ophthalmic and Pharmaceutical Services
Prices
General Medical Services
Funding for Social Care3
Productivity
7.9
0.8
1.5
2.3
0.3
0.2
0.4
0.2
0.1
1.3
0.7
7.2
2.9
1.6
1.7
0.3
0.3
0.3
0.2
0.1
0.1
-0.3
5.7
1.1
1.7
2.0
0.4
0.1
0.3
0.2
0.1
0.2
-0.3
2.7
0.6
0.5
1.1
0.5
0.2
0.4
0.2
0.03
0.2
0.2
-1.2
Notes:
1 Average growth over each SR period in 2013/14 prices.
2 The productivity figures represent the money that was saved/spent as a result of changes in productivity. A negative figure represents an increase in productivity.
3 The NHS will make funding available to be spent on measures to support social care which also benefit health. This funding is £176m in 2013/14 including reablement, designed to help people stay independent as long as possible.
4.7 The Department concluded that the funding available to the NHS was fixed and extremely tight compared with the recent past and therefore increases in pay would reduce the funds available for service developments and activity growth and reduce the demand for staff. Although unprecedented savings in non-pay costs were planned through Quality, Innovation, Productivity and Prevention (QIPP), the level of non-discretionary demand led pressures meant that the continuation of pay drift and pay growth of 1% was likely to put considerable pressure on staffing levels.
4.8 The Department updated us on progress towards achieving £20 billion of recurrent efficiency savings by 2014/15. Special Health Authorities (SHAs) had identified £17.4 billion of efficiency savings and the Department of Health would also contribute £1.5 billion. However, reductions in overall department spending would continue in 2015/16 and 2016/17 which suggested that QIPP might no longer be just a strategy for managing the NHS up to 2015 but it might be fundamental to managing the service for the foreseeable future. The Department reported that the NHS had delivered strongly with £5.8 billion of efficiency savings in 2011/12 providing firm foundations for sustained delivery over the next three years. QIPP savings had been weighted towards central actions (including pay, administrative cost reductions and local efficiency programmes) but in 2012/13 would start to deliver transformational change while maintaining the gains already made.
48
Employer Bodies
4.9 NHSE said that the current national pay and conditions arrangements were increasingly unaffordable for employers in the NHS, who were faced with meeting growing demand and sustaining the quality of patient care while achieving unprecedented efficiency savings of up to £20 billion by 2015. NHSE felt that restraining earnings growth was essential to protect patient services and to minimise job losses. NHSE concluded that employers did not believe that increases in national pay rates from April 2013 were either necessary or affordable.
4.10 NHSE commented that increases in pay bill costs would create considerable financial pressure unless fully funded through the Payment by Results (PbR) tariff which had decreased over the last two years. Cost pressures from increased earnings from whatever source would not be affordable and savings would need to be found from elsewhere. NHSE reported that some Trusts had to achieve Cost Improvement Plans (CIPs) of up to 9% over the coming year and that Foundation Trusts faced the combined challenge of managing a reduced income and making increases in efficiency estimated at 4.5% to 5% per year. The reduction in income was driven by tariff reductions, falls in operating income and a reduced growth in activity. NHSE added that the Audit Commission found that the number of NHS Trusts and Foundation Trusts in deficit increased between 2010/11 and 2011/12.
4.11 NHSE pointed to Monitor’s review of NHS Foundation Trusts’ annual plans for 2012/131 which commented that a step change in CIPs had been seen – 2.0% in 2009/10 rising to 3.9% in 2011/12 and forecast to remain at more than 4.1% of operating costs each year from 2012/13 onwards and peaking at 4.3% in 2013/14. The forecast was below Monitor’s assumed efficiency requirements and Monitor had also indicated that the impact of a reduced tariff income could increase the efficiency challenge by 2%. The 2011/12 consolidated accounts of NHS Foundation Trusts revealed that over half did not meet their CIP targets. NHSE said that CIPs related predominantly to pay costs which were increasing from 57% of CIPs in 2012/13 to 63% by 2014/15. Action would be needed on staff numbers, skill mix, pay, and terms and conditions.
4.12 NHSE stated that any pay award should take account of the level of pay progression. They indicated that the two-year pay freeze had not frozen earnings in the NHS with individual employees continuing to enjoy pay progression which result in salary increases averaging 3.4% and up to 6.7% per year. NHSE acknowledged that this applied to the majority of AfC staff with the exception of those at the top of their pay band. NHSE estimated that incremental progression created a pay bill pressure of around 2% per annum for a typical NHS organisation (based on a staffing configuration consistent with the national average) although this would vary between organisations depending on the distribution of staff across the pay bands. NHSE also estimated that mean basic pay had increased by between 0.3% and 2.3% for all staff groups between April and June 2011 and the same quarter in 2012.
4.13 The FTN said that the cost and efficiency pressures faced by providers were clear and that pay, terms and conditions could not be excluded from an overall solution to meet these challenges. With provider revenues expected to fall by 1% in 2013/14, the FTN commented that awarding a pay increase when providers were already struggling with delivering cost containment, protecting jobs and improving care would put providers under severe duress and compromise fiscal sustainability. However, the FTN reported that, in its survey of members, 68% felt that restricting any pay award to 1% for 2013/14, as set out in the pay remit, was appropriate.
1 Monitor (2012), Review of NHS Foundation Trusts’ Annual Plans (2012/13). Available at: http://www.monitor-nhsft.gov.uk/home/browse-category/reports-nhs-foundation-trusts/reviews-nhs-foundation-trusts-annual-plans/review.
49
4.14 The FTN said that its financial monitoring over the past 18 months had illustrated that the original headline 4% efficiency challenge suggested by the Department of Health was on the low side of reasonable estimates and a FTN survey, at April 2012, showed that baseline efficiency plans were at 4.4% with a downside reported of 5.5%. The FTN also quoted some of the findings of Monitor’s review of NHS Foundation Trusts’ annual plans for 2012/132 namely: the step change in CIPs; planned reductions in clinical staff; and CIPs relating predominantly to pay costs. The FTN reported that there were other pressing, transformative issues to be tackled particularly the rigidity of embedded annual pay increases created by incremental progression and other awards.
Devolved Administrations
4.15 The SGHSCD stated that all pay policy for NHS staff in Scotland must be set in the context of the finance made available by the Spending Review outcomes. The real terms reduction in the Scottish Government budget for 2011/12 to 2014/15 had required tough decisions about expenditure. The health budget had received the full health resource Barnett consequentials over this period which would lift the resource cash budget by 2.7% to £11.3 billion in 2013/14. Overall, NHS Boards would have additional cash funding of 3.3% in 2013/14 to meet pay and non-pay pressures. The SGHSCD reported that the ageing population, new technology and the costs of drugs meant that the NHS faced considerable budget pressures.
4.16 Although the NHS had been shielded from the degree of savings required of other public services, the SGHSCD reported that NHSScotland had to make 2.2% cash releasing efficiency savings in 2013/14 beyond the cash uplifts to achieve financial balance. Achieving these efficiency savings would be difficult requiring service redesign while maintaining and enhancing the quality of care. The SGHSCD concluded that the application of Scotland’s public sector pay policy in NHSScotland was affordable but all increases in the pay bill will put pressure on budgets.
4.17 The WG told us that a 1% pay award for NHS employed staff was estimated to cost approximately £30 million. In the WG’s draft budget published on 2 October 2012, NHS funding had been protected in cash terms for the remainder of the current Spending Review until 2014/15. However, the WG emphasised that any additional costs to the NHS arising from pay awards would have to be met through further efficiencies and cost reductions in addition to savings required to meet non-pay inflation costs and increases in demand and new technologies. NHS organisations would need to make cash releasing savings of approximately 5% (or £250 million) per annum.
4.18 The DHSSPSNI informed us that the Northern Ireland budget 2011-2015 set out reductions in current and capital spend imposed by the UK Government as part of the 2010 Spending Review. The DHSSPSNI added that: efficiency and productivity improvements would be essential to meet key targets within current resources; the high proportion of expenditure on pay had significant implications for the availability of resources to support staff and deliver public services; and public sector tightening had a particular impact in Northern Ireland because of its relatively large public sector workforce.
4.19 The DHSSPSNI stated that its expenditure allocation would increase by 2.7% (0.0% in real terms) in 2013/14. While allocations provided for an 8% cash uplift over 2011/12 to 2014/15, by the end of the period this represented a real terms decrease of 2.7% when measured against 2010/11. The DHSSPSNI commented that there was a material and widening gap between resources available and the best estimate of the minimum costs of maintaining existing Health and Social Care services broadly comparable to
2 Monitor (2012), Review of NHS Foundation Trusts’ Annual Plans (2012/13). Available at: http://www.monitor-nhsft.gov.uk/home/browse-category/reports-nhs-foundation-trusts/reviews-nhs-foundation-trusts-annual-plans/review.

50
the status quo. The funding gap in 2013/14 was considered to be some £150 million with measures identified requiring significant policy and service change. The DHSSPSNI estimated £220 million in 2013/14 of inescapable cost pressure arising from existing Ministerial commitments, demographic change and organisational restructuring which included £35 million to meet anticipated increases in the pay bill (compared with £22 million in 2012/13). The DHSSPSNI concluded that the significant pressures on the budget meant that there was no flexibility to afford pay cost increases in excess of the 1% identified without impacting directly on patient care.
Staff Bodies
4.20 The Staff Side noted that the Spending Review announced an increase in the Departmental Expenditure Limit of 2.65% a year. However, with inflation forecasts, the Staff Side commented that the UK Government’s funding actually represented a cut to the NHS budget in real terms. They added that the National Audit Office (NAO) also suggested that spending will fall by 2.3% in Wales, by 0.6% in Scotland and by 0.4% in Northern Ireland over the course of the Spending Review.
4.21 The Staff Side referred to their IDS Staff Survey on how organisations were responding to the financial challenges. 65% of respondents replied that restructuring or reorganisation of services was ongoing within their workplace or department with 61% reporting a recruitment freeze, 59% reductions in posts and 31% cuts in services. Other respondents commented that downbanding (25%) or changes to terms and conditions (27%) were being implemented. The Staff Side commented that the NHS workforce had been actively involved in the range of programmes aimed at finding further efficiencies within the health systems and was working with healthcare organisations to investigate and demonstrate the value of standardising patient pathways.
4.22 The Staff Side said that the NHS in England recorded a surplus of £1.6 billion for 2011/12. This was an increase on the previous two financial years and a surplus had been achieved in every one of the last six financial years at a cumulative value of almost £8.6 billion. In addition, the Staff Side pointed to the net surplus of £509 million for Foundation Trusts in the nine months to 31 March 2012. The NAO reported that the combined surplus for SHAs, Primary Care Trusts, NHS Trusts and Foundation Trusts in England was £2.1 billion in 2011/12. In Wales, the three NHS Trusts recorded a small surplus as did the seven Health Boards in 2010/11. In Northern Ireland, the health service recorded a surplus of £174 million in 2010/11. The Staff Side concluded that the service had managed its resources effectively to stay well within its budget and, therefore, the financial challenges were not down to costs expanding beyond allocated funds but the political decision to impose a budget on the NHS that failed to meet the level of anticipated demand.
4.23 On the impact of incremental rises, the Staff Side acknowledged that this was a real cost pressure but repeated their view that incremental progression was a separate issue from basic pay and therefore should not be seen as income in lieu of a pay rise. The Staff Side’s analysis indicated that the change in the pay bill resulting from the planned incremental increase was 1.4% when taking account of the net impact of staff leaving the service. However, the Staff Side noted the Department of Health’s 2012 review that estimated that incremental rises represented a 1% annual uplift in the wage bill. The Staff Side added that 32% of NHS staff received no benefit from incremental progression as they were at the top of their pay band.

51
NHS Payment by Results (PbR) Tariff
4.24 NHS Trusts receive a substantial proportion of funding through the NHS PbR tariff. To complete the picture on the affordability evidence and in the light of evidence from the employer bodies, we reviewed the uplift in the PbR tariff since 2009/10 (see Table 4.4). This shows that changes to the tariff break down into two parts – an increase to reflect pay and price inflation within the NHS and a decrease to reflect the efficiency requirement. The proposed tariff for 2013/14 includes an uplift for pay and price inflation of 2.7% and a reduction for the efficiency requirement of 4.0%.
Table 4.4: NHS PbR tariff uplifts3
Pay and price Efficiency Net tariff uplift Tariff year inflation (%) requirement (%) (%)
2009/10 4.7 -3.0 1.7
2010/11 3.5 -3.5 0.0
2011/12 2.5 -4.0 -1.5
2012/134 2.2 -4.0 -1.8
2013/145 2.7 -4.0 -1.36
Reports on NHS Finances and Productivity
4.25 Several reports examining productivity in the NHS have been undertaken since we submitted our Twenty-Sixth Report. The King’s Fund has produced quarterly reports since April 2011 on the changes and challenges faced by the NHS. In its latest report7 in September 2012, and following a survey of NHS finance directors, the King’s Fund commented that the majority of NHS Trusts were confident in their finances for this financial year. However, longer term that was not the case and in 2013/14 many finance directors considered that savings and productivity gains would become harder to deliver. Some 40% of respondents expected patient care to worsen over the next few years and the majority thought that there was a high risk that the NHS would not deliver on its £20 billion productivity target by 2015.
4.26 The Nuffield Trust undertook a programme of research examining the scope for greater efficiencies by NHS providers and commissioners of care. As part of this programme, the Nuffield Trust commissioned a report entitled Can NHS hospitals do more with less?8. The report sought to identify the main lessons from previous attempts to achieve greater technical efficiency within health systems and focused on what it considered to be the key determinants of technical efficiency in hospitals including leadership, management and staff engagement, technology adoption, hospital operational processes, staff productivity and the external policy environment. The report suggested that there were
3 Department of Health (November 2012), A simple guide to Payment by Results. Available at: https://www.wp.dh.gov.uk/publications/files/2012/11/PbR-Simple-Guide-FINAL.pdf.
4 In 2011/12 and 2012/13, some of the efficiency requirement was built into the tariff prices, for example through best practice tariffs.
5 Department of Health (December 2012), Draft Payments by Results Guidance for 2013-14. Available at: https://www.wp.dh.gov.uk/publications/files/2012/12/Draft-PbR-Guidance-for-2013-14-not-accessible.pdf.
6 In addition, tariffs will increase on average by an additional 0.2% in recognition of changes in underlying costs faced by providers. The change in tariff prices is therefore -1.1%.
7 The King’s Fund (Sept 2012), How is the NHS performing? Available at: http://www.kingsfund.org.uk/sites/files/kf/field/field_publication_file/how-is-the-nhs-performing-quarterly-monitoring-report-sept12.pdf.
8 The Nuffield Trust (Jan 2012), Can NHS hospitals do more with less? Available at: http://www.nuffieldtrust.org.uk/publications/can-nhs-hospitals-do-more-less.

52
considerable efficiency gains that could be made by the NHS in England with one of the strongest findings being that good leadership and effective general and clinical management were crucial for making productivity gains.
4.27 The NAO examined progress in the NHS towards meeting the efficiency targets in 2011/12 and whether the NHS was well placed to deliver savings over the next three years9. The Department of Health stated that the NHS achieved close to all of the savings forecast for 2011/12 (£5.8 billion of an anticipated £5.9 billion). However, the majority of the reported savings were made through contractual means used by the Department of Health such as reductions in tariff and the public sector pay freeze. The NAO did have concerns with the accuracy of the savings and estimated that up £520 million of the reported savings for 2011/12 were non-recurrent. The NAO also reported on the variation in performance between Trusts with 31 Trusts ending the year with a combined deficit of £307 million. The NAO considered that the NHS had started by making the easiest savings first and that limited action had been taken by the NHS to transform services. However, the NAO noted that these efficiency savings occurred whilst the NHS maintained or improved its performance against key indicators of quality.
Our Comment
4.28 It is clear to us that NHS finances will be constrained in the coming years and will necessitate difficult decisions taking into account service developments, activity growth and pay. However, the Department of Health stated to us that the UK Government had provided sufficient funding for the NHS to support an average headline pay increase of up to 1% in 2013/14. We also note that the Devolved Administrations confirmed that funding was tight but that they would provide funding for a basic pay uplift of up to 1% or, in its specific case, for the Scottish Government to fund its public sector pay policy.
4.29 By contrast in England, employer bodies considered that financial pressure would be created by increased pay bill costs unless Trusts received the full funding for a pay increase through the PbR tariff. We are not convinced by the employer bodies’ arguments that pay awards are not fully funded in the calculation of the tariff uplift. We note that if the basic pay award for 2013/14 was lower than 1% in the NHS, the tariff would not change and Trusts would receive the same level of income all other things being equal. We therefore conclude that, across the NHS, employers should be in a position to fund an AfC pay award of 1%.
4.30 We accept that, in the context of affordability, employers have the flexibility to decide their budgets, including funding for pay and workforce structures, but we are not convinced that NHS pay levels should be the first or main method used by Trusts to meet their efficiency targets. Where such savings are to be found, they should be combined with the longer term imperative for Trusts to shift to transformational, recurring efficiency savings and delivering productivity improvements. The Department of Health also suggested that a pay award lower than 1% might allow the remaining funding to be used on other issues such as increasing staff numbers or improving patient services. We regard such a strategy as a separate matter for the NHS as a whole and for individual Trusts.
4.31 We are very aware that the achievement of longer term sustainable change is vital in order for Trusts to be able to deliver adequate and effective patient care and outcomes. Research reports suggest that Trusts have, perhaps understandably, taken the easiest, short term options to find savings rather than at the same time undertaking the transformational change required to deliver major savings. The Department of Health has indicated that QIPP may become a long term strategy for the NHS in England. Against
9 National Audit Office (December 2012), Progress in making NHS efficiency savings. Available at: http://www.nao.org.uk/publications/1213/nhs_efficiency_savings.aspx.
53
this background and to support the required changes, we reiterate the recommendation in our Market-Facing Pay Report10 that employers in the NHS should have a more strategic approach to pay in general and to using AfC flexibilities.
4.32 Finally on affordability of pay awards, our assessments need to be informed by the most accurate data available on pay drift. The parties’ evidence can often distort the position on affordability particularly if simply valuing the effect of pay increments without accounting for workforce change. In evidence, the parties provided us with differing figures relating to pay drift within the NHS for AfC staff. NHSE estimated a pay bill pressure from incremental progression of around 2% for the average trust, the Staff Side suggested the change to the NHS pay bill resulting from planned incremental progression was 1.6%, while the Department for Health calculated that pay drift for basic pay stood at 1% per annum. We consider that the methodology used by the Department of Health is comprehensive and provides the most appropriate estimate of annual pay drift for our purposes. We therefore ask the Department to share its methodology with the other parties so that it can be adopted when presenting evidence to us. We also request that similar data are provided for Scotland, Wales and Northern Ireland in future evidence.
10 NHSPRB (2012), Market-Facing Pay: How Agenda for Change pay can be made more appropriate to local labour markets, TSO (Cm 8501), paragraph 7.47 and recommendation 7.

54
Chapter 5 – Pay Proposals and Recommendations for 2013/14
Introduction
5.1 We draw together in this chapter the main strands of evidence relating to the remit for this pay round and our standing terms of reference. We consider the evidence presented on pay proposals and then arrive at our recommendations for 2013/14. In doing so, we reiterate our main conclusions from the earlier chapters of this report on each element under consideration for this remit and, where relevant, the key themes (as set out in Chapter 1) that have influenced our conclusions.
5.2 The UK Government’s early announcement of public sector pay uplifts that average at 1% will have influenced the expectations of AfC staff that they will receive this uplift in 2013/14 particularly among those who experienced a two-year pay freeze in 2011/12 and 2012/13. Within the restrictions placed on our remit, we have considered a wide range of pay options including a uniform pay uplift, targeting the low paid, the Scottish Government’s approach, and whether non-consolidated pay awards would be appropriate. In addition, we have examined specific pay adjustments such as the compression of AfC pay points 15 and 16 following two years of targeting the lower paid, and whether to return to our usual practice, as set out in Section 4 of the NHS Terms and Conditions of Service Handbook, of reviewing HCAS minima and maxima and uprating in line with the overall pay award. We consider these in turn below.
Basic Pay Uplift
5.3 The CST’s letter stated that, in 2013/14, the UK Government will limit public sector pay uplifts to an average of 1% in each workforce. The CST’s letter also asked us to focus on considering how the 1% will be divided within our remit group. The Department of Health’s remit letter asked us to make recommendations of up to an average 1% for the basic pay of NHS staff falling within our remit adding that we should consider whether some staff groups warranted pay increases of more or less than 1% as long as, overall, the increase did not exceed an average of up to 1%.
Evidence from the Parties
Department of Health
5.4 The Department of Health stated that the UK Government had provided sufficient funding for the NHS to support an average annual headline pay increase of up to 1% for NHS staff in 2013/14. It invited us to make recommendations on how this might be best distributed taking account of the fact that recruitment, retention and motivation of NHS staff remained strong, 60% of AfC staff received annual incremental pay rises of between 0.6% and 6.7% (averaging at about 3.5%) and that any element of these funds not used for pay would be retained in the NHS and might be better employed on other issues such as increasing staff numbers or improving patient services. In making our recommendations, the Department invited us to consider balancing the public’s aspirations for continuing NHS service improvements on the one hand, and pay levels necessary to deliver a workforce of the required size, skill, motivation and morale on the other.
5.5 The Department considered that the uplift was not about maintaining or increasing the real purchasing power of NHS staff based on any particular price index, nor was it about maintaining parity with the pay of any particular group of workers.

55
Employer Bodies
5.6 NHSE considered that there was cross-Government and employer agreement on the need for pay restraint. In view of the need to achieve unprecedented levels of efficiency savings, restraining pay bill costs remained a key priority for employers. NHSE added that increases in pay costs would create considerable financial pressure unless fully funded through the PbR tariff.
5.7 NHSE said that if any pay award was made, it should be as low as possible, ideally with no increase in the scales, not necessarily as much as 1% and paid equitably to all staff groups. NHSE did not consider that increases in national pay rates from April 2013 were either necessary or affordable. Individual employees continued to enjoy pay progression as they moved up incremental steps which averaged 3.4%. NHSE added that there was no compelling labour market evidence which suggested the need for particular categories of staff to have differential pay increases in 2013/14. NHSE did not consider that there was strong evidence to support differential awards and that the extent of differentiation achievable within an award averaging 1% would be very limited. Any benefits might well be outweighed by the complexity of implementation and could potentially damage the morale of staff receiving a lower award than their colleagues. Higher awards to some staff groups would be unlikely to be at a level significant enough to make much impact on recruitment, motivation or morale.
5.8 NHSE highlighted that in the last two pay rounds, staff earning under £21,000 were awarded flat rate increases of £250 which added around 0.2% of cost pressure to the total pay bill. NHSE were not aware of any evidence that would support the case for a targeted award for the lowest paid groups and stated that any differential increase may produce further issues relating to compressing of the gaps between pay points and/or leapfrogging. NHSE also pointed out that, even after the increase to the National Minimum Wage on 1 October 2012, the lowest paid in the NHS will have an hourly wage which was 17% higher than the minimum wage.
5.9 The FTN conducted a survey of its members and reported that 68% felt that restricting any pay award to 1% for 2013/14, as set out in the pay remit, was appropriate. In presenting its evidence, the FTN stated that the majority of FTN members (68%) were clear that 1% was the absolute maximum amount which could be “tolerated” and there was support for the award to be less. In addition, the FTN said that any award for 2013/14 should be provided for in the tariff and should not result in an additional efficiency requirement.
5.10 The FTN said that the determination of the pay award must be seen in the context of the whole pay system and the unprecedented financial challenge. They considered that to award an increase when providers were already struggling with delivering cost containment, protecting jobs and improving care would put providers under severe duress and compromise fiscal sustainability. Given the current general financial environment, specific efficiency challenges facing providers and that there were very few retention and recruitment issues that could be solved by a pay award, the FTN recommended that there should be no pay increase for NHS staff in 2013/14.
5.11 The majority of respondents to the survey by the FTN said that, if an award was made, it should be allocated equally across all staff groups and opinion was divided amongst the remainder regarding whether the award should be distributed on a national or local basis. The FTN considered that there was a risk of pay drift arising from differential awards should they be given to sections of the workforce in recurrent years.

56
Devolved Administrations
5.12 The Scottish Government announced its public sector pay policy1 on 20 September 2012 which had three strategic aims:
• To make sure public sector pay settlements were affordable, sustainable and, through the targeting of resources, delivered value for money;
• To provide flexibility within an overarching policy of pay restraint for public bodies to provide support for the lowest earners and their workforce priorities; and
• To continue to work towards making sure that pay was fair and non-discriminatory and protected jobs and services.
5.13 The SGHSCD told us that the policy comprised: a 1% cap on the cost of the increase in basic pay; a pay freeze for staff earning £80,000 and above; and supporting the lower paid through the Scottish Living Wage (which increased to £7.45 per hour as announced on 5 November 20122) and all staff earning less than £21,000 to receive a minimum basic pay increase of £250. Within this pay proposal was a commitment to no compulsory redundancies. The Cabinet Secretary for Health and Wellbeing reaffirmed in his remit letter of 26 September 2012 that the one-year pay policy for 2013/14 will apply to staff covered by the AfC Agreement. While recognising that its approach was likely to lead to differences between Scotland and other parts of the UK, the SGHSCD assured us that Scotland remained committed to the AfC pay system.
5.14 The WG did not consider that there was any compelling reason to move away from the recommended 1% award advocated in the Autumn Budget in view of the continuing healthy recruitment and retention position for staff. The WG did not consider that there was any compelling reason for differential awards to be made for different categories of staff. The DHSSPSNI highlighted that the significant pressures on Northern Ireland budgets meant that there was no flexibility to afford pay cost increases in excess of the 1% identified without impacting directly on patient care. The DHSSPSNI asked us to make recommendations for 2013 on the distribution of the available funds of 1%.
Staff Bodies
5.15 The Staff Side asked us to recommend that NHS pay rates were raised, protecting their real value against prevailing inflation rates, making a significant contribution toward addressing the major deterioration in NHS earnings that had seen the majority of staff suffer a 9% cut in living standards over the last two years.
5.16 While inflation had declined from its peak in 2011 when it consistently exceeded 5%, the Staff Side observed that the gap between the NHS pay award and the rate of increase in the cost of living that opened up during 2010 has been sustained over the past year. The Staff Side considered that even if a return to more modest inflation rates turns out to be true, inflation for 2013 would still be taking additional bites out of the value of NHS wages if the annual rise was limited to 1%.
5.17 The Staff Side provided a series of examples of actual AfC salaries compared with salaries if in line with RPI inflation. The effects of RPI inflation on AfC Bands 1, 3 and 5 between 2007 and 2012 were provided. From these examples the Staff Side estimated that the gap between salary and RPI inflation for a Band 1 worker was 6% (£875) and for a Band 3 worker was 7% (£1,495). The Staff Side further argued that a combination of inflation and the pay freeze through to 2013 would lead to a loss of 11% (£3,500) on the value of a Band 5 worker’s salary and a loss of 12% (£6,400) for a Band 8a worker.
1 Available at: http://www.scotland.gov.uk/Publications/2012/09/7426/2.2 Available at: http://www.scotland.gov.uk/News/Releases/2012/11/Livingwage051112.
57
5.18 The Staff Side continued to consider that the RPI measure of inflation represented the best measure of changes in prices faced by NHS staff, as it included the housing costs that form a significant part of most employees’ expenditure. RPI remained the most widely used measure as the basis for pay negotiations across the public and private sectors3. Long term studies of the impact of inflation on different income groups still suggested that low income groups suffered disproportionately.
5.19 The Staff Side noted that pension contributions had also increased and added to the cost of living experienced by NHS staff. Over the 2012/13 period, employee contribution increases had been introduced for staff who earn in excess of £26,557 that reduced their take-home pay by between 1.5% and 2.4% and therefore all staff at the top of Band 5 or above would experience further reductions in the value of their wages over 2012/13 in addition to the inflationary impact.
5.20 The IDS Staff Survey results provided by the Staff Side reported an upsurge in the number of respondents reporting that they felt worse off than 12 months previously. The survey also showed that the proportion of staff relying on some additional form of payment to supplement their basic salary in order to sustain their standard of living had also grown since 2010 to reach 54% of the workforce in 2012. The survey asked respondents about the level of satisfaction relating to their pay – just a quarter (26.5%) stated they were very or fairly satisfied with pay and a half (50%) that they were fairly or very dissatisfied. The Staff Side considered that the survey’s findings relating to satisfaction with pay levels mirrored those found in the 2011 NHS Staff Survey which found that just over a third (38%) were satisfied with their level of pay while a similar number (34%) were dissatisfied. The majority of respondents (78%) to the IDS survey regarded the current UK Government pay policy as unfair and a higher number (89%) viewed the proposals for 2013 to 2015 as unfair.
5.21 The Staff Side asked us to make a recommendation for an additional pay rise for staff earning up to £21,000 in recognition of the additional pressures that inflation has placed on workers at the bottom end of the pay scale and that this addition should recognise £250 as the minimum uplift. The Staff Side also considered that no NHS employee should be paid less than the Minimum Income Standard4 and, therefore, they supported additional increases for staff on AfC pay points 1-6 to bring them closer to the Minimum Income Standard. In response to our supplementary questions, the Staff Side also commented that the minimum pay level in the NHS should be set at least at that for the Living Wage. They said that historically the lowest pay points on AfC had been above the Living Wage. However, following the announcement that the Living Wage would increase from April 2013 (to £7.45 per hour UK rate and £8.55 per hour London rate), even with a £250 increase, AfC pay point 1 would require an additional increase of £164 to bring it in line with the UK Living Wage.
5.22 UNISON considered that long term studies of the impact of inflation on different income groups still suggested that low income groups suffered disproportionately. UNISON took an example NHS wage of £25,000 in 2000 and tracked the net impact of pay awards and inflation. UNISON argued that the real value of the wage increased to £26,146 by 2005, but the gap between inflation and the pay award meant that the real value had now dropped to £23,490.
3 Incomes Data Services, Pay in the Public Sector 2007.4 Joseph Rowntree Foundation (July 2012), A minimum income standard for the UK in 2012. Available at: http://www.
minimumincomestandard.org/downloads/2012_launch/mis_report_2012.pdf.
58
5.23 The RCN suggested that the data it provided, which stated that the main reasons cited for considering leaving the NHS were levels of pay and high levels of stress/workload, demonstrated the disproportionate impact of rising inflation and pay restraint on lower paid workers in the NHS and for this reason it called for protections to be made for lower paid members of the NHS workforce.
5.24 The RCM did not agree with an overall 1% pay increase for AfC staff and considered it an insufficient reward that was out of line with inflation. Following two years of pay freezes, the value of NHS pay had significantly reduced and to have a 1% uplift for the next two years would further damage the value of NHS pay. The RCM considered that if the rewards were not seen to be sufficient this could have the effect of deterring students from choosing Midwifery as a career.
5.25 The RCM did not agree that there should be an unequal pay increase across the bands and felt that there should be a 1% uplift for all staff. The RCM were concerned that unequal pay increases disproportionately affect part time staff and could result in anomalies in the pay structure where higher pay bands have lower pay.
5.26 Unite commented that the two year pay cap at an average of 1% was another real terms pay cut and below private sector pay which ran at 2.5% in 2011 and 3% in 2012. Unite highlighted that the rate of inflation was projected to be consistently above 1%. Unite argued that all those working in the NHS should be protected from a fall in living standards and receive a fair pay increase. It considered that the loss of purchasing power due to inflation, particularly on the lower grades, should not be underestimated. Unite supported the use of a bottom loaded flat monetary pay increase across all grades as this would help to reduce pay inequality across the pay spine while also making sure that the pay increase was of more value to the lower grades of the spine.
5.27 NIPSA stated that, with inflation running in excess of 2% and with the real terms decrease in the buying power of Health and Social Care workers, below inflation increases were not appropriate and that any pay increase needed to reflect the current and past inflationary measures. NIPSA stated that in Northern Ireland during the period of the Review of Public Administration a higher proportion of those jobs that were lost were administrative and clerical as opposed to managerial and front line posts. NIPSA therefore considered it important that pay increases reflected the position of those more vulnerable groups that have borne the brunt of government cutbacks to date.
Our Comment and Recommendation
5.28 Our recommendation on the basic pay uplift for AfC staff is driven by the constraints of the UK Government’s public sector pay policy, staff expectations of a 1% pay award, our assessment of affordability and the importance of supporting AfC staff motivation and engagement.
5.29 There are no general recruitment and retention problems across AfC staff although we wish to keep specific occupational groups under review. Current labour market indicators and pay settlements generally are not currently putting pressure on AfC pay. It is not clear from forecasts when and to what extent the labour market will pick up but should it do so the NHS will need to remain a competitive employer.
5.30 In our view, a uniform approach to pay awards would support AfC staff motivation following a two-year pay freeze during which some protection was provided to the lower paid. There are indications in the NHS Staff Survey, the IDS survey conducted for the Staff Side and from our visits to NHS establishments that motivation and morale are being tested by workload and financial pressures in the NHS. The latest NHS Staff Survey in 2011 showed a slight deterioration in staff motivation at work, job satisfaction and staff intention to leave jobs. More recently, the 2012 IDS survey highlighted that two-thirds of
59
AfC staff felt morale was worse than a year ago citing reasons as workplace stress, NHS restructuring, pension changes and the falling value of take-home pay. Also in the IDS survey, the proportion of staff “very seriously” considering leaving their NHS post had risen to one-third with similar reasons to those affecting morale.
5.31 Pressures are building putting at risk staff goodwill and, in consequence, their willingness to contribute to necessary improvements in the design, delivery and quality of services to patients. We recognise from staff survey results that staff motivation is connected closely to workload and stress which might be addressed more effectively by better communication, staff engagement, and by appropriate levels and quality of staffing. We were invited by the Department of Health to consider pay awards of up to 1% for AfC staff including its suggestion that a lower pay award might allow funds to be better employed on increasing staff numbers or improving patient services. We regard such a strategy as a separate matter for the NHS as a whole and for individual Trusts. We conclude that any overall pay award below the UK Government’s announced average of 1% would have an additional detrimental effect on staff motivation, given the expectations raised among AfC staff and the major challenges in the NHS. We also consider that a pay award slightly under 1% would do little to relieve Trusts’ longer term financial constraints. Moreover, Trusts are in varying financial positions, with different staff mixes, and we consider it unfair to hold back pay for those AfC staff in well-run Trusts because other Trusts are less financially stable.
5.32 We note that the Department of Health and the Devolved Administrations have confirmed that the NHS will be funded for a 1% pay award in 2013/14. We conclude that, across the NHS, employers should be in a position to fund an AfC pay award of 1%. We recognise the financial pressures in the NHS but we are not convinced that pay levels should be the primary method for Trusts to mitigate the impact of meeting their efficiency targets. There is an imperative for NHS Trusts to achieve a greater shift towards significant transformational change and redesign of services to patients, which will release the major savings required across the NHS.
5.33 We also note that incremental progression within the AfC pay system means that the majority of staff (58%) received pay increases averaging 3.4% (weighted by number of staff eligible) in addition to any overall pay award. However, net pay drift is somewhat less at around 1% for AfC basic pay and accounted for within the pay and prices uplift in the NHS tariff system. We would welcome some consistency in the parties’ evidence on pay drift and therefore urge agreement to the Department of Health’s revised methodology to calculate pay drift as this represents closely the actual pay drift costs incurred by employers. In this context, the NHS Staff Council is discussing proposals from April 2013 to draw a closer link between AfC incremental progression and local performance standards which, in our view, if operated effectively should support improved productivity and service change. On a general point, we reiterate our recommendation in our Market-Facing Pay Report5 that Trusts should have a more strategic approach to AfC flexibilities which should be reflected in more transparent and open pay, recognition and reward policies.
5.34 We have considered whether there is any evidence to support pay differentiation in making recommendations for AfC staff as required under the remit for this report. The Staff Side and individual unions presented cases for additional pay increases for staff paid £21,000 or less (a £250 minimum), for AfC pay points 1-6 to bring them closer to the Minimum Income Standard, and for AfC pay point 1 to bring it in line with the UK Living Wage.
5 NHSPRB (2012), Market-Facing Pay: How Agenda for Change pay can be made more appropriate to local labour markets, TSO (Cm 8501), paragraph 7.47 and recommendation 7.
60
5.35 We are not persuaded by the labour market evidence that there is a case for a differential award for lower paid AfC staff. We continue to recognise the Staff Side’s arguments that inflation rates have reduced real wages for AfC staff. However, the UK Government’s public sector pay policy for 2011/12 and 2012/13 offered some protection for public sector workers paid £21,000 or less although this policy was not based on specific evidence related to the labour market. Our analysis of the impact of this pay policy on illustrative AfC take-home pay since April 2010, excluding the impact of inflation, confirms that AfC staff in lower pay bands have had better protection in recent years through annual pay awards, pension contribution rates and tax changes in comparison with other AfC staff, particularly those at the top of higher pay bands. Moreover, we observe that policy on the appropriate level of pay in relation to the Minimum Income Standard and the Living Wage is a matter for each of the four Governments alongside other relevant issues (e.g. tax and benefits). We would comment on such issues only where there is a direct impact on the recruitment and retention of AfC staff.
5.36 In addition, any pay differentiation in favour of the lower paid would have led to offsetting that differentiation against the overall pay award to remain within the UK Government’s 1% average. This would have had a significant impact on AfC staff who also experienced the full impact of the pay freeze for the last two years. Continuation of pay differentiation with a £250 increase for staff paid £21,000 or less, as suggested by the Staff Side, could create anomalies such as further compression between AfC pay points. The Staff Side proposal would also result in staff paid between £21,000 and £25,000 (including newly qualified clinical staff) receiving a smaller cash increase if applying a 1% pay uplift than those paid £21,000 or less. We also heard anecdotal evidence from employer bodies in England that suggested increasing pay levels for lower paid AfC staff might add to the cost pressures when competing for contracts with other service providers. One effect of this could lead employers to consider outsourcing services on grounds of cost effectiveness in some parts of the UK.
5.37 Our deliberations included whether non-consolidated pay awards might be appropriate as it might enable them to be targeted at, for instance, those AfC staff at the top of pay bands who may have been most affected by the pay freeze. However, such awards would also be curtailed by the requirement to remain with the 1% average, and would be at the expense of the pay awards of other AfC staff. On a general point, we would welcome the parties’ views on whether this approach and any other targeting mechanisms might have some merit for the future.
5.38 The Scottish Government also presented its public sector pay policy which included pay differentiation. We recognise that differences from the UK Government’s public sector pay policy are matters for the Scottish Government and that this is a policy decision applying across the public sector in Scotland and not especially to AfC staff. As part of this policy, we note the intention for a further increase in the Scottish Living Wage to £7.45 per hour from April 2013 and that AfC pay rates will be unaffected.
5.39 As mentioned above, we see no direct labour market evidence for targeting lower paid AfC staff and no specific recruitment, retention and motivation issues relating to AfC staff in Scotland beyond those applying across the UK. We also see no specific evidence to freeze the pay of AfC staff earning over £80,000 and, in fact, our analysis of illustrative AfC take-home pay since April 2010 indicates that those staff in the higher pay bands have fared relatively less well than the lower bands in recent years. Additionally, the ONS analysis of public-private sector pay differentials suggests that private sector workers earned more than the public sector at the higher percentiles. Having assessed all the evidence under our terms of reference, we consider that our recommendation for AfC staff should apply on a consistent basis across the UK.
61
5.40 On the overall pay uplift for AfC staff, we conclude that the major influencing factors are the constraints of the UK Government’s public sector pay policy, staff expectations for a 1% uplift, affordability considerations, and the need to support staff motivation and engagement as an essential ingredient to underpin better quality of care to patients. From the evidence presented, a 1% pay award for AfC staff is, in our view, affordable for employers across the NHS. We have looked separately at the cases presented by the Staff Side and the effects of relative changes to illustrative AfC take-home pay across the bottom, middle and top of pay bands. We see no compelling evidence for a differential pay award which could have a detrimental impact on other AfC staff when remaining within the UK Government’s 1% average. We consider a uniform pay uplift is the most appropriate response and note that, in general and if any award was to be made, the Health Departments, employer bodies and the Staff Side favoured a uniform 1% uplift as a greater priority than any targeting of pay awards. We also conclude that a uniform pay uplift is appropriate given that all AfC staff are expected to contribute to significant changes across the NHS.
Recommendation 1. We recommend a 1% increase to all Agenda for Change pay points from 1 April 2013.
Compression of AfC Pay Points 15 and 16
5.41 The Department of Health’s remit letter asked us to consider the impact of AfC pay differentials as a result of the £250 increase for staff earning less than £21,000 during the pay freeze period. We commented in our Twenty-Sixth Report6 that our 2012/13 recommendation for a £250 increase would not produce any overlap between AfC pay points but would narrow the differential between pay points 15 and 16 to only £122. We asked the parties to discuss this issue in time for this pay round.
Evidence from the Parties
Staff Bodies
5.42 The Staff Side proposed that adjustments needed to be implemented to the pay points on the AfC pay scale immediately above point 15 following two successive years of £250 rises for staff earning £21,000 or less and a pay freeze for all others. They pointed to the gap between points 15 and 16 being eroded to a nominal £122. While the average gap between pay points was 3.6%, the increase between points 15 and 16 was worth 0.6%. The Staff Side suggested that as a minimum way of addressing the issue, the award of £250 for staff at point 16 and £125 for staff at point 17 (in addition to the general recommended uplift) would serve to smooth out this differential, leaving the gap between 15 and 16 at 1.8% and the gap between 16 and 17 at 2.3%.
Employer Bodies
5.43 NHSE argued that the Staff Side proposal to address the spacing of pay points 15 and 16 submitted in 2011 evidence would be an expensive way to narrow the gap. NHSE considered that this change would result in around 8% of AfC staff receiving a pay rise on and above their existing increments and the proposed 1% average uplift for all staff. NHSE calculated that this would add around £11 million to the basic pay bill nationally for 2013 and every subsequent year. They also commented that the change would permanently increase the value of the entry points of Band 5.
6 NHSPRB (2012), Twenty-Sixth Report, TSO (Cm 8298), paragraph 3.87.
62
5.44 NHSE commented that, while there were cheaper alternative ways of amending the pay structure to alleviate the small pay gap, all solutions which did not reduce the take-home pay of staff, incurred considerable additional costs to employers. NHSE felt that removing points from the pay scale added a permanent long term cost pressure to the pay bill as the number of years it took individuals to reach the highest salary in their pay band was reduced.
5.45 It was noted by NHSE that the existing spacing of points in the pay scale was not originally designed or maintained with a principle of evenly spaced points. Neither was there any objective precedent for determining the values for appropriate spacing. NHSE did not consider that staff who received a lower value increment this year would be disadvantaged over the long term as they would benefit from larger incremental gaps in future years.
5.46 NHSE were not aware that the narrowed gap caused employers or staff any concerns. Employers would not welcome any unnecessary additional cost pressure in the current financial climate. In the view of NHSE, the additional investment would not result in any tangible benefit to patient care or help address local priorities.
Devolved Administrations
5.47 The DHSSPSNI stated that our recommendations should address the erosion of the differential between AfC pay points 15 and 16 within an overall pay award of 1%.
Our Comment
5.48 The parties have made little progress in resolving the compression of AfC pay points 15 and 16 following our request for further discussions in our Twenty-Sixth Report7. We note NHSE’s view that the narrowed gap had not caused employers or staff any concerns and any solutions would involve unnecessary additional cost pressure. This compression of the AfC pay structure was an inevitable consequence of the UK Government’s policy to offer some pay protection to lower paid AfC staff.
5.49 We have considered the impact of the narrowed gap but conclude that, at this stage, there is no evidence, particularly on recruitment, retention and motivation, that the gap has resulted in any specific concerns. We therefore make no recommendation on this point but we continue to urge the parties to assess the position, specifically any consequences for career pathways, pay progression and impacts on other parts of the remuneration package. Evidence should be presented in our next pay round.
High Cost Area Supplements
5.50 The Parliamentary Under Secretary of State for Health set out our remit for 2013/14 including whether high cost area supplements (HCAS) or any other allowances within our remit should be changed noting that any changes would have to be funded within the 1% cap. The Agenda for Change Agreement also requires us to examine any new cases for HCAS and, although no specific cases were presented for this round, the parties provided general evidence on pay variations (submitted before our Market-Facing Pay Report was announced in December 2012 – see Chapter 1).
7 NHSPRB (2012), Twenty-Sixth Report, TSO (Cm 8298), paragraph 3.87.

63
Evidence from the Parties
Employer Bodies
5.51 NHSE pointed to their evidence for our Market-Facing Pay Report in which they said that the AfC pay system already made some provisions for zonal or regional pay differentiation with additional pay supplements for all staff working in London in the form of high cost area supplements and/or local recruitment and retention premia.
5.52 NHSE repeated its conclusion from its evidence to us for our Market-Facing Pay Report that the payment of HCAS in London or parts of the South East, or a variation of it, could potentially be applied to other geographic parts of England where justified by the evidence. NHSE added that this would provide scope for more market-facing pay in AfC without requiring any significant change to the structure of the pay system. NHSE told us that they had very few representations from employers in relation to adjusting the value of existing HCAS payments. They observed that any increase to the percentages of pay used in the existing HCAS payments would add an unwelcome cost pressure and would put further pressure on service delivery.
Staff Bodies
5.53 In supporting national pay determination allied to AfC, the Staff Side pointed out that the current system was the most appropriate for the NHS and had sufficient flexibilities to respond to local conditions. By setting a floor pay rate and allowing for adjustments in high cost areas or local areas with particular recruitment difficulties, the Staff Side concluded that the pay system allowed geographic variations in the UK labour market. The Staff Side requested that the Health Departments develop a central system for establishing where HCAS and RRP payments were made across the UK along with the level and applicability of payments.
Our Comment and Recommendation
5.54 In our Market-Facing Pay Report8 we conducted an extensive analysis of HCAS alongside other pay measures. We concluded that AfC was the appropriate vehicle through which to develop market-facing pay as it already had positive market-facing features. We recommended a fundamental review of HCAS covering its purpose, funding and the staff Market Forces Factor, its design and zone values, and boundary issues. We also asked the parties to consider review mechanisms to change, add and remove zones, and to change rates. The UK Government accepted our recommendation and we look forward to the parties’ review taking place to inform our next pay round.
5.55 In the meantime, we have reviewed the levels of HCAS minima and maxima in line with our role as set out in Section 4 of the NHS Terms and Conditions of Service Handbook. These were not uprated during the pay freeze from 2011/12 to 2012/13. Our conclusions in the Market-Facing Pay Report were that recruitment and retention indicators for AfC staff were relatively less favourable in London and surrounding areas and that our research pointed to more investment in pay in parts of London rather than outside. Moreover, we do not consider that AfC staff at the HCAS minima and maxima should be disadvantaged when other staff receiving HCAS payments would receive the full effect of the 1% increase to basic pay. Staff receiving HCAS payments will regard these as part of basic pay. We estimate that around 123,000 AfC staff are at the HCAS minima and maxima and a 1% uplift would cost around £6 million or 0.01% of the AfC pay bill.
8 NHSPRB (2012), Market-Facing Pay: How Agenda for Change pay can be made more appropriate to local labour markets, TSO (Cm 8501), Chapter 6 and paragraphs 7.33-7.38.
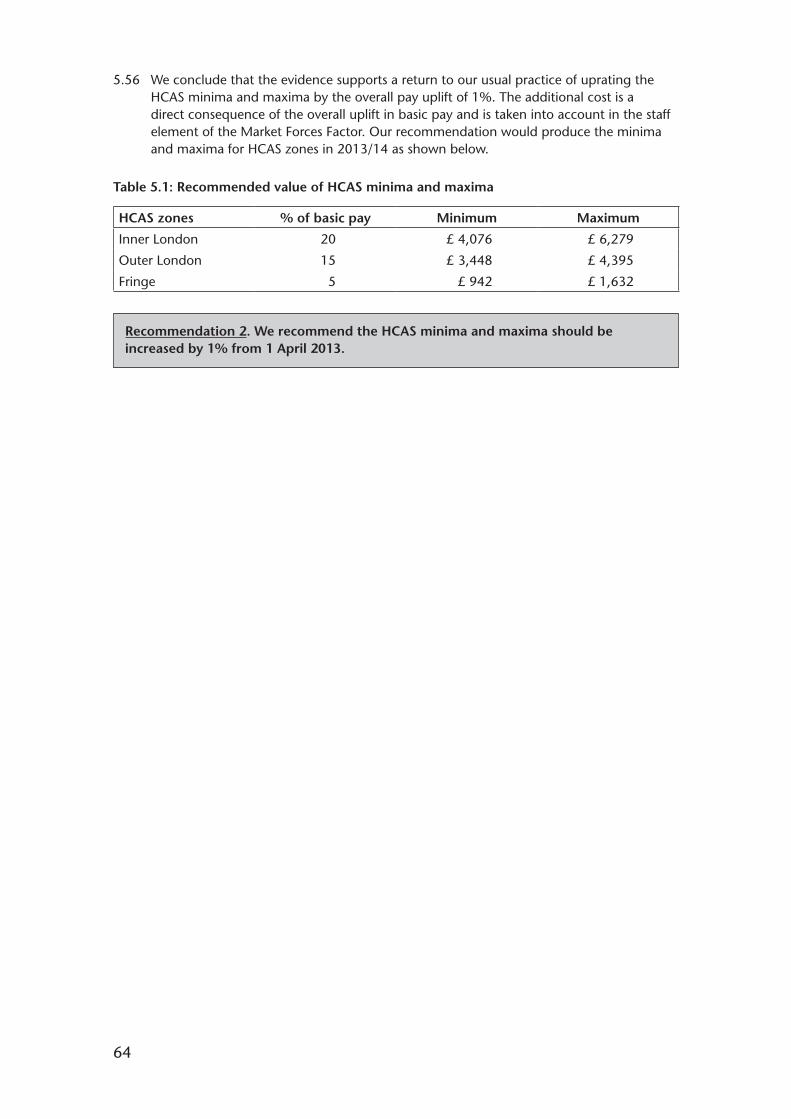
64
5.56 We conclude that the evidence supports a return to our usual practice of uprating the HCAS minima and maxima by the overall pay uplift of 1%. The additional cost is a direct consequence of the overall uplift in basic pay and is taken into account in the staff element of the Market Forces Factor. Our recommendation would produce the minima and maxima for HCAS zones in 2013/14 as shown below.
Table 5.1: Recommended value of HCAS minima and maxima
HCAS zones % of basic pay Minimum Maximum
Inner London 20 £ 4,076 £ 6,279
Outer London 15 £ 3,448 £ 4,395
Fringe 5 £ 942 £ 1,632
Recommendation 2. We recommend the HCAS minima and maxima should be increased by 1% from 1 April 2013.

65
Chapter 6 – A Forward Look
Introduction
6.1 In this chapter we look forward to the environment for our next pay round. We begin by looking forward to progress being made on the recommendations in our Market-Facing Pay Report and to AfC pay developments expected during 2013/14. We then conclude by briefly revisiting the four key messages we commented on in Chapter 1 and throughout this report.
Pay Developments for 2013/14
Market-Facing Pay
6.2 The recommendations in our Market-Facing Pay Report 20121 have been accepted by the UK Government as outlined in Chapter 1. While we concluded that the evidence did not justify investment in additional market-facing pay in the NHS at that time, we did emphasise the necessity of further development of AfC. We also reaffirmed AfC as the vehicle through which to develop market-facing pay mechanisms where necessary as it already has positive market-facing features.
6.3 Specifically, we recommended a fundamental review of HCAS and we are pleased to note that this further work was confirmed by the Secretary of State for Health. We set out the detailed areas for review relating to HCAS and some transitional and implementation considerations. If the parties consider it appropriate, we would be happy to contribute further as the review gets underway.
6.4 We also recommended the appropriate use of local RRP. Again, we made a series of observations on how the local RRP system might be improved including the use of robust business cases, considerations of all pay and non-pay factors, and ensuring NHS Trusts’ capability to manage these local pay arrangements. We recognised that the absence of widespread use of local RRP might suggest few recruitment and retention problems or that local funding was constrained. However, we continue to consider the use of local RRP as an effective measure in addressing specific local occupational shortages. We wish to be kept informed on the improved effectiveness of local RRP against our recommended requirements.
6.5 The final strand of our recommendations was the requirement for AfC to be kept under regular review to ensure it is “fit for purpose”, reflects modern practice and can respond to changing labour markets. We invited the parties to examine how additional freedoms for Foundation Trusts in Annex K of the Terms and Conditions Handbook could be developed to meet local needs. In addition, we recommended that each NHS Trust had a transparent and open pay and reward policy including its use of AfC flexibilities to meet the delivery of local services and to improve patient outcomes. We also emphasised that the parties’ discussions on AfC developments should be brought to a conclusion at a reasonable pace so that local NHS organisations can plan forward with greater certainty.
6.6 We look forward to substantial progress being made on our market-facing pay recommendations during 2013/14 so that the parties can present evidence on progress in autumn 2013.
1 NHSPRB (2012), Market-Facing Pay: How Agenda for Change pay can be made more appropriate to local labour markets, TSO (Cm 8501).

66
AfC Developments
6.7 In evidence presented for this report, the parties provided updates on developments to AfC which were followed by progress in the NHS Staff Council on AfC negotiations in November 2012. We summarise these below.
6.8 The Department of Health told us that both employer and Staff Side representatives acknowledged the positive contribution that AfC had made to help a modern and effective NHS since its inception in 2004. However, they also recognised the need to keep any pay framework under review to ensure it remained affordable, fit for purpose and fair to staff particularly as employers faced significant service and financial challenges. The Department added that a growing number of Trusts were discussing local changes to terms and conditions with their staff and staff representatives. Most prominent was the South West Pay, Terms and Conditions Consortium which appeared to have become “frustrated” about the slow progress made within the NHS Staff Council and had produced two documents2 on the local service and financial challenges and a wide range of options around the role of local pay reform.
6.9 The Scottish Government assured us that Scotland remained committed to the AfC pay system and the Welsh Government told us that it was committed to maintaining national terms and conditions and will engage fully at UK-level with a view to delivering whatever is agreed at an all Wales level subject to the Minister’s approval.
6.10 NHSE said that the national pay and conditions framework needed to be made more affordable in order for employers to sustain the quality of patient care and protect jobs while meeting growing demand and achieving the required efficiency savings. Employers were increasingly asking for pay arrangements to be better aligned to performance and productivity, to be more responsive to local needs and for more flexibility around conditions of service. Most employers would like this to be delivered through changes to the national framework. NHSE added that failure to implement its proposals to the NHS Staff Council risked fragmentation of the national framework as some local organisations would be forced into taking difficult decisions about the balance between pay and conditions and job losses outside the national processes.
6.11 The FTN reaffirmed that it was in favour of national frameworks with local flexibilities. However, 68% of respondents to the FTN survey did not believe that there were sufficient local flexibilities for providers in the current national pay frameworks and numerous respondents indicated the need for a pay and reward system which was capable of responding to individual performance at the local, organisational level. The FTN also referred to the South West Pay, Terms and Conditions Consortium and 56% of its survey respondents indicated a strong interest in exploring similar local or regional approaches.
6.12 The Staff Side and individual unions commented on the uncertainty and apprehension over the future of AfC and national pay determination that had been sown by the review on market-facing pay, the South West Consortium and local initiatives by various Trusts to weaken the AfC Agreement. The Staff Side had “vehemently opposed” proposals by the South West Consortium which they considered would have a detrimental impact on the economy, have serious implications for patient care, necessitate expensive and inefficient negotiating every year, and risk expensive equal pay claims. They would not enter into local negotiations on nationally agreed terms and conditions. Trades unions’ surveys during summer 2012 showed significant support for continued efforts to find a negotiated solution at national level although conditional on a commitment from employers to retaining the national AfC Agreement.
2 Available at: http://meetingthechallenge.info/documents/.
67
6.13 In addition to the parties’ general evidence on AfC developments, we note that on 9 November 2012, the NHS Staff Council (in England) published proposed changes to the NHS Terms and Conditions Handbook3 which would come into effect from 1 April 2013. Proposals were subject to trade union consultation which was underway at the time of submitting this report. The proposals comprised4:
• Incremental pay progression – progression through all pay points will be conditional upon individuals demonstrating the requisite knowledge and skills/competencies for their role and the required standards of performance and delivery as determined locally. Pay progression into the last two pay points for senior staff in Bands 8C, 8D and 9 will become annually earned and retained subject to appropriate local level of performance in a given year;
• Flexibility on senior posts – the extension of the flexibility to apply alternative pay arrangements to posts with a job evaluation score over 630 points (Band 8C) – this currently applies to posts with a job evaluation score over 720 points (Band 9);
• Accelerated pay progression for new entrants to Pay Band 5 – the first two points in six monthly steps to be removed;
• Management of sickness absence – pay during sickness absence to be paid at basic salary level inclusive of any high cost area supplement, not including any other allowances or payments linked to working patterns or additional work commitments. No changes will be made to pay during sickness absence for staff on AfC spine points 1 to 8 and those absent due to a work related injury or disease in the actual discharge of their duties; and
• Guidance on workforce re-profiling – the principles to be followed for workforce re-profiling will be included as a new annex to the NHS Terms and Conditions Handbook.
Our Comment on AfC Developments
6.14 The conclusions from our Market-Facing Pay Report and the evidence for this report indicates strong continuing support for the AfC framework among the UK Government, Devolved Administrations, the Department of Health, employer bodies, the Staff Side and individual trades unions. However, the AfC framework continues to require regular review to respond quickly to NHS priorities and to changes in the labour market including the use of market-facing flexibilities. In this regard, we welcome the current discussions to develop AfC under the NHS Staff Council in England and we would welcome clarification of how the Devolved Administrations intend to respond to the conclusions of these discussions. Again, we stress that such negotiations need to take place quickly with impetus from employers and trades unions so that effective solutions can be implemented at a reasonable pace.
6.15 In 2013/14, we look forward to further information on the range of AfC developments including the outcome of the NHS Staff Council’s discussions, any further proposals for the development of pay and conditions over the longer term, and any initiatives underway by NHS Trusts locally. We also note that the Report of the Mid Staffordshire NHS Foundation Trust Public Inquiry5 was published as we were finalising our conclusions. The recommendations of the Inquiry could have implications, in the longer term, for the AfC framework including their impact on staff engagement. We will keep this under review.
3 Available at: http://www.nhsemployers.org/SiteCollectionDocuments/AfC_tc_of_service_handbook_fb.pdf.4 Further details were published on 7 January 2013. Available at: http://www.nhsemployers.org/PAYANDCONTRACTS/
AGENDAFORCHANGE/AGENDA-FOR-CHANGE-PROPOSALS/Pages/Agenda-for-Change-proposals.aspx.5 Report of the Mid Staffordshire NHS Foundation Trust Public Inquiry (6 February 2013), Chaired by Robert Francis
QC, TSO (HC947). Available at: http://www.midstaffspublicinquiry.com/report.
68
6.16 On a more general point, AfC pay needs to be viewed in the context of strategic developments across the NHS, the policies of the Devolved Administrations and the organisational strategies for individual employers. The AfC framework has been in place since 2004 and has seen a number of minor developments. For our part, we have, in this report and specifically in our Market-Facing Pay Report, encouraged the use and development of existing AfC flexibilities. In our view to achieve a more cohesive approach to AfC pay, a more strategic view is required involving reward and engagement strategies, the HR capacity and capability to implement these strategies, and effective staff involvement and management at all levels of the NHS.
Key Messages for 2013/14
6.17 We conclude this report by summarising the key messages that, in our view, cover the priority actions for the NHS going forward. Progress on these matters will enable us to have a clearer picture of how pay for AfC staff can play its full part in supporting the significant changes underway in the NHS. We would welcome further evidence to our next pay round on each of the following issues.
Delivering Transformational Change
6.18 The affordability of NHS pay awards is a cornerstone of our terms of reference. It is therefore essential that we have clear evidence on financial considerations in the NHS. Employer bodies tell us frequently that affordability of pay is constrained by the need to meet challenging efficiency targets. However, we note from recent research that NHS Trusts’ initial efforts to secure such efficiencies necessarily focused on short term reductions, with pay restraint playing a significant role, but should now be combined with strategies to gain the major prize from a shift towards transformational change. In the future a greater focus will be required on service redesign, workforce reconfiguration and productivity improvements in increased partnership with staff.
Comprehensive Staff Engagement Strategies
6.19 We commented in our Twenty-Sixth Report6 on the variety of factors threatening AfC staff motivation and morale and the benefits of promoting greater staff engagement. There is further evidence presented for this report that AfC staff engagement and motivation is in decline. We consider this to be a worrying trend. There are considerable gains for employers, nationally and locally, in developing and improving engagement with staff not least to improve motivation, but also to maximise their essential contribution to delivering better and more cost effective patient care and to enable the transformational change required in the NHS. In our view, not all the leadership in the NHS has been quick enough to respond effectively in this area.
An Effective AfC Framework
6.20 Further developments are required to the AfC framework to enable it to play its role in supporting the wide-ranging programme of reforms across the NHS. Pay represents a high proportion of NHS expenditure and needs to represent value for money to the Governments, patients, employers, staff and the taxpayer. We comment earlier in this chapter on the specific developments in hand during 2013/14 including the recommendations from our Market-Facing Pay Report and proposals under discussion in the NHS Staff Council. More generally, we support the Department of Health’s intention to develop a total reward strategy and reiterate our expectation that employers, nationally and locally, develop reward and engagement strategies in partnership with staff.
6 NHSPRB (2012), Twenty-Sixth Report, TSO (Cm 8298), paragraphs 5.34-5.36.

69
Pay Remit
6.21 Our role has been constrained by the UK Government’s public sector pay policy since 2010. We comment in Chapter 1 on our concerns about such constraints and that the Review Body process has most value when we can apply our independent and expert judgment to all factors within our terms of reference. We have conveyed our views to the CST in a letter from our chair (jointly with the chairs of the other PRBs) and look forward to these views influencing how the UK Government determines our remit for the next pay round. We repeat that an unrestricted remit for 2014/15 would enable us to consider the full range of evidence and to continue to arrive at independent recommendations and help us to maintain the parties’, and AfC’s staff’s, trust and confidence in our process.
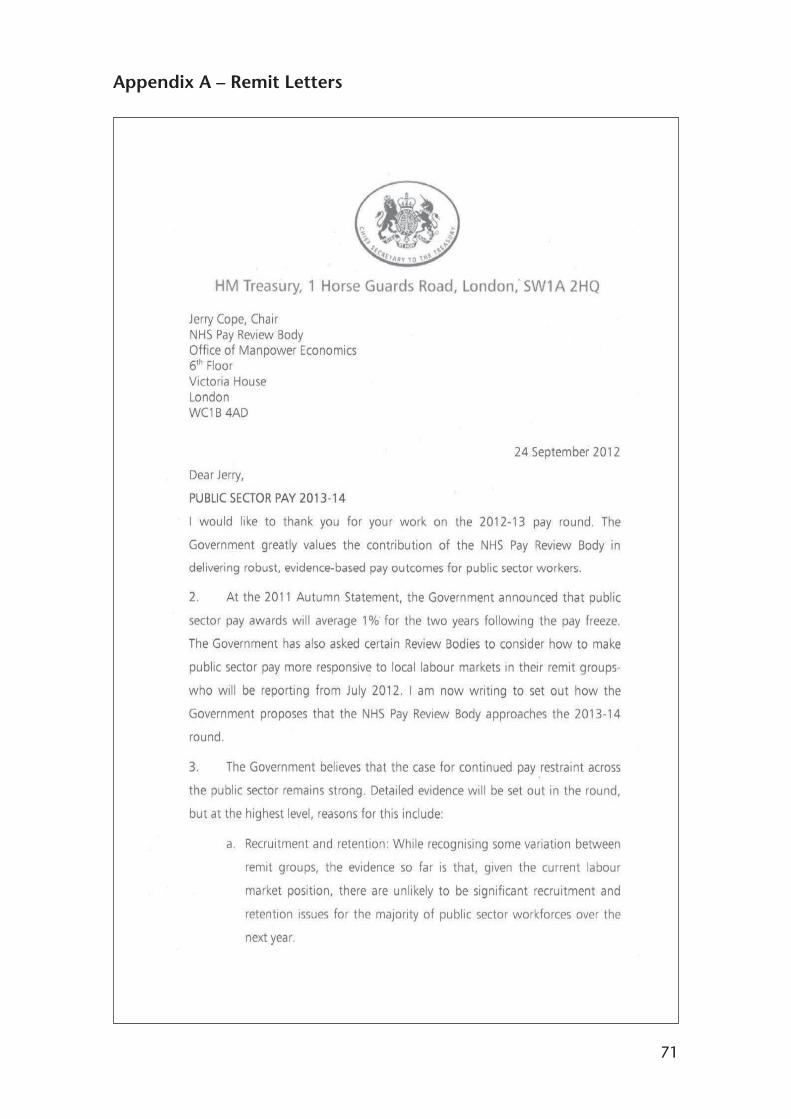
71
Appendix A – Remit Letters

72

73
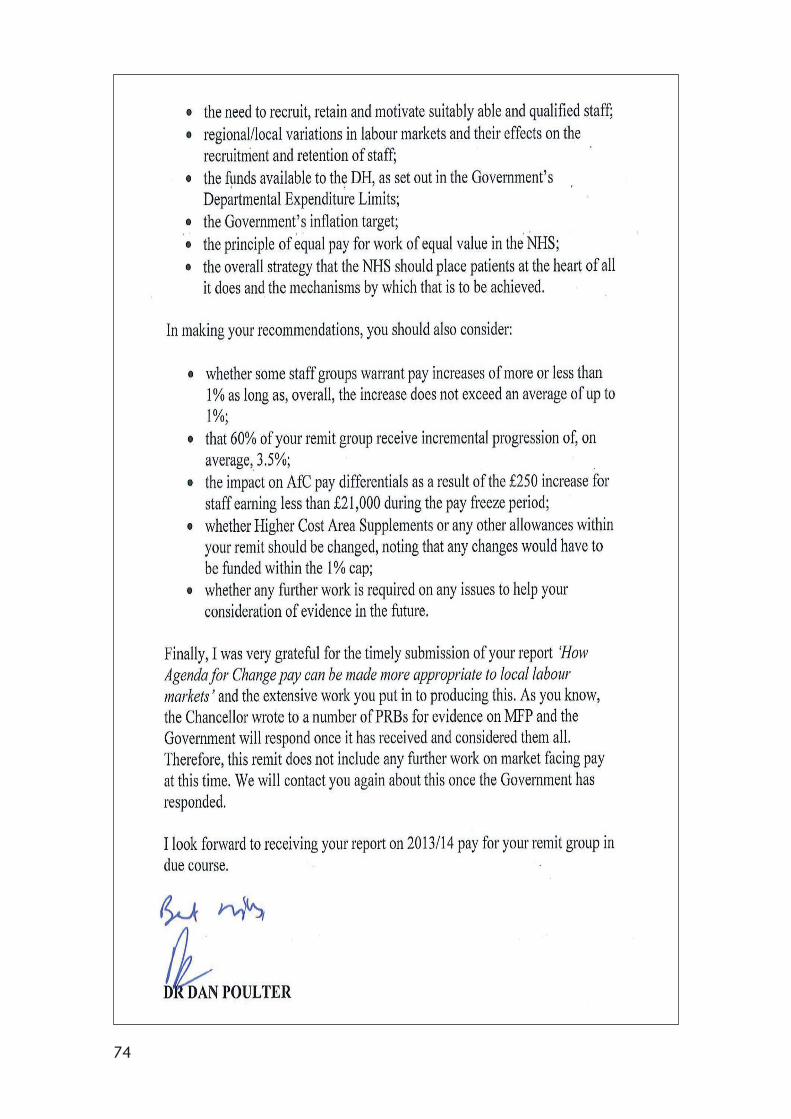
74
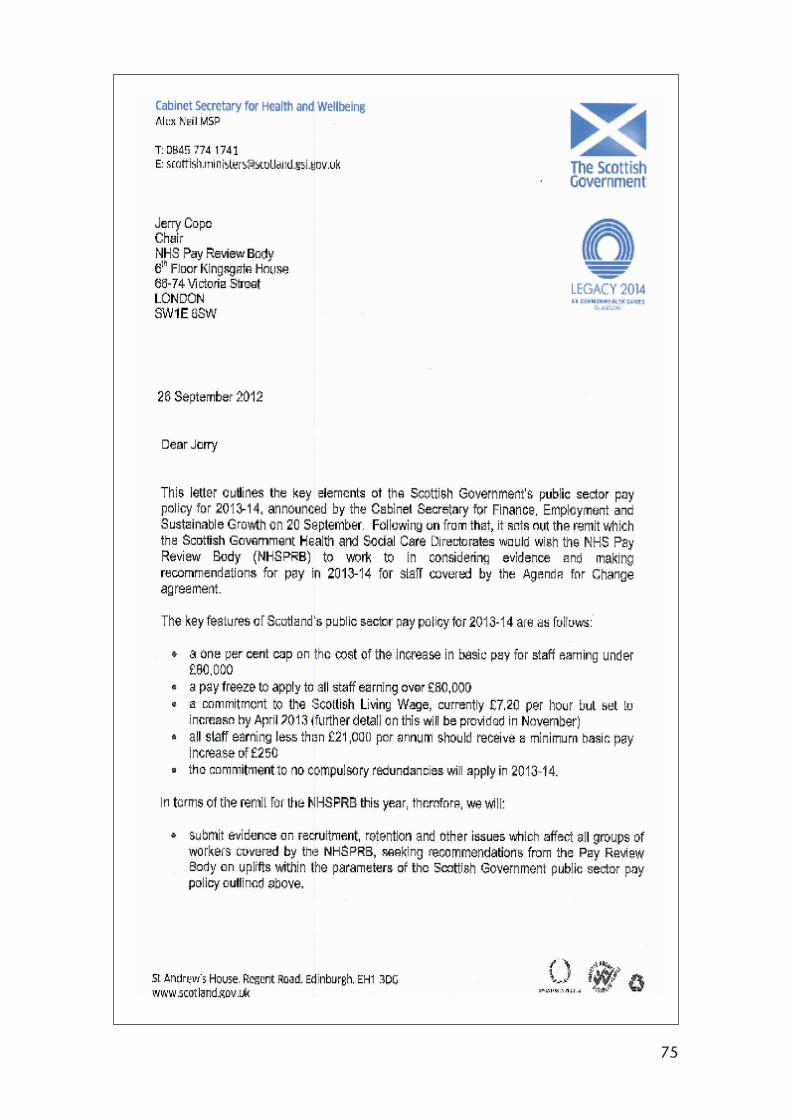
75

76

77
Appendix B – Recommended Agenda for Change Pay Scales with Effect from 1 April 2013
Point Band 1 Band 2 Band 3 Band 4 Band 5 Band 6 Band 7Band 8
Band 9Range A Range B Range C Range D1
2
3
4
5
14,294
14,653
15,013
14,294
14,653
15,013
15,432
15,8516
7
8
9
10
16,271
16,811
17,425
16,271
16,811
17,425
17,794
18,28511
12
13
14
15
18,838
19,268
18,838
19,268
19,947
20,638
21,26516
17
18
19
20
21,388
22,016
21,388
22,016
22,903
23,825
24,79921
22
23
24
25
25,783
26,822
27,901
25,783
26,822
27,901
28,755
29,75926
27
28
29
30
30,764
31,768
32,898
34,530
30,764
31,768
32,898
34,530
35,53631
32
33
34
35
36,666
37,921
39,239
40,558
39,239
40,558
42,19036
37
38
39
40
43,822
45,707
47,088
45,707
47,088
49,473
52,23541
42
43
44
45
54,998
56,504
54,998
56,504
59,016
61,779
65,922 65,92246
47
48
49
50
67,805 67,805
70,631
74,084
77,850
81,618
77,850
81,61851
52
53
54
85,535
89,640
93,944
98,453

78
Appendix C – Composition of Our Remit Group
C1 Tables C1 to C7 show the composition of our remit group in each country and in the UK as a whole as at September 20111. Detailed categories of staff in each country have been aggregated into broad staff groups, to enable cross-UK comparisons to be made.
C2 Staff categories used in each administration’s annual workforce census have been grouped together by our secretariat. We have had to be mindful of the differences between the four datasets, and even these broad staff groups contain inconsistencies: some ancillary staff in England and Wales are categorised in the census as HCAs and support staff, but have job roles that fit better in the broad group “administration, estates and management”.
1 The most recent date for which UK-wide data were available at the time of writing.

79
NHS Full Time Equivalent Non-Medical Workforce as at 30 September 2011
Table C1: Qualified nurses and midwives
England FTE Scotland FTE Wales FTE Northern Ireland FTE UK FTE
Qualified nurses, HVs and 306,346 Nurses and midwives Bands 41,495 Qualified nurses, HVs and 21,733 Qualified nursing and 13,654 383,228midwives 5-91 midwives midwifery
Table C2: Nursing and healthcare assistants and support staff
England FTE Scotland FTE Wales FTE Northern Ireland FTE UK FTE
Unqualified nurses 64,872 Nurses and midwives Bands 14,814 Unqualified nurses 6,193 Nurse support staff 3,8561-41
HCAs and support staff 116,227 HCAs and support staff 9,711
181,099 14,814 15,904 3,856 215,674
Table C3: Professional, technical and social care2
England FTE Scotland FTE Wales FTE Northern Ireland FTE UK FTE
Qualified AHPs 62,937 Medical and dental support 1,828 Qualified AHPs 4,587 Professional and technical 6,455
Qualified healthcare 29,061 AHPs 9,347 Qualified ST&Ts 4,864 Social services 6,570scientists
Other qualified ST&Ts 39,743 Other therapeutic services 3,424 Unqualified ST&Ts 1,999 Home helps 1,927
Unqualified ST&Ts 38,926 Personal and social care 925
Healthcare science 5,426
170,668 20,951 11,450 14,952 218,021
1 Data in Scotland do not provide for identification of qualified staff; consequently nursing staff in Scotland on Bands 5 and above are assumed to be qualified, and staff in Bands 1-4 are assumed to be unqualified, with unbanded staff allocated pro-rata.
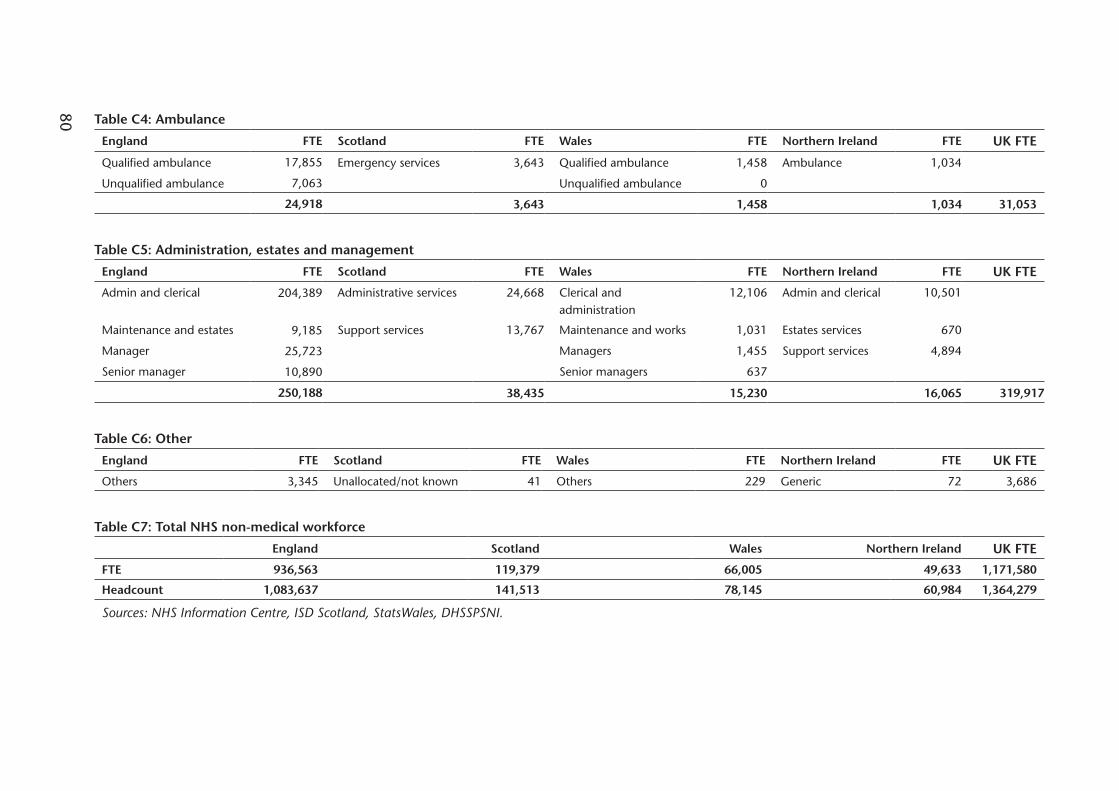
80 Table C4: Ambulance
England FTE Scotland FTE Wales FTE Northern Ireland FTE UK FTE
Qualified ambulance 17,855 Emergency services 3,643 Qualified ambulance 1,458 Ambulance 1,034
Unqualified ambulance 7,063 Unqualified ambulance 0
24,918 3,643 1,458 1,034 31,053
Table C5: Administration, estates and management
England FTE Scotland FTE Wales FTE Northern Ireland FTE UK FTE
Admin and clerical 204,389 Administrative services 24,668 Clerical and administration
12,106 Admin and clerical 10,501
Maintenance and estates 9,185 Support services 13,767 Maintenance and works 1,031 Estates services 670
Manager 25,723 Managers 1,455 Support services 4,894
Senior manager 10,890 Senior managers 637
250,188 38,435 15,230 16,065 319,917
Table C6: Other
England FTE Scotland FTE Wales FTE Northern Ireland FTE UK FTE
Others 3,345 Unallocated/not known 41 Others 229 Generic 72 3,686
Table C7: Total NHS non-medical workforce
England Scotland Wales Northern Ireland UK FTE
FTE 936,563 119,379 66,005 49,633 1,171,580
Headcount 1,083,637 141,513 78,145 60,984 1,364,279
Sources: NHS Information Centre, ISD Scotland, StatsWales, DHSSPSNI.

81
Appendix D – The Department of Health’s Pay Metrics
The following notes and tables have been reproduced from the Department of Health’s written evidence.
The DH has recently revised the methodology for producing HCHS pay bill metrics. This reflects known issues with the old approach including:
• The staff group split of the pay bill became increasingly unreliable due to a lack of staff group level spend data for Foundation Trusts;
• An annual snapshot of workforce numbers from the Census publication were used, rather than the average workforce over the year. This can skew per FTE pay bill and earnings calculations and therefore per FTE growth (and pay drift) calculations;
• Earnings per FTE were calculated based on the estimated pay bill per FTE and estimates of on-costs which were of uncertain reliability;
• Some inconsistencies were introduced by the need to merge different data sources for Foundation Trusts and non-Foundation Trusts.
Recently available data from the Electronic Staff Record has facilitated the development of a new approach, but only back to 2008/09. The benefits of the new approach are that it:
• Is based on more detailed and more frequently updated data sources;• Allows more reliable estimates of spend across staff groups;• Uses more detailed staff groups that are meaningful from a workforce planning
perspective;• Considers average workforce levels over each year, rather than September
snapshots, to facilitate more reliable pay bill per FTE estimates;• Can provide a more detailed breakdown of pay bill across earnings and on-cost
streams;• Supports more nuanced approaches to forecasting pay bill pressures;• Is available with less of a time lag and can be updated more frequently.
Differences in methodology and coverage will affect comparisons with the older metrics. For example, only the new approach includes Special Health Authorities. The new approach excludes all bank staff which the old approach does not.
The caveats around the data sources should be noted when interpreting the data. The Department advise particular caution in comparing these figures with the latest data from the old approach.
Another methodological revision will shortly be required in order to use future NHS IC earnings publications data which is itself undergoing methodological revision and improvement.
Notes
All figures should be treated as estimates.
Aggregate pay bill totals do not exactly match published accounts data, but reconcile reasonably well once adjustments are made for differences in coverage.
Published accounts data does not provide sufficient detail of pay bill, across staff groups or categories of spend, to be useful for pay bill analysis and modelling.
To provide data of sufficient detail, estimates are built up from other sources using validated and published data wherever possible.
Historical staff numbers are built up from quarterly I-View data.

82
Historical earnings per FTE are taken from the published NHS IC Quarterly Earnings Survey where coverage permits.
Other Non-Medical Staff are excluded as the vast majority of them reflect “non-funded posts” such as MacMillan Nurses or general payments, likely to be Chairmen and Non-Executive Directors. This makes the FTE numbers a closer match to the Monthly Publication and Census.
Manager earnings figures are estimated using ESR Data Warehouse information as the IC Earnings Survey data implicitly excludes Very Senior Managers and comparable FTE data is not available.
Historical on-costs (Employer NICs and Pension Contribution) are estimated from the earnings data above and ESR Data Warehouse information. Pay bill totals are then built up from estimated earnings and on-cost totals.
Excludes agency and bank staff.
Includes Special Health Authorities.
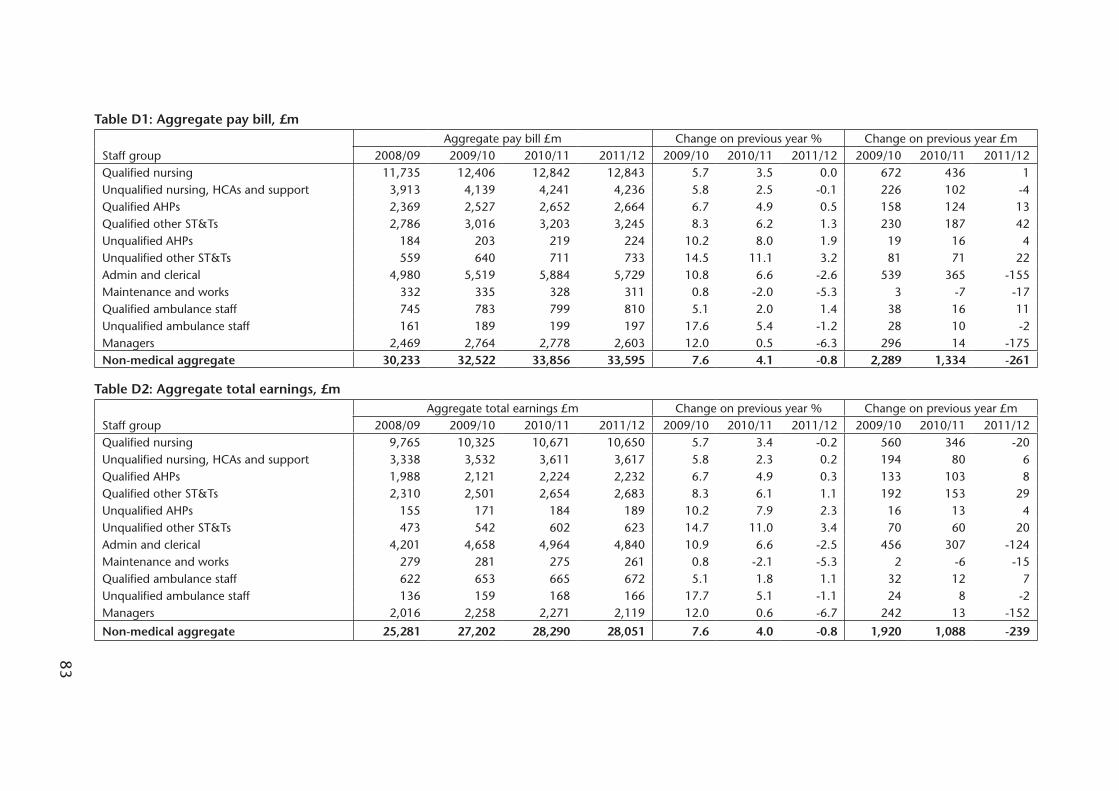
83
Table D1: Aggregate pay bill, £m
Staff groupAggregate pay bill £m Change on previous year % Change on previous year £m
2008/09 2009/10 2010/11 2011/12 2009/10 2010/11 2011/12 2009/10 2010/11 2011/12Qualified nursing 11,735 12,406 12,842 12,843 5.7 3.5 0.0 672 436 1Unqualified nursing, HCAs and support 3,913 4,139 4,241 4,236 5.8 2.5 -0.1 226 102 -4Qualified AHPs 2,369 2,527 2,652 2,664 6.7 4.9 0.5 158 124 13Qualified other ST&Ts 2,786 3,016 3,203 3,245 8.3 6.2 1.3 230 187 42Unqualified AHPs 184 203 219 224 10.2 8.0 1.9 19 16 4Unqualified other ST&Ts 559 640 711 733 14.5 11.1 3.2 81 71 22Admin and clerical 4,980 5,519 5,884 5,729 10.8 6.6 -2.6 539 365 -155Maintenance and works 332 335 328 311 0.8 -2.0 -5.3 3 -7 -17Qualified ambulance staff 745 783 799 810 5.1 2.0 1.4 38 16 11Unqualified ambulance staff 161 189 199 197 17.6 5.4 -1.2 28 10 -2Managers 2,469 2,764 2,778 2,603 12.0 0.5 -6.3 296 14 -175Non-medical aggregate 30,233 32,522 33,856 33,595 7.6 4.1 -0.8 2,289 1,334 -261
Table D2: Aggregate total earnings, £m
Staff groupAggregate total earnings £m Change on previous year % Change on previous year £m
2008/09 2009/10 2010/11 2011/12 2009/10 2010/11 2011/12 2009/10 2010/11 2011/12Qualified nursing 9,765 10,325 10,671 10,650 5.7 3.4 -0.2 560 346 -20Unqualified nursing, HCAs and support 3,338 3,532 3,611 3,617 5.8 2.3 0.2 194 80 6Qualified AHPs 1,988 2,121 2,224 2,232 6.7 4.9 0.3 133 103 8Qualified other ST&Ts 2,310 2,501 2,654 2,683 8.3 6.1 1.1 192 153 29Unqualified AHPs 155 171 184 189 10.2 7.9 2.3 16 13 4Unqualified other ST&Ts 473 542 602 623 14.7 11.0 3.4 70 60 20Admin and clerical 4,201 4,658 4,964 4,840 10.9 6.6 -2.5 456 307 -124Maintenance and works 279 281 275 261 0.8 -2.1 -5.3 2 -6 -15Qualified ambulance staff 622 653 665 672 5.1 1.8 1.1 32 12 7Unqualified ambulance staff 136 159 168 166 17.7 5.1 -1.1 24 8 -2Managers 2,016 2,258 2,271 2,119 12.0 0.6 -6.7 242 13 -152
Non-medical aggregate 25,281 27,202 28,290 28,051 7.6 4.0 -0.8 1,920 1,088 -239

84 Table D3: Full time equivalent (FTE) staff, average for the year
Staff groupAverage FTE staff Change on previous year % Change on previous year FTE
2008/09 2009/10 2010/11 2011/12 2009/10 2010/11 2011/12 2009/10 2010/11 2011/12Qualified nursing 301,608 308,653 310,414 307,810 2.3 0.6 -0.8 7,045 1,761 -2,604Unqualified nursing, HCAs and support 181,790 187,428 187,068 184,072 3.1 -0.2 -1.6 5,637 -359 -2,997Qualified AHPs 59,337 61,800 62,918 62,998 4.2 1.8 0.1 2,463 1,118 81Qualified other ST&Ts 62,935 66,308 68,450 69,067 5.4 3.2 0.9 3,374 2,142 616Unqualified AHPs 8,836 9,458 9,771 9,802 7.0 3.3 0.3 622 313 31Unqualified other ST&Ts 25,374 27,810 29,365 29,330 9.6 5.6 -0.1 2,435 1,555 -35Admin and clerical 195,845 210,990 214,218 205,100 7.7 1.5 -4.3 15,145 3,228 -9,118Maintenance and works 10,164 10,249 9,964 9,294 0.8 -2.8 -6.7 85 -285 -670Qualified ambulance staff 16,875 17,387 17,777 17,900 3.0 2.2 0.7 512 390 123Unqualified ambulance staff 6,183 7,065 7,294 7,008 14.3 3.2 -3.9 883 228 -285Managers 39,005 42,382 40,175 36,628 8.7 -5.2 -8.8 3,377 -2,206 -3,548Non-medical aggregate 907,950 949,529 957,414 939,008 4.6 0.8 -1.9 41,579 7,885 -18,406
Table D4: Pay bill per FTE, £
Staff groupPay bill per FTE £ Change on previous year % Change on previous year £
2008/09 2009/10 2010/11 2011/12 2009/10 2010/11 2011/12 2009/10 2010/11 2011/12Qualified nursing 38,907 40,195 41,370 41,722 3.3 2.9 0.9 1,288 1,175 352Unqualified nursing, HCAs and support 21,526 22,083 22,669 23,015 2.6 2.7 1.5 557 586 346Qualified AHPs 39,933 40,895 42,145 42,294 2.4 3.1 0.4 962 1,251 148Qualified other ST&Ts 44,263 45,479 46,790 46,977 2.7 2.9 0.4 1,217 1,310 187Unqualified AHPs 20,853 21,468 22,450 22,811 2.9 4.6 1.6 615 982 361Unqualified other ST&Ts 22,038 23,015 24,206 24,998 4.4 5.2 3.3 977 1,190 792Admin and clerical 25,429 26,158 27,468 27,933 2.9 5.0 1.7 729 1,309 465Maintenance and works 32,666 32,669 32,932 33,443 0.0 0.8 1.6 3 263 511Qualified ambulance staff 44,155 45,052 44,957 45,277 2.0 -0.2 0.7 897 -95 320Unqualified ambulance staff 25,976 26,740 27,292 28,070 2.9 2.1 2.8 763 553 777Managers 63,294 65,223 69,146 71,068 3.0 6.0 2.8 1,930 3,923 1,922Non-medical aggregate 33,298 34,250 35,361 35,777 2.9 3.2 1.2 952 1,111 415
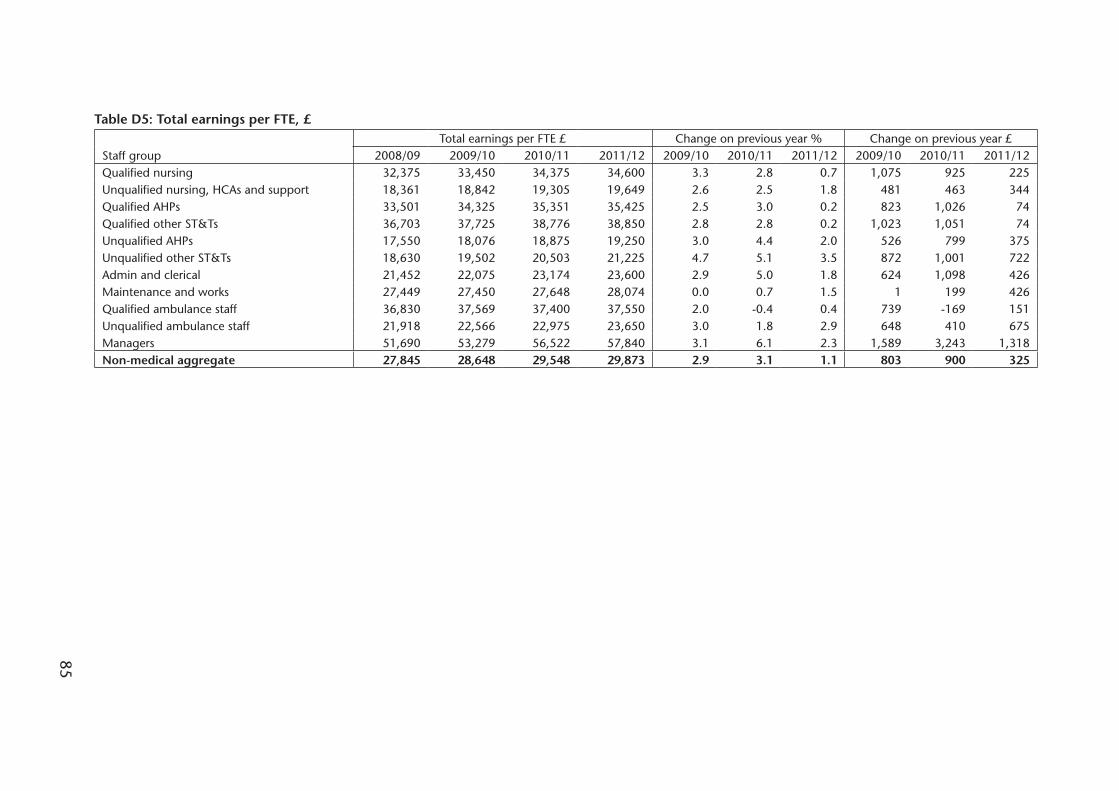
85
Table D5: Total earnings per FTE, £
Staff groupTotal earnings per FTE £ Change on previous year % Change on previous year £
2008/09 2009/10 2010/11 2011/12 2009/10 2010/11 2011/12 2009/10 2010/11 2011/12Qualified nursing 32,375 33,450 34,375 34,600 3.3 2.8 0.7 1,075 925 225Unqualified nursing, HCAs and support 18,361 18,842 19,305 19,649 2.6 2.5 1.8 481 463 344Qualified AHPs 33,501 34,325 35,351 35,425 2.5 3.0 0.2 823 1,026 74Qualified other ST&Ts 36,703 37,725 38,776 38,850 2.8 2.8 0.2 1,023 1,051 74Unqualified AHPs 17,550 18,076 18,875 19,250 3.0 4.4 2.0 526 799 375Unqualified other ST&Ts 18,630 19,502 20,503 21,225 4.7 5.1 3.5 872 1,001 722Admin and clerical 21,452 22,075 23,174 23,600 2.9 5.0 1.8 624 1,098 426Maintenance and works 27,449 27,450 27,648 28,074 0.0 0.7 1.5 1 199 426Qualified ambulance staff 36,830 37,569 37,400 37,550 2.0 -0.4 0.4 739 -169 151Unqualified ambulance staff 21,918 22,566 22,975 23,650 3.0 1.8 2.9 648 410 675Managers 51,690 53,279 56,522 57,840 3.1 6.1 2.3 1,589 3,243 1,318Non-medical aggregate 27,845 28,648 29,548 29,873 2.9 3.1 1.1 803 900 325

86
Appendix E – The Parties’ Website Addresses
The Department of Health http://www.dh.gov.uk/health/2012/10/nhsprb-review-2012/
The Scottish Government Health http://www.scotland.gov.uk/Topics/Health/Directorates NHS-Workforce/Policy/Pay-Conditions/Evidence-
NHSPRB-2012-13
Welsh Assembly Government http://wales.gov.uk/?skip=1&lang=en
The Department of Health and http://www.dhsspsni.gov.uk/northern_ireland_evidence_Social Services & Public Safety in to_the_nhsprb__2013_pay_round_24_october_2012.pdfNorthern Ireland
NHS Employers http://www.nhsemployers.org/SiteCollectionDocuments/NHSPRB%20Evidence%2022Oct%20FINAL.pdf
NHS Staff Side (Joint Staff Side) http://www.rcn.org.uk/__data/assets/pdf_file/0017/482210/004335.pdf
Northern Ireland Public Service http://www.nipsa.org.uk/HomeAlliance
Royal College of Midwives http://www.rcm.org.uk/
Royal College of Nursing http://www.rcn.org.uk/__data/assets/pdf_file/0003/482214/004336.pdf
UNISON http://www.unison.org.uk/healthcare/pages_view.asp?did=14899
Unite http://www.unitetheunion.org/
The parties’ written evidence should be available through these websites.

87
Appendix F – Previous Reports of the Review Body
Nursing Staff, Midwives and Health Visitors
First Report on Nursing Staff, Midwives and Health Visitors Cmnd. 9258, June 1984
Second Report on Nursing Staff, Midwives and Health Visitors Cmnd. 9529, June 1985
Third Report on Nursing Staff, Midwives and Health Visitors Cmnd. 9782, May 1986
Fourth Report on Nursing Staff, Midwives and Health Visitors Cm 129, April 1987
Fifth Report on Nursing Staff, Midwives and Health Visitors Cm 360, April 1988
Sixth Report on Nursing Staff, Midwives and Health Visitors Cm 577, February 1989
Supplement to Sixth Report on Nursing Staff, Midwives and Cm 737, July 1989
Health Visitors: Nursing and Midwifery Educational Staff
Seventh Report on Nursing Staff, Midwives and Health Visitors Cm 934, February 1990
First Supplement to Seventh Report on Nursing Staff, Midwives Cm 1165, August 1990
Midwives and Health Visitors: Senior Nurses and Midwives
Second Supplement to Seventh Report on Nursing Staff, Cm 1386, December
Midwives and Health Visitors: Senior Nurses and Midwives 1990
Eighth Report on Nursing Staff, Midwives and Health Visitors Cm 1410, January 1991
Ninth Report on Nursing Staff, Midwives and Health Visitors Cm 1811, February 1992
Report on Senior Nurses and Midwives Cm 1862, March 1992
Tenth Report on Nursing Staff, Midwives and Health Visitors Cm, 2148, February 1993
Eleventh Report on Nursing Staff, Midwives and Health Visitors Cm 2462, February 1994
Twelfth Report on Nursing Staff, Midwives and Health Visitors Cm 2762, February 1995
Thirteenth Report on Nursing Staff, Midwives and Health Visitors Cm 3092, February 1996
Fourteenth Report on Nursing Staff, Midwives and Health Visitors Cm 3538, February 1997
Fifteenth Report on Nursing Staff, Midwives and Health Visitors Cm 3832, January 1998
Sixteenth Report on Nursing Staff, Midwives and Health Visitors Cm 4240, February 1999
Seventeenth Report on Nursing Staff, Midwives and Health Cm 4563, January 2000
Visitors
Eighteenth Report on Nursing Staff, Midwives and Health Visitors Cm 4991, December 2000
Nineteenth Report on Nursing Staff, Midwives and Health Visitors Cm 5345, December 2001
Professions Allied to MedicineFirst Report on Professions Allied to Medicine Cmnd. 9257, June 1984
Second Report on Professions Allied to Medicine Cmnd. 9528, June 1985
Third Report on Professions Allied to Medicine Cmnd. 9783, May 1986
Fourth Report on Professions Allied to Medicine Cm 130, April 1987
Fifth Report on Professions Allied to Medicine Cm 361, April 1988
Sixth Report on Professions Allied to Medicine Cm 578, February 1989
Seventh Report on Professions Allied to Medicine Cm 935, February 1990
Eighth Report on Professions Allied to Medicine Cm 1411, January 1991
Ninth Report on Professions Allied to Medicine Cm 1812, February 1992
Tenth Report on Professions Allied to Medicine Cm 2149, February 1993
Eleventh Report on Professions Allied to Medicine Cm 2463, February 1994

88
Twelfth Report on Professions Allied to Medicine Cm 2763, February 1995
Thirteenth Report on Professions Allied to Medicine Cm 3093, February 1996
Fourteenth Report on Professions Allied to Medicine Cm 3539, February 1997
Fifteenth Report on Professions Allied to Medicine Cm 3833, January 1998
Sixteenth Report on Professions Allied to Medicine Cm 4241, February 1999
Seventeenth Report on Professions Allied to Medicine Cm 4564, January 2000
Eighteenth Report on Professions Allied to Medicine Cm 4992, December 2000
Nineteenth Report on Professions Allied to Medicine Cm 5346, December 2001
Nursing Staff, Midwives, Health Visitors and Professions Allied to MedicineTwentieth Report on Nursing Staff, Midwives, Health Visitors Cm 5716, August 2003
and Professions Allied to Medicine
Twenty-First Report on Nursing and Other Health Professionals Cm 6752, March 2006
Twenty-Second Report on Nursing and Other Health Cm 7029, March 2007
Professionals
NHS Pay Review BodyTwenty-Third Report, NHS Pay Review Body 2008 Cm 7337, April 2008
Twenty-Fourth Report, NHS Pay Review Body 2009 Cm 7646, July 2009
Decision on whether to seek a remit to review pay increases in December 2009the three year agreement - http://www.ome.uk.com/review.cfm?body=6
Twenty-Fifth Report, NHS Pay Review Body 2011 Cm 8029, March 2011
Twenty-Sixth Report, NHS Pay Review Body 2012 Cm 8298, March 2012
Market-Facing Pay, NHS Pay Review Body 2012 Cm 8501, December 2012

89
Appendix G – Abbreviations
AfC Agenda for Change
AHPs Allied Health Professionals
ASHE Annual Survey of Hours and Earnings
AWE Average Weekly Earnings
BIOS British and Irish Orthoptic Society
CfWI Centre for Workforce Intelligence
CIPD The Chartered Institute of Personnel and Development
CPI Consumer Prices Index
CSP Chartered Society of Physiotherapists
CST Chief Secretary to the Treasury
Department The Department of Health
Departments The Health Departments
DH Department of Health
DHSSC Department of Health, Social Services and Children
DHSSPSNI Department of Health, Social Services and Public Safety in Northern Ireland
ESR Electronic Staff Record
FTE Full Time Equivalent
FTN Foundation Trust Network
GDP Gross Domestic Product
HCA Healthcare Assistant
HCAS High Cost Area Supplements
HCHS Hospital and Community Health Service
Health Departments The Department of Health, the Scottish Government Health and Social Care Directorates, the Welsh Government Department of Health, Social Services and Children, and the Department of Health, Social Services and Public Safety in Northern Ireland
HEE Health Education England
HSC Health and Social Care Organisations
HSCIC Health and Social Care Information Centre
IC NHS Information Centre
IDS Incomes Data Services
ILO International Labour Organisation
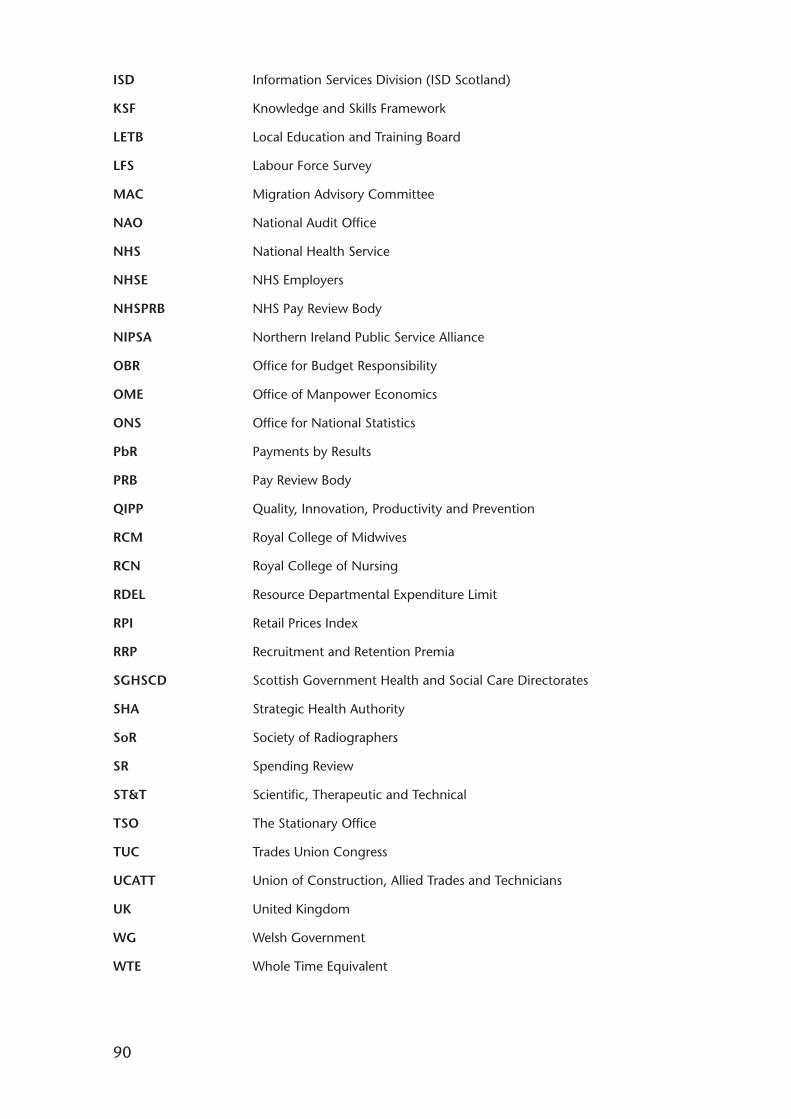
90
ISD Information Services Division (ISD Scotland)
KSF Knowledge and Skills Framework
LETB Local Education and Training Board
LFS Labour Force Survey
MAC Migration Advisory Committee
NAO National Audit Office
NHS National Health Service
NHSE NHS Employers
NHSPRB NHS Pay Review Body
NIPSA Northern Ireland Public Service Alliance
OBR Office for Budget Responsibility
OME Office of Manpower Economics
ONS Office for National Statistics
PbR Payments by Results
PRB Pay Review Body
QIPP Quality, Innovation, Productivity and Prevention
RCM Royal College of Midwives
RCN Royal College of Nursing
RDEL Resource Departmental Expenditure Limit
RPI Retail Prices Index
RRP Recruitment and Retention Premia
SGHSCD Scottish Government Health and Social Care Directorates
SHA Strategic Health Authority
SoR Society of Radiographers
SR Spending Review
ST&T Scientific, Therapeutic and Technical
TSO The Stationary Office
TUC Trades Union Congress
UCATT Union of Construction, Allied Trades and Technicians
UK United Kingdom
WG Welsh Government
WTE Whole Time Equivalent

Published by TSO (The Stationery Office) and available from:
Onlinewww.tsoshop.co.uk
Mail, Telephone, Fax & E-mailTSOPO Box 29, Norwich NR3 1GNTelephone orders/General enquiries: 0870 600 5522Order through the Parliamentary Hotline Lo-Call: 0845 7 023474Fax orders: 0870 600 5533Email: [email protected]: 0870 240 3701
The Houses of Parliament Shop12 Bridge Street, Parliament SquareLondon SW1A 2JXTelephone orders: 020 7219 3890/General enquiries: 020 7219 3890Fax orders: 020 7219 3866Email: [email protected]: http://www.shop.parliament.uk
TSO@Blackwell and other accredited agents