NHS Estates Review
24
THE 2015 NHS ESTATES REVIEW Making best use of all assets
-
Upload
arcadis-uk -
Category
Documents
-
view
213 -
download
0
description
http://bit.ly/1qT6aDJ
Transcript of NHS Estates Review

THE 2015 NHS ESTATES REVIEW Making best use of all assets

With only a small number of Trusts likely to be surplus at the end of March 2016, it is paramount that the NHS Estate finds a way to be smarter with the current limited resource and budget it has available. Overall, the NHS Estate costs £8.3billion to operate, representing the third largest individual element in the NHS, after workforce, clinical supplies/pharmaceuticals and consumables. Therefore, it is imperative a solution is developed to make the NHS Estate as efficient as possible.
2
MAKING THE BEST USE OF ALL ASSETS
The 2015 NHS Estates Review Making best use of all asset classes
TYPE 2014-2015 £0 2007-2008 £0Land 5,995,169 11,275,481Building (exc dwellings) 31,755,347 25,904,164Dwellings 351,178 507,693Assets under construction and POA (Price On Asking) 1,654,237 1,426,802Plant & machinery 2,820,426 2,352,901Transport equipment 156,690 117,855Information Technology 990,334 1,005,141Furniture & fittings 206,524 258,218Total 43,929,904 42,858,255
TABLE 1 - TOTAL NHS ASSETS BASE 2007-2015
With politicians offering an extra £8billion per year political settlement, the NHS will need to deliver an estimated £22billion in savings by the end of this Parliament. This requires considerable change in operations and is a large challenge for an OECD (Organization for Economic Cooperation and Development) country given the scale of demand, plus the current challenges already being faced.
3
The 2015 NHS Estates Review Making best use of all asset classes
The NHS Estate is the largest property portfolio in Europe with a total area of 65.2million m² of land; the buildings and assets are worth nearly £44billion. The Net Present Value (NPV) of the NHS Estate has not changed significantly over the past eight years, as land values have generally decreased from the peak, whilst building values have slowly increased, post the influx of new hospitals in the period to 2010. Table 1 shows the portfolio of total NHS assets.
So the big question is, how do we ensure this Estate supports future new service models and is working at maximum efficiency?This report reviews the latest 2014/15 NHS data on the property portfolio, analysing how it fairs against previous years and exploring where NHS Executive and Estate Directors can find ways to be smarter and improve efficiencies.
4
The 2015 NHS Estates Review Making best use of all asset classes
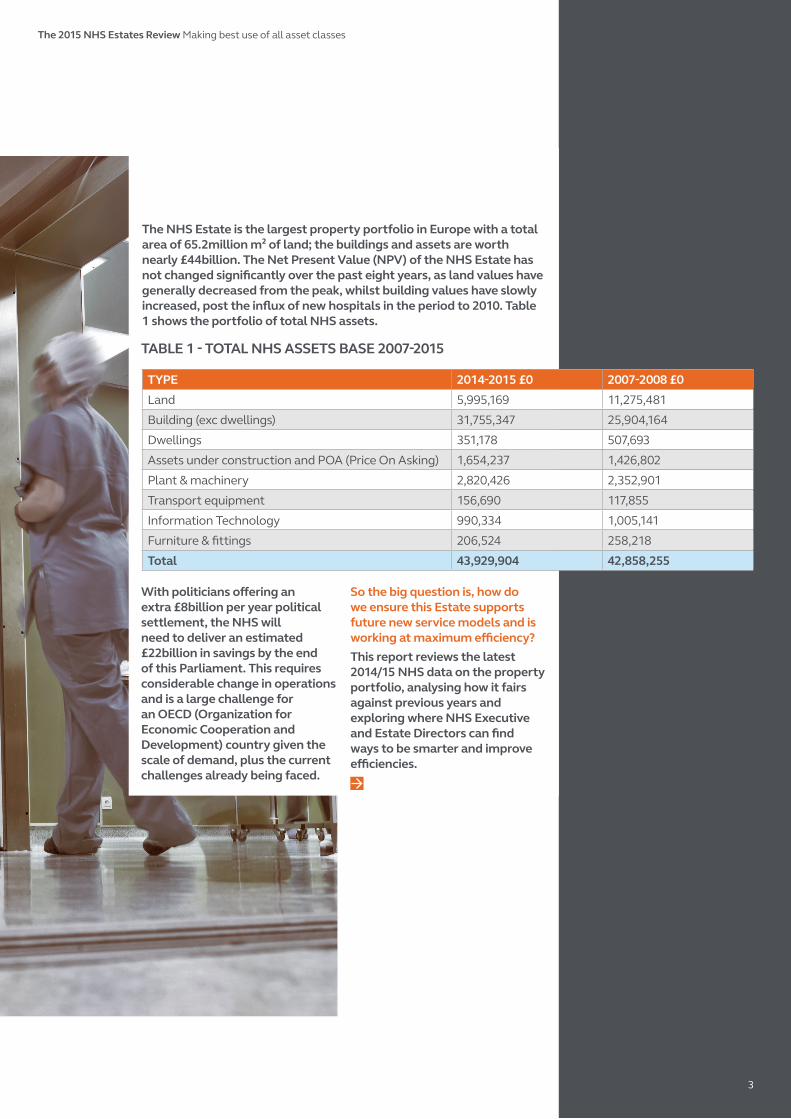
HOW DOES THE UK NHS COMPARE TO OTHER NATIONS?A nation’s wealth varies depending on the economy; as a result, total health GDP fluctuates given different economic periods of performance in the economy. As Table 2 demonstrates, the NHS is entering a period where the increase in Gross National Product is now significantly lower than it has been in the last 13 years. This, after decades of underinvestment until the millennium, saw health GDP increase by 0.4% in 2008 and 0.9% in 2010, as governments sought to achieve more European health GDP style inputs. In the period after 2011 the process began to flat line, meaning that actual spend is still increasing, however this ignores inflation and demand pressures. The figures in Table 2 show the most recently available data of comparative total health expenditure, including public and private expenditure and although the UK has a smaller private sector market (which is circa 1% less than those of Europe and the OECD), it still offers a strong comparison. Looking at similar European countries, after achieving the 2012 OECD average of 9.3%, it is clear to see that the UK, and given the market scale, the NHS, is now falling behind its competitors who have similar demand issues. What is now apparent is that indicators strongly suggest the NHS as an overall system will remain around or below 9% GDP. It is important to note that of the 10 key countries in Europe that are also OECD members, all had health funding per capita reduced from 20101 as economies started to fail, resulting in increased pressure for a reduction in public investment.
“Health expenditure in the UK is now showing signs of divergence from our European counterparts who are often spending around 11-12% GDP compared to c.9% in the UK.”
1 Source: Focus on Health Spending p2 July 2015 OECD

Drawing from experience, it is clear that all systems have their own quirks and as such, across Europe there is a marked difference in lengths of stay, rehabilitation, social care and day rates; all of which make it difficult to compare like-for-like. For example, in Germany and the Netherlands, as a result of their insurance based compensation methods, day case rates are significantly lower than in the UK; in many cases by 30% or more. The result of this system is that both countries rely on higher inpatient bed numbers.
YEAR UK HEALTH GDP FRANCE GDP GERMANY GDP NETHERLANDS GDP2000 6.9% 10.1% 10.1% 8.0%2005 8.1% 10.9% 10.8% 10.9%2009 9.7% 11.6% 11.8% 11.9%2010 9.4% 11.6% 11.6% 12.1%2011 9.2% 11.5% 11.2% 12.1%2012 9.3% 11.6% 11.3% 12.7%2013 9.1% 11.7% 11.3% 12.9%
TABLE 2 - TOTAL HEALTH GDP (PUBLIC AND PRIVATE), WORLD BANK DATA
5
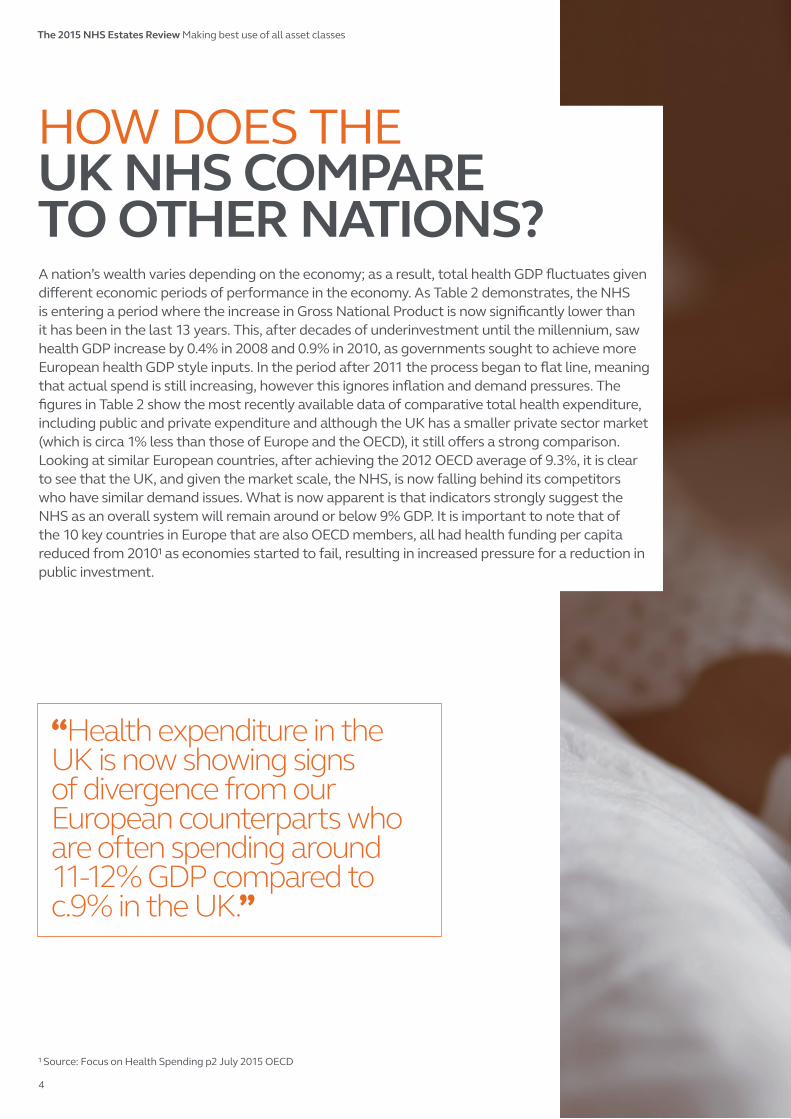
The NHS metrics 2014/15 have altered a number of data collection points, with the NHS centre noting that their calculation of unused Estate, which they state at 4.4%, is the amount of occupied floor area which the Trust has identified as being empty or underused. They note it is possible to have occupied area which for some reason is not being used, or fully used.Compared to the NHS, Arcadis takes a different view as we have always looked at the total GIA (Gross Internal Area-which represents all internal floor area, whether occupied or not) compared to the occupied area, which will give the total internal floor area not occupied. This means that our calculations show the NHS unused or surplus Estate this year is now 7.76% and therefore is higher than in previous years. Whilst it is disappointing that the unused/surplus internal area has increased to c7.8% in 2015, this compares with the 15% of GIA not used/surplus and 27% not fit for purpose in 2007/08. Currently there are 1.29million m², that’s 9.8%, of patient occupied areas that are not functionally suitable; in terms of creating a great patient environment this statistic is worrying and leaves a lot to be desired. Likewise the Estate to be disposed of in 2015/16 is very modest in comparison with the total NHS land bank (the sites ready to be disposed of being a fraction of total area that could be developed).
In 2014/15 the NHS disposed of 103 hectares worth £155.8million; in 2015/16 the NHS was expecting to dispose of 186 hectares with land receipts of £293million.This is the first year since 2009, when unused or surplus area has actually increased in our study. The hope is that part of this increase in unused space will be short term. For example, a number of new sites have opened during
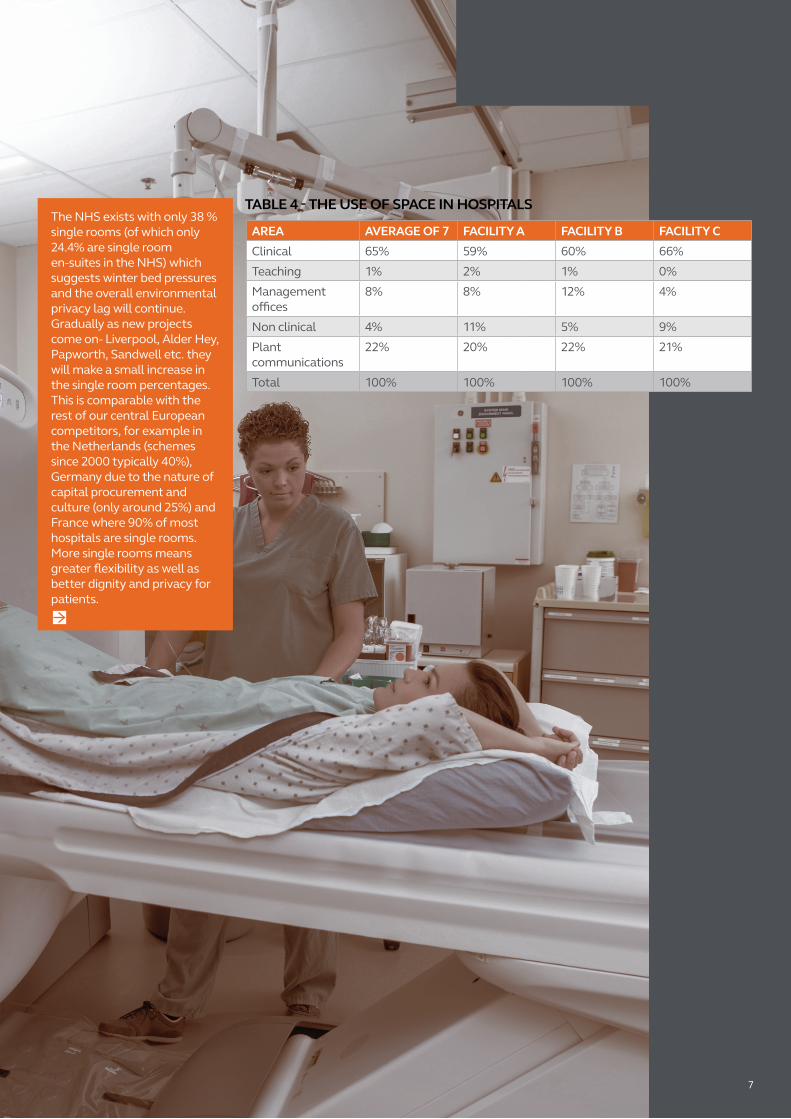
the production of these figures including the outstanding designs at both Southmead Hospital and Alder Hey. Whilst Papworth, Royal Liverpool, Sandwell/West Birmingham are in construction and will replace and, therefore lead to disposal of, other sites.Approximately 50% of the Estate is patient occupied – this is not to say that the other 50% is not patient orientated, as training and research, to name but two elements, won’t always count as patient areas. However, drawing from results from our recent survey conducted of several Trust projects that Arcadis worked upon, many Trusts look like achieving 65% clinical space and 35% non-clinical, as can be seen in Table 4. These figures were part of the evidence that has been played into the Lord Carter Estates agenda to
6
The 2015 NHS Estates Review Making best use of all asset classes
ESTATE SPACE & FUNCTIONThere are some 7,278 sites covered by the NHS which includes everything from small premise to super hospitals. Our report last year (based on the 2013/14 NHS information) identified that 1.3million m² of property/land was unused or surplus, which amounted to 4.8 % of overall property.
TABLE 3 - NHS KEY ESTATE STATISTICS
TOTAL PATIENT AREA OCCUPIED GIA
TOTAL NON-PATIENT AREA
13.2million m² 10.36million m²
provide metrics for assessment of the NHS Estate. Our study mapped 7 health facilities across the UK focusing on 7 principal schemes including small, medium, large and teaching hospital areas. The numbers are likely to understate administrative areas, as some will be categorised across a number headings such as “non-clinical”, clinical zones and even in teaching.
7
TABLE 4 - THE USE OF SPACE IN HOSPITALS
AREA AVERAGE OF 7 FACILITY A FACILITY B FACILITY CClinical 65% 59% 60% 66%Teaching 1% 2% 1% 0%Management offices
8% 8% 12% 4%
Non clinical 4% 11% 5% 9%Plant communications
22% 20% 22% 21%
Total 100% 100% 100% 100%
The NHS exists with only 38 % single rooms (of which only 24.4% are single room en-suites in the NHS) which suggests winter bed pressures and the overall environmental privacy lag will continue. Gradually as new projects come on- Liverpool, Alder Hey, Papworth, Sandwell etc. they will make a small increase in the single room percentages. This is comparable with the rest of our central European competitors, for example in the Netherlands (schemes since 2000 typically 40%), Germany due to the nature of capital procurement and culture (only around 25%) and France where 90% of most hospitals are single rooms. More single rooms means greater flexibility as well as better dignity and privacy for patients.

8
The recorded bed base was 141,500 across the NHS, of which 124,100 were occupied beds, meaning an occupancy rate of 87.7%. At face value, this is a positive figure showing there is little spare capacity in the system year round; this is a figure any hotel operator would be proud of. However, as has been widely commented on, the blocked beds situation now amounts to more than 1.4 million blocked bed days, relative to 17 average sized hospitals, with many audits saying 20-25% of patients should not be in a NHS acute bed. One of the most important issues this highlights, is to avoid unnecessary admissions by structuring care closer to home and providing sensible levels of intermediate care. Furthermore, many tertiary units which still admit patients for procedures and diagnostic tests would benefit from a patient hotel type settlement, which we advocate as offering real solutions for dramatically reducing daily costs, in some cases the savings are up to tenfold.
NHS BED BASE
9
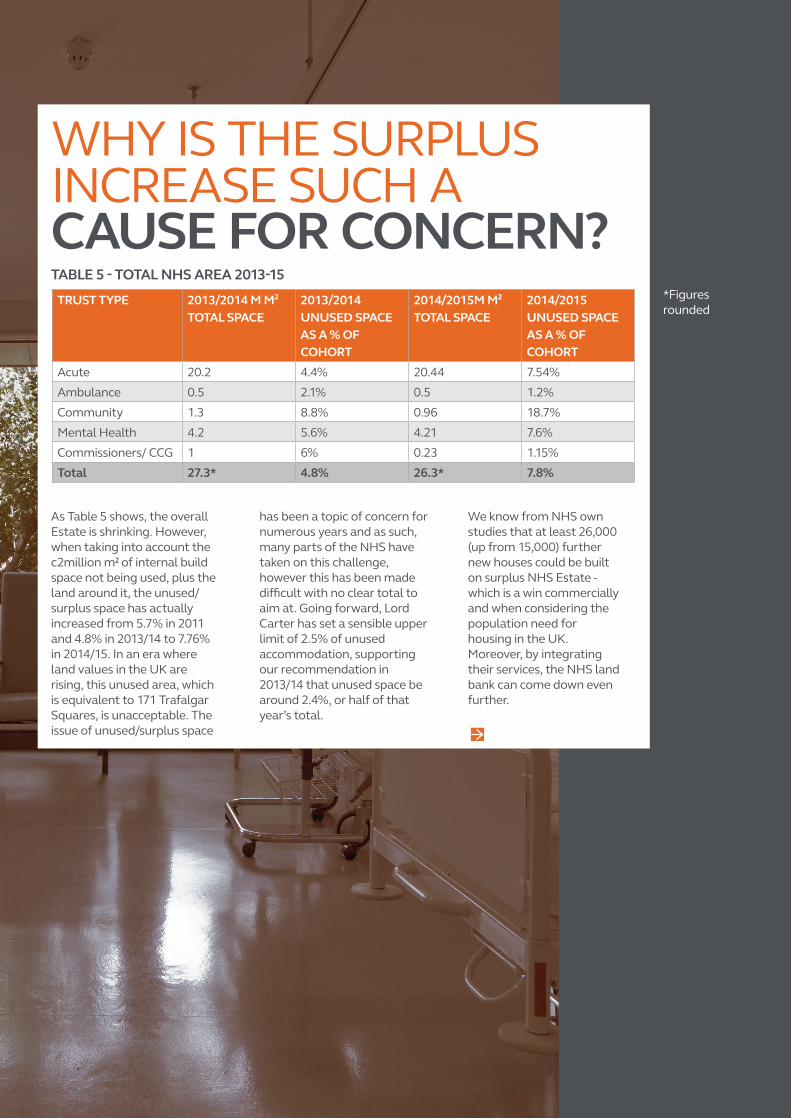
WHY IS THE SURPLUS INCREASE SUCH A CAUSE FOR CONCERN?
TRUST TYPE 2013/2014 M M² TOTAL SPACE
2013/2014 UNUSED SPACE AS A % OF COHORT
2014/2015M M² TOTAL SPACE
2014/2015 UNUSED SPACE AS A % OF COHORT
Acute 20.2 4.4% 20.44 7.54%Ambulance 0.5 2.1% 0.5 1.2%Community 1.3 8.8% 0.96 18.7%Mental Health 4.2 5.6% 4.21 7.6%Commissioners/ CCG 1 6% 0.23 1.15%Total 27.3* 4.8% 26.3* 7.8%
As Table 5 shows, the overall Estate is shrinking. However, when taking into account the c2million m² of internal build space not being used, plus the land around it, the unused/surplus space has actually increased from 5.7% in 2011 and 4.8% in 2013/14 to 7.76% in 2014/15. In an era where land values in the UK are rising, this unused area, which is equivalent to 171 Trafalgar Squares, is unacceptable. The issue of unused/surplus space
has been a topic of concern for numerous years and as such, many parts of the NHS have taken on this challenge, however this has been made difficult with no clear total to aim at. Going forward, Lord Carter has set a sensible upper limit of 2.5% of unused accommodation, supporting our recommendation in 2013/14 that unused space be around 2.4%, or half of that year’s total.
TABLE 5 - TOTAL NHS AREA 2013-15
We know from NHS own studies that at least 26,000 (up from 15,000) further new houses could be built on surplus NHS Estate - which is a win commercially and when considering the population need for housing in the UK. Moreover, by integrating their services, the NHS land bank can come down even further.
*Figures rounded

10
The 2015 NHS Estates Review Making best use of all asset classes
USING LAND FOR HOUSING & SCHOOLS
AVAILABLE LAND SIZE (HECTARE) NUMBER OF AVAILABLE LOTS
0 to 0.99 411 to 1.99 182 to 2.99 103 to 3.99 54 to 4.99 35 to 5.99 36 to 6.99 07 to 7.99 1
TABLE 6 - NUMBER OF AVAILABLE NHS SITES/LOTS 2015/16
The NHS has already identified a number of sites for disposal and we would venture there are significantly more than those in Table 6 that could potentially be disposed of. This wide variety of different NHS land types (depending on the hectare) will also appeal to a range of customers.

11
The 2015 NHS Estates Review Making best use of all asset classes
AGE OF THE ESTATEYEAR 2010 % 2013/14 % 2014/15 % IMPROVEMENT
2010-152005-15 13.3% 20.1% 17.49% 4.19%1995-2004 14.6% 15.2% 19.34% 4.74%1985-1994 15.4% 15.1% 19.74% 4.34%1975-1984 16.5% 15.4% 11.05% -5.45%1965-1974 15.7% 14.5% 9.10% -6.6%1955-1964 4.6% 3.7% 3.27% -1.33%1948-1954 1.3% 0.9% 1.72% 0.42%Pre NHS and 1948 18.6% 15.1% 18.3% -0.3%
Table 7 shows that the post-1985 accommodation now makes up 56.6% of the total area overall and we also see a welcomed corresponding drop in the 1964-1984 accommodation. However, the pre-NHS and 1950s accommodation still remain, and whist some of this can be converted in to useful health facilities, or sold off, the fact that 20% of buildings are still pre-1954 doesn’t say much for the system shift to a modern NHS.One of the assessment criteria for looking at the Estate is the Premise Assurance Model (PAM), however, unfortunately 51 Trusts had not started a PAM assessment for 2013/14. Although the assessment was not mandatory, it does offer good practice criteria and gives an ability for Trusts to understand where they rank relative to similar organisations. As such, this gives an ability to locate what their priorities should be to improve in the future. Due to these points, it is likely the PAM assessment will be a requirement for NHS Trusts in the future.
New hospitals have been created since around 2008, reducing the average age of the Estate; however the pace of progress has now slowed and as such, the backlog continues to grow.
TABLE 7 - AGE OF THE ESTATE AS A % BY YEARS

INVESTMENT VS. BACKLOG
TABLE 8 - NHS CAPITAL FUNDING AND BACKLOG
YEAR CAPITAL FUNDING (BILLION) EXC PFI
BACKLOG (SIGNIFICANT AND HIGH RISK) (BILLION)
TOTAL (INCLUSIVE OF ALL BACKLOG TYPES) (BILLION)
2007-08 £4,357 £1,418 £4,0092008-09 £4,670 £1,443 £4,0842009-10 £5,457 £1,407 £4,0962010-11 £4,302 £1,343 £4,1652011-12 £3,818 £1,222 £4,0232012-13 £4,378 £1,313 £4,3242013-14 £4,217 £1,412 £4,6472014-15 £4,000 £1,520 £4,337
12
The 2015 NHS Estates Review Making best use of all asset classes
² Source: Table 8 Capital investment at Trust level NHS Information centre page15 ³ Source: HM Treasury database Table 8 DH
The statistics which may well come back to haunt the politicians, civil servants and hospital directors of today are the backlog statistics. As seen in Table 8, backlog has risen almost consistently between 2007-2015 and effectively shows that the NHS has similar levels of high risk and total backlog as before the last major capital injection for new facilities. Moreover, the yearly growth of backlog- particularly a 13% increase in high and significant risk since 2010- means that we are now moving back to a NHS that is permanently running a £4billion total backlog deficit. Unfortunately, despite having raised this on numerous occasions over the past three years, there is no fundamental link between where investment is made and where reduction is needed to decrease the backlog. All too often money is spent on new equipment or services whose performance improvement over the last iteration may not be quantifiable. Plus, Directors of Finance and the NHS centre believe that they can eek out existing resources without investment, which is a dangerous precedent given legal and patient obligations. All of this means that the NHS is constantly firefighting with short term fixes to infrastructure.

The 2015 NHS Estates Review Making best use of all asset classes
The capital funding total includes a number of other equipment issues (such as IT), so for the bulk of Trusts the real capital figure is total capital expenditure of £2,323.6billion, which includes: • Cap ex for new build
£0.801billion• Cap ex for refurbishment
£1.01billion• Cap ex for equipment
£0.510billion• Total £2.323billion - a drop of
£421million from the previous year, equivalent to -15%.
The peak for NHS capital expenditure came in 2009/2010, where the public expenditure bill peaked at £5.4billion. The PFI (Private Finance Initiative) programme itself represented an average of an extra £1.2billion a year from 2005/6-2010/11. This resulted in quicker reductions in backlog as more new facilities were being provided. Whilst the investment figure for 2015/16 published in the Budget shows an increase, there is clearly significant pressure in the system, not least as capital was moved back to revenue in 2014/15 and in 2015/16 to aid the total system affordability. This means that there has been another significant drop in investment over the last two
years and when the clawback of capital funds are added, this possibly represents a total reduction of some 25% of capital funding over that six year period. So whilst the 2016/17 headline figure of £4.8billion is welcomed, it can be seen that this figure itself would only return the NHS to the capital totals of 2009/10 before the deductions to the centre. All this leads to less long term thinking and more mending of certain facility elements without considering new ways of working, or greater patient, staff and modern purpose built environments. Whilst more return on investment needs to be derived from capital projects, alternative sources of funding or Joint Ventures (JV) will almost certainly have to make up the shortfall. Sadly some necessary capital schemes will struggle to achieve any funding given these capital constraints.
13
“All of this means that the NHS is constantly firefighting with short term fixes to infrastructure.”
14
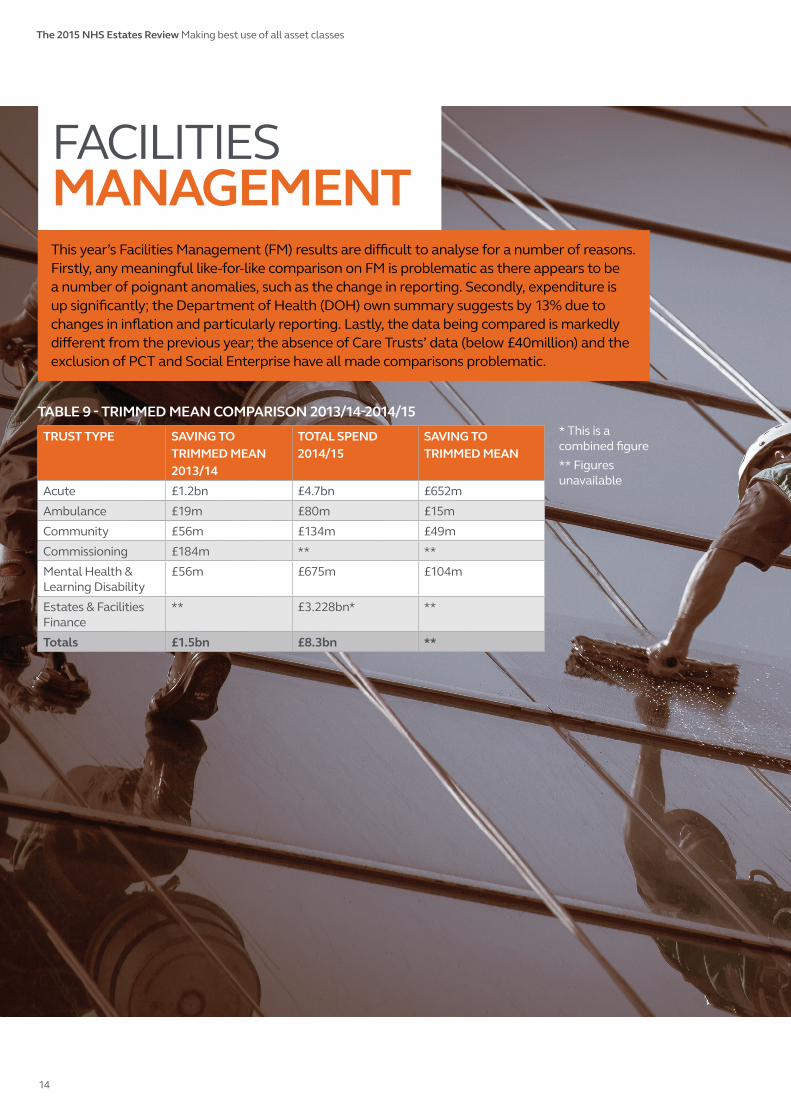
FACILITIES MANAGEMENT This year’s Facilities Management (FM) results are difficult to analyse for a number of reasons. Firstly, any meaningful like-for-like comparison on FM is problematic as there appears to be a number of poignant anomalies, such as the change in reporting. Secondly, expenditure is up significantly; the Department of Health (DOH) own summary suggests by 13% due to changes in inflation and particularly reporting. Lastly, the data being compared is markedly different from the previous year; the absence of Care Trusts’ data (below £40million) and the exclusion of PCT and Social Enterprise have all made comparisons problematic.
TABLE 9 - TRIMMED MEAN COMPARISON 2013/14-2014/15
TRUST TYPE SAVING TO TRIMMED MEAN 2013/14
TOTAL SPEND 2014/15
SAVING TO TRIMMED MEAN
Acute £1.2bn £4.7bn £652mAmbulance £19m £80m £15mCommunity £56m £134m £49mCommissioning £184m ** **Mental Health & Learning Disability
£56m £675m £104m
Estates & Facilities Finance
** £3.228bn* **
Totals £1.5bn £8.3bn **
* This is a combined figure** Figures unavailable
The 2015 NHS Estates Review Making best use of all asset classes
15
With costs of more than £3.2billion wrapped in to Estates and facilities finance, it is impossible to ascertain a complete comparator against the 2013/14 position.The Estates & Facilities finance expenditure in Table 9 includes major changes in Hard FM spend (maintenance) where figures are a staggering £2.2 billion below previous years (£4.5billion to £2.3billion), whilst Soft FM and energy costs (operating the Estate) are very similar to previous years. Given the level of Hard FM spend which is committed to via long term PFI type arrangements, the validity of the Hard FM figure is questionable. The suggestion to resolve this issue would be focussed efforts to review data analysis at the NHS England level to improve the comparability and accuracy of data in order to better understand and prioritise opportunities to drive savings. Correspondingly, for long term monitoring and correlation there is a need to break up the categories of the Estates and Facilities Finance number to reconcile this more accurately into the component parts. However, experience suggests that with focussed effort, significant savings can be made in relation to FM service provision.The growth of outsourced FM in the NHS will continue as a result of sustained public spending cuts, with the market reporting a 9% increase in the amount of FM services that are contracted
out and 17% growth in the take up of TFM services of bundled services contracts and integrated management solutions.The amount of NHS work out for tender to the private sector in July 2015 remained similar in terms of value compared with the previous year, suggesting that the pace of outsourcing in the NHS has slowed dramatically due to the private sector supply chain players themselves feeling the pressure for efficiency savings so acutely that making a profit from many contracts is increasingly difficult. This criticism was echoed recently by the Confederation of British Industry, which argued that outsourcers were being forced to look abroad for business due to the meagre margins on deals in the UK, in some cases negating the very point of introducing private sector competition into the public sector. Competition in the FM market place, particularly in Soft FM deals, is also compounded by an increase in underbidding with price; this is fast becoming the most important aspect in securing deals. This is exacerbated by the issue that suppliers are being forced to absorb the impact of both Living Wage and Auto Enrolment, which is further eroding market value in the short term and forcing a number of business failures and market withdrawals.Arcadis (previously EC Harris) produced a trimmed mean (deducted out obvious
The 2015 NHS Estates Review Making best use of all asset classes
erroneous data) which provided a national benchmark and a criteria which Trusts should be able to meet. It should be noted that the top quartile performance was significantly better, hence our belief that all parties, with few exceptions, should be able to achieve these target “trimmed mean metrics”. As noted previously, Table 9 highlights the change in data definition and demonstrates the need to interrogate NHS wide knowledge to ensure key messages can be gathered and the correct interpretation applied. We believe that the real saving will be more than £1billion, however due to the data quality and validation (noted in this section) this is impossible to ascertain in 2014/15.

16
The 2015 NHS Estates Review Making best use of all asset classes
TABLE 10 - FOSSIL FUEL CONSUMPTION
TABLE 11 - SUSTAINABILITY
YEAR ELECTRICITY CONSUMED (KWH)
GAS CONSUMED (KWH)
OIL CONSUMED (KWH)
COAL CONSUMED (KWH)
2014/15 2,682,176,495 7,889,231,754 120,154,141 84,251,0302013/14 3,254,262,283 8,613,615,519 140,086,202 95,659,3702012/13 3,216,657,719 7,784,323,693 154,354,022 104,041,688
YEAR LANDFILL WASTE TONNES
RECYCLED WASTE TONNES
OVERALL % RECYCLED
2014/15 65,295 84,286 56.3%2013/14 99,050 88,510 47.2%2012/13 126,954 97,437 43.4%% improvement 2012-15 48.56% 33.60% n/a
In terms of waste, water and sewage costs have increased to £82.6million in 2014/15, up from £78.9million in 2013/14, which equates to a 4.4% increase. However, food costs, which had been on an increasing trend in previous years, actually dropped from £10.48 per day to £10.20, which when taking inflation in to account means a decrease of more than 2.67%.
WASTE, CARBON & ENERGY
This leads to the overall conclusion that the NHS is becoming more green, which is not only good for the NHS, but also for the planet. Ten years ago the carbon footprint of the NHS was unnecessarily large - bigger than some small countries, so this drive is not only positive but also imperative. However, whilst there are a number of sustainable projects in the NHS, unfortunately 30 acute and 27 non acute Trusts including many CCG’s, (Clinical Commissioning Group) did not complete their Carbon SDMP, which is disappointing.
The NHS sustainability drive has improved carbon outcomes across the NHS, as detailed in Tables 10, 11 and Figure 1. The Tables below offer a number of conclusions; firstly, less oil, gas, coal and electricity for energy is being used now than in 2013/14 and 2012/13, with the one exception being gas consumption, which although significantly less than 2013/14 levels, has not quite dropped lower than the usage in 2012/13. Secondly, the NHS is using less landfill; overall landfill is 78.4 tonnes less than the previous year, although this may be due, in part, to the lack of construction taking place.

17
FIGURE 1 - RENEWABLE ENERGY USAGE TOTALS IN THE NHS
2010 665,017 kWh
2011 184,818,923 kWh
2012 162,053,957 kWh
2013/14 449,348,276 kWh
2014/15 581,667,805 kWh

18
The 2015 NHS Estates Review Making best use of all asset classes
GOVERNANCE
TABLE 12 - NHS RISK RATINGS
YEAR 2013/14 2014/15Total NHS Foundation Trusts 145 152The number (percentage )of NHS Foundation Trusts achieving high risk ratings 1 and red for continuity of services and governance
(20) 13.6% (27) Red or under review17.7%
It is widely accepted that in the next five years, it is going to become more difficult for the NHS to meet public expectations and produce outcomes that reduce public and media scrutiny. Table 12 shows that the ratings offered by regulators CQC are marginally worse in 2014/15 than the previous year. Importantly, there are a small number of Trusts with a rating of 1 for risk that have remained unclassified at this juncture. However, it can be deduced, given the current financial pressures facing the NHS, that such an increase in red reviews is not surprising. Moreover, whilst meeting the nationally set targets is paramount, having a comprehensive service that provides safe and effective care must be the ultimate aim for the NHS and there is a real danger that this could be hindered by the media, patients and staff getting drawn in to the failure game, whereby defensive practices could cause short term thinking.
Although there are areas of the NHS where there is definite room for improvement, that is the case for most similar health systems across Europe. Plus, despite the global studies, it is still an enormous struggle to articulate the best overall structure; perhaps the most effective way would be to learn from each other’s health systems. Equally, we can look further afield and also learn from other industries that have taken on and embraced a “big change”, for example IT, aviation, retail and automation industries. In these particular industries, the products/services available to consumers have continued to improve, despite making considerable savings; in some cases a saving of 25% in the input costs have been made.
In order for this sort of success to be replicated in the NHS, a number of criteria need to be met in terms of governance. Looking at other successful Trusts and taking the findings from a range of projects we have previously worked on, the following four points seem to offer the most chance of success:• An aligned leadership• Shared strategic goals • Measurable benefits • Operational delivery In 2014/15 we worked with a number of Trusts, many with major operational problems and found that the Trusts that succeeded not only identified with issues, but also focused on the key objectives and had the will to deliver the changes effectively.
19
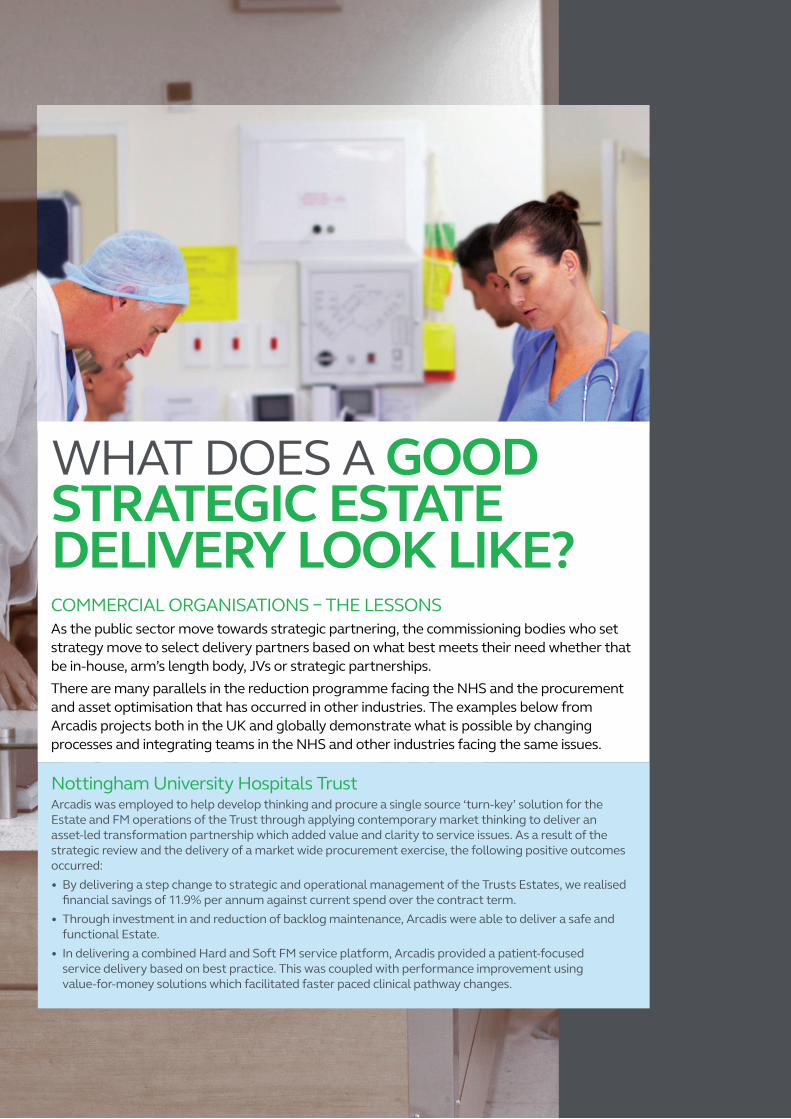
WHAT DOES A GOOD STRATEGIC ESTATE DELIVERY LOOK LIKE?
Nottingham University Hospitals TrustArcadis was employed to help develop thinking and procure a single source ‘turn-key’ solution for the Estate and FM operations of the Trust through applying contemporary market thinking to deliver an asset-led transformation partnership which added value and clarity to service issues. As a result of the strategic review and the delivery of a market wide procurement exercise, the following positive outcomes occurred: • By delivering a step change to strategic and operational management of the Trusts Estates, we realised
financial savings of 11.9% per annum against current spend over the contract term. • Through investment in and reduction of backlog maintenance, Arcadis were able to deliver a safe and
functional Estate.• In delivering a combined Hard and Soft FM service platform, Arcadis provided a patient-focused
service delivery based on best practice. This was coupled with performance improvement using value-for-money solutions which facilitated faster paced clinical pathway changes.
COMMERCIAL ORGANISATIONS – THE LESSONSAs the public sector move towards strategic partnering, the commissioning bodies who set strategy move to select delivery partners based on what best meets their need whether that be in-house, arm’s length body, JVs or strategic partnerships. There are many parallels in the reduction programme facing the NHS and the procurement and asset optimisation that has occurred in other industries. The examples below from Arcadis projects both in the UK and globally demonstrate what is possible by changing processes and integrating teams in the NHS and other industries facing the same issues.
20
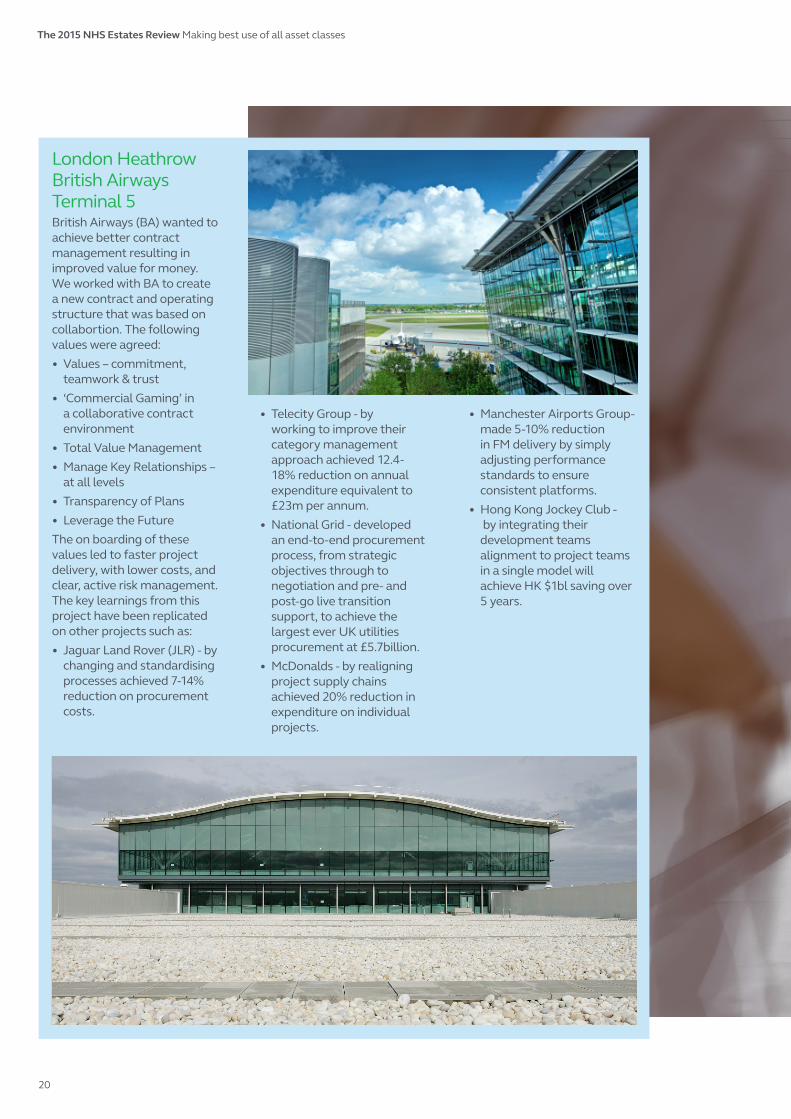
London Heathrow British Airways Terminal 5British Airways (BA) wanted to achieve better contract management resulting in improved value for money. We worked with BA to create a new contract and operating structure that was based on collabortion. The following values were agreed:• Values – commitment,
teamwork & trust• ‘Commercial Gaming’ in
a collaborative contract environment
• Total Value Management• Manage Key Relationships –
at all levels• Transparency of Plans• Leverage the FutureThe on boarding of these values led to faster project delivery, with lower costs, and clear, active risk management. The key learnings from this project have been replicated on other projects such as:• Jaguar Land Rover (JLR) - by
changing and standardising processes achieved 7-14% reduction on procurement costs.
• Telecity Group - by working to improve their category management approach achieved 12.4-18% reduction on annual expenditure equivalent to £23m per annum.
• National Grid - developed an end-to-end procurement process, from strategic objectives through to negotiation and pre- and post-go live transition support, to achieve the largest ever UK utilities procurement at £5.7billion.
• McDonalds - by realigning project supply chains achieved 20% reduction in expenditure on individual projects.
• Manchester Airports Group- made 5-10% reduction in FM delivery by simply adjusting performance standards to ensure consistent platforms.
• Hong Kong Jockey Club - by integrating their development teams alignment to project teams in a single model will achieve HK $1bl saving over 5 years.
The 2015 NHS Estates Review Making best use of all asset classes
21
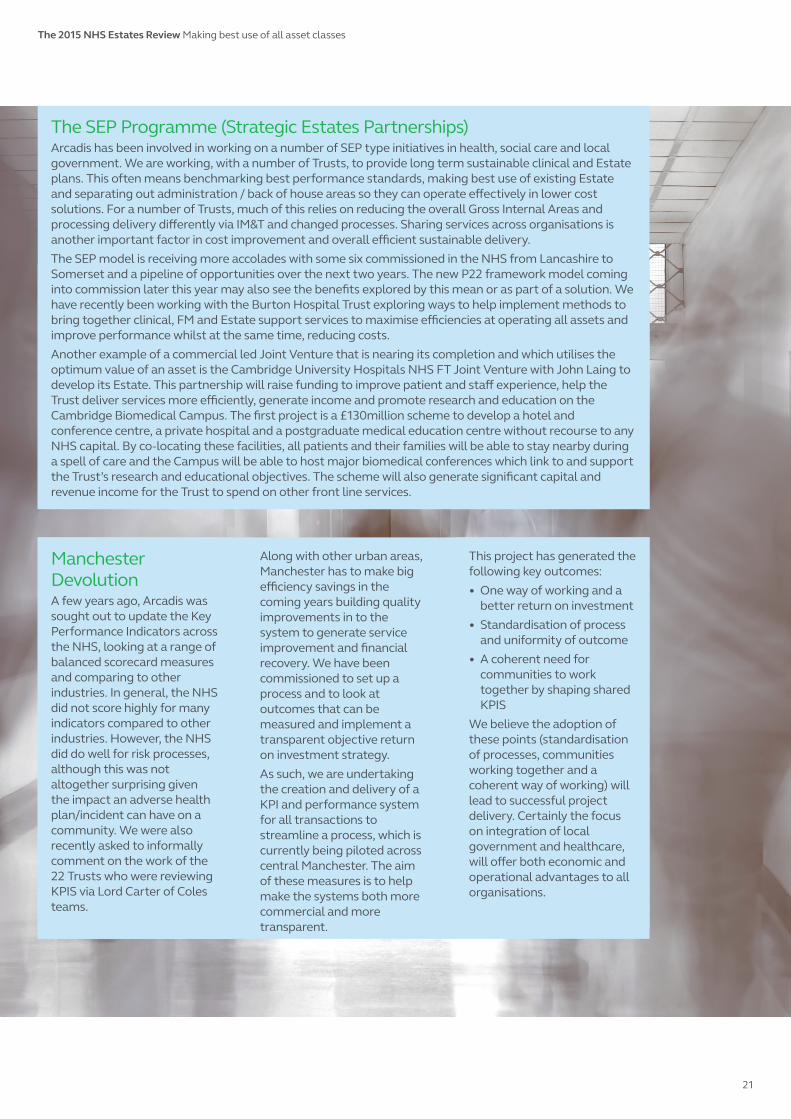
The SEP Programme (Strategic Estates Partnerships) Arcadis has been involved in working on a number of SEP type initiatives in health, social care and local government. We are working, with a number of Trusts, to provide long term sustainable clinical and Estate plans. This often means benchmarking best performance standards, making best use of existing Estate and separating out administration / back of house areas so they can operate effectively in lower cost solutions. For a number of Trusts, much of this relies on reducing the overall Gross Internal Areas and processing delivery differently via IM&T and changed processes. Sharing services across organisations is another important factor in cost improvement and overall efficient sustainable delivery. The SEP model is receiving more accolades with some six commissioned in the NHS from Lancashire to Somerset and a pipeline of opportunities over the next two years. The new P22 framework model coming into commission later this year may also see the benefits explored by this mean or as part of a solution. We have recently been working with the Burton Hospital Trust exploring ways to help implement methods to bring together clinical, FM and Estate support services to maximise efficiencies at operating all assets and improve performance whilst at the same time, reducing costs. Another example of a commercial led Joint Venture that is nearing its completion and which utilises the optimum value of an asset is the Cambridge University Hospitals NHS FT Joint Venture with John Laing to develop its Estate. This partnership will raise funding to improve patient and staff experience, help the Trust deliver services more efficiently, generate income and promote research and education on the Cambridge Biomedical Campus. The first project is a £130million scheme to develop a hotel and conference centre, a private hospital and a postgraduate medical education centre without recourse to any NHS capital. By co-locating these facilities, all patients and their families will be able to stay nearby during a spell of care and the Campus will be able to host major biomedical conferences which link to and support the Trust’s research and educational objectives. The scheme will also generate significant capital and revenue income for the Trust to spend on other front line services.
Manchester Devolution A few years ago, Arcadis was sought out to update the Key Performance Indicators across the NHS, looking at a range of balanced scorecard measures and comparing to other industries. In general, the NHS did not score highly for many indicators compared to other industries. However, the NHS did do well for risk processes, although this was not altogether surprising given the impact an adverse health plan/incident can have on a community. We were also recently asked to informally comment on the work of the 22 Trusts who were reviewing KPIS via Lord Carter of Coles teams.
Along with other urban areas, Manchester has to make big efficiency savings in the coming years building quality improvements in to the system to generate service improvement and financial recovery. We have been commissioned to set up a process and to look at outcomes that can be measured and implement a transparent objective return on investment strategy. As such, we are undertaking the creation and delivery of a KPI and performance system for all transactions to streamline a process, which is currently being piloted across central Manchester. The aim of these measures is to help make the systems both more commercial and more transparent.
This project has generated the following key outcomes:• One way of working and a
better return on investment• Standardisation of process
and uniformity of outcome• A coherent need for
communities to work together by shaping shared KPIS
We believe the adoption of these points (standardisation of processes, communities working together and a coherent way of working) will lead to successful project delivery. Certainly the focus on integration of local government and healthcare, will offer both economic and operational advantages to all organisations.
The 2015 NHS Estates Review Making best use of all asset classes
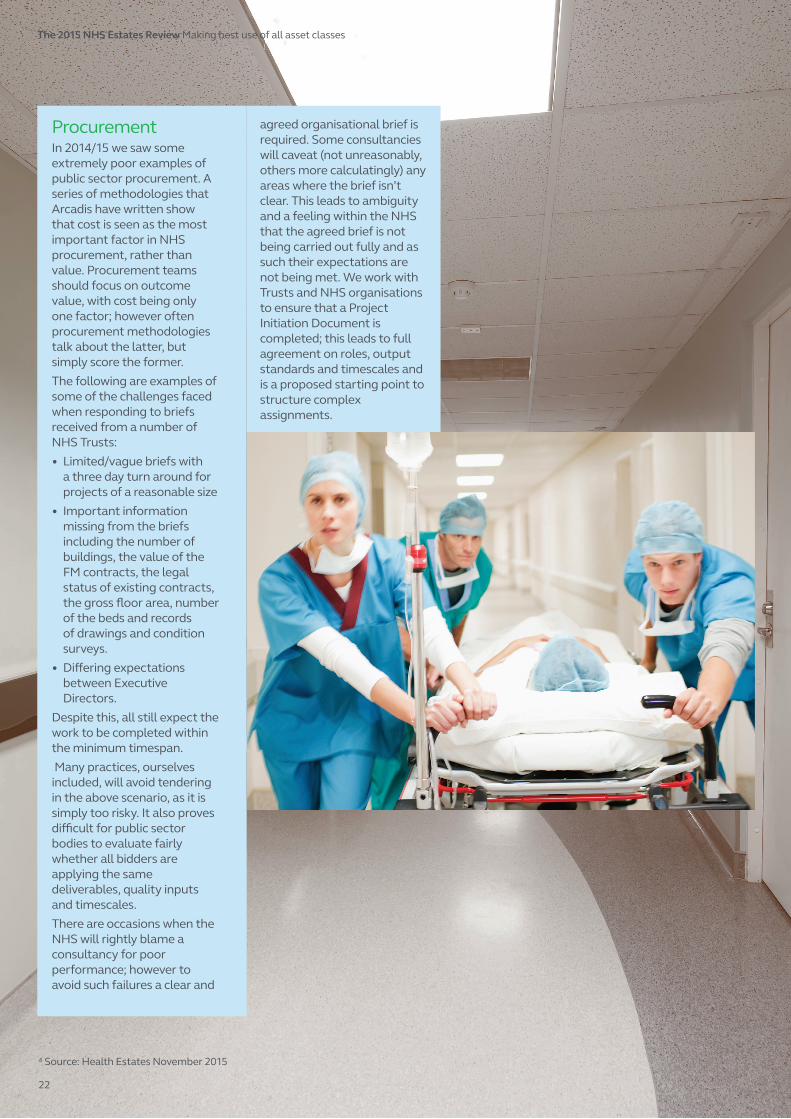
Procurement In 2014/15 we saw some extremely poor examples of public sector procurement. A series of methodologies that Arcadis have written show that cost is seen as the most important factor in NHS procurement, rather than value. Procurement teams should focus on outcome value, with cost being only one factor; however often procurement methodologies talk about the latter, but simply score the former. The following are examples of some of the challenges faced when responding to briefs received from a number of NHS Trusts:• Limited/vague briefs with
a three day turn around for projects of a reasonable size
• Important information missing from the briefs including the number of buildings, the value of the FM contracts, the legal status of existing contracts, the gross floor area, number of the beds and records of drawings and condition surveys.
• Differing expectations between Executive Directors.
Despite this, all still expect the work to be completed within the minimum timespan. Many practices, ourselves included, will avoid tendering in the above scenario, as it is simply too risky. It also proves difficult for public sector bodies to evaluate fairly whether all bidders are applying the same deliverables, quality inputs and timescales.There are occasions when the NHS will rightly blame a consultancy for poor performance; however to avoid such failures a clear and
22
agreed organisational brief is required. Some consultancies will caveat (not unreasonably, others more calculatingly) any areas where the brief isn’t clear. This leads to ambiguity and a feeling within the NHS that the agreed brief is not being carried out fully and as such their expectations are not being met. We work with Trusts and NHS organisations to ensure that a Project Initiation Document is completed; this leads to full agreement on roles, output standards and timescales and is a proposed starting point to structure complex assignments.
The 2015 NHS Estates Review Making best use of all asset classes
4 Source: Health Estates November 2015

23
There has been much progress made across many areas, with some great individual organisational practice and general improvements in the overall Estates policy direction. However, there are also some key tensions. The Carter report rightly identifies a need for savings, and metrics are being worked up to judge each Trusts performance against an overall set of benchmarks. This will be challenging to those Trusts that are still paying little heed to the Estate, either through tackling inefficiency or risk management.Whilst critics will point to PFI, particularly as evidence of operational inability to control costs, such PFI unitary charges represent 15.6% of the total NHS Estates expenditure. Therefore, not only can it be suggested that the NHS can proactively manage and obtain better value from those contracts, but also significantly improve upon the other 84% of the £8.3billion in Estate costs. Similarly, whilst NHS data quality has always been unpredictable, the data this year has been even more difficult to comprehend. Nevertheless, the key to delivering change is to concentrate on the elements of maximum benefit (product, process, performance and price). This criteria should form the backbone of the solution to the problem of how we can do more with less, whilst ensuring sustainable and safe services. Regrettably, the time inputs to operate an effective Estate takes the most senior staff Executives away from the core running of the business and improving patient experience. The way to move
forward in a positive direction is to learn from the best examples across all sectors and be clear about the feasibility of achieving the service standards at a reasonable price. Procurement has been exposed as wasteful, lacking in strategic goals and being too local and organisationally reliant, rather than being NHS output product orientated and as such, requires a radical overhaul. NHS England and its central organisations have agreed to reducing investment and a sizeable capital chunk is being taken from the NHS capital budget in 2016/17. This means that the service will not easily be able to modernise and the high risk strategy of leaving the way open for service and infrastructure failures continues. Whilst there are always options in service delivery, most are getting quantifiably more difficult to deliver effectively. Given the outlook for the next five years in the UK health sphere, it is imperative that change happens quicker in order for the system to survive. If the highest performing NHS organisations can share their work and partner with struggling Trusts, coupled with some “arranged mergers” and a better commissioning scheme, the system will survive intact and grow towards becoming a seamless, efficient health system.
CONCLUSION
On balance, they key positive outcomes are: the sustainability agenda is improving; the recognition of how all accommodation can be better utilised is increasing and the NHS has nearly £44 billion worth of assets which, with a more organisational focus, could achieve savings of significantly more than £1billion.Considering that this does not include the spare Estate that the government believe can produce extra housing and other public sector assets, whether that be villages, schools or capital receipts, there are clearly ways in which Estates can make better use of their assets and ease the pressure on the majority of Trusts facing financial difficulties.

CONTACTConor EllisHealthcare Sector Leader for UK & EuropeT +44 (0)161 245 8807M +44 (0)7792 070 740E [email protected]
ConorEllis9
@ArcadisUK
Arcadis United Kingdom
www.arcadis.com