NHL Shot Probability Maps Michael Schuckers St. Lawrence University [email protected] Powerpoint...
37
NHL Shot Probability Maps Michael Schuckers St. Lawrence University [email protected] Powerpoint slides based upon poster presentation at 2010 Joint Statistical Meetings Vancouver, BC August 2, 2010 Michael Schuckers (NHL Spatial Shot Analysis)
-
Upload
marcella-keasey -
Category
Documents
-
view
214 -
download
0
Transcript of NHL Shot Probability Maps Michael Schuckers St. Lawrence University [email protected] Powerpoint...

NHL Shot Probability MapsMichael Schuckers
St. Lawrence [email protected]
Powerpoint slides based upon poster presentation at 2010 Joint Statistical Meetings
Vancouver, BCAugust 2, 2010
Michael Schuckers (NHL Spatial Shot Analysis)

Michael Schuckers (NHL Spatial Shot Analysis)
DATA
• Based on all NHL regular season shots 08-09 and 09-10– Excludes penalty shots, empty net shots,
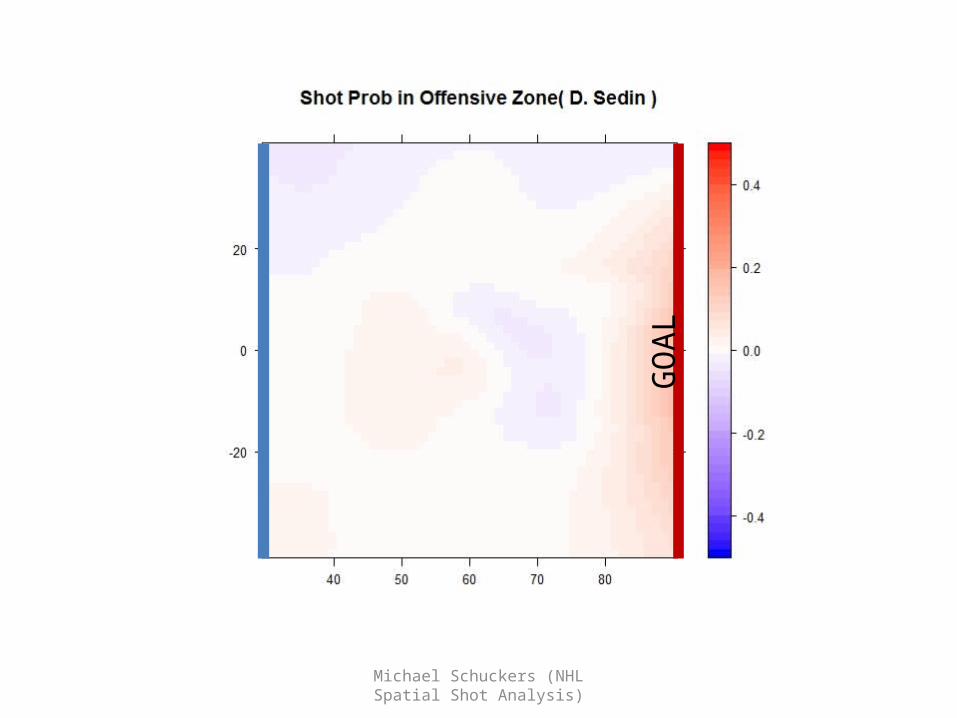
shootouts• Spatial mapping of probability of a goal • Offensive Zone: Blue line to Goal line– [Blue line at left, Goal at Right]

Michael Schuckers (NHL Spatial Shot Analysis)
League Average (Darker is higher)
Blue Line Goal Line
GO
AL

Michael Schuckers (NHL Spatial Shot Analysis)
Goal probability maps
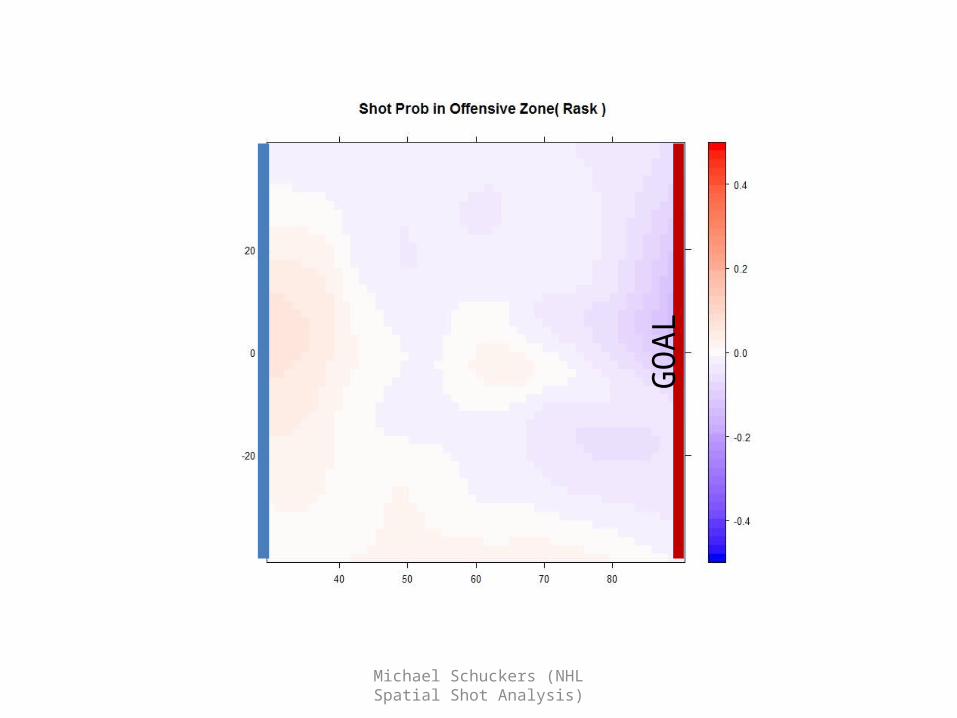
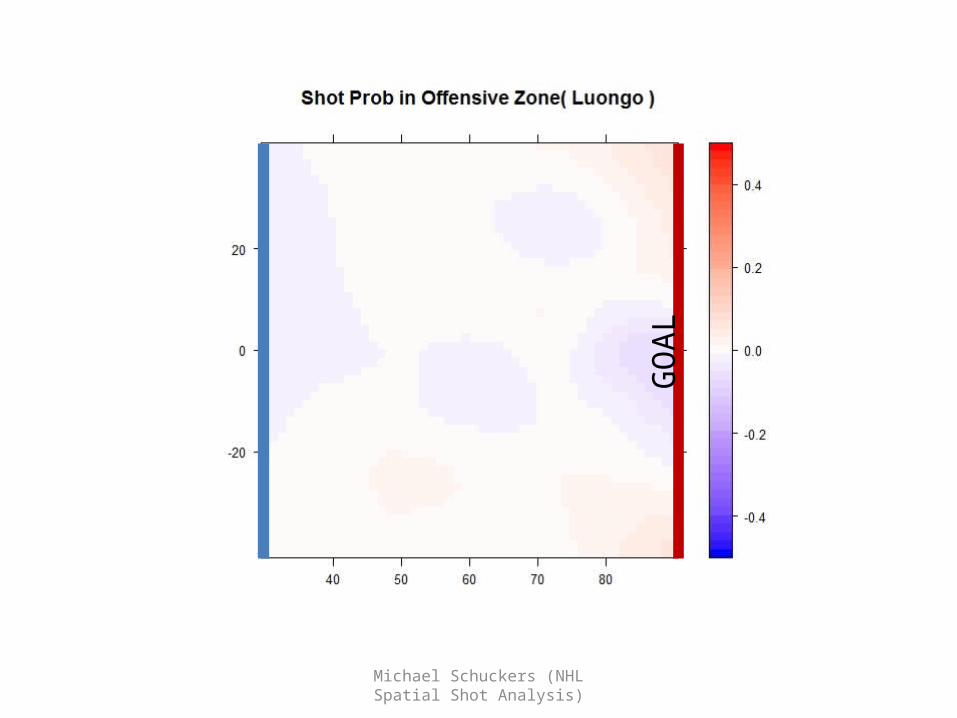
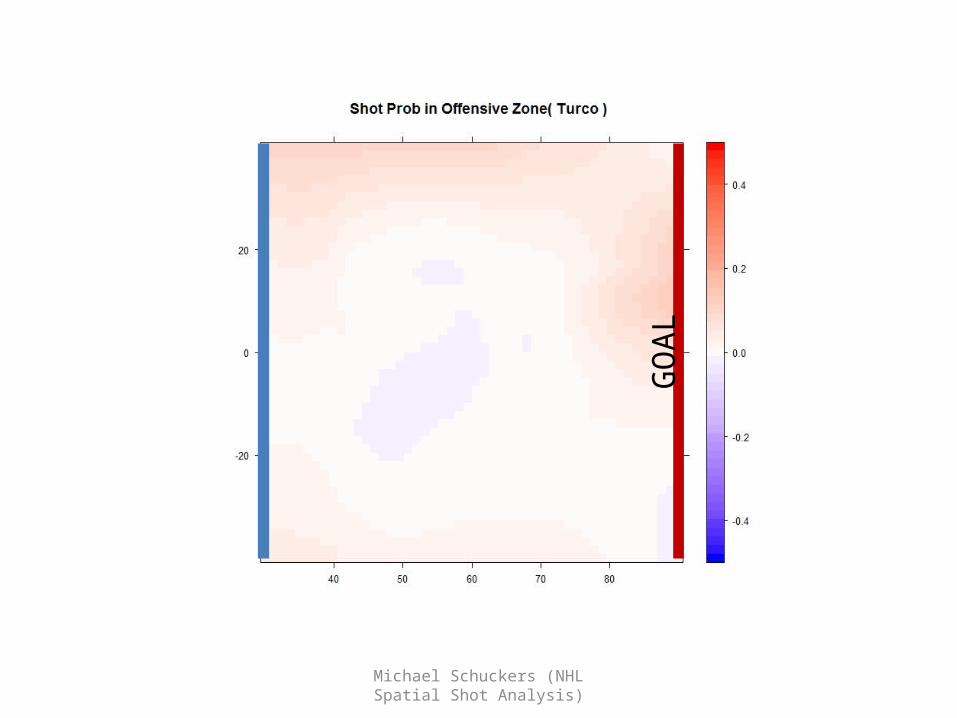
• Maps are differences from league-wide average probability of a goal at a given location– Red above average (Good for shooters)– Blue below average (Good for goalies)– White is league average

Michael Schuckers (NHL Spatial Shot Analysis)
Difference from League Averagefor each of the 5 holes/zones

Michael Schuckers (NHL Spatial Shot Analysis)
GO
AL

Michael Schuckers (NHL Spatial Shot Analysis)
GO
AL

Michael Schuckers (NHL Spatial Shot Analysis)
GO
AL

Michael Schuckers (NHL Spatial Shot Analysis)
GO
AL

Michael Schuckers (NHL Spatial Shot Analysis)
GO
AL
Michael Schuckers (NHL Spatial Shot Analysis)
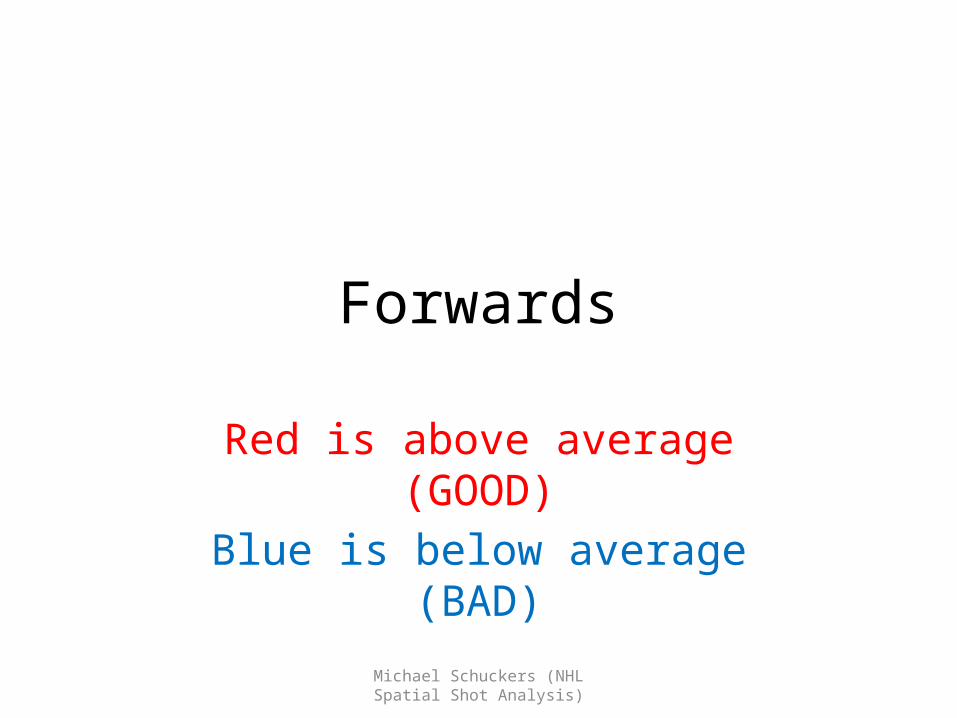
Forwards
Red is above average (GOOD)Blue is below average (BAD)

Michael Schuckers (NHL Spatial Shot Analysis)
GO
AL
Michael Schuckers (NHL Spatial Shot Analysis)
GO
AL

Michael Schuckers (NHL Spatial Shot Analysis)
GO
AL

Michael Schuckers (NHL Spatial Shot Analysis)
GO
AL

Michael Schuckers (NHL Spatial Shot Analysis)
GO
AL

Michael Schuckers (NHL Spatial Shot Analysis)
GO
AL

Michael Schuckers (NHL Spatial Shot Analysis)
GO
AL

Michael Schuckers (NHL Spatial Shot Analysis)
GO
AL

Michael Schuckers (NHL Spatial Shot Analysis)
GO
AL

Michael Schuckers (NHL Spatial Shot Analysis)
GO
AL

Michael Schuckers (NHL Spatial Shot Analysis)
GO
AL

Michael Schuckers (NHL Spatial Shot Analysis)
GO
AL

Michael Schuckers (NHL Spatial Shot Analysis)
GO
AL

Michael Schuckers (NHL Spatial Shot Analysis)
Goalies
Red is above average (BAD)Blue is below average (GOOD)

Michael Schuckers (NHL Spatial Shot Analysis)
Martin Broudeur – Goalie – New Jersey DevilsG
OAL

Michael Schuckers (NHL Spatial Shot Analysis)
GO
AL
Michael Schuckers (NHL Spatial Shot Analysis)
GO
AL

Michael Schuckers (NHL Spatial Shot Analysis)
GO
AL
Michael Schuckers (NHL Spatial Shot Analysis)
GO
AL

Michael Schuckers (NHL Spatial Shot Analysis)
GO
AL

Michael Schuckers (NHL Spatial Shot Analysis)
GO
AL

Michael Schuckers (NHL Spatial Shot Analysis)
GO
AL

Michael Schuckers (NHL Spatial Shot Analysis)
GO
AL
Michael Schuckers (NHL Spatial Shot Analysis)
GO
AL

Michael Schuckers (NHL Spatial Shot Analysis)
GO
AL

Michael Schuckers (NHL Spatial Shot Analysis)
Shot Prob in Offensive Zone( A. Niemi )
-20
0
20
40 50 60 70 80
-0.4
-0.2
0.0
0.2
0.4
GO
AL