NHK Broker October 2016 V15 - Nighthawk Gold. .com $0.075 – Feb. 25 – Announces Acq’n of...
21
Transcript of NHK Broker October 2016 V15 - Nighthawk Gold. .com $0.075 – Feb. 25 – Announces Acq’n of...

www. .com
FFORWARD LOOKING INFORMATION
This presentation contains “forwarding-looking information”. This forward-looking information is made as of the date of thispresentation and Nighthawk Gold Corp. does not intend, and does not assume any obligation, to update these forward-lookingstatements.
Any statements that express or involve discussions with respect to predictions, expectations, beliefs, plans, projections, objectives,assumptions or future events or performance are not statements of historical fact and may be “forward-looking information”.Forward looking information in this presentation includes, but is not limited to, statements with respect to exploration, developmentand production (including without limitation baseline studies, resource estimations, consultations, scoping studies, permitting,feasibility studies, rehabilitation and mining), results and success of exploration activities, potential deposits (including withoutlimitation cash flows, net present values, rates of return and payback times), potential acquisitions and expenditures.
Forward-looking information involves known and unknown risks, uncertainties and other factors which may cause the actual results,performance or achievements of the Company to be materially different from any future results, performance or achievementsexpressed or implied by the forward-looking information. Such factors include, among others, risks related to government regulation;actual results and success of exploration, development and production activities; changes in project parameters as to plans continueto be refined; the ability to enter into joint venture or to acquire or dispose of property interests; future prices of mineral resources;changes in underlying assumptions used to generate projections as to cash flows, net present values, rates of return and paybacktimes (including without limitation, changes in interest rates); accidents, labour disputes and other risks of the mining industry; abilityto obtain financing; and delays in obtaining governmental approvals or financing. Additional information regarding the Company isfiled under the profile of Nighthawk Gold Corp. on the SEDAR website at www.sedar.com, and readers are advised to refer to suchdocuments for further information.
2

www. .com
97.6% of Drill Holes Hit Gold Mineralization
100% Owned Land Position222,203 acres (809 km2) = 90% of Indin-Lake Gold CampNumerous targets – vastly underexplored
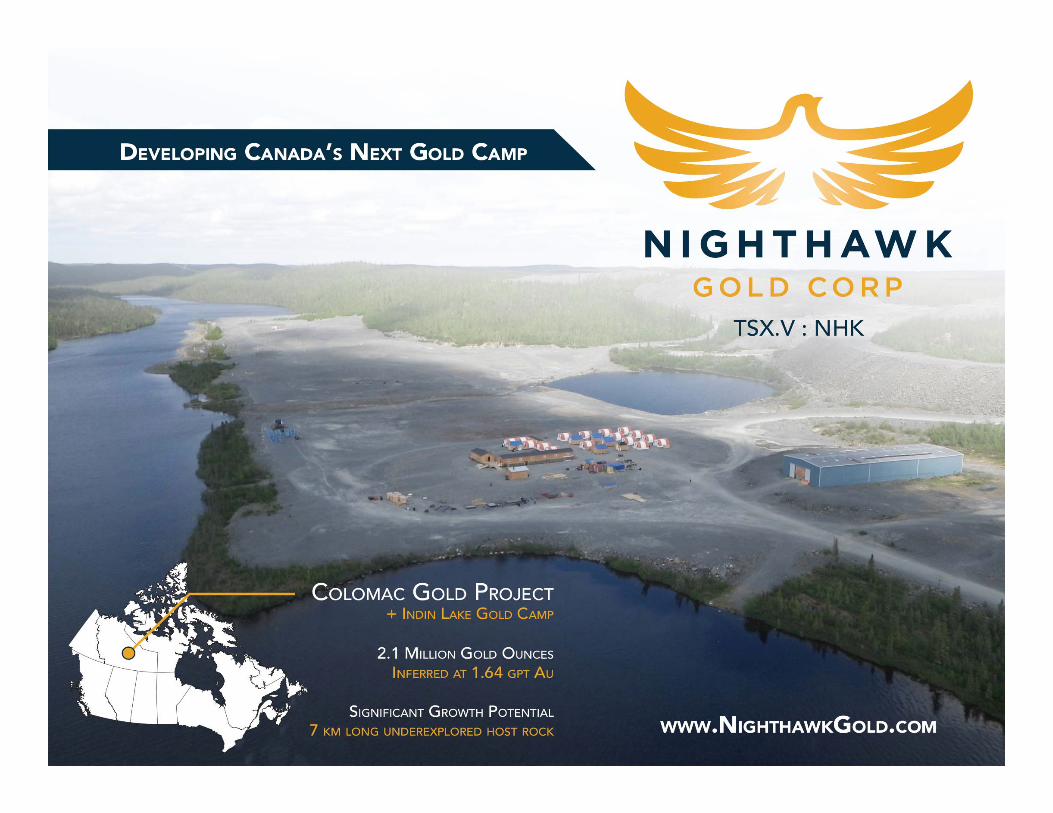
Colomac Gold Deposit2.1 Moz. Inferred Resource @ 1.64 gpt gold(0.6 gpt cut-off value; prepared in compliance with NI 43-101 in 2013)
1.8 Moz. @ 1.94 gpt using 1.0 gpt cut-off value(Inferred from Sensitivity Analysis)Wide zones of near surface mineralizationFavorable to bulk mining techniquesNo royalties
Significant Growth PotentialWithin 7 km long, underexplored host rockPotential for multi-million ounce resourceConfirmed several high-grade gold zones
$8 per oz. Discovery CostIndustry average > $3241 holes drilled in 2014-15 programs
Significantly undervalued Peer group average trading 2x higher on a EV / oz Au basis
Kinross Gold – Strategic Investment (9.5%)
3
HHIGHLIGHTS
Yellowknife
Indin Lake Gold

www. .com
Ernie Eves DirectorFormer Premier of OntarioFormer Ontario Minister of Finance
MANAGEMENT & DIRECTORS
Morris Prychidny Director35+years experience in the mining and real-estate industries Board member of numerous investment and mining companies
Brent Peters Director15+ years of experience in the mineral exploration businessVP, Finance of Northfield CapitalFormer CFO of Gold Eagle Mines Ltd
Dr. Michael Byron President & CEO, Director30+ years experience in mineral exploration and senior management Former VP Exploration for Lake Shore Gold Corp and Falco Resources LtdTrack record building gold resources
Luc Lessard DirectorSr. VP, Technical Services of Osisko Gold RoyaltiesMining engineer with +25 year experience, including building the Canadian Malartic MinePresident & CEO of Falco Resources Ltd
Brian Howlett DirectorCPA with 25+ years of experience in senior financial rolesProven track record of adding value to clients and employersOfficer/Director experience with junior exploration companies
4
Michael Leskovec CFOCPA with 15+ years of financial experience within public practice and the mining industryVP, Financial Reporting of Northfield CapitalFormer Officer of Gold Eagle Mines Ltd

www. .com
$00.075 – Feb. 25 – Announces Acq’n of Superior Copper$0.17 – May 27 – Completes Acq’n of Superior Copper$0.33 – Jun. 29 – Closes $6M Financing$0.39 – Jul. 5 – Commenced 2016 Drill Program$0.58 – Sep. 13 – First Results from 2016 Drilling, Intersecting 52.07 m of 7.72 g/t Gold
$0.51 – Oct. 12 – Results from 2016 Drilling, Intersecting 72.65 m of 5.58 g/t Gold$0.57 – Oct. 13 – Announces Strategic Investment by Kinross Gold & $10.1M Financing
Shar
e P
rice
(C
$)
Positive share price movement over the past 12 months
ONE YEAR SHARE PERFORMANCE
5
Vo
lum
e Tr
aded
(Sh
ares
)
Source: FactSet.

www. .com 6
As at October 21, 2016 (in millions C$) Shares /Market Cap
In-the-Money
Proceeds
Shares outstanding (basic) 135.7(a)
Warrants outstandingExpiry Date – Nov. 20, 2016 – Strike Price @ $0.15 2.2(a) $0.4
Options outstandingIn-the-money Options (avg. strike price - $0.28)Out-of-money Options (avg. strike price - $0.61)
8.5(a)
1.7$2.4
Shares outstanding (in-the-money diluted, sum of (a)) 146.4
Closing share price $0.51/share
Market capitalization (basic) $69.2
Cash $5.5 $2.8
Enterprise value $63.7 $30/oz
Summer 2016 Exploration Program (complete)- Drilling costs (8,400 m)- Prospecting costs
$2.77$0.24
$330/m
Remaining FT expenditures to spend / Hard $ $2.0 $3.5
Annual G&A budget $0.5
SHARE STRUCTURE & CASH
6
17%
7%
4%
3%
69%
Ownership Structure
Northfield Capital Corporation
Osisko Royalties
Dundee Corporation
Board / Management
Other Retail and Institutional
www. .com 7
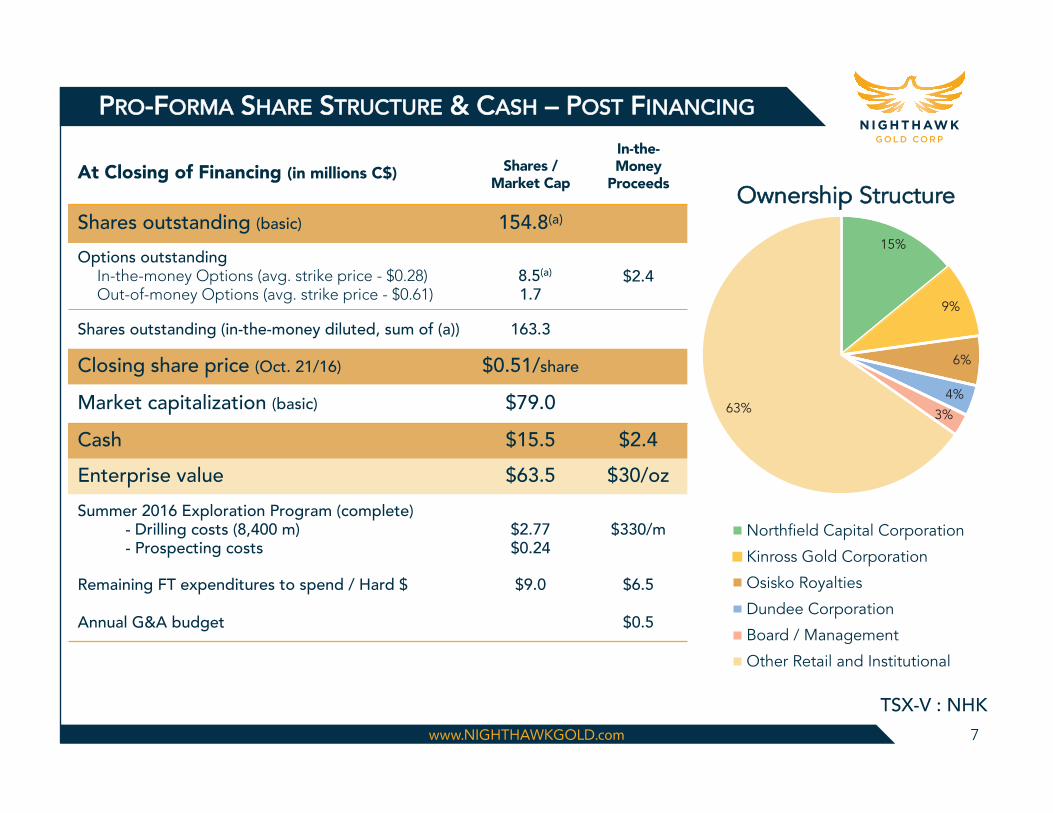
At Closing of Financing (in millions C$) Shares /Market Cap
In-the-Money
Proceeds
Shares outstanding (basic) 154.8(a)
Options outstandingIn-the-money Options (avg. strike price - $0.28)Out-of-money Options (avg. strike price - $0.61)
8.5(a)
1.7$2.4
Shares outstanding (in-the-money diluted, sum of (a)) 163.3
Closing share price (Oct. 21/16) $0.51/share
Market capitalization (basic) $79.0
Cash $15.5 $2.4
Enterprise value $63.5 $30/oz
Summer 2016 Exploration Program (complete)- Drilling costs (8,400 m)- Prospecting costs
$2.77$0.24
$330/m
Remaining FT expenditures to spend / Hard $ $9.0 $6.5
Annual G&A budget $0.5
PRO-FORMA SHARE STRUCTURE & CASH – POST FINANCING
7
15%
9%
6%
4%
3%63%
Ownership Structure
Northfield Capital Corporation
Kinross Gold Corporation
Osisko Royalties
Dundee Corporation
Board / Management
Other Retail and Institutional
www. .com
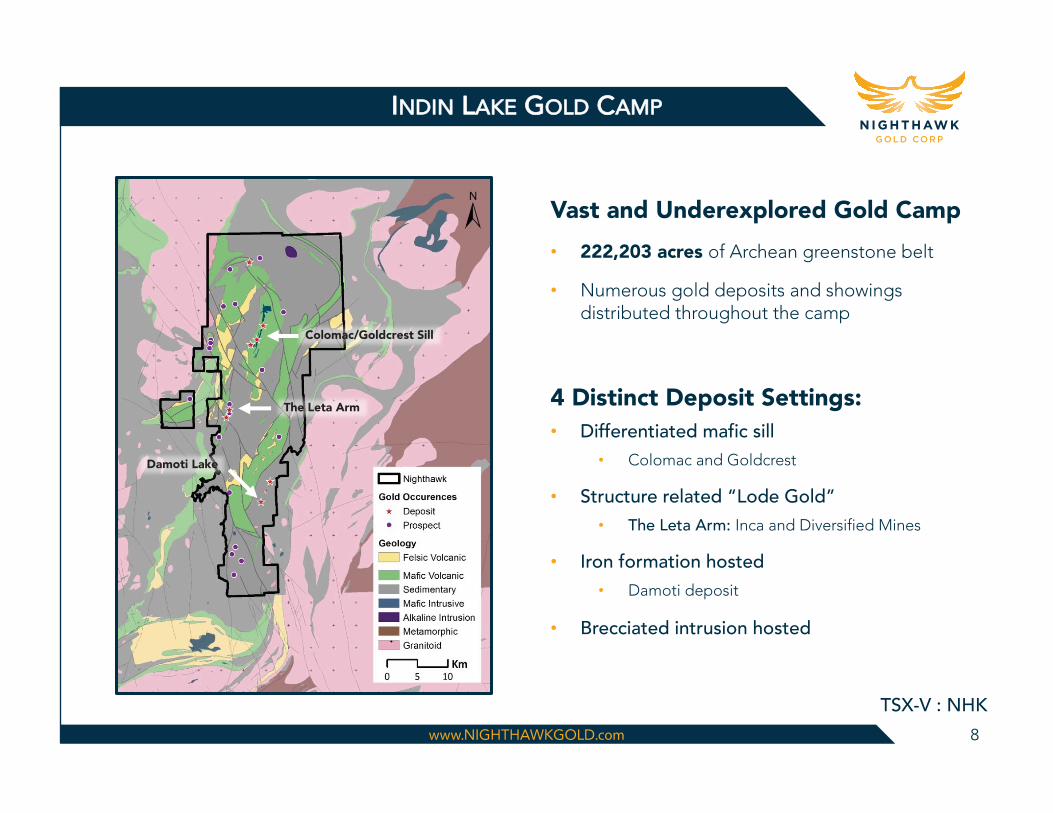
Vast and Underexplored Gold Camp
222,203 acres of Archean greenstone belt
Numerous gold deposits and showings distributed throughout the camp
4 Distinct Deposit Settings:Differentiated mafic sill
Colomac and Goldcrest
Structure related “Lode Gold”The Leta Arm: Inca and Diversified Mines
Iron formation hosted Damoti deposit
Brecciated intrusion hosted
Colomac/Goldcrest Sill
The Leta Arm
Damoti Lake
INDIN LAKE GOLD CAMP
8

www. .com
Kalgoorlie (Western Australia)
CCOLOMAC ANALOGUE
9
Kalgoorlie and Colomac deposits - hosted by fractionated mafic intrusions cutting mafic volcanic rock packageSimilar age rocks with similar styles of deformation and alterationGold concentrated within the more silica-rich fractions (top of sills) - largely controlled by structure
Indin Lake (NWT)

www. .com
A
B
D
C
E
F
G
* Inferred Mineral Resource estimate of 39.815 million tonnes with an average grade of 1.64 g/t gold for 2.101 million ounces gold using a cut-off grade of 0.6 g/t gold.
** These results are historical in nature and Nighthawk has not independently verified the results.
INDIN LAKE GOLD PROSPECTS
Colomac & Goldcrest2.1 Moz @ 1.64 gpt Au Inferred*
A
Leta Arm 26.0 m of 6.86 gpt Au
16.9 m of 6.08 gpt Au11.75 m of 7.23 gpt Au
B Damoti Lake 10.53 m of 63.48 gpt Au
11.25 m of 32.21 gpt Au23.5 m of 13.91 gpt Au
C
Treasure Island 238.43 m of 0.73 gpt Au
Incl. 29 m of 2.45 gpt Au
D JPK Great prospecting results
Never drilled
E
Fishhook 8.6 m of 14.21 gpt Au**
13.55 m of 7.36 gpt Au**
12.92 m of 5.44 gpt Au**
F Echo-Indin3.50 m of 9.00 gpt Au
7.00 m of 2.77 gpt Au
G
9
Seven Highly Prospective Targets

www. .com
CCOLOMAC OVERVIEW
10
Colomac resource consists of 5 gold deposits – only 2 drilled by Nighthawk –exceptional growth potential
Two parallel mafic sills host most of the mineralization found to date - 7 km long Colomac Sill and 2 km long Goldcrest Sill –open laterally and to depth
Differentiated sills with tops to the east
Strong correlation between gold and silica rich upper portion of the sills
Newly discovered high-grade zones -significant size and continuity – priority exploration targets
Gold along greenstone/sedimentary contacts (24 and 27 deposits to the east and Grizzly Bear deposit to the west)

www. .com
CCOLOMAC LONG SECTION
12
2.1 Moz Au at 1.64 gpt Inferred ResourceResource estimate completed at 0.6 gpt cut-off value1.8 Moz at 1.94 gpt using 1.0 gpt cut-off value inferred from sensitivity analysis
Gold Occurs Throughout the Colomac SillThe Colomac Main Sill is 7 km long, up to 160 m wideGold intersected down to 800 m
Significant Growth PotentialLimited drilling below 100 m and at the north end of the Sill
Potential higher-grade shoots also identified at the Goldcrest Sill
Open laterally and at depth
97.6% Drill Holes Hit Gold Mineralization
7 km
> 15 Metal Factor (grade x width)
Drill Coverage
Zone 1.5 intercepts52.50 m @ 7.78 gpt Au (2014)32.95 m @ 4.19 gpt Au (2015)52.07 m @ 7.72 gpt Au (2016)72.65 m @ 5.58 gpt Au (2016)90
0 m
Past Producing Pit
North
Unexplored
203.40 m @ 2.49 gpt Au (*down plunge)
Zone 3.5 | Zone 3.0 | Zone 2.5 | Zone 2 | Zone 1.5 | Zone 1.0
46.15 m @ 2.81 gpt Au
26.10 m @ 3.00 gpt Au
4.57 m @ 7.63 gpt and 12.19 m @ 3.24 gpt (* Historic, 1997)
7.32 m @ 2.98 gpt (* Historic, 1997)

www. .com
COLOMAC CROSS SECTIONS
Hole C12-15203.40 m @ 2.49 gpt *Down Dip*
Continuity of mineralization – host width and to depth
A
Hole C12-01 & 1B128m @1.36 gpt
incl 46.15m @ 2.81 gpt and 8.65m @ 6.83 gpt
B
13
Zone 3.5 Zone 2.0
B C DA
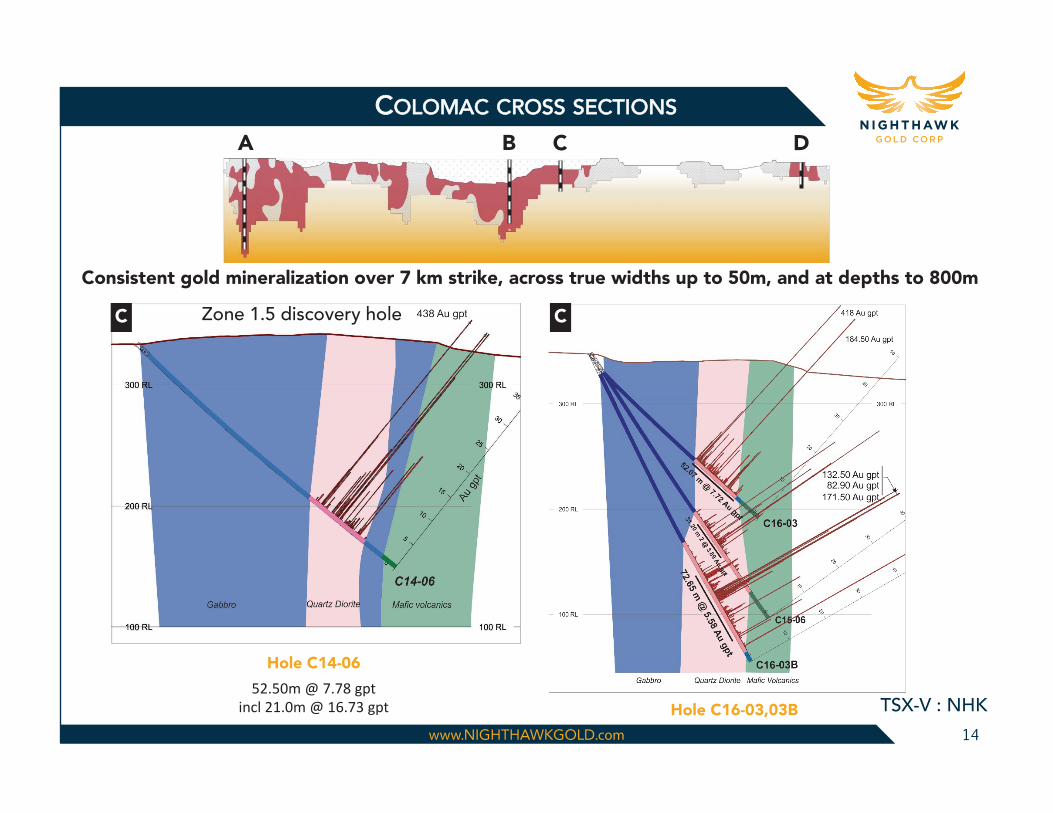
Consistent gold mineralization over 7 km strike, across true widths up to 50m, and at depths to 800m
www. .com
COLOMAC CROSS SECTIONS
Hole C14-06
C
Hole C16-03,03B
Consistent gold mineralization over 7 km strike, across true widths up to 50m, and at depths to 800m
B C DA
14
CZone 1.5 discovery hole

www. .com
COLOMAC CROSS SECTIONS
Hole C16-01
31.45m @ 4.14 gpt
incl 13.75m @ 6.52 gpt
C
Consistent gold mineralization over 7 km strike, across true widths up to 50m, and at depths to 800m
B C DA
15
Hole C15-03
43.10m @ 1.13 gpt
incl 8.45m @ 2.23 gpt
DZone 1.5 Zone 1.0
www. .com
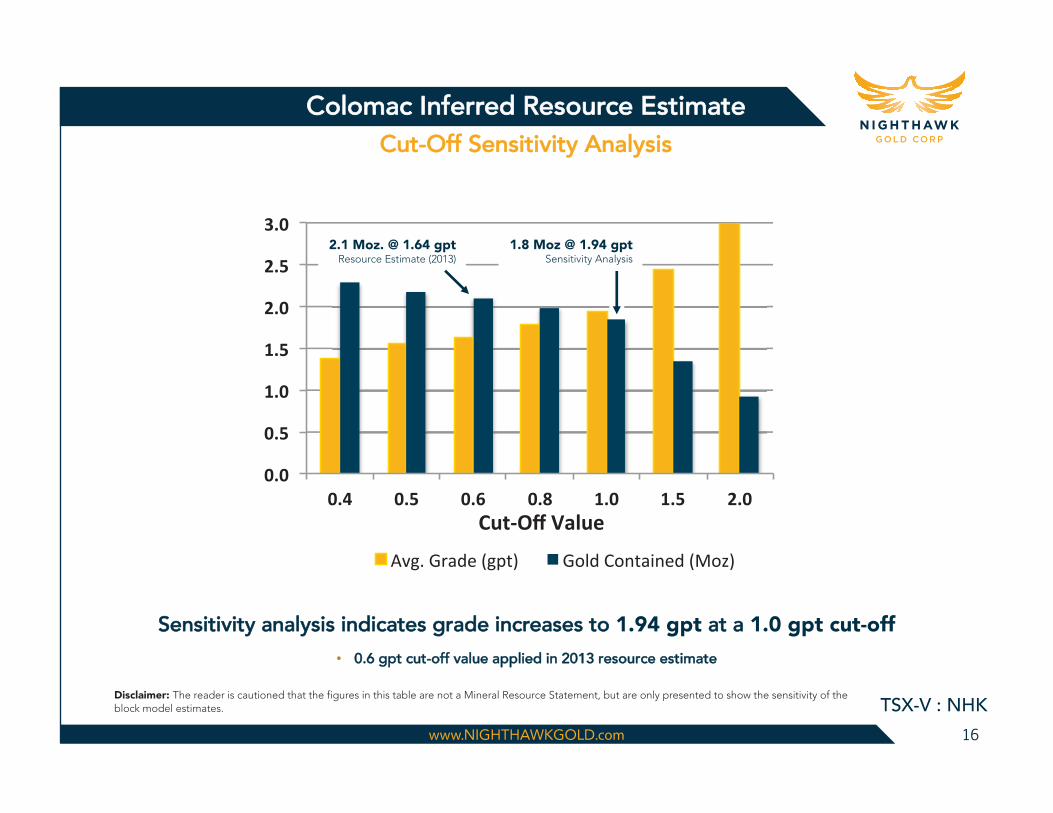
Disclaimer: The reader is cautioned that the figures in this table are not a Mineral Resource Statement, but are only presented to show the sensitivity of the block model estimates.
CColomac Inferred Resource EstimateCut-Off Sensitivity Analysis
Sensitivity analysis indicates grade increases to 1.94 gpt at a 1.0 gpt cut-off0.6 gpt cut-off value applied in 2013 resource estimate
2.1 Moz. @ 1.64 gptResource Estimate (2013)
1.8 Moz @ 1.94 gptSensitivity Analysis
16

www. .com
CCOLOMAC DRILLING TO DATE
2012 --- 11,235m --- Maiden drill program
High-grade gold verified at Zone 3.5
Extended Zone 2.0 to depthBasis for NI 43-101 compliant resource update
2014 --- 3,643mNew high-grade shoot intersected at Zone 1.5
52.50 m of 7.78 gpt goldIncluding 21.00 m of 16.73 gpt gold
Expanded Zones 2.0 and 2.5
2015 --- 2,080m
Follow-up on Zone 1.532.95 m of 4.19 gpt goldIncluding 12.33 m of 7.77 gpt gold
Extended 60m along strike and vertically to 175mOpen in all directions
Wide mineralized intersections at Zone 1.043.10 m of 1.13 g/t goldIncluding 8.45 m of 2.23 g/t gold
2 km north of Zone 1.5
Possible indication of high-grade system
17

www. .com
400 metres west of Colomac
Goldcrest mineralization hosted by an intrusive similar to Colomac
Better gold grades
Drilled 400 m along strike and to 330 m depth
6,038 metres drilled in 2014
New high-grade gold zone candidates
40.00 m of 2.52 gpt Auincl. 12.50 m of 3.64 gpt Auand 5.20 m of 7.78 gpt Au
20.25 m of 4.83 gpt Au, incl. 5.25m of 10.21 gpt Au
19.60 m of 4.19 gpt Au, incl. 7.90 m of 7.85 gpt Au
GGOLDCREST
18

www. .com
SSUMMER 2016 DRILL PROGRAM
2014 Drill $/Metre = $307 (13,647m) 3 Drills

www. .com
RRECENT NEWS RELEASES
19

www. .com
SUMMARY
21
A
B
D
C
E
F
G
7 mineralized targets
2.1 Moz. Inferred Resource @ 1.64 gpt(0.6 gpt cut-off value; prepared in compliance with NI 43-101 in 2013)
1.8 Moz. @ 1.94 gpt using 1.0 gpt cut-off value(Inferred from Sensitivity Analysis)
Significantly undervalued Peer group average trading 2x higher on a EV / oz Au basis
Significant Growth Potential at Colomac7 km long underexplored host rockGold intersected at 800m depthPotential for multi-million ounce resource
97.6% of Drill Holes Hit Gold Mineralization
Vast and Underexplored Gold Camp222,203 acres of Archean greenstone beltNumerous gold deposits throughout the camp
A) Colomac & Goldcrest
B) The Leta Arm
C) Damoti Lake
D) Treasure Island
E) JPK
F) Fishhook
G) Echo-Indin
7 km
> 15 Metal Factor (grade x width)
Drill Coverage
Zone 1.5 intercepts52.50 m @ 7.78 gpt Au (2014)32.95 m @ 4.19 gpt Au (2015)52.07 m @ 7.72 gpt Au (2016)72.65 m @ 5.68 gpt Au (2016)
90
0m
Past Producing Pit
North
Unexplored
203.40 m @ 2.49 gpt Au (*down plunge)
Zone 3.5 | Zone 3.0 | Zone 2.5 | Zone 2 | Zone 1.5 | Zone 1.0
46.15 m @ 2.81 gpt Au26.10 m @ 3.00 gpt Au
4.57 m @ 7.63 gpt and 12.19 m @ 3.24 gpt (* Historic, 1997)
7.32 m @ 2.98 gpt (* Historic, 1997)
m @