NHDOT Overview, CY2016 Construction & Major Projects … · NHDOT Overview, CY2016 Construction &...
31
Presentation to Senate Transportation Committee NHDOT Overview, CY2016 Construction & Major Projects & A Look Ahead Presented by: Christopher Waszczuk & Pete Stamnas Deputy Commissioner Director of Project Development January 17, 2017
Transcript of NHDOT Overview, CY2016 Construction & Major Projects … · NHDOT Overview, CY2016 Construction &...

Presentation to Senate Transportation Committee
NHDOT Overview, CY2016 Construction & Major Projects
& A Look Ahead Presented by:Christopher Waszczuk & Pete Stamnas Deputy Commissioner Director of Project Development
January 17, 2017

NHDOT Overview
2

MissionTransportation excellence enhancing the
quality of life in New Hampshire
PurposeTransportation excellence in New Hampshire
is fundamental to the state’s economic development. The Department is charged with providing safe travel options for people and goods and to provide a system that is well
maintained, efficient, and reliable.
3

4

• 1,639 permanent employees
• 2,159 State Bridges– State Red List – 154 (7%)– State near red List – 289
• 1,687 Municipal Bridges– Municipal Red List – 344 (21 %)
• All bridges inspected every two years, red list bridges inspected more frequently
Key Facts About NHDOT5

– Approx. 4,600 centerline miles of roadway managed (additional 300 town maintained)
– Annual paving totals 550 centerlinemiles per year
– Maintain more than 100,000 highway signs,75 million feet striping, 430 traffic signals
Key Facts About NHDOT6

– FY 2016 Actual Expenditures = $600 million • Operating Costs = $241 million• Municipal Aid and Construction Costs = $359 million
– Comprised of various funding sources• Highway Fund, Turnpike Fund, Federal funds, General Fund,
Other revenue
Key Facts About NHDOT7

15000
17000
19000
21000
23000
25000
27000
29000
1500
1550
1600
1650
1700
1750
1800
1850
1900
1950
2000
Daily V
ehicle M
iles Travel
(DVMT)
# of Positions
Years
NHDOT Positions vs. DVMT
# of PositionsDVMTLinear (DVMT)
VMT 16% increase17% fewer positions513 additional lane miles
Currently 1,639 permanent employees: 17% fewer than in 199265% of Staff eligible for retirement in next 5 years
* FY14 includes 21 unfunded positions
8
NHDOT - Positions

FY 2016 Advertisement Schedule & Construction
Program
9

2016 Advertisement Schedule99 Projects Advertised for Bids in FFY16 Totaling $366M
$100M Federal ($17.4M in Federal Redistribution Funds Rec’d in September) $77M Turnpike $19M Betterment $20M SB367 $146M TIFIA $4M Other
http://www.nh.gov/dot/org/projectdevelopment/planning/documents/FinalAdSchedule2016.pdf
10
FFY16 - Highest Contract Value Advertised in
Department’s History
$208
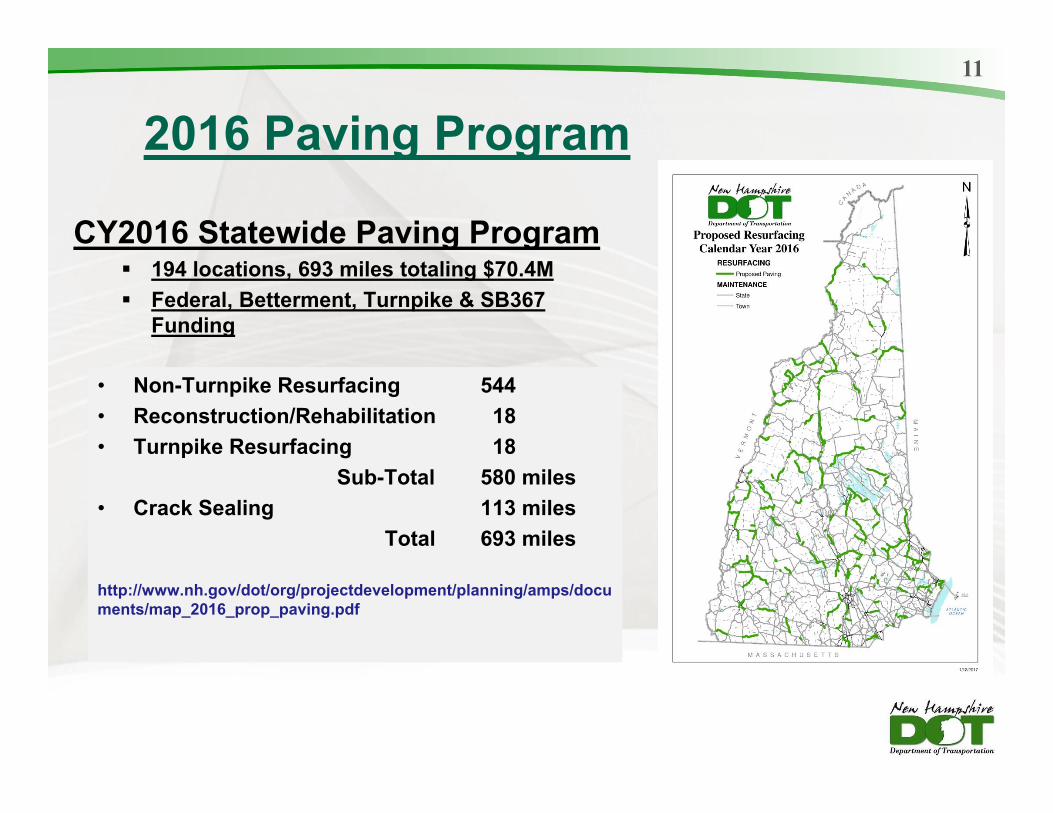
2016 Paving Program
• Non-Turnpike Resurfacing 544• Reconstruction/Rehabilitation 18• Turnpike Resurfacing 18
Sub-Total 580 miles• Crack Sealing 113 miles
Total 693 miles
http://www.nh.gov/dot/org/projectdevelopment/planning/amps/documents/map_2016_prop_paving.pdf
CY2016 Statewide Paving Program 194 locations, 693 miles totaling $70.4M Federal, Betterment, Turnpike & SB367
Funding
11

2016 Bridge Program
CY2016 Statewide Bridge Program
2159 State Bridges, 154 Red List Bridges 11 Red List Bridge Projects Advertised in
FY16 - $26M 16 Red List Bridges are under
Construction - $132M 11 Red List Bridges were rehabilitated by
Bridge Maintenance - $2.3M By end of CY2016, expect 17 Red List
Bridges to be added and 20 Red List Bridges will be removed.
In addition, 22 Projects were advertised in CY2016 to undertake bridge preservation and rehabilitation work on 56 bridges totaling $34M
12

SB 367 Funding13

SB367 Paving Locations14
* Total $ includes Betterment projects supplemented with SB367 funding.
CY2014, 2015, 2016 228 SB367 locations totaling more than 700 miles & $49.2M* Includes 14 rehabilitation locations totaling 21 miles

STATUS OF MAJOR PROJECTS
15

Sarah Long Bridge
Construction Schedule:
Construction began - Nov. 2014Bridge/US Bypass closed - Nov. 2016
New bridge open - Sept. 2017Demo/Project Complete - Summer 2018
Construction Cost - $173,400,000
16
Funding:Tiger Grant $ 25,000,000 NH share $ 74,200,000Maine share $ 74,200,000
Total Construction Cost $173,400,000

Newington-Dover Spaulding Turnpike ProjectNewington-Dover Spaulding Turnpike Improvements & Little Bay Bridge• Overall N-D construction consists of five (5) major contracts & new Newington Maintenance Facility • N-D construction started in Sept 2010• Overall construction completion targeted in 2022• Overall Project Improves Safety & Alleviates Congestion• Estimated Construction Cost $229M ($31.4M federal earmarks & $198M Turnpike funds)
17
• New LBB construction completed• Newington construction completed• Existing LBB Rehabilitation underway –
completion anticipated September 2017 • Exit 6 Reconstruction Contract underway
(advertised in May 2016 - $67M )• GSB Rehabilitation in study phase (Est. $31M)• Newington Maintenance Facility in conceptual
engineering phase (Est. $6M)• Remaining two construction contracts –
Estimated cost - $37M

Manchester Exit 4 Millyard Bridges ProjectConstruction addressed 5 red-listed bridges on I-293/FEET in Manchester Major Components • Original Bridges built in late 1950’s (all 5 bridges nearly 60 years old)• 4 Red-list Bridges replaced, one Red-list bridge rehabilitated• Additional SB lane constructed to improve safety & access onto and off the FEET
Project entirely funded w/ Turnpike Funds (no federal funds) under Turnpike Capital Program• Construction Cost: $26.2 M • Construction Start Date: September 2013• Construction Completed: November 2016
18

I-93 Construction
19
Exit 2
Exit 3
• 5 construction projects - $160M• Reconstruct 5 miles & two exits• Construction began 2008• Construction completed in 2016
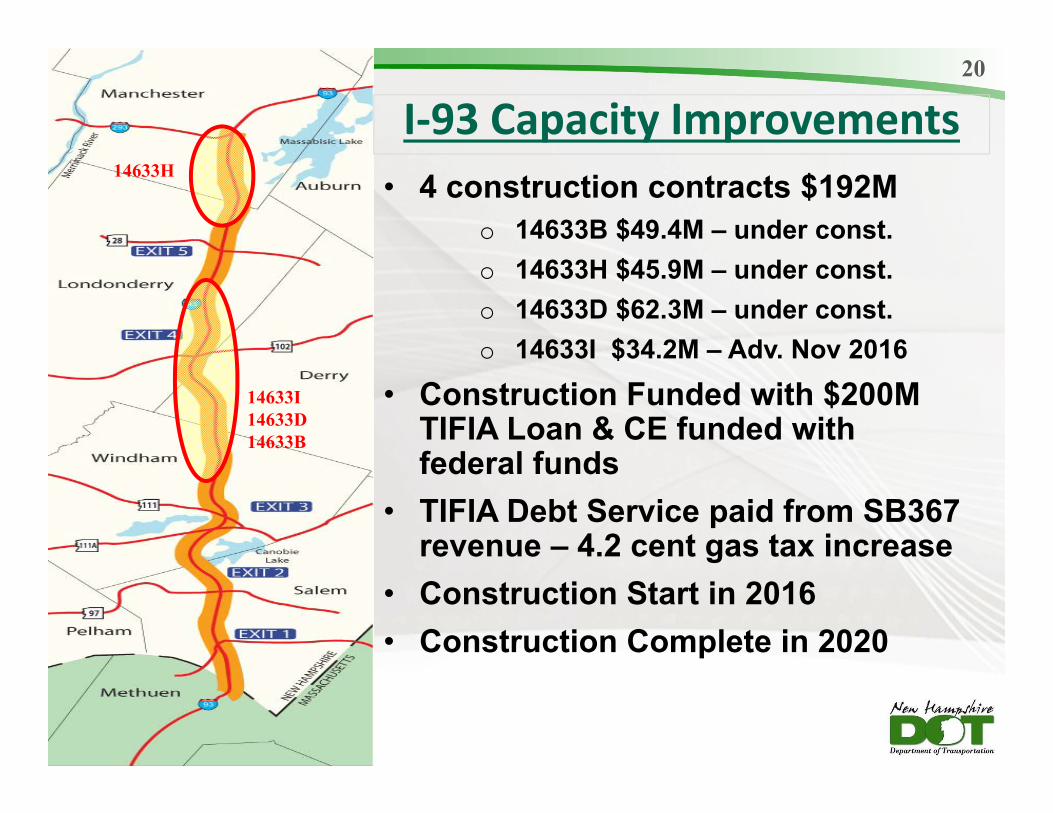
I‐93 Capacity Improvements• 4 construction contracts $192M
o 14633B $49.4M – under const.o 14633H $45.9M – under const.o 14633D $62.3M – under const.o 14633I $34.2M – Adv. Nov 2016
• Construction Funded with $200M TIFIA Loan & CE funded with federal funds
• TIFIA Debt Service paid from SB367 revenue – 4.2 cent gas tax increase
• Construction Start in 2016 • Construction Complete in 2020
14633H
14633I14633D14633B
20

I‐93 Fourth Lane• 2 construction contracts
o 14633J $10.8M – Adv. 2019o 13933A $14.7M – Adv. 2019
• Construction Funded with Remnant TIFIA Loan Proceeds & with conventional federal aid
• Funding Included in TYP (FY19 & FY20)
• Chloride Issue will need to be resolved prior to advancing to construction
14633J13933A
21

Derry-Londonderry 13065 I-93 Exit 4A easterly to NH 102 • $56.8M in approved TYP (2017-2022)
• $18.6M PE & ROW• $38.25M Construction (FY19-FY22)
• Supplemental DEIS – June 2016 thru June 2017• Public Hearing – Targeted for July 2017• Final EIS & Record of Decision – August 2017 thru December 2017• Final design, ROW Acquisition & Permitting – 2018 thru 2019• Construction – 2019 thru 2022
22
I‐93 Exit 4A
Towns’ Participation Capped at $10M

FY 2017 Advertisement Schedule
23

2017 Advertisement Schedule63 Projects Scheduled to Advertise for Bids in FFY17 Totaling $208M
$125M Federal $ 15M Turnpike $ 12M Betterment $ 12M SB367 $ 34M TIFIA $ 10M Other - Additional 10 Projects On-shelf in FFY17 Totaling $25M
24
$208

2017 Paving Program
• Non-Turnpike Resurfacing 531• Reconstruction/Rehabilitation 49• Turnpike Resurfacing 16
Sub-Total 596 miles• Crack Sealing 81 miles
Total 677 miles
CY2017 Statewide Paving Program 199 locations, 677 miles totaling $101.3M Federal, Betterment, Turnpike & SB367
Funding
25
This image cannot currently be displayed.

2017-2019 Paving ProgramCY2017 – CY2019 Statewide Paving Program
Crack Sealing, Preservation, Roughness, Light Capital Paving & Rehabilitation
559 locations, 1,949 miles totaling $242.2M Federal, Betterment, Turnpike & SB367
Funding
26
Note: CY 2019 assumes funding as shown in the Ten-Year Plan plus an additional $16M of on-shelf work (depending on future funding availability).
YEAR SECTIONS LENGTH BUDGET2017 199 677 $101,300,0002018 159 633 $62,695,0002019 201 639 $82,872,212Total 559 1,949 $246,867,212

A Look Ahead – Road ConditionBased on current level of investment in the TYP• Overall Pavement condition
is expected to remain unchanged
• Past years backlog of deficit paving has reduced the state’s overall pavement condition from a high of 81.6% of roads in good or fair condition to a current and projected level of 67.9%
27
Projected values do not include crack seal mileage

A Look Ahead – State Bridge Condition
Based on current level of investment in draft TYP• Number of State Red List Bridges (SRL)
- which is representative of bridges in poor condition (rating of 4 or lower) isexpected to increase
• Higher number of “pink list” bridges (rating of 5) today than 5 years ago
• Current SRL bridge total - 153• Bridges added to SRL by 2026 - 276
– 23 Bridges added annually over last five years – extrapolated to 2026 projects to 276 bridges
• Bridges expected to be removed from SRL by 2026 - 244
– 132 removed by Bridge Maintenance forces
– 112 removed under TYP
Based on Data Projected
1
144
157168 167
153146 140 137 137 139 142 148
140 145 147 153170
185
100
120
140
160
180
200
220
240
2000 2002 2004 2006 2008 2010 2012 2014 2016 2018 2020 2022 2024 2026
State Owne
d Re
d List Bridg
es
Year Reported
State Owned Red List Bridges (2000‐2026)
Actual Red List Bridges Projected Red List Bridges
Past Red List Bridge Count
Projected Estimate of Red List Bridge Count
Reflects 10 Red List Bridges on Municipal Highways acquired in 2001
1.
28

A Look Ahead – Municipal Bridge Condition
Based on current level of investment in draft TYP• Number of Municipal Red List Bridges
(MRL) - which is representative of bridges in poor condition (rating of 4 or lower) is likely to increase w/out additional funding
• Higher number of “pink list” bridges (rating of 5) today than 5 years ago
• Removal rate of 28/yr heavily influenced by $42M influx of funding (2008-2015 thru Bonding, ARRA & SB367)
• $17M annual municipal and/or additional state funds needed to maintain MRL level
• Current MRL bridge total - 344• Bridges added to MRL by 2026 - 276
– 23 Bridges added annually over last five years – extrapolated to 2026 projects to 276 bridges
• Bridges expected to be removed from MRL by 2026 - ??? (Dependent on additional municipal funding)
– 90 removed under TYP– ?? removed by Municipalities
397373
364 363370
358366
359353 352 351
344
280
300
320
340
360
380
400
2004 2006 2008 2010 2012 2014 2016 2018 2020 2022 2024 2026
Mun
icipally Owne
d Re
d List Brid
ges
Year Reported
Municipal Red List Bridges (2004‐2026)
Past Red List Bridge Count
Based on Data Projected ??
$17M/yr additional municipal and/or state funding needed to maintain same level
Municipally‐Owned Counts 2010 2011 2012 2013 2014 2015
Red Count ("4" or less) 366 359 353 352 351 344Pink Count ("5") 287 293 276 281 287 296Better than "5" Count ("6" thru "9") 968 983 1007 1002 999 998Black Count (non‐hwy/closed) 47 45 49 50 51 49Total Municipally‐Owned Count 1668 1680 1685 1685 1688 1687
29

State & Municipal Bridge Age
• Of the 3,846 State & Municipal Bridges, 1,208 are 75 years or older– 2,159 State Bridges – 650 are 75 years or older– 1,687 Municipal Bridges – 558 are 75 years or older
• Major Looming Liability if we do not invest in bridge maintenance and preservation efforts.
0‐4 yrs 5‐9 yrs 10‐14yrs
15‐19yrs
20‐24yrs
25‐29yrs
30‐34yrs
35‐39yrs
40‐44yrs
45‐49yrs
50‐54yrs
55‐59yrs
60‐64yrs
65‐69yrs
70‐74yrs 75+ yrs
State 49 54 42 91 52 64 90 112 116 220 178 231 94 76 41 650Municipal 65 138 83 96 61 87 118 99 78 74 34 48 33 101 14 558
0
100
200
300
400
500
600
700
Num
ber o
f State and
Mun
icipal Brid
ges
Bridge Count per Age Category (5‐year Increments, All Bridges) (per NBI data submitted to FHWA on April 1, 2015)
State BridgesMunicipal Bridges
30

Questions / Comments
31