Nguyen Thi Thuy Trang Dr. Jenny Barnett Dr. Ruth Geer 8/27/2015 1.

2 JLFM / 2012 VOL 11 ISSUE 2
FUND GOVERNANCE, FEES AND PERFORMANCE IN AUSTRALIAN CORPORATE SUPERANNUATION FUNDS A NON-PARAMETRIC ANALYSIS
THI THUY CHI NGUYEN ,MONICA TAN AND MARIE-ANNE CAM
We investigate the governance structure and practices of Australian corporate superannuation funds and explore the link between a fund’s governance, fees and performance. Overall, it appears that the funds have governance structures that are prone to agency conflicts, lack of transparency and that trail behind overall corporate governance standards. We find that a fund’s governance practices do not affect performance, but they do affect fees. In addition, the international subsidiary and listing status of the sponsoring firms are found to affect fund fees. As a fund’s board size increases, so do the number of asset consultants being hired, and fund fees grow. The relationships between fund governance, management and fees are significantly influenced by fund size and are non-linear. We also found a potential link in the governance practices between the sponsoring firms and their funds. Our study provides important insight into how, although trustee structure does not have a direct impact, their strategic decisions affect how funds operate and agency problems can be controlled. Furthermore, adequate trustee competency that addresses the specific needs and nature of each fund must accompany fund governance structures; a prescriptive governance framework does not fit all.

JLFM / 2012 VOL 11 ISSUE 2 3
INTRODUCTIONIn this paper, we explore Australian Corporate Superannuation Funds (hereafter, corporate funds) in terms of their governance, fees and performance. This is a pioneering study that provides empirical explanations of fund performance by combining a superannuation fund’s governance characteristics, management and fees. Our findings show a relatively poor level of information disclosure and, at times, potentially inadequate governance practices. Only a handful of corporate funds establish board committees and these have low board independence overall. These governance variables are not found to have any link to fund fees and performance. The fund governance characteristics such as trustee board size, the sponsoring firm’s board size and the number of asset consultants, appear to have little effect on fund performance, but significantly influence fund fees. We also find that only investment management fees and expenses are adversely linked to the Australian Prudential Regulation Authority’s (APRA) accounting measure rate of return (ROR), but not the benchmark-adjusted return (BAR). We observe that whether the sponsoring firm is listed and an international subsidiary has a significant relationship with fund fees. Furthermore, the board size of the sponsoring firms is also positively related to the number of asset consultants being hired, the level of administration and audit fees and BAR. Overall, fund size significantly influences the non-linear relationships between fund governance, management and fees.
The Australian superannuation funds are Australian retirement funds. Due to good performance on the domestic financial markets and the rise in contributions, superannuation funds (hereafter, super funds) have grown substantially in the last decade. Between June 2000 and June 2011, total super funds’ assets have more than doubled in size with assets under management growing from $484.2 billion to $1.36 trillion making the system the fourth largest private pension fund market in the world ( Jeremiah, 2011). The funds rely on compulsory contributions made by employers on behalf of their employees. The minimum compulsory contribution has been gradually rising from the initial 3 per cent and, since 2002, it has been set at 9 per cent of an employee’s ordinary time earnings. In 2011, the government announced an increase in the current superannuation mandatory contribution from 9 per cent to 12 per cent, to be realised in 7 years (starting from 2013).
Over time, the Australian Government has adjusted the legislation to strengthen the superannuation system. Key changes include the 2005 removal of restrictions on switching between super fund providers, enabling workers to switch to super funds of their choosing. In 2009, the Australian government requested a review of the industry to investigate the issues of governance, efficiency, operation and structure. This Super System Review made recommendations to industry about how to ensure that it operated in members’ best interests. Recently, the Australian government has released a comprehensive response to the Super System Review, recognising the seriousness of strengthening requirements placed on superannuation governance practices as this would improve the performance of trustees and fund decisions.
In spite of their importance, there has been little empirical research on trustee governance practices in the superannuation industry or different sectors within the industry. We aim to address this research gap by examining the governance practices in corporate funds based on governance literature and the inaugural framework specific to not-for-profit funds (jointly prepared by the Australian Institute of Superannuation Trustees and the Industry Fund Forum). The fund governance practices are then evaluated by comparing them with the funds’ performance, which is measured by BAR and APRA’s ROR. In addition, the sponsoring firms’ governance practices are examined as to whether they contribute to a fund’s fees and performance. This allows us to address the following questions: do fund governance practices affect the financial performance of corporate funds and, if so, how? Specifically, do factors such as trustee board size, the sponsoring firm’s governance practices, the number of asset consultants and fund fees affect fund performance?
Our paper is structured as follows: In Sections Two and Three, we discuss the Australian superannuation industry and our literature review and hypothesis development, Section Four presents the data and methodology, and Sections Five and Six are our empirical findings and discussion, respectively. We conclude the paper in Section Seven.
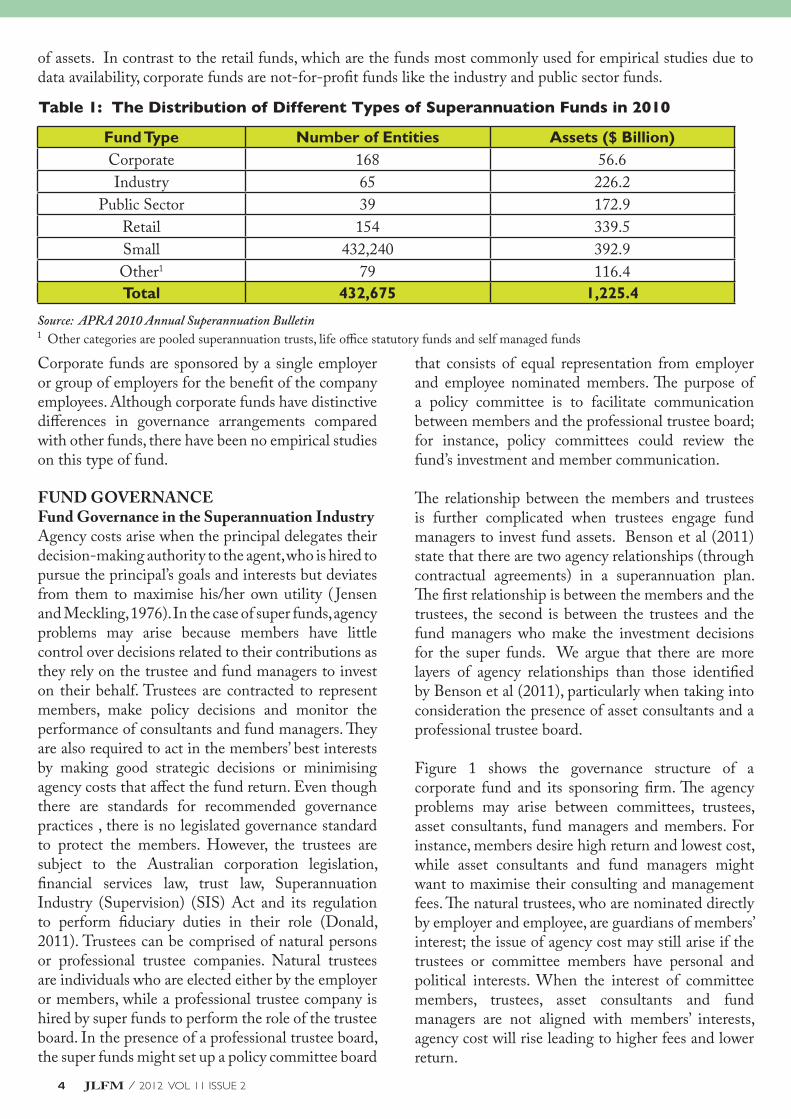
AUSTRALIAN SUPERANNUATION INDUSTRYThe industry is divided into subcategories, and we detail the various types of funds in Table 1. Corporate superannuation funds represent a fraction of the industry, but they still managed A$56.6 billion worth
4 JLFM / 2012 VOL 11 ISSUE 2
of assets. In contrast to the retail funds, which are the funds most commonly used for empirical studies due to data availability, corporate funds are not-for-profit funds like the industry and public sector funds.
Fund Type Number of Entities Assets ($ Billion) Corporate 168 56.6Industry 65 226.2
Public Sector 39 172.9Retail 154 339.5Small 432,240 392.9Other1 79 116.4Total 432,675 1,225.4
Table 1: The Distribution of Different Types of Superannuation Funds in 2010
Corporate funds are sponsored by a single employer or group of employers for the benefit of the company employees. Although corporate funds have distinctive differences in governance arrangements compared with other funds, there have been no empirical studies on this type of fund.
FUND GOVERNANCE Fund Governance in the Superannuation Industry Agency costs arise when the principal delegates their decision-making authority to the agent, who is hired to pursue the principal’s goals and interests but deviates from them to maximise his/her own utility ( Jensen and Meckling, 1976). In the case of super funds, agency problems may arise because members have little control over decisions related to their contributions as they rely on the trustee and fund managers to invest on their behalf. Trustees are contracted to represent members, make policy decisions and monitor the performance of consultants and fund managers. They are also required to act in the members’ best interests by making good strategic decisions or minimising agency costs that affect the fund return. Even though there are standards for recommended governance practices , there is no legislated governance standard to protect the members. However, the trustees are subject to the Australian corporation legislation, financial services law, trust law, Superannuation Industry (Supervision) (SIS) Act and its regulation to perform fiduciary duties in their role (Donald, 2011). Trustees can be comprised of natural persons or professional trustee companies. Natural trustees are individuals who are elected either by the employer or members, while a professional trustee company is hired by super funds to perform the role of the trustee board. In the presence of a professional trustee board, the super funds might set up a policy committee board
that consists of equal representation from employer and employee nominated members. The purpose of a policy committee is to facilitate communication between members and the professional trustee board; for instance, policy committees could review the fund’s investment and member communication.
The relationship between the members and trustees is further complicated when trustees engage fund managers to invest fund assets. Benson et al (2011) state that there are two agency relationships (through contractual agreements) in a superannuation plan. The first relationship is between the members and the trustees, the second is between the trustees and the fund managers who make the investment decisions for the super funds. We argue that there are more layers of agency relationships than those identified by Benson et al (2011), particularly when taking into consideration the presence of asset consultants and a professional trustee board.
Figure 1 shows the governance structure of a corporate fund and its sponsoring firm. The agency problems may arise between committees, trustees, asset consultants, fund managers and members. For instance, members desire high return and lowest cost, while asset consultants and fund managers might want to maximise their consulting and management fees. The natural trustees, who are nominated directly by employer and employee, are guardians of members’ interest; the issue of agency cost may still arise if the trustees or committee members have personal and political interests. When the interest of committee members, trustees, asset consultants and fund managers are not aligned with members’ interests, agency cost will rise leading to higher fees and lower return.
Source: APRA 2010 Annual Superannuation Bulletin 1 Other categories are pooled superannuation trusts, life office statutory funds and self managed funds

JLFM / 2012 VOL 11 ISSUE 2 5
The distinguishable feature of corporate funds in relation to other not-for-profit super funds is that corporate funds are linked to firms in which members of the fund are employed. This relationship might have good or bad influences on the fund’s governance practices and performance. When corporate directors or employees from firms that exercise good corporate governance are elected to the trustee board of their corporate funds, they may exert influence on their funds to adopt good governance practices. However, they may also act in their own interest rather than the members’ best interest, generating more agency problems. Although the structure of the superannuation industry is different from the corporate sector, many of the superannuation governance guidelines are aligned with the corporate governance practices that were recommended by the Australian Securities Exchange (ASX) Corporate Governance Council in 2007 (Benson et al., 2011). Casanova (2001) argues that pension plans in Canada tend to follow good corporate governance practices, with corporate boards and pension boards having the same roles in representing the legal owner, making policy decisions and ensuring CEO performance. Furthermore, Clark and Urwin (2009) suggest that the United Kingdom pension plans have adopted corporate governance practices due to the UK reputation for its reform company law and its effort to resolve boards’ conflicts of interest. Using the corporate governance literature and new governance framework (jointly prepared by superannuation industry bodies Australian Institute of Superannuation Trustees [AIST] and Industry Fund Forum [IFF]) (2011), we explore the current governance practices of corporate super funds and their relationship with fund fees and performance.
Figure 1: Agency Problems in Corporate Superannuation Funds
6 JLFM / 2012 VOL 11 ISSUE 2
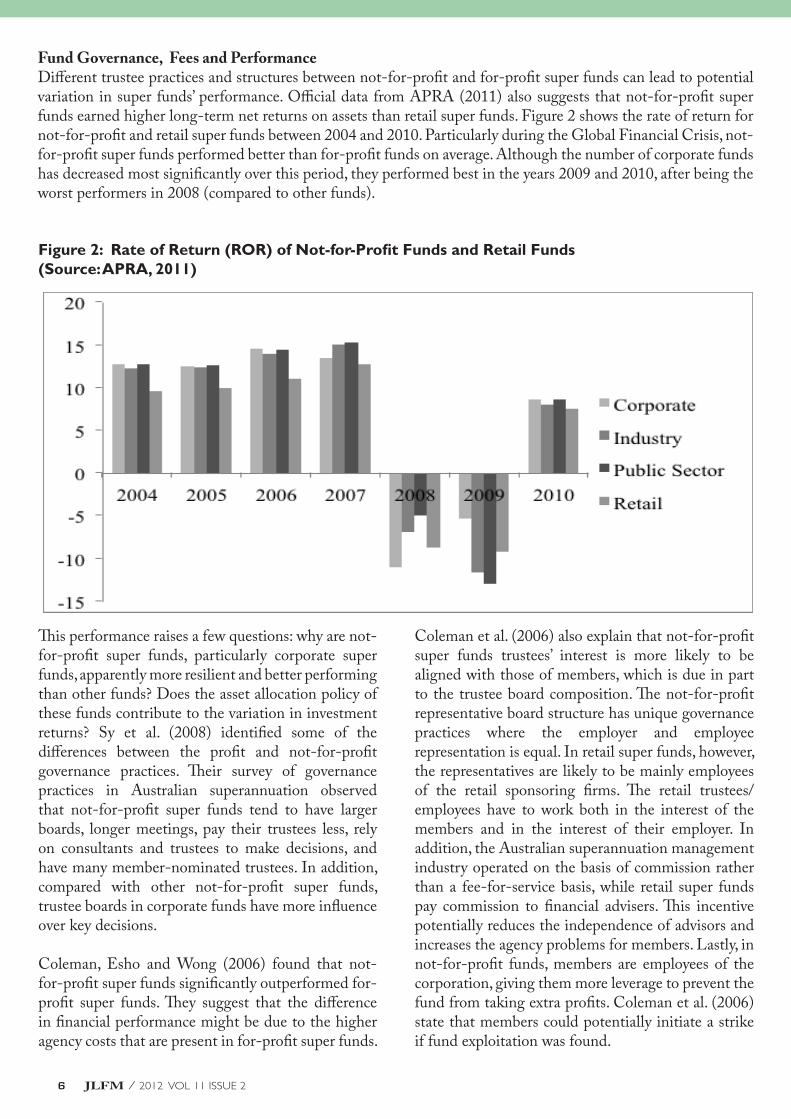
Fund Governance, Fees and PerformanceDifferent trustee practices and structures between not-for-profit and for-profit super funds can lead to potential variation in super funds’ performance. Official data from APRA (2011) also suggests that not-for-profit super funds earned higher long-term net returns on assets than retail super funds. Figure 2 shows the rate of return for not-for-profit and retail super funds between 2004 and 2010. Particularly during the Global Financial Crisis, not-for-profit super funds performed better than for-profit funds on average. Although the number of corporate funds has decreased most significantly over this period, they performed best in the years 2009 and 2010, after being the worst performers in 2008 (compared to other funds).
Figure 2: Rate of Return (ROR) of Not-for-Profit Funds and Retail Funds (Source: APRA, 2011)
This performance raises a few questions: why are not-for-profit super funds, particularly corporate super funds, apparently more resilient and better performing than other funds? Does the asset allocation policy of these funds contribute to the variation in investment returns? Sy et al. (2008) identified some of the differences between the profit and not-for-profit governance practices. Their survey of governance practices in Australian superannuation observed that not-for-profit super funds tend to have larger boards, longer meetings, pay their trustees less, rely on consultants and trustees to make decisions, and have many member-nominated trustees. In addition, compared with other not-for-profit super funds, trustee boards in corporate funds have more influence over key decisions.
Coleman, Esho and Wong (2006) found that not-for-profit super funds significantly outperformed for-profit super funds. They suggest that the difference in financial performance might be due to the higher agency costs that are present in for-profit super funds.
Coleman et al. (2006) also explain that not-for-profit super funds trustees’ interest is more likely to be aligned with those of members, which is due in part to the trustee board composition. The not-for-profit representative board structure has unique governance practices where the employer and employee representation is equal. In retail super funds, however, the representatives are likely to be mainly employees of the retail sponsoring firms. The retail trustees/employees have to work both in the interest of the members and in the interest of their employer. In addition, the Australian superannuation management industry operated on the basis of commission rather than a fee-for-service basis, while retail super funds pay commission to financial advisers. This incentive potentially reduces the independence of advisors and increases the agency problems for members. Lastly, in not-for-profit funds, members are employees of the corporation, giving them more leverage to prevent the fund from taking extra profits. Coleman et al. (2006) state that members could potentially initiate a strike if fund exploitation was found.

JLFM / 2012 VOL 11 ISSUE 2 7
It would be imprudent to state definitively that corporate governance has a positive impact on fund performance, but there does appear to be a link. Few empirical studies suggest a positive relationship between governance practices and pension plans’ performance. Drew and Stanford (2003) found that poor governance practices in super funds could result in poor financial performance, such as lower returns and higher costs. Likewise, in the case of Swiss pension funds, Ammann and Zingg (2010) find the same relationship between performance measured as Net Value Added and governance practices. Benson et al. (2011) found that the governance practices in public sector and industry super funds are positively related to financial performance. Even if governance can be linked to fund performance, there is no consensus on what this form of good governance might be. Hess and Impavido (2003) point out this problem by explaining that there is no ideal governance structure that can be applied to all firms within a single country, similarly, there is no single fund governance structure that can be applied to all public pension funds. Different political environments, restrictions, objectives, local market conditions, the availability of competent asset managers and many other factors lead to different governance structures for pension plans. Stewart and Yermo (2008) from OECD identify three common weaknesses of the pension system world-wide. Firstly, in general, trustees lack experience, training or suitable knowledge, creating the potential for not fully understanding advice that they receive from outside experts. Secondly, the conflict of interest within the board and in relation to independent or commercial trustees still exists. Lastly, there is no ideal governance structure to mitigate the problem of contract-based pension plans.
Fund Governance Practices Considering the lack of empirical studies on Australian corporate funds, we develop a framework to explore a wide range of governance practices and their effect on corporate funds’ asset allocation, fees and performance. Our framework is based on the corporate governance literature and contains the following key measures: fund’s board size, the proportion of independent directors, cross-board representation, the type of the trustee board, the number of consultants, the number of fund managers, and the presence of an audit, investment and policy committee. In addition, we also study issues specific to corporate funds by looking at the effect of the sponsoring firm’s governance practice on corporate
funds. For this, we examine a sponsoring firm’s board size, listing status and its status as an international subsidiary.
Board Size. According to agency theory perspective, the larger the board size, the better the governance a company exercises ( Jensen and Meckling, 1976). Kiel and Nicholson (2003) also share similar results when investigating the relation between board composition and the performance of the top 500 of Australia’s largest firms. After controlling for firm size, the results show that companies with larger boards perform better when measured in terms of market-based performance. In addition, Benson et al. (2011) suggest that governance practices (such as trustee board size and the frequency of meetings) lead to superior financial performance. Adversely, Tufano and Sevick (1997) report that in mutual funds, funds with larger board sizes tend to charge shareholders higher fees than others, so firms with smaller board sizes are more effective. It should be noted, however, that Tufano and Sevick’s research is only based on fees and does not take into account the board’s effectiveness in decision-making for investment, marketing or administration. Tufano and Sevick’s results are supported by Yermack (1996), who finds that smaller board sizes are associated with higher firm values. Singh and Davidson (2003) report the same result and conclude that there is no relation between board size and reducing agency costs.
AIST and IFF recommend that board members should have diverse backgrounds, but they do not mention board size. It can be argued that as the trustee board size increases, trustees’ expertise becomes more diversified and this may improve the efficiency in monitoring the performance of fund managers and consultants. This reduces agency costs and affects fund performance positively. Moreover, we expect that sponsoring firms with larger board sizes exercise good governance practices in both their firms and their super funds.
H1: Larger Board Sizes Are Linked to Lower Fees and Better PerformanceBoard Independence. Agency theory leads to a normative recommendation that a board of directors should have a majority of independent directors, and the position of CEO and Chairman should be held by different people (Fama and Jensen, 1983; Jensen and Meckling, 1976). Studies show that the number of independent directors on a board determines good

8 JLFM / 2012 VOL 11 ISSUE 2
governance, which leads to better firm performance (Rosenstein and Wyatt, 1990; Chung, Kim, Kim and Choi, 2008). However, Firth et al. (2008) find that, in China, boards of directors that have a majority of independent directors do not have any effect in lowering agency costs. In addition, Pearce and Zahra (1992), Bhagat and Bolton (2008) and Kiel and Nicholson (2003) report a negative link between firm performance and a higher proportion of independent directors. Erickson et al. (2005) suggest that the value of independent directors depends on their level of expertise, and this may improve the performance of a board. Even though more independent directors indicate more fees for members, we argue that having more independent directors will help to align the trustee board’s interest with members’ interest. Albrecht et al.’s (2007) research on US public pensions shows that boards that have authority to make investment decisions (such as deciding on asset allocations) are associated with lower fund returns, suggesting that boards may not have appropriate investment knowledge. We hypothesise that boards with more independent directors could mitigate the negative impact of board purview over investment decisions and enhance fund performance.
H2: A higher proportion of independent directors on a trustee board is linked to higher fees and better performance.
Cross-board Representation. According to Cocco and Volpin (2007), the presence of trustees who are also directors of sponsoring firms might have an effect on the management of defined benefit plans in the United Kingdom. The result supports agency theory, indicating that inside directors act in the interest of shareholders of the sponsoring firm rather than the best interest of members. In particular, pension plans of more leveraged companies with a higher fraction of insider trustees tend to invest a higher proportion of pension plan assets in risky financial assets, and make lower contributions to the pension plans. Industry representatives AIST and IFF (2011) advise that, although knowledge and experience of directors on multiple boards can be highly beneficial to the firm and fund that they work for, potential conflicts of interest might arise as the directors have obligations to firms and their super funds. We argue that when directors of the sponsoring firm, which exercise good governance, are elected onto the trustee board, they might have a good influence in superannuation governance practices, and vice versa.
H3: A higher proportion of cross-board representation is linked to higher investment in risky assets, lower fees and better performance.
Type of Trustee. As discussed, super fund boards can be comprised of natural persons who are employer or member representatives or independent candidates. Alternatively, super funds can hire professional trustees to perform the trustee role. The agency costs might be higher in a fund managed by an external professional trustee firm. In contrast, natural trustees’ interest might not align with members’ interest due to personal or political reasons, but we would expect that agency problems might be less severe.
H4: A Professional Trustee Board Has Higher Fees and Lower Performance than a Natural Trustee Board
The Number of Consultants and Fund Managers. Many super funds hire consultants to assist trustees in administration, asset allocation, communication, legal advice, audit and insurance as their knowledge and expertise helps trustees in operating the super funds. However, the agency costs may rise when consultants try to maximise their consultancy fees for the professional firms that engage them, or the consultants may affect a fund decision in order to pursue the interest of their professional firms (or themselves). Often, consultants provide products and services to both pension plans and money managers. An investigation led by the Securities and Exchange Commission found that the majority of pension consultants and their affiliates do not disclose conflicts of interest information to their clients (Marquez, 2005). Inevitably, the more consultants that are hired, the more fees members have to pay. As a result, members expect that higher asset consultant fees are warranted by better performance. Whether higher asset consultant fees lead to higher or lower returns is a crucial question for members. In this study, we examine whether the number of consultants affect the financial performance of a fund. We also argue that the more fund managers a fund has, the higher the fees incurred by members. Whether this higher fee amount brings a greater return for members remains to be seen, as the number of fund managers may depend on the complexity of a fund’s asset allocation strategy.

JLFM / 2012 VOL 11 ISSUE 2 9
H5: The Level of Fees and Performance Varies with the Number of Consultants and Fund Managers
Trustee Board Committees. AIST and IFF (2011, p. 19) state that the subcommittees of boards would provide the ‘capacity for trustee directors to work on more detailed matters in close consultation with executives and consultants’. They suggest that a fund should establish audit and compliance, investment and remuneration committees. However, the effectiveness of these committees is still contentious. Cotter and Silvester (2003) do not find any evidence that stronger monitoring committees have a positive influence on a firm’s value in Australia, and Benson et al. (2011) suggest that public sector and industry super funds with investment committees performed worse than the super funds without them. This is inconsistent with the positive relationship between having an investment committee and fund performance in Swiss pension funds (Ammann and Zingg, 2010). We expect that the subcommittees in corporate funds would help in aligning the interests of the trustees and members as the expertise provided by the board committees will help improve monitoring and decision making in the funds. We focus on the presence of audit, investment and policy committees in our empirical testing due to the low presence of other committees.
H6: The Level of Fees and Performance Varies with the Presence of Audit, Investment and Policy Committees
Listing Status of Sponsoring Firms. Firms that are listed in a stock exchange are required to disclose financial and operating information to shareholders. In addition, unlisted firms do not depend on financial market movement and have fewer incentives to disclose information. As a consequence, listed firms have greater incentives to follow good governance practices and align with shareholders’ interest than unlisted firms. Loderer and Waelchli (2008) report that listed firms protect their minority shareholders by preventing any conflicts of interest. For instance, listed firms tend to have large boards, the proportion of independent directors is greater than unlisted firms, and they monitor the performance of their CEO more closely. There is no concrete evidence, however, that listed firms perform better than unlisted firms. Nevertheless, we argue that listed sponsoring firms might exert a strong influence on their super funds to demonstrate good governance, which results in lower fees and better performance.
H7: Corporate Super Funds Associated with a Listed Sponsoring Firm Have Lower Fees and Better Performance
International Subsidiaries. Wright, Madura and Wiant (2002) suggest that multinational corporations that are highly exposed to foreign markets have higher agency costs than less exposed multinational corporations and domestic corporations. Additionally, multinational corporations might have different asset allocations as they are exposed to various markets, thus affecting financial performance. We argue that a fund that is sponsored by an international subsidiary may perform differently to a fund that is not sponsored by an international subsidiary.
H8: The Level of Fees and Performance Varies Between International and Domestic Subsidiaries
Data & Methodology
DataWe collected the asset allocation and fund performance data published by APRA in 2011 . The publication includes information on fund size, assets allocation, income, expenses, and membership of the super funds on an annual basis from 2004 to 2010. For this study, the analysis is restricted to corporate funds that have a fund year end of June 30th each year, have not wound up and have information for 2010. The table below shows the sample construction.
Based on the final sample, data of trustee characteristics are collected such as the nature of trustee board, trustee board size, the proportion of independent trustees, the percentage of cross board representation, their consultants, asset allocation and fund managers by going through manually their annual report for the 2010 financial year. Super funds’ annual reports are relatively limited as most super funds did not provide disclosure in previous years due to the fact that the super funds were only offered to employers working in the firms. In addition, Sy et al (2008) and Gupta et al. (2007) state that the information about trustee and board composition are relatively unchanged over at least a period of five years. Thus, the trustee governance variables are only collected for the financial year 2010.

10 JLFM / 2012 VOL 11 ISSUE 2
Table 2: Sample Construction
2010Total APRA regulated super funds more than four members 317Corporate funds 109Corporate funds that have fund year at 30/6 104Corporate funds that have data* 61Corporate funds that have not wound up 61Corporate funds that have data for five years (final data set) 52
* Three super funds are excluded for the final data set as one fund is for New South Wales fire brigades’ firefighting staff death and disability. The fund only invests in cash and its net assets are relatively low. In addition, information about the other two super funds and their sponsoring company could not be found.
A number of super funds do not have websites and their annual reports could not be located. It should be noted that, as some corporate super funds do not offer to the public, there may be less incentive for them to operate a website and release the annual report to the public. As members cannot monitor the performance of their contribution, this might give super funds a disincentive to exercise good governance practices. Therefore, there is a high possibility that agency costs will rise. Members might still observe the performance of their super funds through the annual reports that are sent to them exclusively. A dummy variable is included to represent the transparency of the super funds (TRANSP).
In addition, the status of public offer, percentage of asset allocation, benefit structure, fund size, and rate of return are collected through the publication of APRA. As discussed above, Sy et al (2008) and Gupta et al. (2007) state that the information about trustee and board composition are relatively unchanged over at least a period of five years. It is assumed that these governance variables do not change rapidly over time and endogeneity between governance variables and fund performance is minimal. Finally, we also collect data about the sponsoring firms of the corporate funds. This information includes firm board size, the proportion of independent directors, firm listing status and their subsidiary status through their website, annual reports, and DatAnalysis. The
data set for sponsoring firms faces similar problems as some have neither websites nor annual reports. Two more dummy variables are added to measure the transparency of firms with one representing whether a firm has website (TRANSPF) and the other representing whether a firm releases annual reports (TRANSPF1). However, as these variables do not yield any relationship with other variables, we did not include them in our analysis.
There are only two corporate funds that have cross-board representation (which means at least one corporate director or employee from the sponsoring firm is appointed to be a trustee of the corporate funds). Therefore, we did not include this variable in our analysis. The total number of corporate funds that hire asset consultants presented in the final data is 24 out of the 28, according to our manual data collection. However, corporate funds that pay asset consultant fees in the APRA publication are only seven funds indicating a significant discrepancy between our survey data and the APRA publications. As a result, asset consultant fees as a variable is not included in our analysis. Lastly, as there are only five out of 52 sponsoring firms that have independent directors, the number of independent directors in sponsoring firms is excluded from this analysis. The definition of variables is shown in Table 3.

JLFM / 2012 VOL 11 ISSUE 2 11
Table 3: Definition of Variables
Variable Definition Panel A: Trustee Governance
BSIZE Board size, the total number of trustees per trustee boardINDPNT The proportion of independent trustees per trustee board
CONSULT The total number of consultants appointed per fundFMGR The total number of fund manager appointed per fund
TRANSP Transparency of super funds, where 1 = funds have website and 0 = funds haveno website
ASSETC 1 = trustees hire asset consultants, 0 = otherwisePOLICY 1 = trustees set up policy committee, 0 = otherwise
INV 1 = trustees set up investment committee, 0 = otherwiseAUDIT 1 = trustees set up audit/risk management committee, 0 = otherwiseTTYPE Type of trustee, where 1 = professional trustee and 0 = natural trustee
Panel B: Corporate Governance BSIZEF The total number of directors per sponsoring firm board
SUBS The nature of the sponsoring firm where 1= subsidiary firms and 0 = local firmsLS Listing status of the sponsoring firms, where 1 = listed firms and 0= no listed
Panel C: Other Variables FUNDSIZE The total assets at the end of 2010
IMFee* Investment management fee; expenses which relate to the management of the superannuation entity’s investment portfolios.
INVFee* Total investment expenses, include investment management fees, custodian fees, property maintenance costs, asset consultant fees and other investment expenses.
ADMFee* Administration fee, fees paid/payable by the superannuation entity for any administration service provided to the entity. These include internal and outsourced administration services, employee costs and fees paid to the employer sponsor for administration services.
AUDFee* Total fees paid to audit firm includes any fees and expenses paid/ payable to the external audit firm for external audit and compliance services, internal audit services and other services.
* APRA Definitions Performance measureTwo proxies of superannuation fund performance are used to evaluate fund performance. To measure the fund’s overall performance, we use the fund overall rate of return (ROR) and, to measure fund relative investment performance, we use a benchmark adjusted return (BAR). The overall annual fund financial performance ROR is measured based on fund earnings and asset growth. The rate of return of super funds is taken from the Superannuation Fund-Level Profiles and Financial Performance published by APRA in 2011. APRA calculated the rate of return as below in equation (1).
1
t
tt CFNA
NEATROR (1)
represents the overall performance of the fund taking into account all activities undertaken by the fund.
€
NEATt is the fund net earnings after tax the end of year t and CFNAt-1 is the fund total net asset at the beginning of the period adjusted to cash flow adjusted net assets. Cash flow calculated as the sum of net contribution flows, insurance policy proceeds (net cost of insurance) and contributions tax, and surcharge.€
RORt

12 JLFM / 2012 VOL 11 ISSUE 2
To determine the contribution of the Superfund investment team and managers’ selection ability, we will evaluate fund performance using the benchmark approach by calculating the BAR. The methodology used to estimate fund BAR is drawn from Vardharaj and Fabozzi (2007) and Brown et al. (2010) (see also Sy and Liu (2009) and Daniel et al. (1997)). This approach takes into account fund specific asset allocation and gives a measure of fund performance relative to a benchmark portfolio which replicates the fund strategic asset allocation. Our BAR is calculated as presented in equation (2) and (3):
Net Added Value = Net Benchmark Return - Net Fund Return (2)
EQUATION (3)
Rf,t is the rate of return of fund f default strategy portfolio on year t. Rfb,t brepresents the index benchmark rate
of return at time t. Wf,bt-1is the weighting in asset class b at time t-1 based on the fund defaults annual asset
allocation of fund default strategy option, this information is reported by APRA. Each index performance is adjusted for manager fees. The benchmark indices and fund manager fees are detailed in Table 4. We follow Sy and Liu’s (2009) selection of indices and schedule of fund manager fees, which are based on Vangard passive retail products.
Asset Class Benchmark Index Manager Fee (%0 Domestic Equities Australian Stock Exchange All Ordinary Index 0.34International Equities
MSCI World Ex Australia 0.36
Listed Property S&P/ASX 300 Property 0.36Unlisted Property Mercer Direct Prop Asset Weight (2004 To 2008)
and Mercer/IPD Australian Pooled Property Fund Index (from 2009)
0.40
Domestic FixedInterest
Australian UBS Composite Bond Index 0.29
International Fixed Interest
JPM Global Bond Index ex Australia Hedged AUD
0.31
Cash and Other UBS Australian Bank Bill Index 0.15
Table 4: Benchmark Portfolio
Descriptive Statistics Table 5 shows that the number of trustees in our sample of corporate funds’ boards ranges from 3 to 10, with a mean (median) of 6.33 (6) which is relatively smaller than the size of the sponsoring firms’ board of directors (range: 5 – 16, mean: 8.64, median: 8.50) and the average board size of between 9-10 in Swiss pension funds (Ammann and Zingg, 2010). The percentage of independent trustees is relatively low, ranging from 0 per cent to 100 per cent with a mean (median) of 11 per cent (0 per cent) indicating the lack of independent point of view present on a board. On average, corporate funds hire 5 consultants and 16 fund managers (range: 0-38).
The total asset value of the funds was, on average, A$ 715,648,000 in 2010. The average ROR is 3.12% (s.d. = 2.11%) and BAR is 9.79% above the benchmark (s.d. = 2.25%). There is a great diversity in the size and
performance of the funds in our sample. There is also considerable diversity in the amount of fee incurred. We selected four categories of fee for which data is most populated in the APRA spreadsheet and that have a significant relationship to fund performance. Notably, there are funds that do not incur any fees in all these four categories. On average, in 2010, a fund incurs $1,115,000 of investment management fee (IMFee), $1,811,000 of total investment expenses (INVFee), $1,080,000 of administration fee (ADMFee), and $75,000 of fees paid to audit firms (AUDITFee). As mentioned above the level of fees varies greatly between funds, with a standard deviation considerably greater than the mean. Fund size may explain some of the fee variations but not all of them. The overall, relatively low amount of audit fee raises a query about whether funds receive adequate independent and professional auditing, which is an important check and balance by the trustee board.

JLFM / 2012 VOL 11 ISSUE 2 13
Variables Mean Median Max Min SD NoPanel A: Trustee Governance BSIZE 6.33 6.00 10.00 3.00 2.14 24INDPNT 0.11 0.00 1.00 0.00 0.28 24CONSULT 5.00 5.00 11.00 0.00 2.38 28FMGR 16 15 38 0 12.94 20TRANSP 1 1 1 0 0.49 52AUDIT 0 0 1 0 0.36 25INV 0 0 1 0 0.39 25POLICY 0 0 1 0 0.50 26TTYPE 0 0 1 0 0.48 46Panel B: Firm Governance VariablesBSIZEF 8.64 8.50 16.00 5.00 2.47 34SUBS 0 0 1 0 0.50 46LS 0 0 1 0 0.49 44Panel C: Control Variables Total Assets (TA) (A$’000)
71564
8 198872 6393732 7043 1298568 52
Panel D: Dependent VariablesBenchmark Adjust Return (BAR) 0.0979 0.0951 0.1454 0.0055 0.0225 52Rate of Return(ROR) 0.0312 0.0288 0.0804 -0.0474 0.0211 52IMFee (A$’000) 1115 60 20002 0 3469 52INVFee (A$’000) 1811 60 46448 0 6852 52ADMFee (A$’000) 1080 374 10758 0 2113 52AUDITFee (A$’000) 75 45 545 0 93 52
Table 5: Descriptive Statistics
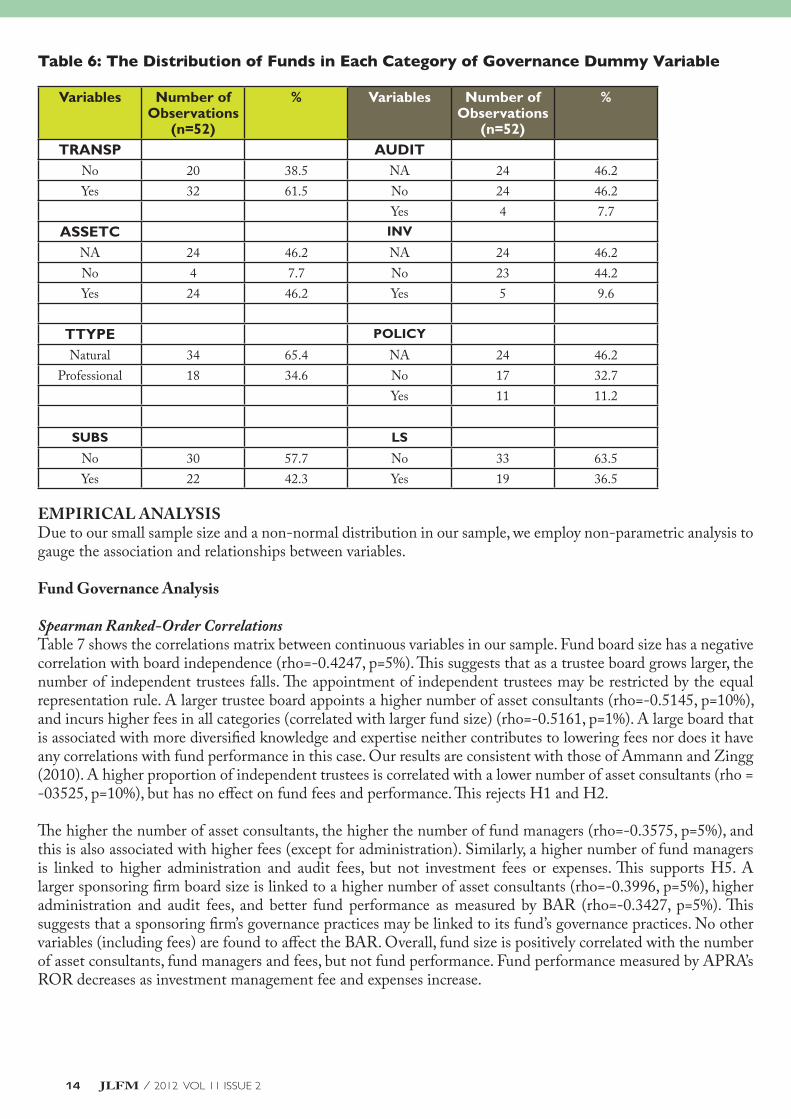
Table 6 shows the distribution of corporate funds in each categorical variable. About 61 per cent of funds have websites and disclosed annual reports. Some funds may not make public offers and this limits the incentive for trustees to publish public annual reports. Almost half of the funds do not provide any information about their consultants and committees. Among the funds that do provide information, approximately 90 per cent of the funds hire administration and asset consultants, and 40 per cent of corporate funds set up policy committees, while only 14 per cent and 17 per cent of funds have investment committees and audit committees. Investment committees are traditionally comprised of a fund’s internal investment team’s staff, the fund CEO and external asset consultants. Only 18 funds hire professional trustee firms, suggesting that sponsoring firms prefer employer and members’ representation to manage their funds rather than professional trustee services. 22 of the 52 funds (42.31 per cent) are associated with an international subsidiary firm and only 36.54 per cent of funds are associated with a listed firm.
14 JLFM / 2012 VOL 11 ISSUE 2
Variables Number of Observations
(n=52)
% Variables Number of Observations
(n=52)
%
TRANSP AUDITNo 20 38.5 NA 24 46.2Yes 32 61.5 No 24 46.2
Yes 4 7.7ASSETC INV
NA 24 46.2 NA 24 46.2No 4 7.7 No 23 44.2Yes 24 46.2 Yes 5 9.6
TTYPE POLICY
Natural 34 65.4 NA 24 46.2Professional 18 34.6 No 17 32.7
Yes 11 11.2
SUBS LS
No 30 57.7 No 33 63.5Yes 22 42.3 Yes 19 36.5
Table 6: The Distribution of Funds in Each Category of Governance Dummy Variable
EMPIRICAL ANALYSISDue to our small sample size and a non-normal distribution in our sample, we employ non-parametric analysis to gauge the association and relationships between variables.
Fund Governance Analysis
Spearman Ranked-Order CorrelationsTable 7 shows the correlations matrix between continuous variables in our sample. Fund board size has a negative correlation with board independence (rho=-0.4247, p=5%). This suggests that as a trustee board grows larger, the number of independent trustees falls. The appointment of independent trustees may be restricted by the equal representation rule. A larger trustee board appoints a higher number of asset consultants (rho=-0.5145, p=10%), and incurs higher fees in all categories (correlated with larger fund size) (rho=-0.5161, p=1%). A large board that is associated with more diversified knowledge and expertise neither contributes to lowering fees nor does it have any correlations with fund performance in this case. Our results are consistent with those of Ammann and Zingg (2010). A higher proportion of independent trustees is correlated with a lower number of asset consultants (rho = -03525, p=10%), but has no effect on fund fees and performance. This rejects H1 and H2.
The higher the number of asset consultants, the higher the number of fund managers (rho=-0.3575, p=5%), and this is also associated with higher fees (except for administration). Similarly, a higher number of fund managers is linked to higher administration and audit fees, but not investment fees or expenses. This supports H5. A larger sponsoring firm board size is linked to a higher number of asset consultants (rho=-0.3996, p=5%), higher administration and audit fees, and better fund performance as measured by BAR (rho=-0.3427, p=5%). This suggests that a sponsoring firm’s governance practices may be linked to its fund’s governance practices. No other variables (including fees) are found to affect the BAR. Overall, fund size is positively correlated with the number of asset consultants, fund managers and fees, but not fund performance. Fund performance measured by APRA’s ROR decreases as investment management fee and expenses increase.

JLFM / 2012 VOL 11 ISSUE 2 15
Table 7: Spearman ranked-order correlations matrix for governance, fund fee and performance, and total assets variables are shown in this table. All variables are for the year 2010. BSIZE = trustee board size. INDPNT = the proportion of independent trustees per board. CONSULT = the total number of consultants appointed per fund. FMGR = the total number of fund manager appointed per fund. BSIZEF = the total number of directors per sponsoring firm board. BAR = Benchmark adjusted return. ROR = APRA rate of return. IMFee = Investment management fee. INVFee = Total investment expenses. ADMFee = Administration fee. AUDFee = Total fees paid to audit firm.
Kruskal-Wallis TestWe use Kruskal-Wallis Test to conduct our hypothesis testing between the bivariate variables and fund fees and performance measures. To control for fund size, we divide our funds into three groups based on the total asset value at the end of the year: small funds (<A$100,000), medium funds (A$100,000< size >A$1,000,000), and large funds (>A$1,000,000). We found significant between-group differences and effect by fund size in Tables 8-10. In addition, the effect of fund size on fees and performance is not linear. We must note that the between-group differences in all our tests measured by fees are significant, while the results for performance by both measures are not significant at all.
Table 8 shows the results for the between-group differences by measuring the transparency of funds, appointment of asset consultants and the type of trustee board. Small funds that maintain a website have relatively higher fees and lower performance than those that do not. The results are mixed for medium funds: investment management fees and investment expenses are lower, while administration fees and audit fees are higher in funds that maintain a website. Performance is better in this group of funds. All large funds maintain a website, so no comparison group exists for this test. The results show that disclosure comes at a cost, such as higher administration fees, especially for small and medium funds. In large funds, it is more effective to maintain a website as a communication tool to reach out to large numbers of members, and the disclosure cost is absorbed by members through economies of scale. A majority of small funds appoint asset consultants and their fees are higher while their performance is better. In medium funds, all fees except administration fees are lower in funds that appoint asset consultants while they perform worse than funds that do not appoint asset consultants. Large funds that appoint asset consultants have higher investment management fees and expenses while performing better. The results show that it is important to consider fees when comparing performance. In addition, the ability of funds to manage the trade-off between fees and performance differ according to fund size and the relationship is not linear. A majority of small funds have a board made up of natural person trustees and these funds incur lower fees except for investment expenses

16 JLFM / 2012 VOL 11 ISSUE 2
than the funds that have a professional trustee board. The former performs better than the latter. Medium and large funds incur higher investment expenses and audit fees and perform better when their trustees are appointed from external professional providers. This partially supports H4, which argues that a professional trustee board incurs higher fees but performs worse. Fund size has a significant effect on the relationship. Overall, the results suggest that funds of different sizes have different operating structures and complexity, so the appointment of external agents may result in different costs and performance. In addition, the operating complexity may give rise to various contracting and personal relationships between fund insiders and their external agents, which may incur agency costs to vary and require different monitoring mechanisms.
Table 9 shows the results for the between-group differences due to the presence of board committees. Small funds do not set up an audit committee. Small funds that have an investment committee incur lower fees (except administration fees) but perform better. Medium funds that have an audit and investment committee have higher fees (except administration fees) and perform better than funds that do not have the committee. Large funds that have an audit and investment committee post higher fees in all categories and perform worse than their counterparts. The benefits of running focus committees may outweigh the costs as funds grow larger. However, the results are surprising as we would expect large funds to be more capable of lowering fees due to economies of scale (Bikker and De Dreu, 2009), and perform better by exploiting the additional expertise provided by focus committees and external agents. We also expect that better strategy formulation and monitoring are performed by the committees that will enhance performance. On the other hand, there may be more bureaucracy and information asymmetry that would give rise to higher inefficiency and more room for shirking that erode members’ benefits in large funds. There is no stark difference in fees between having a policy committee or not in small funds, but those that do not have a committee perform worse than those that have. Medium funds that have a policy committee incur lower investment management fee and expenses while their audit fees are higher; these funds, however, perform worse. Similar results are found in large funds. Overall, the results support H6 that fees and performance vary according to committee structures. The results raise the question whether establishing conventional board
structures is beneficial to provide relevant expertise, better monitoring and enhance members’ interests. The results suggest that proper board structure may not make any of the contributions mentioned if the composition of the board and committees are not relevant to the nature of the business. In other words, enacting proper board structure without appointing competent trustees to occupy this structure may be more harmful to members’ interests because external agents could potentially overpower and exploit the situation while insiders lack the expertise and knowledge to make proper decisions independently. Our results suggest that a prescriptive framework of trustee board structure may not contribute large benefits to fund members.
Table 9 shows the results for the between-group differences due to the presence of board committees. Small funds do not set up an audit committee. Small funds that have an investment committee incur lower fees (except administration fees) but perform better. Medium funds that have an audit and investment committee have higher fees (except administration fees) and perform better than funds that do not have the committee. Large funds that have an audit and investment committee post higher fees in all categories and perform worse than their counterparts. The benefits of running focus committees may outweigh the costs as funds grow larger. However, the results are surprising as we would expect large funds to be more capable of lowering fees due to economies of scale (Bikker and De Dreu, 2009), and perform better by exploiting the additional expertise provided by focus committees and external agents. We also expect that better strategy formulation and monitoring are performed by the committees that will enhance performance. On the other hand, there may be more bureaucracy and information asymmetry that would give rise to higher inefficiency and more room for shirking that erode members’ benefits in large funds. There is no stark difference in fees between having a policy committee or not in small funds, but those that do not have a committee perform worse than those that have. Medium funds that have a policy committee incur lower investment management fee and expenses while their audit fees are higher; these funds, however, perform worse. Similar results are found in large funds. Overall, the results support H6 that fees and performance vary according to committee structures. The results raise the question whether establishing conventional board structures is beneficial to provide relevant expertise, better monitoring and enhance members’ interests. The results suggest that proper

JLFM / 2012 VOL 11 ISSUE 2 17
board structure may not make any of the contributions mentioned if the composition of the board and committees are not relevant to the nature of the business. In other words, enacting proper board structure without appointing competent trustees to occupy this structure may be more harmful to members’ interests because external agents could potentially overpower and exploit the situation while insiders lack the expertise and knowledge to make proper decisions independently. Our results suggest that a prescriptive framework of trustee board structure may not contribute large benefits to fund members.
Table 10 shows the between-group differences measured by the subsidiary and listing status of the sponsoring firms. The results are significantly driven by fund size. Small funds that are associated with an international subsidiary have higher fees except for administration fees and perform better. The opposite is observed in medium funds. Large funds that are with an international subsidiary incur lower fees (except for audit fees) and perform better. Small funds that are associated with a listed firm have higher fees but perform worse. Similar results are found in terms of fees in medium funds but there is no difference in performance. Lower investment management fees and expenses are found in large funds with listed firms and they show better performance. H7 and H8 are partially supported as fund size has a significant effect on the relationships.
DISCUSSIONSThe main findings of our study are that fund fees are affected by governance practices and the nature of the sponsoring firms. Fund size has a strong effect on the direction of the relationship between governance practices and fees. The governance practices of corporate funds and their sponsoring firms do not cause significant differences in fund performance. Our results suggest that proper governance structures must be accompanied by relevant trustee competency to exert effective monitoring and benefit to the funds and their members. In addition, the size of funds dictates the nature and complexity of fund operations and should be given serious consideration when enacting governance structures. This greatly affects the trade-off between governance costs and benefits.
Overall, we found that the governance practices of corporate funds are lagging behind those of the corporate sector. In general, the transparency of information and the degree of independence on trustee boards is low, although this is driven by fund size. It is noteworthy that a majority of corporate funds neither have an audit committee nor disclose whether they have one. Only 4 out of 52 corporate funds have an audit committee, 5 have an investment committee, and 11 have a policy committee. There may be a lack of independent review of fund operations and performance in place. However, we do not find any systematic between-group differences due to the presence of these committees. Whether the fee level is higher or lower between funds that have these committees and those that do not vary according to fund size.
Specifically, the governance practices of corporate funds on average are better than their sponsoring firms, even though some funds may not offer to the public and, therefore, tend not to have incentives to operate a website or publish public annual reports. In addition, corporate funds tend to hire external fund managers or asset consultants to invest the funds’ assets. The appointment of a professional trustee board is more prevalent in large funds. However, the level of fees — although differing between the different types of trustees and whether the funds appoint external asset consultants — is influenced by fund size. We found that board size increases as fund size grows, and this is accompanied by an increase in the number of asset consultants being hired and a rise in fund fees. On the other hand, the equal representation rule of the appointment of trustees may contribute to the negative correlation between board size and the proportion of independent trustees, which, in turn, deters the appointment of asset consultants. However, board independence is not linked to fund fees or performance. This raises the question about the role of independent trustees in fund governance. Funds that hire more asset consultants and fund managers incur higher fees. Overall, the number of asset consultants, fund managers and fees increase as fund size increases. We also found that the governance practices of the sponsoring firms may have a link to their fund’s governance practices. However, we do not find any governance variables to have a significant relationship with fund performance.
A potential setback in our research is the availability and quality of data for research. We rely on APRA for the fund’s financial performance data. However, we found some discrepancies between the APRA data and the information reported by individual funds on their website and published materials. For example, many funds

18 JLFM / 2012 VOL 11 ISSUE 2
show a zero asset consultant fee in the APRA spreadsheet but we found these funds have reported a list of external asset consultants they have hired. It would be unreasonable to assume that these external agents would provide services without charging a fee. This could mean that some fees are not classified appropriately by these funds and may be accounted for as part of a lump sum fee that is not transparent. Liu and Arnold (2010) show that certain fees paid to related parties are not appropriately accounted for in the industry. This will increase costs and reduce returns to fund members. As a result, there is a need for future improvement in the availability and quality of data to enhance empirical analysis in this area.
Our results suggest that a prescriptive governance framework for all funds may not generate large benefit to members. Governance costs may outweigh benefits in small funds due to the lack of economies of scale. On the other hand, governance structures need to be established to mitigate the complex, intertwined relationships between fund insiders and external agents, and minimise bureaucracy and information asymmetry. Therefore, the type of governance arrangements and practices need to be established based on the specific needs, characteristics and nature of business of a fund. In addition, adequate training and professional development must be provided to trustees to enhance their competency and to suit the governance arrangements and practices of their funds. This view is much in line with those of Clark (2004), who argues that trustee competency must not be overlooked in light of new developments in the governance frameworks. Our study also draws attention to the differences between superannuation fund governance and conventional corporate governance in terms of the structure, role and selection of trustees and corporate directors.
CONCLUSIONUsing a sample of 52 corporate funds, we examine whether there is any association between governance variables, corporate fund fees and performance measured by the APRA’s accounting rate of return and benchmark adjusted return.
The main findings of our study are that fund governance variables do not relate to fund performance, whereas fees vary according to governance practices. Fees are also influenced by fund size. In addition, trustee boards exercise better governance practices than sponsoring firm boards in terms of transparency and disclosure, although overall trustee governance practices in corporate funds are lagging behind governance practices in the corporate sector. We found that the relationships between governance practices and fees are not linear and are affected by fund size.
Our study offers the important finding that although trustee structure may not have direct impact on fund performance, trustees’ decisions are important in determining how funds operate and their consequent performance. Hence, governance arrangements need to address the specific needs and characteristics of funds and be accompanied by relevant trustee competency. One size does not fit all, and a prescriptive framework contributes little to mitigating agency problems in corporate funds. Further research is needed to examine how trustee profile and board composition affect funds’ strategic decision-making, which may lead to variations in performance across funds.

JLFM / 2012 VOL 11 ISSUE 2 19
Table 8: Kruskal-Wallis tests on fund fees and performance measures using bivariate variables that measure fund transparency (TRANSP), the use of asset consultants (ASSETC) and the types of trustee board. The funds are divided into three groups: small (<A$100,000), medium (A$100,000 < size > A$1,000,000) and large (>A$1,000,000) based on their end-of-year total asset value. This table reports the mean rank. The figure in the parentheses is the number of observations. TRANSP is the transparency of super funds, where 1 = funds have website and 0 = funds have no website. ASSETC is a bivariate variable, 1 = trustees hire asset consultants, 0 = otherwise. AUDIT is a bivariate variable, 1 = trustees set up audit/risk management committee, 0 = otherwise. IMFee = investment management fee. INVFee = investment expenses. ADMFee = administration fee. AUDFee = audit fee. ROR = APRA’s rate of return. BAR = benchmark adjusted return.
IMFEE INVFEE ADMFEE AUDFEE ROR BAR
FUND TRANSP
No Yes No Yes No Yes No Yes No Yes No Yes
Small 18(12) 21(8) 17(12) 20(8) 10(12) 27(8) 12(12) 14(8) 27(12) 23(8) 27(12) 23(8)Med 26(8) 25(14) 27(8) 25(14) 27(8) 29(14) 29(8) 31(14) 23(8) 27(14) 23(8) 27(14)Large -(0) 44(10) -(0) 44(10) -(0) 47(10) -(0) 44(10) - (0) 30(10) -(0) 31(10)All 27(52) 27(52) 27(52) 27(52) 27(52) 27(52)df 4 4 4 4 4 4K-W Value
19.0289 19.6639 32.5824 30.9979 1.2737 1.7363
p-value 0.0008 0.0006 0.0000 0.0000 0.8658 0.7841ASSETC
No Yes No Yes No Yes No Yes No Yes No Yes
Small 4(1) 10(7) 4(1) 9(7) 2 (1) 8 (7) 2 (1) 7(7) 4(1) 13(7) 2 (1) 13(7)Med 21(2) 10(8) 20(2) 11(8) 10 (2) 12 (8) 14 (2) 13(8) 20(2) 14(8) 20(2) 14(8)Large 16(1) 22(9) 15(1) 22(9) 23 (1) 23 (9) 25 (1) 22(9) 18(1) 16(9) 9(1) 17(9)All 15(28) 15(28) 15 (28) 15 (28) 15(28) 15(28)df 5 5 5 5 5 5K-W
Value
15.9321 15.3359 18.7874 18.2022 3.0629 4.9585
p-value 0.0070 0.0090 0.0021 0.0027 0.6903 0.4210TTYPE
No Yes No Yes No Yes No Yes No Yes No Yes
Small 5(15) 16(5) 20(15) 15(5) 14(15) 18(5) 11(15) 18(5) 26(15) 25(5) 26(15) 22(5)Med 6(11) 23(11) 29(11) 23(11) 28(11) 28(11) 34(11) 28(11) 22(11) 29(11) 21(11) 30(11)Large 18(8) 32(2) 47(8) 32(2) 46(8) 48(2) 47(8) 32(2) 29(8) 34(2) 30(8) 34(2)All 27(52) 27(52) 27(52) 27(52) 27(52) 27(52)df 5 5 5 5 5 5K-W
Value
21.4295 22.4741 30.3332 34.2271 1.9131 3.2154
p-value 0.0007 0.0004 0.0006 0.0000 0.8610 0.6668

20 JLFM / 2012 VOL 11 ISSUE 2
Table 9: Kruskal-Wallis tests on fund fees and performance measures using bivariate variables that measure the presence of an audit (AUDIT), investment (INV) and policy (POLICY) committee,. The funds are divided into three groups: small (<A$100,000), medium (A$100,000 < size > A$1,000,000) and large (>A$1,000,000) based on their end-of-year total asset value. This table reports the mean rank. The figure in the parentheses is the number of observations. INV is a bivariate variable, 1 = trustees set up investment committee, 0 = otherwise. POLICY is a bivariate variable, 1 = trustees set up policy committee, 0 = otherwise. TTYPE is the type of trustee, where 1 = professional trustee and 0 = natural trustee. IMFee = investment management fee. INVFee = investment expenses. ADMFee = administration fee. AUDFee = audit fee. ROR = APRA’s rate of return. BAR = benchmark adjusted return.
IMFEE INVFEE ADMFEE AUDFEE ROR BAR
FUND AUDIT
No Yes No Yes No Yes No Yes No Yes No Yes
Small 9(8) -(0) 8(8) -(0) 7(8) -(0) 6(8) -(0) 12(8) -(0) 11(8) -(0)Med 11(9) 20(1) 12(9) 18(1) 12(9) 7(1) 13(9) 16(1) 14(9) 26(1) 14(9) 28(1)Large 21(7) 23(3) 21(7) 22(3) 22(7) 25(3) 21(7) 26(3) 17(7) 14(3) 18(7) 12(3)All 15(28) 15(28) 15(28) 15(28) 15(28) 15(28)df 4 4 4 4 4 4K-W Value
13.5875 12.9914 18.5992 18.5240 3.5391 5.8303
p-value 0.0092 0.0113 0.0009 0.0010 0.4720 0.2122INV
No Yes No Yes No Yes No Yes No Yes No Yes
Small 10(7) 4(1) 9(7) 4(1) 6(7) 17(1) 7(7) 2(1) 10(7) 25(1) 9(7) 25(1)Med 11(1) 20(1) 12(9) 18(1) 12(9) 7(1) 13(1) 16(1) 14(9) 26(1) 14(9) 28(1)Large 20(1) 23(3) 21(7) 22(3) 22(7) 25(3) 21(7) 26(3) 17(7) 14(3) 18(7) 12(3)All 15(28) 15(28) 15(28) 15(28) 15(3) 15(28)df 5 5 5 5 5 5K-W
Value
13.9228 13.3725 20.2254 18.8853 6.3934 9.0235
p-value 0.0161 0.0201 0.0011 0.0020 0.2698 0.1081POLICY
No Yes No Yes No Yes No Yes No Yes No Yes
Small 9(5) 8(3) 9(5) 8(3) 7(5) 7(3) 6(5) 7(3) 11(5) 14(3) 10(5) 13(37)Med 15(6) 8(6) 15(6) 8(4) 12(6) 12(4) 15(6) 10(4) 16(6) 13(4) 17(3) 13(4)Large 23(6) 20(4) 23(6) 19(4) 22(6) 25(4) 24(6) 21(4) 17(6) 15(4) 17(6) 16(4)All 15(28) 15(28) 15(28) 15(28) 15(28) 15(28)df 5 5 5 5 5 5K-W
Value
14.2084 14.8594 18.3477 19.0214 1.8515 2.8416
p-value 0.0143 0.0110 0.0025 0.0019 0.8693 0.7244

JLFM / 2012 VOL 11 ISSUE 2 21
Table 10: Kruskal-Wallis tests on fund fees and performance measures using bivariate variables that measure the subsidiary nature (SUBS) and listing status of the sponsoring firms (LS). The funds are divided into three groups: small (<A$100,000), medium (A$100,000 < size > A$1,000,000) and large (>A$1,000,000) based on their end-of-year total asset value. This table reports the mean rank. The figure in the parentheses is the number of observations. SUBS is the nature of the firm where 1= subsidiary firms and 0 = local firms. LS is the listing status of the sponsoring firms, where 1 = listed firms and 0= no listed. IMFee = investment management fee. INVFee = investment expenses. ADMFee = administration fee. AUDFee = audit fee. ROR = APRA’s rate of return. BAR = benchmark adjusted return.
IMFEE INVFEE ADMFEE AUDFEE ROR BAR
FUND SUBS
No Yes No Yes No Yes No Yes No Yes No Yes
Small 18(14) 21(6) 18(14) 20(6) 16(14) 12(6) 11(14) 17(6) 24(14) 30(6) 23(14) 30(6)Med 27(10) 24(12) 27(10) 25(12) 29(10) 28(12) 29(10) 32(12) 24(10) 27(12) 27(10) 25(12)Large 47(6) 40(4) 47(6) 40(4) 48(6) 45(4) 48(6) 39(4) 29(6) 31(4) 29(6) 33(4)All 27(52) 27(52) 27(52) 27(52) 27(52) 27(52)df 5 5 5 5 5 5K-W Value
19.6598 20.1801 30.4261 32.6455 1.6117 1.9700
p-value 0.0014 0.0012 0.0000 0.0000 0.8998 0.8533LS
No Yes No Yes No Yes No Yes No Yes No Yes
Small 18(17) 25(3) 17(17) 24(3) 15(17) 16(3) 13(17) 13(3) 27(17) 19(3) 26(17) 20(3)Med 24(15) 28(7) 24(15) 29(7) 30(15) 24(7) 30(15) 33(7) 27(15) 24(7) 26(15) 26(7)Large 48(1) 44(9) 48(1) 44(9) 37(1) 48(9) 44(1) 44(9) 16(1) 16(1) 25(1) 31(9)All 27(52) 27(52) 27(52) 27(52) 27(52) 27(52)df 5 5 5 5 5 5K-W
Value
19.8519 20.4358 31.2942 31.0385 2.4202 1.4933
p-value 0.0013 0.0010 0.0000 0.0000 0.7885 0.9138

22 JLFM / 2012 VOL 11 ISSUE 2
REFERENCESW G Albercht, H Shamsub and N A Giannatasio, ‘Public Pension Fund Governance Practices and Financial Performance’ (2007) 19 Journal of Public Budgeting, Accounting and Financial Management 245–67.
M Ammann and A Zingg, ‘Performance and Governance of Swiss Pension Funds’ (2010) 9 Journal of Pension Economics and Finance 95, 95–128.
Australian Prudential Regulation Authority, Superannuation Fund-Level Rates of Return (Barton ACT, June 2010).
Association of Superannuation Funds Australia, Superannuation Fund Governance: Understanding the Framework (2004).
K L Benson, M Hutchinson and A Sriram, ‘Governance in the Australian Superannuation Industry’ (2011) 99 Journal of Business Ethics 183, 183–200.
S Bhagat and B Bolton, ‘Corporate Governance and Firm Performance’ (2008) 14 Journal of Corporate Finance 257, 257–73.
J A Bikker and J De Dreu, ‘Operating Costs of Pension Funds: The Impact of Scale, Governance and Plan Design’ (2009) 8 Journal of Pension Economics & Finance 63, 63–89.
J Casanova, ‘Good Pension Governance Follows Good Corporate Governance’ (2001) 65 Ivey Business Journal 48, 48–53.
D S Chung, B G Kim, D Kim and S Choi, 2008. ‘Corporate Governance and Firm Performance: The Korea Evidence’ (2008) 8 Journal of International Business and Economics 46, 46–53.
G L Clark, ‘Pension Fund Governance: Expertise and Organisational Form’ (2004) 3 Journal of Pension Economics & Finance 233, 233–53.
G L Clark and R Urwin, ‘Innovative Models of Pension Fund Governance in the Context of Global Financial Crisis’ (2009) 15 Pensions 62, 62–77.
J F Cocco and P F Volpin, ‘Corporate Governance of Pension Plans: The UK Evidence’ (2007) 63 Financial Analyst Journal 70, 70–83.
A D Coleman, N Esho and M Wong, ‘The Impact of Agency Costs on the Investment Performance of Australian Pension Funds’ (2006) 5 Journal of Pension Economics and Finance 299, 299–324.
J Cotter and M Silvester, ‘Board and Monitoring Committee Independence’ (2003) 39 Abacus 211, 211–32.
K Daniel, M Grinblatt, S Titman and R Wermers, ‘Measuring Mutual Fund Performance with Characteristic-Based Benchmarks’ (1997) 52 Journal of Finance 1035, 1035–58.
M Donald, What Contribution Does Trust Law Make to the Regulatory Scheme Shaping Superannuation in Australia? (Australian Prudential Regulation Authority, 2011).
J Erickson, Y Park, J Reising and H H Shin, ‘Board Composition and Firm Value Under Concentrated Ownership: The Canadian Evidence’ (2005) 13 Pacific-Basin Finance Journal 387, 387–410.
E F Fama and M C Jensen, ‘Separation of Ownership and Control’ (1983) 26 Journal of Law and Economics 301, 301–25.
M Firth, P M Fund and O M Rui, ‘Ownership, Governance Mechanisms and Agency Costs in China’s Listed Firms’ (2008) 9 Journal of Asset Management 90, 90–101.
V Gupta, M Orszag and J Piggot, ‘How Do Australian Superannuation Fund Trustees Perceive Their Role and Effectiveness? In: Research, A. I. F. P. A. (ed.). University of New South Wales (2007).
D Hess and G Impavido, Governance of Public Pension Funds: Lessons from Corporate Governance and International Evidence (World Bank Policy Research Working Paper 3310).
M C Jensen and W H Meckling, ‘Theory of the Firm: Managerial Behaviour, Agency Costs and Ownership Structure’ (1976) 3 Journal of Financial Economics 305, 305–60.
R Jeremiah, ‘IBIS World Industry Report K7412: Superannuation Funds in Australia’ (2011).
N Kakabadse, A Kakabadse and A Kouzmin, ‘Pension Fund Trustees: Role and Contribution’ (2003) 21 European Management Journal 376, 376–86.

JLFM / 2012 VOL 11 ISSUE 2 23
G C Kiel and G J Nicholson, ‘Board Composition and Corporate Performance: How the Australian Experience Informs Contrasting Theories of Corporate Governance’ (2003) 11 Corporate Governance: An International Review 189, 189–205.
K Liu and B R Arnold, Australian Superannuation Outsourcing — Fees, Related Parties and Concentrated Markets (Australian Prudential Regulation Authority, 2010).
C F Loderer and U Waelchli, ‘Protecting Minority Shareholders: Listed Versus Unlisted Firms’ (ECGI — Finance Working Paper No 133 of 2006).
J Marquez, ‘Pension Consultants under the Microscope in the Wake of Conflict-of-Interest Findings’ (2005) 84 Workforce Management 58, 58–60.
J A Pearce Ii and S A Zahra, ‘Board Composition from a Strategic Contigency Perspective’ (1992) 29 Journal of Management Studies 411, 411–38.
S Rosenstein and J Wyatt, ‘Outside Directors, Board Independence and Shareholder Wealth’ (1990) 26 Journal of Financial Economics 175, 175–91.
M Singh and W N Davidson, ‘Agency Costs, Ownership Structure and Corporate Governance Mechanisms’ (2003) Journal of Banking and Finance 27.
F Stewart and J Yermo, Pension Fund Governance: Challanges and Potential Solutions (Financial Market Trends, OECD, 2008).
W Sy, C Inman, N Esho and R Sane, Superannuation Fund Governance: Trustee Policies and Practices Australia (Australian Prudential Regulation Authority, 2008).
W Sy and K Liu, Investment Performance Ranking of Superannuation Firms (Australian Prudential Regulation Authority, 2009).
P Tufano and M Sevick, ‘Board Structure and Fee Setting in the US Mutual Fund Industry’ (1997) Journal of Financial Economics 46.
F W Wright, J Madura and K Wiant, ‘The Different Effects of Agency Costs on Multinational Corporations’ (2002) 12 Applied Financial Economics 347, 347–59.
D Yermack, ‘Higher Market Valuation of Companies a Small Board of Directors’ (1996) 40 Journal of Financial Economics 185, 185–202.
A U T H O R P R O F I L E S
Miss Thi Thuy Chi Nguyen is currently a banking officer at Australia and New Zealand Banking Group Ltd located in Vietnam after graduating from Royal Melbourne Institute of Technology with an Honours degree in Economics and Finance.
Dr. Monica Tan is currently a Senior Lecturer in Finance at RMIT University. Her research interests include corporate and fund governance, ownership structure and business networks. She was previously a Risk & Governance consultant at Deloitte Touche Tohmatsu and Acumen Alliance.
Dr. Marie-Anne Cam is currently a Lecturer in Finance at RMIT University. Her research interests include equity markets, managed funds, superannuation funds and political economy (terrorism and wars). She has professional experience working at Frontier Investment Consulting before joining RMIT University.