ngineering Outsourcing Company People and Technology ... · Engineering outsourcing in technical...
42
The Engineering Outsourcing Company ® MEITEC People and Technology leading the Way to the Future Annual Report 2006
Transcript of ngineering Outsourcing Company People and Technology ... · Engineering outsourcing in technical...

The Engineering Outsourcing Company®MEITEC
People and Technology leading the Way to the Future
Annual Report 2006
Consolidated Financial Highlights . . . . . . . . . . . . . . . . . . . . . . . . 1
To Our Shareholders . . . . . . . . . . . . . . . . . . . . . . . . . . . . . . . . . . 2
Group Strategy . . . . . . . . . . . . . . . . . . . . . . . . . . . . . . . . . . . . . . 4
Operational Review . . . . . . . . . . . . . . . . . . . . . . . . . . . . . . . . . . . 5
Management Policies . . . . . . . . . . . . . . . . . . . . . . . . . . . . . . . . . 6
Global Vision 21: The Meitec Group Management Plan . . . . . . 8
Five-Year Summary . . . . . . . . . . . . . . . . . . . . . . . . . . . . . . . . . . 12
Consolidated Financial Review . . . . . . . . . . . . . . . . . . . . . . . . . 13
Consolidated Balance Sheets . . . . . . . . . . . . . . . . . . . . . . . . . . 14
Consolidated Statements of Income . . . . . . . . . . . . . . . . . . . . 16
Consolidated Statements of Shareholders’ Equity . . . . . . . . . . 17
Consolidated Statements of Cash Flows . . . . . . . . . . . . . . . . . 18
Notes to Consolidated Financial Statements . . . . . . . . . . . . . . 19
Independent Auditors’ Report . . . . . . . . . . . . . . . . . . . . . . . . . 35
Supplemental Non-Consolidated Balance Sheets (Unaudited) . . 36
Supplemental Non-Consolidated Statements of Income (Unaudited). . 38
Corporate Data . . . . . . . . . . . . . . . . . . . . . . . . . . . . . . . . . . . . . 39
CONTENTS
FUTURE FORECAST DISCLAIMER
The projected MEITEC results, management strategies, and beliefs about the future presented in this Annual Report 2006 are based on MEITEC determinations obtained from information available at the time of writing. Readers are requested to be aware of the potential for a large discrepancy between the forecasts contained here and actual business results, as these predictions contain elements of uncertainty as well as known and unknown risks.
0
20,000
40,000
60,000
80,000
100,000
0
2,000
4,000
6,000
8,000
0
50
100
150
200
200620052004 200620052004 200620052004
NET SALES(Millions of Yen)
BASIC NET INCOME PER SHARE (Yen)
NET INCOME (Millions of Yen)
71,255
79,12083,224 6,709
4,7085,302
185.69
126.61138.93
1
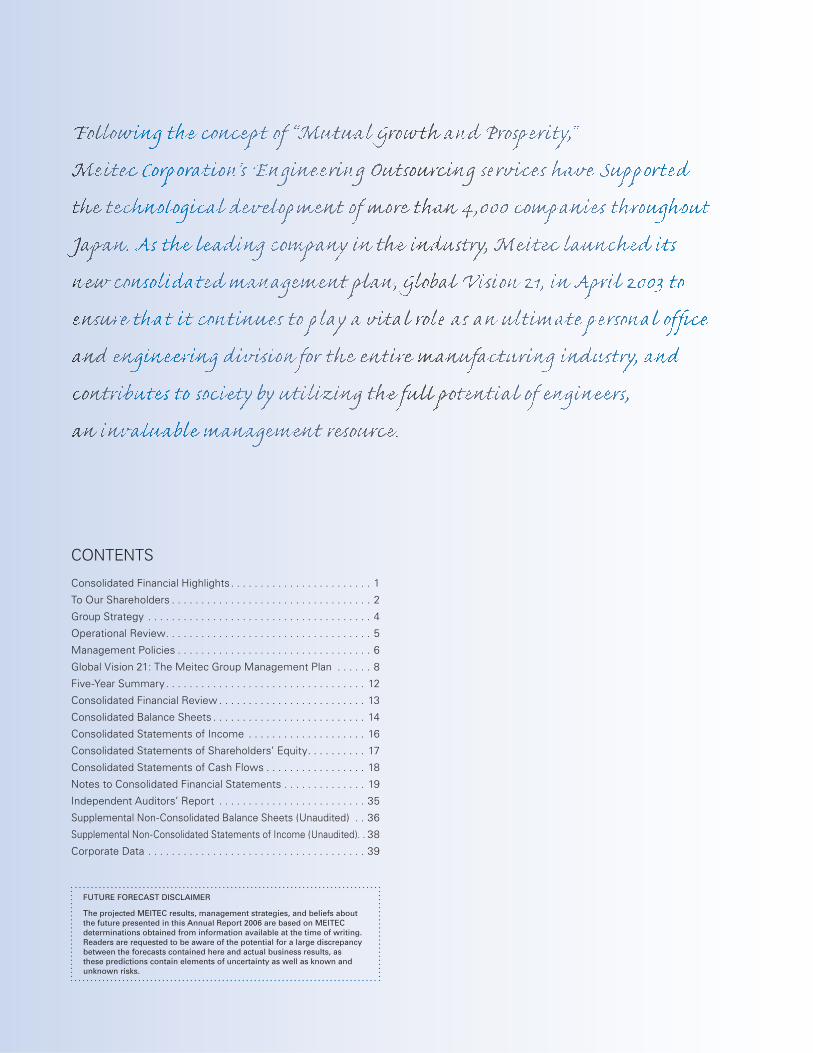
Thousands of U.S. dollars Millions of yen (Note 1)Years ended March 31 2006 2005 2004 2006
Net sales ¥ 83,224 ¥ 79,120 ¥ 71,255 $ 711,313
Operating income 12,485 12,289 12,267 106,710
Net income 5,302 4,708 6,709 45,318
Total assets 67,185 68,675 60,882 574,233
Total shareholders’ equity 46,668 49,218 42,686 398,873
U.S. dollars Yen (Note 1)
Per Share of Common Stock:
Net income (basic) (Note 2) ¥ 138.93 ¥ 126.61 ¥ 185.69 $ 1.19
Cash dividends 90.50 64.00 78.00 0.77
Shareholders’ equity 1,274.10 1,295.04 1,228.41 10.89
%
Return on average equity 11.1 10.2 15.2
Notes: 1. U.S. dollar amounts are translated from Japanese yen, for convenience only, at the rate of ¥117 to $1, the approximate exchange rate prevailing as of March 31, 2006. 2. Net income per share is computed based on the weighted average number of shares outstanding during each term.

I would like to express my sincere
appreciation for your continuing support
of Meitec Corporation . I am pleased to
present our business report for the fi scal
year ended March 31, 2006.
A STRONG OPERATING ENVIRONMENT
During the period under review, the domestic econ-
omy of Japan was affected by concerns over the steep
rise in raw material prices, particularly for crude oil,
and the sense of uncertainty surrounding the future
of the U.S. and Chinese economies, countries with
which Japan’s economy is strongly linked. Overall,
however, there was an underlying tone of recovery
continuing from the previous fiscal period. Specifi-
cally, in the manufacturing industry that includes
Meitec’s primary clients, new capital investment is
showing expansion in fields ranging from develop-
ment to manufacturing, demonstrating a trend toward
greater medium- and long-term strategic investment.
RECORD-HIGH REVENUE AND OPERATING
INCOME
In this market environment, Meitec expanded its pri-
mary business of temporary engineers staffi ng business,
and achieved both increased record-high revenues
and earnings (operating income), marking increased
revenues for six consecutive years and earnings for
three consecutive years on a consolidated basis.
In consolidated net sales, approximately 86% of
which are generated by the temporary engineers staff-
ing business, Meitec was roughly on par with sales in
the same period of the previous year, while MEITEC
FIELDERS INC., experienced a 6.7% gain in revenues.
This came about as the result of the Group expanding
its market share through the collaboration of marketing
operations of Meitec and Meitec Fielders brands.
Net sales by engineering field grew substantially
compared to the same period in the previous year in
the three fields of electronics, precision equipment,
and information and communications devices. This
was a result of marketing efforts to diversify net sales
among a variety of fi elds, in order to correct the over-
dependence on sales expansion in the automobile
and semiconductor design fi elds during recent years.
Although the utilization ratio of Meitec exceeded the
result of the previous interim period, it suffered slight
losses in revenues and earnings due to quantity in
utilization falling below previous results.
While Meitec Fielders achieved higher revenues
in order to grow the number of engineers, operating
income decreased because of rising SG&A expenses
2

for expansion of business. Cooperation between the
temporary engineers staffi ng business and registered-
style temporary staffing business company Japan
Cast Inc., as well as cooperation between the Meitec
Group and Meitec Fielders in enhancing marketing
efforts focused on the manufacturing industry, led to
the achievement of increases in both sales and profi ts.
The engineering solutions business primarily serves
our clients, the manufacturing industry, with our engi-
neers placed there as key personnel to conduct design
and development activities such as fabrication of
prototype model and printed circuit boards.
Engineering solutions companies Three D Tec Inc.
(3D Tec) and Information Management System Co.,
Ltd. ( IMS) each achieved increased revenues and
operating income by enhancing marketing efforts and
expanding the scope of their services. Apollo Giken
Co., Ltd., which is charged with strengthening the
printed circuit board business, was newly added to
the Meitec Group from October 2005 in a measure to
further expand business.
ONGOING EXPANSION OF GLOBAL OPERATIONS
Meitec Global Solutions Inc. also recorded rising
revenues. This was due to a steady expansion in con-
tracts for its offshore-style outsourcing to Chinese
corporations, now in its third year in business, and the
Chinese engineer outsourcing business launched in
October 2005. Operating income declined, however,
due to the recording of prior investment costs to train
Chinese engineers as prime cost/sales and general
administrative expenses.
PROFITABILITY ACHIEVED AT DRAKE BEAM
MORIN GROUP
The outplacement business conducted by Drake Beam
Morin-Japan, Inc. (DBM-J)—which was integrated
with the Company in October 2004—recorded de-
clines in revenue and earnings (operating income)
that continued from the previous fi scal year, due to
the impact of shrinkage in the outplacement market.
However, the successful integration and abolition of
DBM-J’s U.S. subsidiary, Novations Group, Inc., and
its subsidiaries Novations Group, Inc. and Novations
Performance Solutions, Ltd. in December 2004
restored profi tability (operating income) to the Drake
Beam Morin Group.
FINANCIAL PERFORMANCE
As a result of the foregoing, consolidated net sales
rose 5.2%, to ¥83,224 million. Operating income in-
creased 1.6%, to ¥12,485 million, ordinary income
expanded 3.1%, to ¥12,562 million, and net income
advanced 12.6%, to ¥5,302 million. Return on eq-
uity (ROE) was up 0.9 percentage point, to 11.1%,
compared with the same period of the previous fi scal
year.Dividends for the fi scal year under review, based
on our policy of maintaining a dividend payout ratio
greater than 50% of net income per share, have
been set at ¥90.50 (US$0.77) per share, including an
interim dividend of ¥44.0 (US$0.38) per share.
Thank you for your continued support of Meitec.
June 2006
Kosuke Nishimoto
President, CEO & COO
3

The Meitec Group focuses on its core temporary en-
gineers staffi ng business, from which it extends into
four areas: the full-line temporary staffing business;
the engineering solutions business; the global busi-
ness; and the career support business. Each Group
company forms organic connections with the others
while making effective use of its own strengths, as the
Group grows in these four directions.
This “gateway strategy” allows us to provide on a
Group-wide basis the various resources and services
necessary to the business processes of the manufac-
turing industry, our principal client.
Engineering Solutions Business
Global Business
Career Support Business Temporary Engineers Staffi ng BusinessFull-Line Temporary
Staffi ng Business
� Temporary Engineers Staffi ng Business
Engineering outsourcing (design and development of
machinery, electricity, electronics and computer soft-
ware and other specialized outsourcing). This business
area is handled by Meitec.
� Full-Line Temporary Staffi ng Business
Engineering outsourcing in technical fi elds different
from Meitec, handled by Meitec Fielders, and a
registration-style temporary staffi ng business handled
by Japan Cast. Meitec Experts handles the temporary
senior engineering staff business.
� Engineering Solutions Business
Engineering solutions for the creation of prototypes
and circuit boards corresponding to design and
development, handled by 3D Tec, IMS and Apollo
Giken. Meitec CAE handles outsourcing and staffi ng for
all types of mechanical CAE.
� Global Business
Training and consulting to develop engineers over-
seas, is the main business focus of the following
subsidiaries: MGS, Meitec Shanghai, MEITEC Dalian
TechnoCenter Co., Ltd., and MEITEC Guangzhou
Techno-Center Co., Ltd.
� Career Support Business
Outplacement support services to employees leaving
client firms under contract with client firms, handled
by DBM-J.
MEITEC GROUP’S BUSINESS DOMAINS
4
0
3,000
6,000
9,000
12,000
15,00013,43213,32413,391
NET SALES (Millions of Yen)
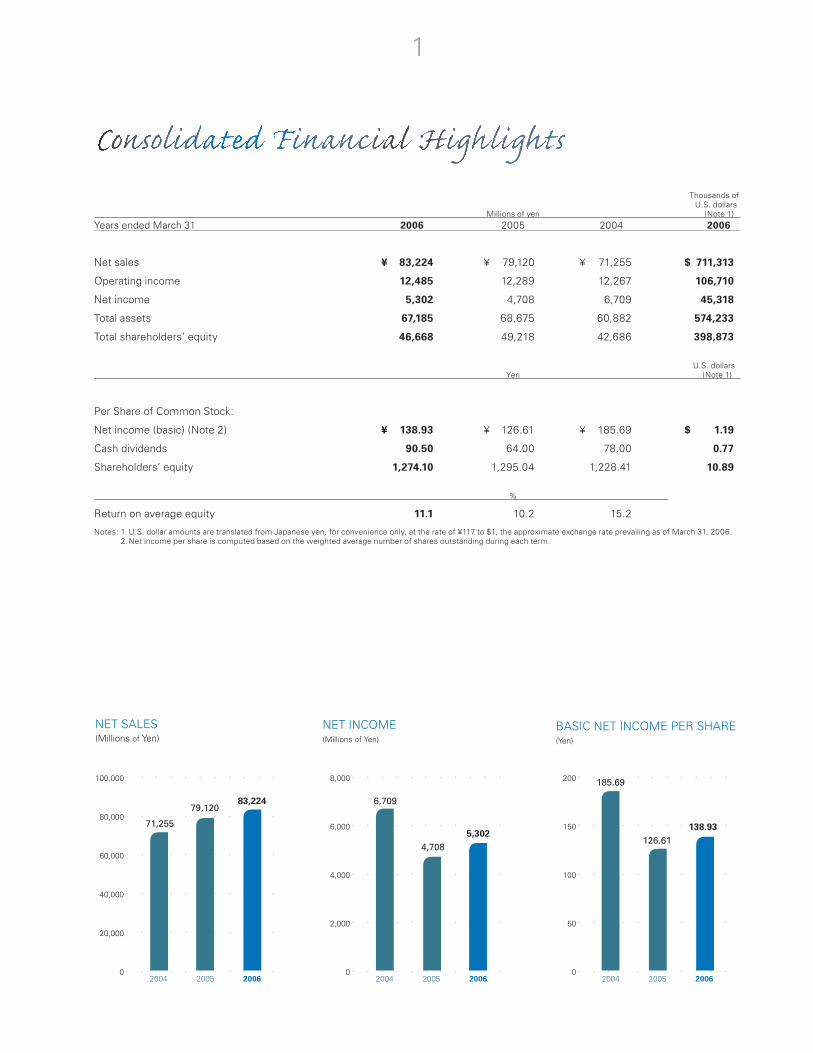
1 Automobile/Transportation21.9%
2006200520040
1,000
2,000
3,000
4,000
3,0903,4703,297
NET SALES (Millions of Yen)
2 Aircraft/Aerospace5.0%
2006200520040
2,000
4,000
6,000
8,000
5,9826,502
5,810
NET SALES (Millions of Yen)
3 Industrial Machinery9.7%
2006200520040
1,000
2,000
3,000
4,000
2,963
2,3852,435
NET SALES (Millions of Yen)
4 Precision Equipment4.8%
200620052004
0
1,000
2,000
3,000
4,000
5,000
3,1053,5893,922
NET SALES (Millions of Yen)
9 Information Processing Software 5.1%
2006200520040
200
400
600
800
1,000
1,200999984
1,111
NET SALES (Millions of Yen)
10 Plant1.6%
2006200520040
100
200
300
400
261
302323
NET SALES (Millions of Yen)
11 Construction0.4%
2006200520040
500
1,000
1,500
2,000
2,5002,0952,0702,061
NET SALES (Millions of Yen)
12 Other3.4%
200620052004
0
2,000
4,000
6,000
8,000
6,6096,1245,685
NET SALES (Millions of Yen)
5 IT-Related Hardware and Devices 10.8%
2006200520040
2,000
4,000
6,000
8,000
10,000
12,00010,333
9,2698,127
NET SALES (Millions of Yen)
6 Electric and Electronics16.8%
2006200520040
2,000
4,000
6,000
8,000
10,000
12,0009,68010,14610,067
NET SALES (Millions of Yen)
7 Semiconductors and Integrated Circuit Design 15.8%
2006200520040
1,000
2,000
3,000
4,000
2,8712,9443,289
NET SALES (Millions of Yen)
8 Semiconductor Equipment andDevices 4.7%
200620052004
Temporary Engineers Staffing Business 72.9%
Full-Line Temporary Staffing Business 16.8%
Engineering Solutions Business 1.9%
Global Business 0.3%
Outplacement Business 3.1%
Others 5.0%
1
2
3
4
56
7
89
111012
REVENUE BY MEITEC GROUP’S BUSINESS DOMAIN MEITEC REVENUES BY CUSTOMER
5

BASIC MANAGEMENT POLICY
The Meitec Group’s basic management policy is to
realize mutual growth and prosperity for sharehold-
ers, customers and employees by providing outsourc-
ing services, while contributing to the development
of an advanced information society. As the leading
group of companies in this industry, we have adopted
the following policies to ensure that we grow in step
with society.
1) SHAREHOLDER SATISFACTION:
The Meitec Group shall try to maximize the value of
the Company to benefi t its shareholders.
2) CUSTOMER SATISFACTION:
The Meitec Group shall become a strategic partner
for its clients and achieve business advancement
together, by sharing such management resources as
engineers and information.
3) EMPLOYEE SATISFACTION:
The Meitec Group shall support the efforts of each
and every employee for their advancement in
market value and their careers.
The Meitec Group is focusing i ts bus iness
operations primarily on the manufacturing industries,
which allows the maximum utilization of the Group’s
management resources and the fullest expression of
the Group’s strengths. At the same time, by advancing
according to the Group’s strategy, we plan to expand
our business into the fields peripheral to our core
business of engineering outsourcing.
DIVIDEND POLICY
Meitec maintains a basic policy of providing returns to
shareholders based on its operating performance. The
dividend payout ratio was set at more than 30% of
consolidated net income beginning in fi scal year ended
March 31, 2001. Additionally, it has been decided that,
from the interim period currently under review, the div-
idend payout ratio shall be equivalent to 50% or more
of consolidated net income, unless there lies a need
for large-scale capital for investment in the successive
half-year period.
Furthermore, we are linking the retirement of treas-
ury stock with Group cash management as a means
of improving capital efficiency. Specifically, we have
defined the Group’s working capital requirements
as equivalent to two months’ consolidated net sales.
When the end of fiscal-year cash position exceeds
this benchmark level, the cash excess (the amount
in excess of two months’ Group net sales) becomes
the planned amount of treasury stock acquisition and
retirement during the following fiscal year. Where
there is no pending investment requiring large-scale
funds in the following fi scal half-year, the retirement of
treasury stock will be carried out at the rate of 50% of
the planned annual amount per half-year. Bonuses for
directors will be set at 2% of consolidated net income.
We have granted stock options on seven occasions in
the past as an incentive to improve performance. The
Company decided to stop offering new stock option rights
as incentives and changed to a system of performance-
linked bonuses for the reasons listed below.
6

1) A performance- linked bonus system had been
introduced as a more effective incentive system for
improved performance for directors and employees.
2) The proportion of dormant stock options was
high, and it was not functioning effectively as an
incentive system.
3) The new procedure for reporting stock options as
expenses from March 2007 is expected to have a
direct infl uence on the Company’s performance.
Internal reserves serve not only to strengthen the
Company’s financial position, but also fund invest-
ments in training facilities, information systems and
improvement of the quality of services provided to
customers, as well as to fund the investments re-
quired for increasing the value added in our core busi-
ness, where we are expanding our business domain
through alliances with other fi rms. These investments
are directed at increasing the Company’s earnings, and
are therefore in the best interests of shareholders.
MANAGEMENT GOALS
In the interests of shareholders, Meitec pursues a
management policy of increasing its earnings and
improving its capital effi ciency. Accordingly, the Com-
pany has set a fi rm goal of keeping ROE above 10%.
And Meitec’s Global Vision 21 consolidated manage-
ment plan, which was implemented in fi scal 2005, will
establish a goal for ROE of 15%.
7

THEME FOR FISCAL 2007: “BROADBANDIZATION”
OF THE STAFFING BUSINESS
The Meitec Group has sought to increase the corporate
value of the entire Group since the launch of its five-
year management plan in the fi scal year ended March
31, 2004, mainly by providing a full lineup of services
in the staffing business, establishment of a system
that would allow engineers to increase their market
value on their own, and global development in China
and other areas. In the fourth year of the plan, we are
striking out in a new direction to further strengthen our
foundation for growth, the “broadbandization” of the
staffi ng business.
Until now, the Meitec Group has focused on provid-
ing a full lineup of services to fi ll a wide range of client
needs, from low-end to high-end services, through its
main brands: Meitec, Meitec Fielders, and Japan Cast.
The “broadbandization” of staffing is an initiative to
expand our business domains across the operational
phase, and widen our scope of human resources to
include foreigners and seniors.
Engineer rotation Related business Recruitment consulting
Foreigners Engineers Available for Staffi ng Seniors
Low
Te
chn
ical
Lev
el
Hig
h Temporary Engineers Staffi ng Business
Meitec
Full-Line Temporary Engineers
Staffi ng Business
Meitec Fielders(Sub-brand name)
Full-Line Temporary Staffi ng Business
Japan Cast
Global Business
Meitec Global Solutions (MGS)
Seniors OutsourcingBusiness
Meitec Experts
“BROADBANDIZATION” OF THE STAFFING BUSINESS
8

MEASURES TO REALIZE “BROADBANDIZATION”
IN THE STAFFING BUSINESS
Development of the Chinese Engineer Staffing
Business (Meitec Global Solutions)
Meitec Global Solutions (MGS) has been providing
engineers trained at its facility in China to the Chinese
subsidiaries of Japanese corporations since the fiscal
year ended March 31, 2006, and has launched a “bridge
engineer” business to dispatch Chinese engineers to
development sites in Japan.
Many Japanese companies are now actively trans-
ferring operations to development sites in China. There
have been many stumbling blocks, however, such as
differences in approach to work and rapid job turnover,
and it is extremely difficult for companies to retain
talented people on their own. MGS provides a solu-
tion to companies facing such problems by referring
engineers trained at its teaching facility in China. In
addition, as a part of the Meitec Group’s strategy to
boost the number of personnel, MGS hires Chinese
engineers and dispatches them to the development
sites of its clients in Japan as a “bridge engineer”
business. This scheme aims to increase satisfaction
of client companies, while advancing the careers of
Chinese engineers.
During the fiscal year ending March 31, 2007, we
plan to establish a training facility in inland China
in tandem with the advance of facility construction
by the manufacturing industry, with an eye toward
expansion into other areas of Asia.
START OF BRIDGE ENGINEER OUTSOURCING
Chinese science
and engineering
graduates
Chinese
engineers
Training
business
company
in China
Meitec Shanghai
Meitec Global
Solutions (MGS)
Japanese manufacturers
in China
Meitec Group
customers
(domestic)
Registration
Recruitment consulting
Bridge engineer
outsourcing
Hiring
Acceptance
9

A New Venture for Meitec:
The Seniors Staffi ng Business
One of Meitec’s new ventures to promote “broadband-
ization” of the staffi ng business is the development of
a staffi ng business for seniors, handled by a new
company, Meitec Experts.
The ongoing decline in the birthrate and aging
of society has led to concerns over a decline in
the population of younger workers, and focus is
turning to the postwar baby-boomer generation, as
a means of complementing the workforce once the
boomers begin retiring en masse from 2007. Meitec
Experts utilizes the strengths of the Meitec Group—
the career matching, training and support capabili-
ties of Meitec, and the career consultation services
of DBM-J—to provide employment opportunities to
seniors who have a desire to work but no place to
utilize their talents. It is also working to create a labor
market for seniors by addressing the problem faced by
many companies of passing on technical skills to the
next generation. By dispatching individuals to a field
in which they can fully utilize the career experience
that they have built up over many years, we seek to
increase satisfaction of both the client companies and
those returning to employment.
Changes in the environment for the seniors labor market
Postwar baby-boom genera-tion reaches retirement age
Highly motivated senior workers
THE SENIORS LABOR MARKET TO GAIN MOMENTUM FROM 2006
THE MEITEC GROUP’S SENIORS STAFFING BUSINESS
MANU-FACTURING INDUSTRY
Seniors with a desire to work, but unable to
utilize their careers
Meitec Experts
� Career matching
� Training and support
� Career consulting
MEITEC GROUP
CLIENTS
Companies with a
shortage of engineers
Reg
istr
atio
n
Dis
pat
ch
LEGISLATION OF EMPLOYMENT EXTENSION
Creation of a seniors
labor market
10

The Meitec Group has established Global Vision 21, its
business plan covering the period from March 2004
through March 2008 (April 1, 2003 to March 31, 2008).
The aim of the plan is to focus on the core business of
engineer staffi ng, and increase the value of the entire
Group by expanding its business domain through close
cooperation between Group companies.
THE 14 STRATEGIC TOOLS
Meitec, through its business plan Global Vision 21, is
enhancing its internal systems and training programs
to refine and expand the range of skills of its engi-
neers, in the belief that increasing the market value of
engineers is linked directly to greater corporate value.
The “14 Strategic Tools” are strategically employed by
engineers to enhance their skills.
The 14 Strategic Tools constitute the most widely
used training curriculums and business systems in the
staffi ng industry to enhance engineering skills. These
include the Career Support System, which provides
a training curriculum to expand an engineer’s fields
of expertise, and the Best Matching System, which
compares a client’s requirements with a database con-
taining the career histories of engineers to provide an
optimal match. This framework, which increases satis-
faction on the part of both the client and the engineers,
is one of the major features setting Meitec apart from
the competition.
THE 14 STRATEGIC TOOLS
ENGINEERS
Exp
and
ing
Bu
siness D
om
ains
Progress in Operational Phase
Increasing Management Capabilities
Incr
easi
ng
Net
wo
rk P
ow
er: C
om
mu
nic
atio
n
CONTRIBUTING TO OVERALL
PRODUCTIVITY
• In-house Certifi cation Instructors• Learning Management System (LMS)• Knowledge Sharing System
INCREASING PERSONAL
MARKET VALUE
• Career Support System• Best Matching System (BMS)• Strategic Rotation• Internal Recruiting System• Customer Satisfaction (CS) Sheet
INCREASING TEAM
MARKET VALUE
• e-Community• Manager Activities• Project Management Training
RAISING PRODUCTIVITY
• Service Contents Business• Global Business• Supporting Board
11

CONSOLIDATED
Performance and Ratios Millions of yen, except where noted 2006 2005 2004 2003 2002
Net sales ¥ 83,224 ¥ 79,120 ¥ 71,255 ¥ 65,737 ¥ 64,998
Operating income 12,485 12,289 12,267 9,149 10,193
Operating income margin (%) 15.0 15.5 17.2 13.9 15.7
Net income 5,302 4,708 6,709 5,472 5,309
Net profi t margin (%) 6.4 6.0 9.4 8.3 8.2
Return on average equity (%) 11.1 10.2 15.2 12.1 11.2
Capital Safety
Total assets ¥ 67,185 ¥ 68,675 ¥ 60,882 ¥ 59,831 ¥ 61,927
Equity ratio (%) 69.5 71.7 70.1 75.9 72.5
Ratio of SG&A expenses to net sales (%) 16.9 15.6 13.1 12.6 12.9
Per Share Indicators
Yen
Net income (basic) ¥ 138.93 ¥ 126.61 ¥ 185.69 ¥ 145.15 ¥ 137.83
Cash dividends 90.50 64.00 78.00 47.50 42.50
Shareholders’ equity 1,274.10 1,295.04 1,228.41 1,244.88 1,194.86
NON-CONSOLIDATED
Performance and Ratios Millions of yen, except where noted 2006 2005 2004 2003 2002
Net sales ¥ 61,426 ¥ 61,110 ¥ 59,519 ¥ 55,379 ¥ 55,638
Operating income 11,132 11,219 10,758 8,027 9,311
Operating income margin (%) 18.1 18.4 18.1 14.5 16.7
Net income 6,820 6,854 6,044 5,018 4,822
Net profi t margin (%) 11.1 11.2 10.2 9.1 8.7
Return on average equity (%) 14.3 15.6 14.6 11.7 10.4
Capital Safety
Total assets ¥ 69,727 ¥ 65,501 ¥ 58,994 ¥ 58,297 ¥ 60,443
Equity ratio (%) 67.8 73.8 67.1 73.7 70.8
Ratio of SG&A expenses to net sales (%) 12.9 12.8 13.2 12.7 12.9
Per Share Indicators
Yen
Net income (basic) ¥ 179.94 ¥ 185.84 ¥ 167.03 ¥ 133.16 ¥ 125.19
Shareholders’ equity 1,290.69 1,271.33 1,138.81 1,177.55 1,139.77
Five-Year Summary
12

Consolidated Financial ReviewTOTAL CURRENT ASSETS
Total current assets increased ¥1,018 mil l ion
(US$8,701 thousand), as strong business performance
resulted in an increase in cash and cash equivalents of
¥414 million (US$3,538 thousand).
PROPERTY AND EQUIPMENT
Net property and equipment declined ¥895 million
(US$7,650 thousand). This was due mainly to accu-
mulated depreciation, impairment on goodwill in Nova-
tions Group, Inc. due to the sale of a portion of that
company’s business and other factors, and impairment
on shares of Gondola Holdings, Inc., the holding com-
pany of Drake Beam Morin, Inc. (United States) which
holds Drake Beam Morin-Japan, Inc. (DBM-J).
TOTAL LIABILITIES
Total liabilities rose ¥939 million (US$8,026 thousand),
due mainly to increases in income taxes payable of
¥1,635 million (US$13,974 thousand) and liability
for retirement benefits of ¥779 million (US$6,658
thousand).
SHAREHOLDERS’ EQUITY
Shareholders’ equity amounted to ¥46,668 million
(US$398,873 thousand). Factors with a positive im-
pact included an increase in net income of ¥594 million
(US$5,077 thousand). Factors with a negative impact
on shareholders’ equity included a decline in retained
earnings of ¥3,383 million (US$28,915 thousand)
resulting from appropriation of earnings of ¥2,946
mil l ion ( US $ 25,179 thousand ) and ret i rement
of treasury stock of ¥ 5,732 million (US$48,988
thousand), together with a decline in treasury stock
of ¥683 million (US$5,838 thousand) resulting from
purchases of the Company’s stock for retirement of
shares, and the retirement of shares.
NET SALES
An expansion of business content accomplished
through joint marketing efforts of Group companies,
primarily in the mainstay temporary engineers staffi ng
business, resulted in record-high net sales.
CASH FLOWS
Cash provided by operating activities increased by
¥4,177 million (US$35,701 thousand), while cash
used in fi nancing activities increased by ¥2,925 million
(US$25,000 thousand) to ¥8,134 million (US$69,520
thousand) compared to the previous fiscal year, due
mainly to the acquisition of treasury stock. As a result,
cash and cash equivalents at the end of the fi scal pe-
riod under review increased by ¥414 million (US$3,541
thousand), to ¥17,275 million (US$147,653 thousand).
13

Consolidated Balance SheetsMEITEC CORPORATION and Subsidiaries March 31, 2006 and 2005
Millions of Yen
Thousands ofU.S. Dollars
(Note 1) ASSETS 2006 2005 2006
CURRENT ASSETS:Cash and cash equivalents ¥ 17,275 ¥ 16,861 $ 147,653Short-term investments (Note 3) 4,131 3,441 35,306Notes and accounts receivable:
Trade notes and accounts 13,356 13,228 114,152Allowance for doubtful accounts (30) (117) (253)
Inventories (Note 4) 803 1,036 6,865Deferred tax assets (Note 10) 2,603 2,574 22,251Prepaid expenses and other 989 1,086 8,444
Total current assets 39,127 38,109 334,418
PROPERTY AND EQUIPMENT:Land 3,909 3,906 33,407Buildings and structures 21,387 21,534 182,797Machinery and equipment 300 184 2,563Furniture and fixtures 3,278 3,821 28,018
Total 28,874 29,445 246,785Accumulated depreciation (13,659) (13,335) (116,741)
Net property and equipment 15,215 16,110 130,044
INVESTMENTS AND OTHER ASSETS:Investment securities (Note 3) 1,614 2,612 13,793Investments in associated companies 20 31 172Consolidation goodwill 5,110 5,206 43,678Goodwill 1,119 1,856 9,567Leasehold deposits 1,217 1,244 10,400Deferred tax assets (Note 10) 2,242 1,954 19,161Deferred tax asset for land revaluation (Note 2.g) 630 630 5,381Other 891 923 7,619
Total investments and other assets 12,843 14,456 109,771
TOTAL ¥ 67,185 ¥ 68,675 $ 574,233
See notes to consolidated financial statements.
14

Millions of Yen
Thousands ofU.S. Dollars
(Note 1) LIABILITIES AND SHAREHOLDERS' EQUITY 2006 2005 2006
CURRENT LIABILITIES:Accounts payable ¥ 53 $ 450Income taxes payable 3,500 ¥ 1,865 29,918Accrued expenses 7,924 7,852 67,723Allowance for loss on foreign operations 95Other 3,344 4,865 28,586
Total current liabilities 14,821 14,677 126,677
LONG-TERM LIABILITIES:Liability for retirement benefits (Note 6) 5,430 4,651 46,410Other 74 58 636
Total long-term liabilities 5,504 4,709 47,046
MINORITY INTERESTS 192 71 1,637
SHAREHOLDERS' EQUITY (Note 7): Common stock—authorized,
142,854 thousand shares in 2006 and144,417 thousand shares in 2005; issued,36,842 thousand shares in 2006 and38,404 thousand shares in 2005 16,826 16,826 143,811
Capital surplus 15,481 15,481 132,313Retained earnings 16,228 19,611 138,697Land revaluation difference (944) (944) (8,072)Unrealized gain on available-for-sale securities 286 159 2,453Foreign currency translation adjustments (11) (34) (92)Treasury stock—at cost, 306 thousand shares in 2006
and 478 thousand shares in 2005 (1,198) (1,881) (10,237)
Total shareholders' equity 46,668 49,218 398,873
TOTAL ¥ 67,185 ¥ 68,675 $ 574,233
15
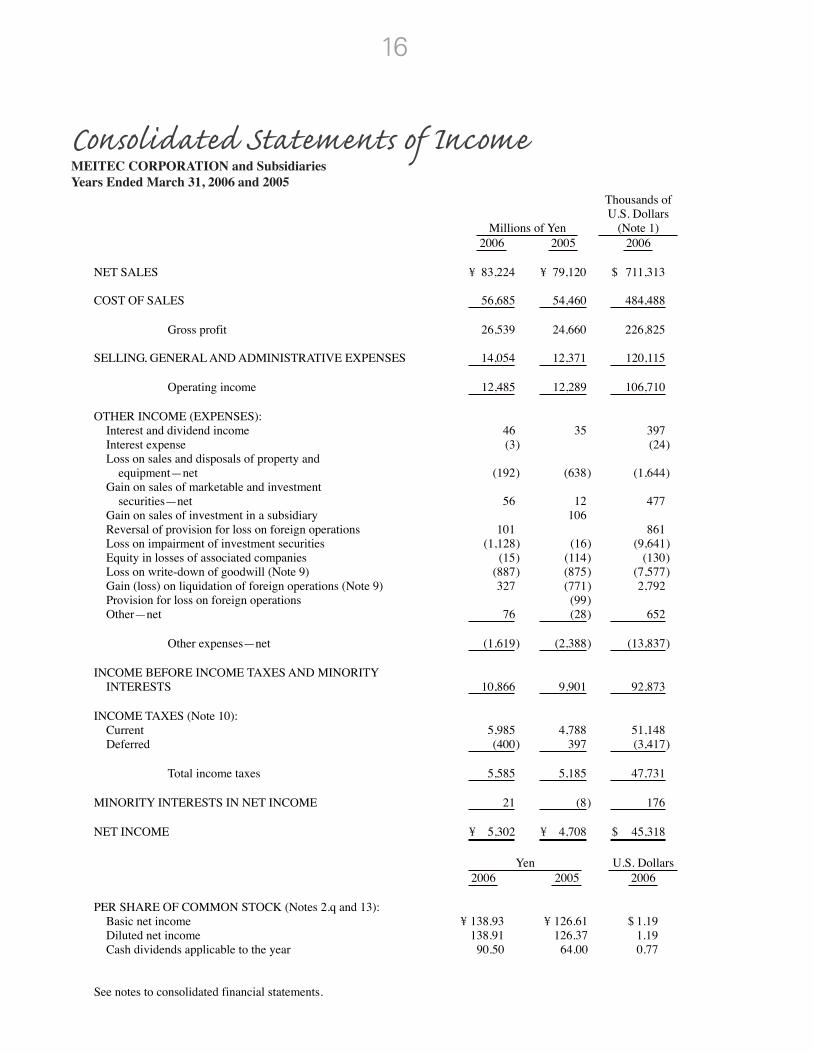
Consolidated Statements of Income MEITEC CORPORATION and Subsidiaries Years Ended March 31, 2006 and 2005
Millions of Yen
Thousands ofU.S. Dollars
(Note 1) 2006 2005 2006
NET SALES ¥ 83,224 ¥ 79,120 $ 711,313
COST OF SALES 56,685 54,460 484,488
Gross profit 26,539 24,660 226,825
SELLING, GENERAL AND ADMINISTRATIVE EXPENSES 14,054 12,371 120,115
Operating income 12,485 12,289 106,710
OTHER INCOME (EXPENSES):Interest and dividend income 46 35 397Interest expense (3) (24)Loss on sales and disposals of property and
equipment—net (192) (638) (1,644)Gain on sales of marketable and investment
securities—net 56 12 477Gain on sales of investment in a subsidiary 106Reversal of provision for loss on foreign operations 101 861Loss on impairment of investment securities (1,128) (16) (9,641)Equity in losses of associated companies (15) (114) (130)Loss on write-down of goodwill (Note 9) (887) (875) (7,577)Gain (loss) on liquidation of foreign operations (Note 9) 327 (771) 2,792Provision for loss on foreign operations (99)Other—net 76 (28) 652
Other expenses—net (1,619) (2,388) (13,837)
INCOME BEFORE INCOME TAXES AND MINORITYINTERESTS 10,866 9,901 92,873
INCOME TAXES (Note 10):Current 5,985 4,788 51,148Deferred (400) 397 (3,417)
Total income taxes 5,585 5,185 47,731
MINORITY INTERESTS IN NET INCOME 21 (8) 176
NET INCOME ¥ 5,302 ¥ 4,708 $ 45,318
Yen U.S. Dollars 2006 2005 2006
PER SHARE OF COMMON STOCK (Notes 2.q and 13):Basic net income ¥ 138.93 ¥ 126.61 $ 1.19Diluted net income 138.91 126.37 1.19Cash dividends applicable to the year 90.50 64.00 0.77
See notes to consolidated financial statements.
16

Thousands Millions of Yen OutstandingNumber of Shares of
Common Stock Common
Stock Capital Surplus
Retained Earnings
LandRevaluationDifference
UnrealizedGain on
Available-for-saleSecurities
ForeignCurrency
Translation Adjustments
Treasury Stock
at Cost
BALANCE, APRIL 1, 2004 34,637 ¥ 16,826 ¥ 8,664 ¥ 20,880 ¥ (944 ) ¥ 118 ¥ (5 ) ¥ (2,853 ) Net income 4,708 Cash dividends, ¥81.0 per share (2,808 ) Bonuses to directors (139 ) Purchase of treasury stock (594 ) (2,318 ) Disposal of treasury stock 83 291 Loss on disposal of treasury stock (3 ) (31 ) Retirement of treasury stock (2,999 ) 2,999 Shares issued in exchange for the common stock of Drake Beam Morin-Japan, Inc. 3,800 6,820 Net change in unrealized gain on available-for-sale
securities 41 Net change in foreign currency translation adjustments (29 ) BALANCE, MARCH 31, 2005 37,926 16,826 15,481 19,611 (944 ) 159 (34 ) (1,881 ) Net income 5,302 Cash dividends, ¥76.0 per share (2,844 ) Bonuses to directors (102 ) Purchase of treasury stock (1,408 ) (5,112 ) Disposal of treasury stock 18 63 Loss on disposal of treasury stock (7 ) Retirement of treasury stock (5,732 ) 5,732 Net change in unrealized gain on available-for-sale
securities 127 Net change in foreign currency translation adjustments 23 BALANCE, MARCH 31, 2006 36,536 ¥ 16,826 ¥ 15,481 ¥ 16,228 ¥ (944 ) ¥ 286 ¥ (11 ) ¥ (1,198 )
Thousands of U.S. Dollars (Note 1)
CommonStock
Capital Surplus
Retained Earnings
LandRevaluationDifference
UnrealizedGain on
Available-for-saleSecurities
ForeignCurrency
Translation Adjustments
Treasury Stock
at Cost
BALANCE, MARCH 31, 2005 $ 143,811 $ 132,313 $ 167,613 $ (8,072) $ 1,371 $ (294 ) $ (16,076 ) Net income 45,318 Cash dividends, $0.65 per share (24,305 ) Bonuses to directors (876 ) Purchase of treasury stock (43,692 )
Consolidated Statements of Shareholders' Equity MEITEC CORPORATION and Subsidiaries Years Ended March 31, 2006 and 2005
Disposal of treasury stock 543 Loss on disposal of treasury stock (66 ) Retirement of treasury stock (48,987 ) 48,988 Net change in unrealized gain on available-for-sale securities 1,082 Net change in foreign currency translation adjustments 202 BALANCE, MARCH 31, 2006 $ 143,811 $ 132,313 $ 138,697 $ (8,072) $ 2,453 $ (92 ) $ (10,237 )
See notes to consolidated financial statements.
17

Consolidated Statements of Cash Flows MEITEC CORPORATION and Subsidiaries Years Ended March 31, 2006 and 2005
Millions of Yen
Thousands of U.S. Dollars
(Note 1) 2006 2005 2006
OPERATING ACTIVITIES: Income before income taxes and minority interests ¥ 10,866 ¥ 9,901 $ 92,873 Adjustments for: Income taxes—paid (4,284) (7,333) (36,619) Depreciation and amortization 1,193 1,139 10,194 Gain on sales of marketable and investment securities—net (56) (12) (477) Gain on sales of investment in a subsidiary (106) Equity in losses of associated companies 15 114 130 Loss on sales and disposal of property and equipment—net 166 751 1,416 Loss on write-down of investment securities 1,128 16 9,641 Loss on impairment of goodwill 887 1,264 7,577 Changes in assets and liabilities: (Increase) decrease in trade receivables 193 (642) 1,648 Increase in accrued expenses 1 304 12 Decrease in consumption taxes payable (87) (287) (740) Increase in liability for retirement benefits 728 682 6,220 Other—net (1,356) (574) (11,585) Total adjustments (1,472) (4,684) (12,583)
Net cash provided by operating activities 9,394 5,217 80,290
INVESTING ACTIVITIES:
Purchases of short-term investments (1,601) (1,352) (13,683) Proceeds from sales of short-term investments 829 1,600 7,083 Purchases of investment in subsidiaries (Note 16) (39) (337) Proceeds from sales of investment securities 184 123 1,574 Proceeds from sales of investment in a subsidiary 80 Purchases of property and equipment (247) (304) (2,114) Proceeds from sales of property and equipment 3 1,099 28 Purchases of other investments and assets (409) (639) (3,490) Proceeds from sales of other investment and assets 402 391 3,439
Net cash (used in) provided by investing activities (878) 998 (7,500)
FINANCING ACTIVITIES:
Decrease in short-term bank loans—net (20) (171) Repayments of long-term debt (215) (1,835) Acquisition of treasury stock (5,112) (2,318) (43,692) Dividends paid (2,843) (2,807) (24,299) Proceeds from sales of treasury stock 56 255 477 Other—net (339)
Net cash used in financing activities (8,134) (5,209) (69,520)
¥ 382 ¥ 1,006 $ 3,270
FOREIGN CURRENCY TRANSLATION ADJUSTMENTS ON CASH AND CASH EQUIVALENTS 32 (17) 271 NET INCREASE IN CASH AND CASH EQUIVALENTS 414 989 3,541 CASH AND CASH EQUIVALENTS OF NEWLY CONSOLIDATED SUBSIDIARY 4,646 CASH AND CASH EQUIVALENTS, BEGINNING OF YEAR 16,861 11,226 144,112 CASH AND CASH EQUIVALENTS, END OF YEAR ¥ 17,275 ¥ 16,861 $ 147,653
See notes to consolidated financial statements.
18

Notes to Consolidated Financial Statements MEITEC CORPORATION and Subsidiaries Years Ended March 31, 2006 and 2005
1. BASIS OF PRESENTING CONSOLIDATED FINANCIAL STATEMENTS
The accompanying consolidated financial statements have been prepared in accordance with the provisions set forth in the Japanese Securities and Exchange Law and its related accounting regulations, and in conformity with accounting principles generally accepted in Japan, which are different in certain respects as to application and disclosure requirements of International Financial Reporting Standards.
In preparing these consolidated financial statements, certain reclassifications and rearrangements have been made to the consolidated financial statements issued domestically in order to present them in a form that is more familiar to readers outside Japan. In addition, certain reclassifications have been made in the 2005 consolidated financial statements to conform to the classifications used in 2006.
The consolidated financial statements are stated in Japanese yen, the currency of the country in which MEITEC CORPORATION (the "Company") is incorporated and operates. The translations of Japanese yen amounts into U.S. dollar amounts are included solely for the convenience of readers outside Japan and have been made at the rate of ¥117 to $1, the approximate rate of exchange at March 31, 2006. Such translations should not be construed as representations that the Japanese yen amounts could be converted into U.S. dollars at that or any other rate.
2. SUMMARY OF SIGNIFICANT ACCOUNTING POLICIES
a. Consolidation—The consolidated financial statements as of March 31, 2006 include the accounts of the Company and its fourteen (thirteen in 2005) subsidiaries (together, the "Group").
A new subsidiary was included in the scope of consolidation as of September 30, 2005 as a result of the acquisition of 51% interest in the issued shares with voting rights of APOLLO GIKEN CO., LTD. This company also has a foreign subsidiary on September 30, 2005.
Also a new joint venture company in China, Meitec Guangzhou Technocenter Co. Ltd., with 94.9% interest in the issued shares established in December 2005.
Under the control or influence concept, those companies in which the Company, directly or indirectly, is able to exercise control over operations are fully consolidated, and those companies over which the Group has the ability to exercise significant influence are accounted for by the equity method.
One associated (one in 2005) company was accounted for by the equity method.
The excess of the cost of the Company's investments in subsidiaries and associated companies accounted for by the equity method over its equity in the net assets at the respective dates of acquisition is being amortized by using the straight-line method over a period of 20 years.
All significant intercompany balances and transactions have been eliminated in consolidation. All material unrealized profit included in assets resulting from transactions within the Group is eliminated.
b. Cash Equivalents—Cash equivalents are short-term investments that are readily convertible into cash and that are exposed to insignificant risk of changes in value. Cash equivalents include time deposits, all of which mature or become due within three months from the date of acquisition.
c. Inventories—Inventories are stated at cost determined by the specific identification method.
Inventories of certain consolidated foreign subsidiaries are stated at the lower of cost, determined by the moving-average method, or market.
d. Marketable and Investment Securities—Marketable and investment securities are classified and accounted for, depending on management's intent, as follows: (1) held-to-maturity debt securities, which are expected to be held to maturity with the positive intent and ability to hold to maturity are reported at amortized cost and (2) available-for-sale securities, which include debt securities not classified as
19

held-to-maturity, are reported at fair value, with unrealized gains and losses, net of applicable taxes, reported in a separate component of shareholders' equity.
Non-marketable available-for-sale securities are stated at cost determined by the moving-average method.
For other than temporary declines in fair value, investment securities are reduced to net realizable value by a charge to income.
e. Property and Equipment—Property and equipment are stated at cost. Depreciation is principally computed by the declining-balance method at rates based on the estimated useful lives of the assets, while the straight-line method is applied to certain buildings. The range of useful lives is principally from 7 to 50 years for buildings and structures, and from 3 to 15 years for furniture and fixtures.
f. Long-lived Assets—The Group reviews its long-lived assets for impairment whenever events or changes in circumstance indicate the carrying amount of an asset or asset group may not be recoverable. An impairment loss would be recognized if the carrying amount of an asset or asset group exceeds the sum of the undiscounted future cash flows expected to result from the continued use and eventual disposition of the asset or asset group. The impairment loss would be measured as the amount by which the carrying amount of the asset exceeds its recoverable amount, which is the higher of the discounted cash flows from the continued use and eventual disposition of the asset or the net selling price at disposition.
g. Land Revaluation—Under the "Law of Land Revaluation," the Company elected a one-time revaluation of its own-use land to a value based on real estate appraisal information as of March 31, 2000. The resulting land revaluation difference represents an unrealized devaluation of land and is stated, net of income taxes, as a component of shareholders' equity. There was no effect on the statement of income. Continuous readjustment is not permitted unless the land value subsequently declines significantly such that the amount of the decline in value should be removed from the land revaluation difference account.
At March 31, 2006, the carrying amount of the land after the one-time revaluation exceeded the market value by ¥1,542 million ($13,185 thousand).
h. Goodwill—Certain consolidated foreign subsidiaries adopted Statement of Financial Accounting Standards No. 142, "Goodwill and Other Intangible Assets" with respect to goodwill recognized by its U.S. subsidiaries. Under the standard, goodwill is required to be tested for impairment at least annually.
i. Allowance for Loss on Foreign Operations—Allowance for loss on foreign operations is stated in amounts considered to be appropriate based on an evaluation of potential losses arising from foreign operations in certain subsidiaries.
j. Retirement and Pension Plans—The Company and certain subsidiaries have unfunded retirement benefit plans. The Company also has a contributory funded pension plan covering substantially all of its employees.
The liability for retirement benefits is accounted for based on the projected benefit obligations and plan assets at the balance sheet date.
Retirement benefits for directors and corporate auditors are provided in a certain domestic subsidiary at the amount which would be required if all directors and corporate auditors retired at the balance sheet date. The subsidiary terminated its retirement benefits plan for directors and corporate auditors in accordance with a resolution adopted at its shareholders meeting in 2005. The benefits granted prior to the terminated date are included in other current liabilities.
k. Leases—All leases are accounted for as operating leases. Under Japanese accounting standards for leases, finance leases that deem to transfer ownership of the leased property to the lessee are to be capitalized, while other finance leases are permitted to be accounted for as operating lease transactions if certain "as if capitalized" information is disclosed in the notes to the lessee's financial statements.
l. Income Taxes—The provision for current income taxes is computed based on the pretax income included in the consolidated statements of income. The asset and liability approach is used to recognize deferred tax assets and liabilities for the expected future tax consequences of temporary differences between the carrying amounts and the tax basis of assets and liabilities. Deferred taxes are measured by applying currently enacted tax laws to the temporary differences.
20

m. Appropriations of Retained Earnings—Appropriations of retained earnings are reflected in the financial statements for the following year upon shareholders' approval.
n. Foreign Currency Transactions—All short-term and long-term monetary receivables and payables denominated in foreign currencies are translated into Japanese yen at the current exchange rates at the balance sheet date. The foreign exchange gains and losses from translation are recognized in the consolidated statements of income to the extent that they are not hedged by forward exchange contracts.
o. Foreign Currency Financial Statements—The balance sheet accounts of the consolidated foreign subsidiary are translated into Japanese yen at the current exchange rate as of the balance sheet date except for shareholders' equity, which is translated at the historical rate. Differences arising from such translation were shown as "Foreign currency translation adjustments" in a separate component of shareholders' equity. Revenue and expense accounts of consolidated foreign subsidiaries are translated into yen at the average exchange rate.
p. Derivatives and Hedging Activities—A certain subsidiary uses derivative financial instruments to manage its exposures to fluctuations in foreign exchange rates. Currency swaps are utilized by the subsidiary to reduce foreign currency exchange rate risks. The subsidiary does not enter into derivatives for trading or speculative purposes.
Derivative financial instruments and foreign currency transactions are classified and accounted for as follows: (1) all derivatives are recognized as either assets or liabilities and measured at fair value, and gains or losses on derivative transactions are recognized in the income statement and (2) for derivatives used for hedging purposes, if derivatives qualify for hedge accounting because of high correlation and effectiveness between the hedging instruments and the hedged items, gains or losses on derivatives are deferred until maturity of the hedged transactions.
q. Per Share Information—Basic net income per share is computed by dividing net income available to common shareholders by the weighted-average number of common shares outstanding for the period, retroactively adjusted for stock splits.
Diluted net income per share reflects the potential dilution that could occur if securities were exercised or converted into common stock. Diluted net income per share of common stock assumes full conversion of the outstanding convertible bonds at the beginning of the year (or at the time of issuance, if later) with an applicable adjustment for related interest expense, net of tax, and full exercise of outstanding warrants.
Cash dividends per share presented in the accompanying consolidated statements of income are dividends applicable to the respective periods including dividends to be paid after the end of the period.
r. New Accounting Pronouncements
Business combination and business separation
In October 2003, the Business Accounting Council (BAC) issued a Statement of Opinion, "Accounting for Business Combinations," and on December 27, 2005 the Accounting Standards Board of Japan ("ASBJ") issued "Accounting Standard for Business Separations" and ASBJ Guidance No. 10, "Guidance for Accounting Standard for Business Combinations and Business Separations." These new accounting pronouncements are effective for fiscal years beginning on or after April 1, 2006.
The accounting standard for business combinations allows companies to apply the pooling of interests method of accounting only when certain specific criteria are met such that the business combination is essentially regarded as a uniting-of-interests. These specific criteria are as follows: (1) the consideration for the business combination consists solely of common shares with voting rights, (2) the ratio of voting rights of each predecessor shareholder group after the business combination is nearly equal, and (3) there are no other factors that would indicate any control exerted by any shareholder group other than voting rights.
For business combinations that do not meet the uniting-of-interests criteria, the business combination is considered to be an acquisition and the purchase method of accounting is required. This standard also prescribes the accounting for combinations of entities under common control and for joint ventures. Goodwill, including negative goodwill, is to be systematically amortized over 20 years or less, but is also subject to an impairment test.
21

Under the accounting standard for business separations, in a business separation where the interests of the investor no longer continue and the investment is settled, the difference between the fair value of the consideration received for the transferred business and the book value of net assets transferred to the separated business is recognized as a gain or loss on business separation in the statement of income. In a business separation where the interests of the investor continue and the investment is not settled, no such gain or loss on business separation is recognized.
Stock options
On December 27, 2005, the ASBJ issued "Accounting Standard for Stock Options" and related guidance. The new standard and guidance are applicable to stock options newly granted on and after May 1, 2006.
This standard requires companies to recognize compensation expense for employee stock options based on the fair value at the date of grant and over the vesting period as consideration for receiving goods or services. The standard also requires companies to account for stock options granted to non-employees based on the fair value of either the stock option or the goods or services received. In the balance sheet, the stock option is presented as a stock acquisition right as a separate component of shareholders' equity until exercised. The standard covers equity-settled, share-based payment transactions, but does not cover cash-settled, share-based payment transactions. In addition, the standard allows unlisted companies to measure options at their intrinsic value if they cannot reliably estimate fair value.
Bonuses to directors and corporate auditors
Prior to the fiscal year ended March 31, 2005, bonuses to directors and corporate auditors were accounted for as a reduction of retained earnings in the fiscal year following approval at the general shareholders meeting. The ASBJ issued ASBJ Practical Issues Task Force (PITF) No. 13, "Accounting treatment for bonuses to directors and corporate auditors," which encouraged companies to record bonuses to directors and corporate auditors on the accrual basis with a related charge to income, but still permitted the direct reduction of such bonuses from retained earnings after approval of the appropriation of retained earnings.
The ASBJ replaced the above accounting pronouncement by issuing a new accounting standard for bonuses to directors and corporate auditors on November 29, 2005. Under the new accounting standard, bonuses to directors and corporate auditors must be expensed and are no longer allowed to be directly charged to retained earnings. This accounting standard is effective for fiscal years ending on or after May 1, 2006. The companies must accrue bonuses to directors and corporate auditors at the year end to which such bonuses are attributable.
22

3. SHORT-TERM INVESTMENTS AND INVESTMENT SECURITIES
Short-term investments and investment securities at March 31, 2006 and 2005 were as follows:
Millions of Yen Thousands of U.S. Dollars
2006 2005 2006
Short-term investments: Time deposits ¥ 2,200 ¥ 1,600 $ 18,803 Other 1,931 1,841 16,503 Total ¥ 4,131 ¥ 3,441 $ 35,306
Millions of Yen Thousands of U.S. Dollars
2006 2005 2006
Investment securities: Equity securities ¥ 1,036 ¥ 1,946 $ 8,858 Debt securities 196 199 1,670 Other 382 467 3,265 Total ¥ 1,614 ¥ 2,612 $ 13,793
Information regarding each category of securities classified as available-for-sale at March 31, 2006 and 2005 was as follows:
March 31, 2006
Millions of Yen
Cost Unrealized
GainsUnrealized
LossesFair
Value
Available-for-sale: Equity securities ¥ 453 ¥ 516 ¥ 969 Debt securities 199 ¥ (3) 196
Thousands of U.S. Dollars
Cost Unrealized
GainsUnrealized
LossesFair
Value
Available-for-sale: Equity securities $ 3,876 $ 4,414 $ (1) $ 8,289 Debt securities 1,701 (31) 1,670
March 31, 2005
Millions of Yen
Cost Unrealized
GainsUnrealized
LossesFair
Value
Available-for-sale: Equity securities ¥ 466 ¥ 273 ¥ (2) ¥ 737 Debt securities 199 199 Other 1,849 4 (12) 1,841
23

Available-for-sale securities whose fair value is not readily determinable at March 31, 2006 and 2005 were as follows:
Carrying Amount
Millions of Yen Thousands of U.S. Dollars
2006 2005 2006
Equity securities ¥ 67 ¥ 1,209 $ 569 Other 382 466 3,265 Total ¥ 449 ¥ 1,675 $ 3,834
Proceeds from sales of available-for-sale securities for the years ended March 31, 2006 and 2005 were ¥184 million ($1,574 thousand) and ¥523 million, respectively. Gross realized gains and losses on these sales, were ¥56 million ($477 thousand) and nil, respectively, for the year ended March 31, 2006 and ¥12 million and nil, respectively, for the year ended March 31, 2005.
Contractual maturities for securities classified as available-for-sale at March 31, 2006 and 2005 were as follows:
Millions of Yen 2006 2005 Available-for-sale Available-for-sale
Due after one year through five years ¥ 1,100 ¥ 1,200 Due after five years through ten years 300 200 Total ¥ 1,400 ¥ 1,400
Thousands of U.S. Dollars
2006 Available-for-sale
Due after one year through five years $ 9,402 Due after five years through ten years 2,564 Total $ 11,966
4. INVENTORIES
Inventories at March 31, 2006 and 2005 consisted mainly of work in process related to outplacement and engineering outsourcing.
5. LONG-TERM DEBT
At March 31, 2006 and 2005, the Company had loan commitments from six banks and seven banks, respectively, and two insurance companies in an aggregate amount of ¥6,000 million ($51,282 thousand). There were no loans utilized and outstanding under these arrangements at March 31, 2006 and 2005.
6. RETIREMENT AND PENSION PLAN
The Group has severance payment plans for employees, which include a contributory funded defined benefit pension plan for the Company.
Under most circumstances, employees terminating their employment are entitled to retirement benefits determined based on the rate of pay at the time of termination, years of service and certain other factors. Employees are entitled to larger payments if the termination is involuntary, by retirement at the mandatory retirement age, by death, or by voluntary retirement at certain specific ages prior to the mandatory retirement age.
24

The liability for employees' retirement benefits at March 31, 2006 and 2005 consisted of the following:
Millions of Yen Thousands of U.S. Dollars
2006 2005 2006
Projected benefit obligation ¥ 12,112 ¥ 11,004 $ 103,518 Fair value of plan assets (4,376) (4,018) (37,401) Unrecognized actuarial loss (2,326) (2,412) (19,877) Unrecognized prior service cost 20 23 170 Liability for retirement benefits ¥ 5,430 ¥ 4,597 $ 46,410
The components of net periodic retirement benefit costs for the years ended March 31, 2006 and 2005 were as follows:
Millions of Yen Thousands of U.S. Dollars
2006 2005 2006
Service cost ¥ 920 ¥ 884 $ 7,861 Interest cost 219 200 1,877 Expected return on plan assets (60) (56) (515) Recognized actuarial loss 395 364 3,375 Amortization of prior service cost (3) (3) (28) Other 121 73 1,034 Net periodic retirement benefit costs ¥ 1,592 ¥ 1,462 $ 13,604
Assumptions used for the years ended March 31, 2006 and 2005 were set forth as follows:
2006 2005
Discount rate 2.0% 2.0% Expected rate of return on plan assets 1.5% 1.5% Amortization period of prior service cost 10 years 10 years Recognition period of actuarial gain/loss 10 years 10 years
7. SHAREHOLDERS' EQUITY
Through May 1, 2006, Japanese companies are subject to the Commercial Code of Japan (the "Code").
The Code requires that all shares of common stock be issued with no par value and at least 50% of the issue price of new shares is required to be recorded as common stock and the remaining net proceeds are required to be presented as additional paid-in capital, which is included in capital surplus. The Code permits Japanese companies, upon approval of the Board of Directors, to issue shares to existing shareholders without consideration by way of a stock split. Such issuance of shares generally does not give rise to changes within the shareholders' accounts.
The Code also provides that an amount of 10% or more of the aggregate amount of cash dividends and certain other appropriations of retained earnings associated with cash outlays applicable to each period (such as bonuses to directors) shall be appropriated as a legal reserve (a component of retained earnings) until the total of such reserve and additional paid-in capital equals 25% of common stock. The amount of total legal reserve and additional paid-in capital that exceeds 25% of the common stock may be available for dividends by resolution of the shareholders after transferring such excess in accordance with the Code. In addition, the Code permits the transfer of a portion of additional paid-in capital and legal reserve to the common stock by resolution of the Board of Directors.
The Code allows Japanese companies to purchase treasury stock and dispose of such treasury stock upon resolution of the Board of Directors. The aggregate purchased amount of treasury stock cannot exceed the amount available for future dividends plus the amount of common stock, additional paid-in capital or legal
25

reserve that could be transferred to retained earnings or other capital surplus other than additional paid-in capital upon approval of such transfer at the annual general meeting of shareholders.
In addition to the provision that requires an appropriation for a legal reserve in connection with the cash payment, the Code imposes certain limitations on the amount of retained earnings available for dividends. The amount of retained earnings available for dividends under the Code was ¥10,447 million ($89,288 thousand) and ¥11,620 million as of March 31, 2006 and 2005, respectively, based on the amount recorded in the parent company's general books of account.
During the year ended March 31, 2006, the Company retired its treasury stock by decreasing retained earnings by ¥5,732 million ($48,987 thousand) and the number of shares authorized and issued by 1,562 thousand shares.
During the year ended March 31, 2005, the Company retired its treasury stock by decreasing retained earnings by ¥2,999 million and the number of shares authorized and issued by 775 thousand shares.
Dividends are approved by the shareholders at a meeting held subsequent to the end of the fiscal year to which the dividends are applicable. Semiannual interim dividends may also be paid upon resolution of the Board of Directors, subject to certain limitations imposed by the Code.
On May 1, 2006, a new corporate law (the "Corporate Law") became effective, which reformed and replaced the Code with various revisions that would, for the most part, be applicable to events or transactions which occur on or after May 1, 2006 and for the fiscal years ending on or after May 1, 2006. The significant changes in the Corporate Law that affect financial and accounting matters are summarized below:
a. Dividends
Under the Corporate Law, companies can pay dividends at any time during the fiscal year in addition to the year-end dividend upon resolution at the shareholders meeting. For companies that meet certain criteria such as: (1) having the Board of Directors, (2) having independent auditors, (3) having the Board of Corporate Auditors, and (4) the term of service of the directors is prescribed as one year rather than two years of normal term by its articles of incorporation, the Board of Directors may declare dividends (except for dividends in kind) if the company has prescribed so in its articles of incorporation.
The Corporate Law permits companies to distribute dividends-in-kind (non-cash assets) to shareholders subject to a certain limitation and additional requirements.
Semiannual interim dividends may also be paid once a year upon resolution by the Board of Directors if the articles of incorporation of the company so stipulate. Under the Code, certain limitations were imposed on the amount of capital surplus and retained earnings available for dividends. The Corporate Law also provides certain limitations on the amounts available for dividends or the purchase of treasury stock. The limitation is defined as the amount available for distribution to the shareholders, but the amount of net assets after dividends must be maintained at no less than ¥3 million.
b. Increases/Decreases and Transfer of Common Stock, Reserve and Surplus
The Corporate Law requires that an amount equal to 10% of dividends must be appropriated as a legal reserve (a component of retained earnings) or as additional paid-in capital (a component of capital surplus) depending on the equity account charged upon the payment of such dividends until the total of aggregate amount of legal reserve and additional paid-in capital equals 25% of the common stock. Under the Code, the aggregate amount of additional paid-in capital and legal reserve that exceeds 25% of the common stock may be made available for dividends by resolution of the shareholders. Under the Corporate Law, the total amount of additional paid-in capital and legal reserve may be reversed without limitation of such threshold. The Corporate Law also provides that common stock, legal reserve, additional paid-in capital, other capital surplus and retained earnings can be transferred among the accounts under certain conditions upon resolution of the shareholders.
c. Treasury Stock and Treasury Stock Acquisition Rights
The Corporate Law also provides for companies to purchase treasury stock and dispose of such treasury stock by resolution of the Board of Directors. The amount of treasury stock purchased cannot exceed the amount available for distribution to the shareholders which is determined by specific formula.
26
Under the Corporate Law, stock acquisition rights, which were previously presented as a liability, are now presented as a separate component of shareholders' equity.
The Corporate Law also provides that companies can purchase both treasury stock acquisition rights and treasury stock. Such treasury stock acquisition rights are presented as a separate component of shareholders' equity or deducted directly from stock acquisition rights.
On December 9, 2005, the ASBJ published a new accounting standard for presentation of shareholders' equity. Under this accounting standard, certain items which were previously presented as liabilities are now presented as components of shareholders' equity. Such items include stock acquisition rights, minority interest, and any deferred gain or loss on derivatives accounted for under hedge accounting. This standard is effective for fiscal years ending on or after May 1, 2006.
8. STOCK OPTION PLANS
Under certain stock option plans approved by the Company's shareholders, the Company has granted stock options to directors and key employees. Each option permits the holder to purchase one share of the Company's common stock at a specified exercise price, during a specified period. Information about the outstanding stock option plans is as follows:
Date of Approval Option Holder Total Number of Options Granted Exercise Period
ExercisePrice
June 26, 1998 Directors Key employees
77,500 44,000
From June 27, 2000 to June 26, 2008
¥ 5,530
June 29, 1999 Directors Key employees
72,500 46,000
From June 30, 2001 to June 29, 2009
3,997
June 29, 2000 Directors Key employees
70,000 71,000
From June 30, 2002 to June 29, 2010
4,280
June 26, 2001 Directors Key employees
60,000 79,000
From June 27, 2003 to June 26, 2011
4,280
June 25, 2002 Directors Key employees
129,000 From June 27, 2004
to June 26, 2012 3,066
June 24, 2003 Directors Key employees
128,000 From June 25, 2005
to June 24, 2013 4,166
June 24, 2004 Directors Key employees
111,000 From June 25, 2006
to June 24, 2008 4,370
The stock options outstanding at March 31, 2006 were less than the above granted numbers due to forfeiture of rights.
The balance of treasury stock recorded in shareholders' equity at March 31, 2006 and 2005 included treasury stock purchased for the purpose of reissuance in connection with the expected stock options exercised under the above plans.
The Company has granted stock options on seven occasions in the past as an incentive to improve performance. Beginning in fiscal year 2006 the Company decided to stop offering stock options as incentives and changed to a system of performance-linked bonuses for the following reasons. (1) A performance-linked bonus system is more effective in improving performance by directors and employees. (2) The proportion of dormant stock options, which is high, is not functioning effectively as an incentive system. (3) The new accounting procedure to report stock options as expenses from March 2007 is expected to have a direct influence on the Company's performance.
9. RESTRUCTURING OF U.S. SUBSIDIARIES
The Group is in process of restructuring Novations Group Inc. and its subsidiaries, U.S. subsidiaries of Drake Beam Morin-Japan, Inc., due to their non-performance business.
The Group recognized gain on liquidation of the discontinuing business of ¥327 million ($2,792 thousand) for the year ended March 31, 2006, because certain income resulting from the restructuring appeared to be clearly recognizable. Also the Group recognized impairment loss of ¥887 million ($7,577 thousand) on goodwill
27

which was recorded by the ongoing business divisions for the year ended March 31, 2006.
The Group recognized impairment loss of ¥875 million on goodwill which was recorded by the ongoing business divisions for the year ended March 31, 2005. The Group also recorded loss on liquidation of the discontinuing business of ¥771 million, for the year ended March 31, 2005.
10. INCOME TAXES
The Company and its domestic subsidiaries are subject to Japanese national and local income taxes which, in the aggregate, resulted in a normal effective statutory tax rate of approximately 40% for the years ended March 31, 2006 and 2005.
The tax effects of significant temporary differences which resulted in deferred tax assets and liabilities at March 31, 2006 and 2005 were as follows:
Millions of Yen Thousands of U.S. Dollars
2006 2005 2006
Deferred tax assets: Accrued bonuses ¥ 2,080 ¥ 2,128 $ 17,780 Accrued social security on accrued bonuses 231 228 1,979 Retirement benefits 2,174 1,776 18,578 Enterprise taxes payable 251 117 2,150 Impairment loss 49 49 415 Write-down of investment securities 518 67 4,425 Loss on revaluation of memberships 24 46 203 Write-down of goodwill 684 403 5,847 Loss on liquidation of foreign operations 276 Provision for loss on foreign operations 37 Other 768 408 6,570 Unrealized loss on available-for-sale securities 10 6 85 Valuation allowance (1,726) (873) (14,753) Total 5,063 4,668 43,279 Deferred tax liabilities: Unrealized gain on available-for-sale securities 218 126 1,867 Prepaid pension cost Other 14 Total 218 140 1,867 Net deferred tax assets ¥ 4,845 ¥ 4,528 $ 41,412
A reconciliation between the normal effective statutory tax rates and the actual effective tax rates reflected in the accompanying consolidated statements of income for the years ended March 31, 2006 and 2005 is as follows:
2006 2005
Normal effective statutory tax rate 40.0 % 40.0 % Expenses not deductible for income tax purposes 0.3 0.2 Revenues not recognized for income tax purposes (1.0) (0.3) Per capita tax 1.5 1.7 Valuation allowance 7.9 9.2 Amortization of consolidation goodwill 2.5 0.5 Equity in losses of associated companies 0.0 1.0 Other—net 0.1 0.0 Actual effective tax rate 51.3 % 52.3 %
28
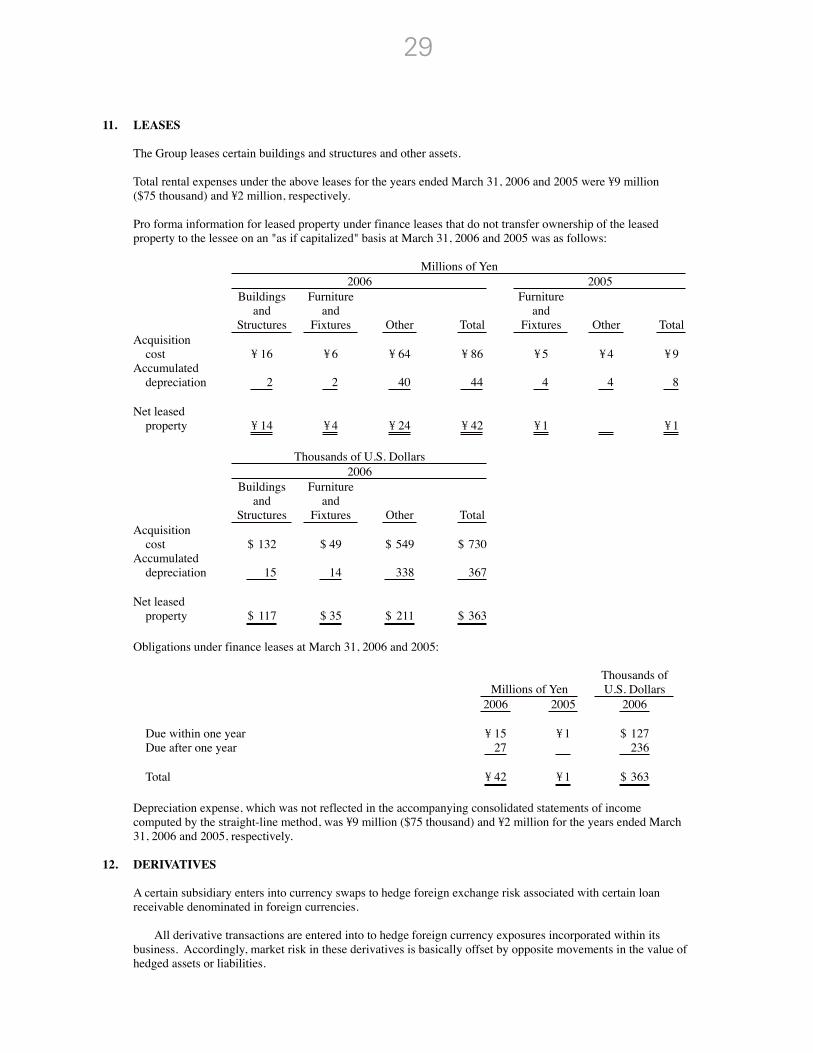
11. LEASES
The Group leases certain buildings and structures and other assets.
Total rental expenses under the above leases for the years ended March 31, 2006 and 2005 were ¥9 million ($75 thousand) and ¥2 million, respectively.
Pro forma information for leased property under finance leases that do not transfer ownership of the leased property to the lessee on an "as if capitalized" basis at March 31, 2006 and 2005 was as follows:
Millions of Yen 2006 2005
Buildings and
Structures
Furnitureand
Fixtures Other Total
Furniture and
Fixtures Other Total Acquisition cost ¥ 16 ¥ 6 ¥ 64 ¥ 86 ¥ 5 ¥ 4 ¥ 9 Accumulated depreciation 2 2 40 44 4 4 8 Net leased property ¥ 14 ¥ 4 ¥ 24 ¥ 42 ¥ 1 ¥ 1
Thousands of U.S. Dollars 2006
Buildings and
Structures
Furnitureand
Fixtures Other Total Acquisition cost $ 132 $ 49 $ 549 $ 730 Accumulated depreciation 15 14 338 367 Net leased property $ 117 $ 35 $ 211 $ 363
Obligations under finance leases at March 31, 2006 and 2005:
Millions of Yen Thousands of U.S. Dollars
2006 2005 2006
Due within one year ¥ 15 ¥ 1 $ 127 Due after one year 27 236 Total ¥ 42 ¥ 1 $ 363
Depreciation expense, which was not reflected in the accompanying consolidated statements of income computed by the straight-line method, was ¥9 million ($75 thousand) and ¥2 million for the years ended March 31, 2006 and 2005, respectively.
12. DERIVATIVES
A certain subsidiary enters into currency swaps to hedge foreign exchange risk associated with certain loan receivable denominated in foreign currencies.
All derivative transactions are entered into to hedge foreign currency exposures incorporated within its business. Accordingly, market risk in these derivatives is basically offset by opposite movements in the value of hedged assets or liabilities.
29

Because the counterparties to these derivatives are limited to major international financial institutions, the subsidiary does not anticipate any losses arising from credit risk.
Derivative transactions entered into by the subsidiary have been made in accordance with internal policies which regulate the authorization and credit limit amount.
The subsidiary had no derivative contract outstanding at March 31, 2006, but it had the following derivative contract outstanding at March 31, 2005:
Millions of Yen 2005
Contract Amount
FairValue
UnrealizedGain/Loss
Currency swap—Fixed rate receipt, floating rate payment ¥ 1,791 ¥ 207 ¥ 207
The currency swap which qualifies for hedge accounting for the year ended March 31, 2005 is excluded from the disclosure of market value information.
The contract which is shown in the above table does not represent the amounts exchanged by the parties and does not measure the subsidiary's exposure to credit or market risk.
13. NET INCOME PER SHARE
Reconciliation of the differences between basic and diluted net income per share ("EPS") for the years ended March 31, 2006 and 2005 is as follows:
Millions of Yen
Thousands of Shares Yen U.S. Dollars
Year Ended March 31, 2006 Net
IncomeWeighted-average
Shares EPS
Basic EPS—Net income available to common shareholders ¥ 5,184 37,313 ¥ 138.93 $ 1.19 Effect of dilutive securities— Warrants 5 Diluted EPS—Net income for computation ¥ 5,184 37,318 ¥ 138.91 $ 1.19
Year Ended March 31, 2005
Basic EPS—Net income available to common shareholders ¥ 4,605 36,374 ¥ 126.61 Effect of dilutive securities— Warrants 70 Diluted EPS—Net income for computation ¥ 4,605 36,444 ¥ 126.37
30

14. SUBSEQUENT EVENT
The following matter was approved at the Company's shareholders meeting held on June 22, 2006.
Appropriations of Retained Earnings
Millions of Yen Thousands of U.S. Dollars
Year-end cash dividends, ¥46.5 ($0.39) per share ¥ 1,699 $ 14,521 Bonuses to directors 106 906
15. SEGMENT INFORMATION
The Group operates in the following industries:
The outsourcing segment consists of engineering outsourcing and general outsourcing. The training segment offers a wide range of employee training courses to its corporate clients on a contract basis. The outplacement segment provides reemployment support to separated employees of its corporate clients on a contract basis.
Information about industry segments, geographical segments and sales to foreign customers of the Company and subsidiaries for the year ended March 31, 2006, is as follows:
a. Industry Segments
(1) Sales and Operating Income (Loss)
Millions of Yen 2006
Outsourcing Training Outplacement Eliminations/
Corporate Consolidated
Sales to customers ¥ 76,465 ¥ 4,217 ¥ 2,542 ¥ 83,224 Intersegment sales 16 32 ¥ (48 ) Total sales 76,481 4,217 2,574 (48 ) 83,224 Operating expenses 63,719 4,006 2,790 224 70,739 Operating income (loss) ¥ 12,762 ¥ 211 ¥ (216 ) ¥ (272 ) ¥ 12,485
(2) Total Assets, Depreciation and Capital Expenditures
Millions of Yen 2006
Outsourcing Training Outplacement Eliminations/
Corporate Consolidated
Total assets ¥ 71,759 ¥ 2,631 ¥ 9,247 ¥ (16,452 ) ¥ 67,185 Depreciation 1,029 61 103 1,193 Capital expenditures 372 53 13 438
31
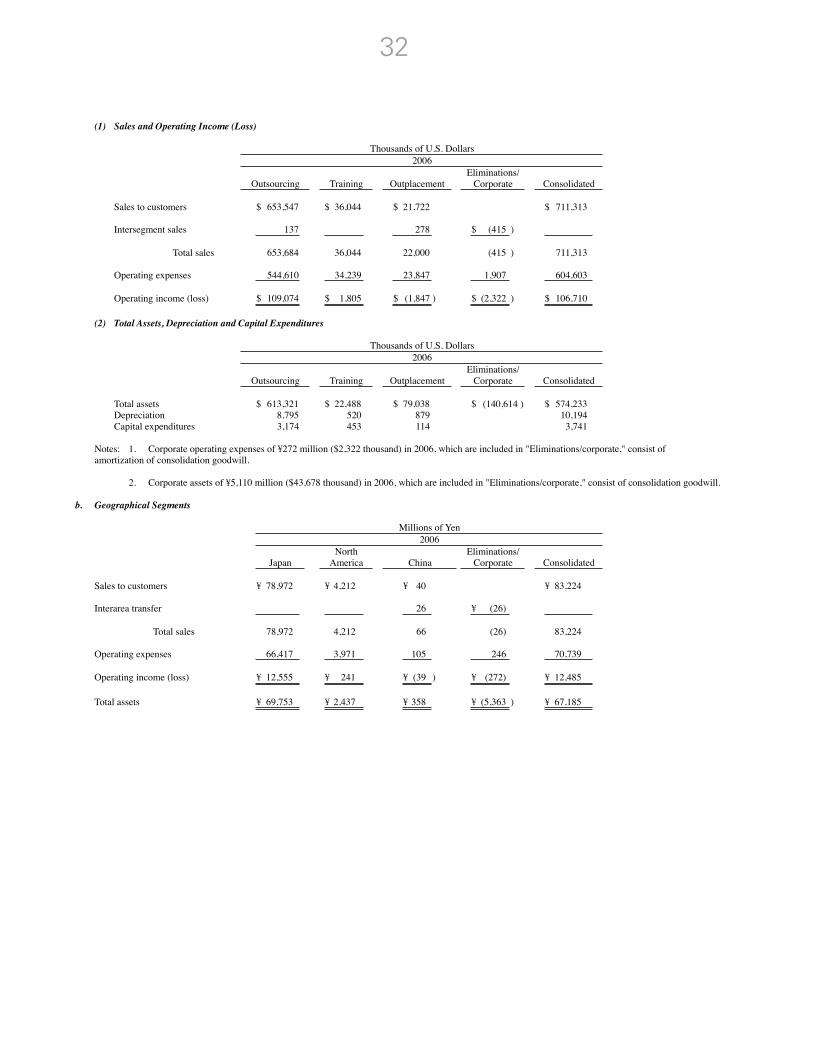
(1) Sales and Operating Income (Loss)
Thousands of U.S. Dollars 2006
Outsourcing Training Outplacement Eliminations/
Corporate Consolidated
Sales to customers $ 653,547 $ 36,044 $ 21,722 $ 711,313 Intersegment sales 137 278 $ (415 ) Total sales 653,684 36,044 22,000 (415 ) 711,313 Operating expenses 544,610 34,239 23,847 1,907 604,603 Operating income (loss) $ 109,074 $ 1,805 $ (1,847 ) $ (2,322 ) $ 106,710
(2) Total Assets, Depreciation and Capital Expenditures
Thousands of U.S. Dollars 2006
Outsourcing Training Outplacement Eliminations/
Corporate Consolidated
Total assets $ 613,321 $ 22,488 $ 79,038 $ (140,614 ) $ 574,233 Depreciation 8,795 520 879 10,194 Capital expenditures 3,174 453 114 3,741
Notes: 1. Corporate operating expenses of ¥272 million ($2,322 thousand) in 2006, which are included in "Eliminations/corporate," consist of amortization of consolidation goodwill.
2. Corporate assets of ¥5,110 million ($43,678 thousand) in 2006, which are included in "Eliminations/corporate," consist of consolidation goodwill.
b. Geographical Segments
Millions of Yen 2006
Japan North
America China Eliminations/
Corporate Consolidated
Sales to customers ¥ 78,972 ¥ 4,212 ¥ 40 ¥ 83,224 Interarea transfer 26 ¥ (26) Total sales 78,972 4,212 66 (26) 83,224 Operating expenses 66,417 3,971 105 246 70,739 Operating income (loss) ¥ 12,555 ¥ 241 ¥ (39 ) ¥ (272) ¥ 12,485 Total assets ¥ 69,753 ¥ 2,437 ¥ 358 ¥ (5,363 ) ¥ 67,185
32

Thousands of U.S. Dollars 2006
Japan North
America China Eliminations/
Corporate Consolidated
Sales to customers $ 674,971 $ 36,004 $ 338 $ 711,313 Interarea transfer 225 $ (225) Total sales 674,971 36,004 563 (225) 711,313 Operating expenses 567,672 33,940 894 2,097 604,603 Operating income (loss) $ 107,299 $ 2,064 $ (331) $ (2,322) $ 106,710 Total assets $ 596,179 $ 20,825 $ 3,061 $ (45,832) $ 574,233
Notes: 1. North America consists of the United States of America and Canada.
2. Corporate operating expenses of ¥272 million ($2,322 thousand) in 2006, which are included in "Eliminations/corporate," consist of amortization of consolidation goodwill.
3. Corporate assets of ¥5,110 million ($43,678 thousand) in 2006, which are included in "Eliminations/corporate," consist of consolidation goodwill.
c. Sales to Foreign Customers
Millions of Yen 2006
North America China Total
Sales to foreign customers ¥ 4,212 ¥66 ¥ 4,278 Consolidated sales 83,224 The ratio of sales to foreign customers 5.0% 0.1% 5.1%
Thousands of U.S. Dollars 2006
North America China Total
33

16. SUPPLEMENTAL CASH FLOW INFORMATION
On September 30, 2005, the Company acquired a share of APOLLO GIKEN CO., LTD., which became a newly consolidated subsidiary. At the time of consolidation, the assets and liabilities and net cash from the purchase of the consolidated subsidiary were as follows:
Millions of Yen Thousands of U.S. Dollars
Current assets ¥ 611 $ 5,223 Fixed assets 123 1,054 Consolidation goodwill 175 1,498 Current liabilities (236) (2,018) Long-term liabilities (219) (1,872) Minority interests (136) (1,169) Acquisition costs of newly consolidated subsidiaries 318 2,716 Cash and cash equivalents (279) (2,379) Purchases of investment in subsidiaries ¥ 39 $ 337
* * * * * *
34

Independent Auditors’ Report
To the Board of Directors of MEITEC CORPORATION:
We have audited the accompanying consolidated balance sheets of MEITEC CORPORATION and subsidiaries asof March 31, 2006 and 2005, and the related consolidated statements of income, shareholders' equity, and cashflows for the years then ended, all expressed in Japanese yen. These consolidated financial statements are theresponsibility of the Company's management. Our responsibility is to express an opinion on these consolidatedfinancial statements based on our audits.
We conducted our audits in accordance with auditing standards generally accepted in Japan. Those standards require that we plan and perform the audit to obtain reasonable assurance about whether the financial statementsare free of material misstatement. An audit includes examining, on a test basis, evidence supporting the amountsand disclosures in the financial statements. An audit also includes assessing the accounting principles used andsignificant estimates made by management, as well as evaluating the overall financial statement presentation. Webelieve that our audits provide a reasonable basis for our opinion.
In our opinion, the consolidated financial statements referred to above present fairly, in all material respects, theconsolidated financial position of MEITEC CORPORATION and subsidiaries as of March 31, 2006 and 2005, andthe consolidated results of their operations and their cash flows for the years then ended in conformity withaccounting principles generally accepted in Japan.
Our audits also comprehended the translation of Japanese yen amounts into U.S. dollar amounts and, in ouropinion, such translation has been made in conformity with the basis stated in Note 1. Such U.S. dollar amountsare presented solely for the convenience of readers outside Japan.
June 22, 2006
35

Millions of Yen Thousands of U.S. Dollars
ASSETS 2006 2005 2006
CURRENT ASSETS: Cash and cash equivalents ¥ 15,452 ¥ 12,165 $ 132,066 Short-term investments 4,131 3,441 35,306 Notes and accounts receivable: Trade notes and accounts 10,334 10,616 88,322 Subsidiaries 22 7 185 Allowance for doubtful accounts (2) (2) (18) Inventories 49 38 415 Deferred tax assets 2,208 2,098 18,876 Prepaid expenses and other 932 683 7,973 Total current assets 33,126 29,046 283,125 PROPERTY AND EQUIPMENT: Land 3,906 3,906 33,387 Buildings and structures 20,916 20,986 178,770 Machinery and equipment 184 184 1,575 Furniture and fixtures 2,655 3,255 22,694 Total 27,661 28,331 236,426 Accumulated depreciation (12,856) (12,748) (109,886) Net property and equipment 14,805 15,583 126,540 INVESTMENTS AND OTHER ASSETS: Investment securities 1,603 1,484 13,701 Investments in subsidiaries and associated companies 15,884 15,395 135,759 Leasehold deposits 803 788 6,859 Deferred tax assets 2,198 1,853 18,786 Deferred tax asset for land revaluation 630 630 5,381 Other 678 722 5,803 Total investments and other assets 21,796 20,872 186,289 TOTAL ¥ 69,727 ¥ 65,501 $ 595,954
The translations of Japanese yen amounts into U.S. dollar amounts have been made at the rate of ¥117 to $1, the approximate rate of exchange at March 31, 2006.
Supplemental Non-Consolidated Balance SheetsMarch 31, 2006 and 2005—Unaudited
36

Millions of Yen Thousands of U.S. Dollars
LIABILITIES AND SHAREHOLDERS' EQUITY 2006 2005 2006
CURRENT LIABILITIES: Income taxes payable ¥ 3,067 ¥ 1,559 $ 26,211 Deposits from subsidiaries 6,780 3,581 57,949 Accrued expenses 6,104 6,153 52,174 Other 1,171 1,323 10,011 Total current liabilities 17,122 12,616 146,345 LONG-TERM LIABILITIES—Liability for retirement benefits 5,342 4,575 45,657 Total long-term liabilities 5,342 4,575 45,657 SHAREHOLDERS' EQUITY: Common stock—authorized, 142,854 thousand shares in 2006 and 144,417 thousand shares in 2005; issued, 36,842 thousand shares in 2006 and 38,404 thousand shares in 2005 16,826 16,826 143,811 Capital surplus—additional paid-in capital 15,481 15,481 132,313 Retained earnings: Legal reserve 4,203 4,203 35,920 Unappropriated 12,589 14,445 107,597 Land revaluation difference (944) (944) (8,072) Unrealized gain on available-for-sale securities 306 180 2,620 Treasury stock—at cost, 306 thousand shares in 2006 and 478 thousand shares in 2005 (1,198) (1,881) (10,237) Total shareholders' equity 47,263 48,310 403,952
TOTAL ¥ 69,727 ¥ 65,501 $ 595,954
37

Millions of Yen Thousands ofU.S. Dollars
2006 2005 2006
NET SALES ¥ 61,426 ¥ 61,110 $ 525,008 COST OF SALES 42,381 42,088 362,229 Gross profit 19,045 19,022 162,779 SELLING, GENERAL AND ADMINISTRATIVE EXPENSES 7,913 7,803 67,636 Operating income 11,132 11,219 95,143 OTHER INCOME (EXPENSES): Interest and dividends 319 448 2,730 Interest expense (1) (1) (12) Gain on sales of marketable and investment securities—net 56 12 477 Gain on sales of investment in a subsidiary 280 Loss on sales and disposals of property and equipment—net (95) (531) (815) Loss on write-down of investment securities (16) Loss on write-down of investment in a subsidiary (19) (161) Other—net 135 29 1,156 Other income—net 395 221 3,375 INCOME BEFORE INCOME TAXES 11,527 11,440 98,518 INCOME TAXES: Current 5,247 4,186 44,841 Deferred (540) 400 (4,616) Total income taxes 4,707 4,586 40,225 NET INCOME ¥ 6,820 ¥ 6,854 $ 58,293
Yen U.S. Dollars PER SHARE OF COMMON STOCK: Basic net income ¥ 179.94 ¥ 185.84 $ 1.54 Diluted net income 179.92 185.48 1.54 Cash dividends applicable to the year 90.50 64.00 0.77
Notes: 1. The translations of Japanese yen amounts into U.S. dollar amounts have been made at the rate of ¥117 to $1, the approximate rate of exchange at March 31, 2006.
2. The computation of net income per share is based on the weighted-average number of shares of common stock outstanding during each year.
The weighted-average number of common shares used in the computation of basic net income was 37,313 thousand shares for 2006 and 36,374 thousand shares for 2005.
Supplemental Non-Consolidated Statements of IncomeYears Ended March 31, 2006 and 2005—Unaudited
38

MEITEC CORPORATION
Corporate Headquarters 8-5-26, Akasaka, Minato-ku, Tokyo 107-0052, Japan Tel: +81-3-5413-2600
Registered Corporate Headquarters 2-20-1, Kokusai Dori, Nishi-ku, Nagoya, Aichi 451-0075, Japan Tel: +81-52-532-1811
Establishment July 17, 1974
Common Stock Authorized: 142,854,400 shares Issued: 36,841,855 shares
Shareholders 9,084
Employees (consolidated) 8,036
Lines of Business Providing engineering services to major Japanese manufacturing companies in the fi elds of high-technology research and development
Consolidated Subsidiaries Outsourcing Business MEITEC FIELDERS INC. Meitec Global Solutions Inc. Three D Tec Inc. Information Management System Co., Ltd. Apollo Giken Co., Ltd. Meitec Shanghai Shanghai Apomac Science & Technology Japan Cast Inc. Meitec Experts Corporation
Training Business Novations Group Inc. (Holding company: Novations Group, Inc.) Novations Group, Inc. (Delaware, U.S.A.) Novations Performance Solutions, Ltd. MEITEC Dalian TechnoCenter Co., Ltd. MEITEC Guangzhou TechnoCenter Co., Ltd. ZHEJIANG MI High Technology Co., Ltd.
Outplacement Business Drake Beam Morin-Japan, Inc.
Note: Novations Group Inc. (Holding company) is a holding company for Novations Group, Inc.(Delaware) and Novations Performance Solutions, Ltd.
Executive Offi cers, Directors President and Kosuke Nishimoto and Corporate Auditors Representative Director
(As of June 22, 2006) CEO & COO Kosuke Nishimoto
Executive Offi cers Akiyoshi Ogasawara Shigeo Kamezawa Hideyo Kokubun Kouji Shimomura Hidenori Nagasaka Kiyomasa Nakajima Hideharu Naganuma Satoshi Yanagisawa
Directors Kanji Fukuda Hideyo Kokubun Toshihiko Murayama Hiroshi Yoneda Atsuhiko Umeda1
Corporate Auditors Yoshinori Takamine Masatoshi Saito2
Hiroshi Watanabe2
Notes: 1. Outside director as provided for in Article 2, Paragraph 15, of the Corporation Law.
2. External auditors as provided for in Article 2, Paragraph 16, of the Corporation Law.
39

WEB SITE INFORMATION Meitec Corporation has developed an Internet Web site to disclose its most current corporate information, including materials on such key management indicators as monthly operating ratios, as well as financial reports, interim reports, quarterly reports and performance-adjustment announcements.
MAIN CONTENTS � Business Performance (monthly operating ratio of
Meitec and Meitec Fielders, and other information) � Stock Price � Financial Results and Announcements � Annual Report
Meitec offers a service that provides registered users of its mailing list with e-mail notifi cation when new in-formation is added to the Company's Web site.
Please see the URL below for details.
URL: http//www.meitec.co.jp/
Printed on recycled paperPRINTED IN JAPAN