Nghia Nguyen Do Trong, Anna Rizzolo, Els Herremans, Maristella · Nghia Nguyen Do Trong 1*, Anna...
33
Optical properties–microstructure–texture relationships of dried apple slices: Spatially resolved diffuse reflectance spectroscopy as a novel technique for analysis and process control Nghia Nguyen Do Trong, Anna Rizzolo, Els Herremans, Maristella Vanoli, Giovanna Cortellino, Chyngyz Erkinbaev, Mizuki Tsuta, Lorenzo Spinelli, Davide Contini, Alessandro Torricelli, Pieter Verboven, Josse De Baerdemaeker, Bart Nicola¨ ı, Wouter Saeys PII: S1466-8564(13)00152-5 DOI: doi: 10.1016/j.ifset.2013.09.014 Reference: INNFOO 1070 To appear in: Innovative Food Science and Emerging Technologies Received date: 21 July 2013 Accepted date: 27 September 2013 Please cite this article as: Trong, N.N.D., Rizzolo, A., Herremans, E., Vanoli, M., Cortellino, G., Erkinbaev, C., Tsuta, M., Spinelli, L., Contini, D., Torricelli, A., Verboven, P., De Baerdemaeker, J., Nicola¨ ı, B. & Saeys, W., Optical proper- ties–microstructure–texture relationships of dried apple slices: Spatially resolved diffuse reflectance spectroscopy as a novel technique for analysis and process control, Innovative Food Science and Emerging Technologies (2013), doi: 10.1016/j.ifset.2013.09.014 This is a PDF file of an unedited manuscript that has been accepted for publication. As a service to our customers we are providing this early version of the manuscript. The manuscript will undergo copyediting, typesetting, and review of the resulting proof before it is published in its final form. Please note that during the production process errors may be discovered which could affect the content, and all legal disclaimers that apply to the journal pertain.
Transcript of Nghia Nguyen Do Trong, Anna Rizzolo, Els Herremans, Maristella · Nghia Nguyen Do Trong 1*, Anna...

�������� ����� ��
Optical properties–microstructure–texture relationships of dried apple slices:Spatially resolved diffuse reflectance spectroscopy as a novel technique foranalysis and process control
Nghia Nguyen Do Trong, Anna Rizzolo, Els Herremans, MaristellaVanoli, Giovanna Cortellino, Chyngyz Erkinbaev, Mizuki Tsuta, LorenzoSpinelli, Davide Contini, Alessandro Torricelli, Pieter Verboven, Josse DeBaerdemaeker, Bart Nicolaı, Wouter Saeys
PII: S1466-8564(13)00152-5DOI: doi: 10.1016/j.ifset.2013.09.014Reference: INNFOO 1070
To appear in: Innovative Food Science and Emerging Technologies
Received date: 21 July 2013Accepted date: 27 September 2013
Please cite this article as: Trong, N.N.D., Rizzolo, A., Herremans, E., Vanoli,M., Cortellino, G., Erkinbaev, C., Tsuta, M., Spinelli, L., Contini, D., Torricelli,A., Verboven, P., De Baerdemaeker, J., Nicolaı, B. & Saeys, W., Optical proper-ties–microstructure–texture relationships of dried apple slices: Spatially resolved diffusereflectance spectroscopy as a novel technique for analysis and process control, InnovativeFood Science and Emerging Technologies (2013), doi: 10.1016/j.ifset.2013.09.014
This is a PDF file of an unedited manuscript that has been accepted for publication.As a service to our customers we are providing this early version of the manuscript.The manuscript will undergo copyediting, typesetting, and review of the resulting proofbefore it is published in its final form. Please note that during the production processerrors may be discovered which could affect the content, and all legal disclaimers thatapply to the journal pertain.
ACC
EPTE
D M
ANU
SCR
IPT
ACCEPTED MANUSCRIPT
1
Optical properties-microstructure-texture relationships of
dried apple slices: spatially resolved diffuse reflectance
spectroscopy as a novel technique for analysis and process
control
Nghia Nguyen Do Trong1*
, Anna Rizzolo2, Els Herremans
1, Maristella Vanoli
2,5, Giovanna
Cortellino2, Chyngyz Erkinbaev
1, Mizuki Tsuta
3, Lorenzo Spinelli
4, Davide Contini
5, Alessandro
Torricelli5, Pieter Verboven
1, Josse De Baerdemaeker
1, Bart Nicolaï
1, Wouter Saeys
1
1 BIOSYST-MeBioS, KU Leuven, Willem de Croylaan 42, 3001 Leuven, Belgium
2 Consiglio per la Ricerca e Sperimentazione in Agricoltura – Unità di ricerca per i processi
dell’industria agroalimentare (CRA-IAA), via Venezian 26, I 20133 I-Milan, Italy 3 National Food Research Institute, 2-1-12 Kan-nondai, Tsukuba, Ibaraki 305-8642, Japan
4 Istituto di Fotonica e Nanotecnologie, CNR, piazza Leonardo da Vinci 32, I 20133 Milan, Italy
5 Politecnico di Milano, Dipartimento di Fisica, piazza Leonardo da Vinci 32, I 20133 Milan, Italy
*Email: [email protected]; [email protected]
Abstract
The potential of spatially resolved diffuse reflectance spectroscopy in the 500-1000 nm range by
means of a fiber-optics probe was investigated for acquiring scattering and absorption properties of
air dried apple rings subjected to different pre-treatment conditions: without osmo-dehydration
(TQ) and with osmo-dehydration for 1 (OSMO1) and 3 hours (OSMO2). The fresh apple rings were
produced from ‘Golden Delicious’ apples at harvest (H) and 5 month storage at 2 conditions:
controlled atmosphere (CA) and normal atmosphere (NA). Microstructure properties of the dried
apple rings were also obtained from X-ray micro-CT measurements. The TQ samples were found to
have significantly higher scattering properties, thicker tissue, smaller pore sizes, were less crispy, and
required higher snapping work or rupture energy than the OSMO1 and OSMO2 samples. On the
other hand, no significant differences were observed between the scattering properties,
microstructure, and textural quality of the OSMO1 and OSMO2 apple rings. From these results, it
was concluded that there is a clear process-microstructure-quality relation in osmo-air-dried apples
which can be measured non-destructively with spatially resolved diffuse reflectance spectroscopy.

ACC
EPTE
D M
ANU
SCR
IPT
ACCEPTED MANUSCRIPT
2
Therefore, this study confirmed the potential of spatially resolved diffuse reflectance spectroscopy
for non-destructive quality assessment of air-dried apple slices, which provides perspectives for
drying process optimization.
Keywords: spatially resolved spectroscopy, diffuse reflectance, scattering, absorption, osmo-air-
dried apple, texture
1. Introduction
Dried fruit is an important category of processed foods on the market with a worldwide annual
production of 9.5×10⁹ kg in 2012, which is 13% higher than the production in 2011 (International Nut
and Dried Fruit Council, 2013). It has been demonstrated that food consumers demand that dried
food products are not only nutritious, but also texturally tasty and flavoursome (Szczesniak, 1971).
Therefore, textural quality, which can be related to the food microstructure, is one of the key
determining factors for food consumers’ quality perception (Szczesniak and Kahn, 1971; Szczesniak,
1972; Szczesniak, 2002). This texture-microstructure relation has, for example, been reported for
confectionary (Decker & Ziegler, 2003), gelled systems (Borwankar, 1992; Barrangou, Drake,
Daubert, & Foegeding, 2006), dried apples (Acevedo, Briones, Buera, & Aguilera, 2008), and aerated
sugar gels (Herremans et al., 2013). In these works, microstructural or sensory properties of the
studied food samples were clearly observed in good correlation with mechanical or rheological
parameters usually considered as representing parameters for food texture quality. Besides its
impact on the texture, food microstructure also has significant effects on the gas and heat transport
in the food matrix and its nutritional, chemical, and microbiological stability (Aguilera, 2005;
Mebatsion et al., 2008).
Several researchers have investigated the effects of processing conditions on the microstructure
of final food samples as observed by means of light or electron microscopy. Some example cases are
sweet potato patties (Walter & Hoover, 1984), smoked Atlantic salmons

ACC
EPTE
D M
ANU
SCR
IPT
ACCEPTED MANUSCRIPT
3
(Sigurgisladottir, Ingvarsdottir, Torrissen, Cardinal, & Hafsteinsson, 2000), high pressure processed
fresh carrots (Araya et al., 2007), and frozen strawberry tissues (Van Buggenhout, Grauwet, Van
Loey, & Hendrickx, 2008). Although the microscopy techniques are very valuable, they are
destructive and involve considerable sample preparation time, and complex and expensive
equipment. As a result, these techniques are mainly used for academic purposes, but rarely in a food
industrial environment (Aguilera, 2005). Therefore, the food industry is demanding a fast, non-
destructive, and sufficiently accurate method for on-line or in-line food microstructure assessment
which would allow optimizing the production processes to obtain a desired microstructure for the
final food products.
Optical measurement techniques have high potential here thanks to the fast and highly sensitive
interaction of the propagating photons with the microstructure and chemical composition of the
analysed samples. Inhomogeneities in the microstructure of the real food systems introduce spatial
inhomogeneities in the refractive index, which consequently change the trajectories of the
propagating photons being known as scattering phenomena. In addition to this, the intensity of the
light also decays as a result of absorption of the photons by the spectrally active food components.
This absorption is specific in the sense that photons will only be absorbed when their energy
matches with the energy needed to excite the molecular vibration state. Therefore, spectroscopic
measurements are usually performed at multiple wavelengths or over a certain wavelength range.
These two main phenomena, scattering and absorption, together determine the intensity of the
post-interacting or outgoing light. In a clear liquid the concentration can be directly estimated from
the intensity ratio of the outgoing and incoming light (transmittance) by Beer’s law. However, in the
case of turbid samples like food products this is not straightforward as transmittance measurements
are very challenging and the intensity decay depends both on the scattering and absorption
properties (Saeys, Velazco-Roa, Thennadil, Ramon, & Nicolaï, 2008).

ACC
EPTE
D M
ANU
SCR
IPT
ACCEPTED MANUSCRIPT
4
Conventional Vis/NIR spectroscopy has also been utilized for non-destructive assessments of food
quality attributes with some success in the last two decades thanks to the non-invasive interactions
between the Vis/NIR light and the food matrices (Nicolaï et al., 2007; Huang, Yu, Xu, & Ying, 2008).
Since food samples are usually turbid media in which the interactions between the propagating light
and food matrices are influenced by both scattering and absorption phenomena, multivariate
calibration models have been used to relate the measured spectroscopic data to the real food
quality attributes. Since these multivariate calibration models are generally based on Beer’s law the
effects of scattering phenomena on the post-interacting light should be reduced or minimized to
improve the performance of the constructed calibration models (Martens & Næs, 1991).
Consequently, conventional Vis/NIR spectroscopy usually discards scattering or microstructure
information and has limited success in evaluating the quality attributes relating to food
microstructure (Nicolaï et al., 2007). In this regard, novel or improved optical measurement
techniques are essentially required for food microstructure assessments.
As new approaches in biomedical research, multiple Vis/NIR spectroscopy measurements of the
post-interacting light at difference spatial locations (spatially or space-resolved) or at various
temporal incidents (time-resolved) have been extensively studied to separate the scattering and
absorption information of the measured samples. As these measurements are typically done at
multiple wavelengths, these methodologies are known as spatially-resolved reflectance
spectroscopy (SRS) and time-resolved reflectance spectroscopy (TRS). Both techniques have been
elaborated and identified as promising techniques in biomedical research for detection of
abnormalities in human tissues related to changes in the microstructure and/or chemical
composition (Tuchin, 2007; Tuchin, 2008).
In the domain of food and agricultural products, TRS has been investigated for non-destructive
evaluation of microstructural information or microstructure-relating quality attributes of fruit such
as apples, pears, and nectarines (Cubeddu et al., 2001; Zerbini et al., 2002; Zerbini et al., 2006;

ACC
EPTE
D M
ANU
SCR
IPT
ACCEPTED MANUSCRIPT
5
Nicolaï et al., 2008; Rizzolo et al., 2009). However, the high complexity and cost of the current TRS
equipment hampers its uptake by the food industry. With SRS, measurements based on one moving
optical fiber, multi-fiber probes, a hyperspectral camera or even a camera imaging at a single
wavelength have been explored to assess microstructure-related attributes of meat, fruit and
vegetables (Tu, Jancsók, Nicolaï, & De Baerdemaeker, 2000; Qin & Lu, 2008; Xia, Weaver, Gerrard, &
Yao, 2008; Qin, Lu, & Peng, 2009; Romano, Argyropoulos, Nagle, Khan, & Müller, 2012; Itoh, De
Baerdemaeker, Nguyen Do Trong, Wang, & Saeys, 2013; Nguyen Do Trong et al., 2013). However, in
these researches the effect of processing conditions on the final microstructure of the samples was
not taken into account.
Recently, Herremans et al. (2013) demonstrated the potential of SRS for monitoring the effect of
processing conditions on the microstructure, and related texture properties, of sugar foams. These
promising results suggest that SRS could also be a useful technique for monitoring microstructure
changes in more complex food matrices like fresh and dried fruit. Therefore, the potential of fiber-
probe SRS for detecting microstructure differences in dried apple rings caused by different
processing conditions has been investigated in this study.
2. Materials and methods
2.1. Dried apple ring samples
‘Golden Delicious’ apples
One hundred fifty six ‘Golden Delicious’ apples were harvested at commercial maturity from an
orchard in Laimburg (Bolzano province, Italy) and were transported to the laboratory in Milan, Italy.
These apples were then sorted in ascending maturity according to descending values of absorption
coefficient µa of chlorophyll at 670 nm measured by a TRS setup (Torricelli et al., 2008). The ranked
apples were randomly distributed into 9 groups. This random selection aimed at creating groups of
apples with almost the same distribution of maturity levels. Three groups, labelled as H groups, were
processed and analysed directly after harvest. Each of these groups was given one of the 3 pre-

ACC
EPTE
D M
ANU
SCR
IPT
ACCEPTED MANUSCRIPT
6
treatment conditions (without osmotic dehydration and with osmotic dehydration for 1 or 3 hours)
followed by air drying. Three other groups, noted as CA, were stored for 5 months in controlled
atmosphere (+1 oC, 2 kPa O2 + 0.7 kPa CO2). The remaining 3 groups, noted as NA, were also kept at
+1 oC under normal atmosphere for 5 months. After the storage period, the CA and NA groups were
taken out of the storage place, equilibrated their internal temperature and subjected to the same
pre-treatments (with and without osmotic dehydration) and air drying as the H groups. Before pre-
treatment, each apple fruit was cored and cut into a ring of 5 mm thickness for further use (pre-
treatment and drying).
Pre-treatments of the apple rings
Pre-treatment of the apple rings was carried out by osmo-dehydration at 3 levels: without osmo-
dehydration (noted as TQ), with osmo-dehydration (20 oC, atmospheric pressure) in sucrose solution
(60 % w/w) for 1 hour (noted as OSMO1) and 3 hours (noted as OSMO2). During osmo-dehydration,
the ring of each fruit was packed in a tulle bag and immersed in the sugar solution. The sucrose
solution was re-circulated at a flow rate of 1.5 L/min by a pump. The ratio fruit : solution was 1:3.
After osmo-dehydration, the apple rings were taken out of the sucrose solution, drained, rinsed
gently with water and covered by adsorbent paper for a few minutes to remove excess water. These
osmo-dehydrated rings (OSMO1 and OSMO2) and the rings without osmo-dehydration treatment
(TQ) were all subjected to air drying.
Air drying
The apple rings (OSMO1, OSMO2, and TQ) were dried by air flow (80 oC dry bulb, atmospheric
pressure, 1.5 m/s speed) in a pilot alternate upward-downward air circulated drier until constant
weight: when the difference in weight of the ring was less than 1 mg/g solids after 90 additional
minutes of drying.

ACC
EPTE
D M
ANU
SCR
IPT
ACCEPTED MANUSCRIPT
7
Eventually, 9 groups of osmo-air-dried apple rings were produced: at harvest (H-TQ, H-OSMO1,
H-OSMO2), CA storage (CA-TQ, CA-OSMO1, CA-OSMO2), and NA storage (NA-TQ, NA-OSMO1, NA-
OSMO2). The dried apple ring produced from each fresh apple after pre-treatment and air drying
was first kept at CRA-IAA, Milan, Italy for destructive quality assessment, and then it was carefully
packed in a plastic bag and sent to KU Leuven, Belgium for spatially resolved diffuse reflectance and
X-ray micro-CT measurements.
2.2. SRS Setup
2.2.1. Setup description
The setup for SRS measurements in the range 500-1000 nm used in this research is the same as
the one described by Nguyen Do Trong et al. (2013) and Herremans et al. (2013), and is
schematically illustrated in Figure 1. It basically consisted of a halogen light source, a fiber-optics
sensing probe integrating one illumination fiber and five detection fibers, a spectrograph, a camera,
and a computer with a data acquisition device. In brief, Vis/NIR light from an AvaLight-DHc halogen
lamp (Avantes, Eerbeek, The Netherlands) was delivered through an optical fiber to illuminate the
sample. Five detection fibers collected diffuse reflected light at different source-detector distances
ranging from 0.3 to 1.2 mm. All the fibers (Thorlabs, USA) having a core diameter of 200 µm were all
integrated inside a stainless steel sensing probe. The five detection fibers guided the diffuse
reflected light into a spectrograph (Horiba Jobin-Yvon, New Jersey, USA) which splitted the light
from each of these fibers into its spectral components and projected these onto a Hamamatsu
C7041 CCD camera (Hamamatsu, Louvain-La-Neuve, Belgium). Controlling of the SRS setup and data
acquisition were performed by a LabView program (LabView 8.5, National Instruments, Texas, USA)
developed in the lab.
Position of Figure 1

ACC
EPTE
D M
ANU
SCR
IPT
ACCEPTED MANUSCRIPT
8
2.2.2. Setup calibration and measurement
Wavelength calibration linked each pixel on the spectral dimension of the CCD camera to its
corresponding waveband and was described in detail by Herremans et al. (2013). The relative diffuse
reflectance spectra of the detection fibers from a measured sample were obtained as the ratios of
the dark-corrected intensities acquired for that sample to the dark-corrected intensities collected in
an integrating sphere (50 mm diameter, Avantes, Eerbeek, The Netherlands). Thanks to the highly
diffuse reflectance of the sphere (reflecting more than 98 % lights in the range 400-1000 nm) the
measured signals were compensated for dark noises, variations in the light source intensity,
differences in efficiencies of different pixels of the camera and differences in efficiencies of the
detection fibers.
2.2.3. Estimation of optical properties from SRS measurements
Thirty six optical liquid phantoms with known optical properties were prepared to calibrate the
SRS measurements and to validate the procedure for estimation of optical properties. These liquid
phantoms were aqueous mixtures of intralipid 20% (Fresenius Kabi, Sweden) serving as scatterers
and Indian ink (Chartpak Inc., USA) acting as absorber in the 500 – 1000 nm range. Optical properties
of these phantoms were determined as reported in Nguyen Do Trong et al. (2012) and covered a
wide range of optical properties for food and agricultural products (µa = 0.001 – 2.6 cm-1
; µs’ = 5.7 –
135.3 cm-1
). A metamodelling method (Couckuyt, Forrester, Gorissen, De Turck, & Dhaene, 2012)
was then developed to relate the measured SRS data of the phantoms to the corresponding
reference optical properties. In this approach, Stochastic Kriging was used to build a metamodel
relating the acquired SRS profiles for the liquid phantoms (output) to their reference optical
properties (input). Five calibration metamodels were constructed, one for each of the five detection
fibers.
Kriging is a popular technique to approximate deterministic noise-free data. It has been originally
conceived as a geostatistical estimator that estimates the value for an unobserved location, by using

ACC
EPTE
D M
ANU
SCR
IPT
ACCEPTED MANUSCRIPT
9
samples from different locations surrounding it (e.g. the elevation, z, of a landscape as a function of
the geographic location). Kriging is based on the idea that the value at an unknown point should be
the average of the known values at its neighbours – weighted by the neighbours’ distance to the
unknown point (Sacks, Welch, Mitchell, & Wynn, 1989). While the interpolation properties of the
Kriging methodology are advantageous for many deterministic simulation problems, it could
produce undesirable results when dealing with stochastic simulations. Stochastic Kriging (Staum,
2009) has, therefore, been suggested as an extension of Kriging for approximation instead of
interpolation for stochastic phenomena.
The metamodel construction was implemented in the ooDACE toolbox (Couckuyt, Forrester,
Gorissen, De Turck, & Dhaene, 2012) which is a versatile Matlab toolbox that implements Stochastic
Kriging. For each liquid phantom, SRS measurement had been repeated 9 times to provide
estimations of the measurement noise as a function of the optical properties. The toolbox used the
mean diffuse reflectance values of the detection fibers and the intrinsic covariance matrix,
representing the variance of the output values. Initially, a first set of Kriging models was constructed
using an initial set of candidate features. These candidates were then ranked using a Bayesian
variable selection method. In the next step, a new promising feature was incorporated into the
Kriging model, after which the new Kriging model was scored according to the leave-one-out-cross-
validation prediction error. This process was repeated until the accuracy of the Kriging model
stopped improving (Couckuyt, Forrester, Gorissen, De Turck, & Dhaene, 2012) and the final
metamodel was acquired.
To estimate optical properties of a new sample in inverse procedure, a Nelder-Mead optimization
algorithm was employed to iteratively estimate the optical properties of a sample by matching the
spatially resolved diffuse reflectance profiles simulated with the metamodel to the acquired ones. All
these calculations were performed in Matlab (version 7.10, The MathWorks Inc., Natick, USA).
ACC
EPTE
D M
ANU
SCR
IPT
ACCEPTED MANUSCRIPT
10
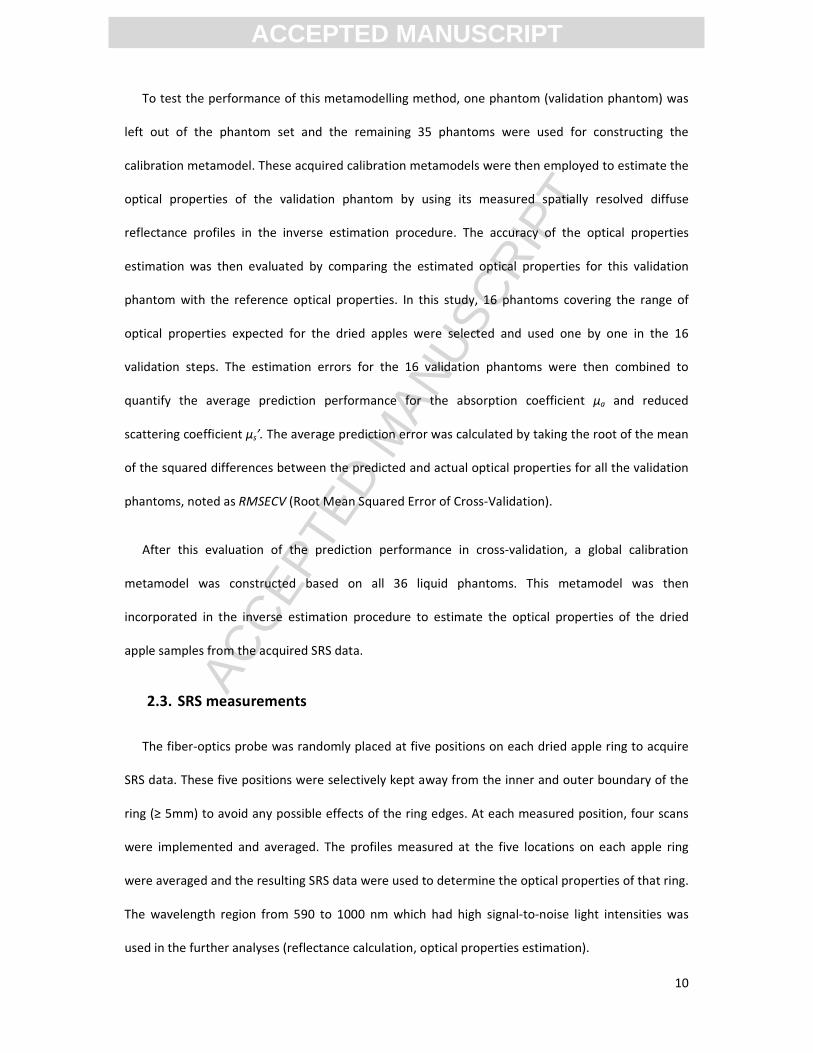
To test the performance of this metamodelling method, one phantom (validation phantom) was
left out of the phantom set and the remaining 35 phantoms were used for constructing the
calibration metamodel. These acquired calibration metamodels were then employed to estimate the
optical properties of the validation phantom by using its measured spatially resolved diffuse
reflectance profiles in the inverse estimation procedure. The accuracy of the optical properties
estimation was then evaluated by comparing the estimated optical properties for this validation
phantom with the reference optical properties. In this study, 16 phantoms covering the range of
optical properties expected for the dried apples were selected and used one by one in the 16
validation steps. The estimation errors for the 16 validation phantoms were then combined to
quantify the average prediction performance for the absorption coefficient µa and reduced
scattering coefficient µs’. The average prediction error was calculated by taking the root of the mean
of the squared differences between the predicted and actual optical properties for all the validation
phantoms, noted as RMSECV (Root Mean Squared Error of Cross-Validation).
After this evaluation of the prediction performance in cross-validation, a global calibration
metamodel was constructed based on all 36 liquid phantoms. This metamodel was then
incorporated in the inverse estimation procedure to estimate the optical properties of the dried
apple samples from the acquired SRS data.
2.3. SRS measurements
The fiber-optics probe was randomly placed at five positions on each dried apple ring to acquire
SRS data. These five positions were selectively kept away from the inner and outer boundary of the
ring (≥ 5mm) to avoid any possible effects of the ring edges. At each measured position, four scans
were implemented and averaged. The profiles measured at the five locations on each apple ring
were averaged and the resulting SRS data were used to determine the optical properties of that ring.
The wavelength region from 590 to 1000 nm which had high signal-to-noise light intensities was
used in the further analyses (reflectance calculation, optical properties estimation).

ACC
EPTE
D M
ANU
SCR
IPT
ACCEPTED MANUSCRIPT
11
2.4. Reference microstructure measurements
The microstructure of selected dried apple samples was imaged by means of X-ray micro-CT. The
most contrasting pre-treatments for drying within NA samples (NA-TQ and NA-OSMO2) were
selected for the experiment. Within each group, samples of 4 fruit rings were scanned. Using a cork
borer, small cylindrical samples (3 mm diameter) were excised from the dried apple, approximately 5
mm from the peel, excluding regions in which vascular tissue could be discerned visually. The
thickness of the apple slices was not altered when preparing the samples. The samples were
mounted on the rotating holder and stabilized using parafilm. X-ray micro-CT measurements were
performed on a SkyScan 1172 system (Bruker microCT, Kontich, Belgium), operated at 55 keV source
voltage and 181 µA current and with an isotropic image pixel resolution of 2.44 µm. The samples
were rotated in 0.35° steps over a total of 180°, each time averaging 3 frames to acquire a
radiographic image of 1048 by 2000 pixels. The time to obtain all images for the 3D scan was 29
minutes per sample. The projection images were loaded into dedicated software (NRecon1.6.3.2,
Bruker microCT, Kontich, Belgium) to reconstruct virtual cross-sections of the sample. This resulted
in a 3D greyscale data stack, digitized to 880 slices of 2000 by 2000 pixels. The images were
smoothed by a Gaussian smoothing kernel, and corrected for rings and beam hardening, which are
common artefacts in X-ray CT images. For image analysis a cylindrical volume of interest (diameter
2.5 mm) was cropped centrally in the imaged volume to exclude interference with the excised
borders of the sample. The remaining volume for analysis measured 5.4 mm3. The images were
filtered in 3D space using a median filter with filter radius of 2 pixels. Otsu’s algorithm (Otsu, 1979)
was applied for binarizing the image by separating two peaks in the greyscale frequency distribution:
pixels with lower intensities than the Otsu threshold were assigned to the background (air) and
pixels with a higher intensity than the threshold were assigned to the apple tissue material.
Individual 3D objects smaller than 27 voxels were considered to be noise and were filtered out of the
datastack. Morphometric parameters describing the microstructure were calculated on the 3D data
using CTAn v.1.12.0.0 (Bruker microCT, Kontich, Belgium). Porosity was calculated as the fraction of

ACC
EPTE
D M
ANU
SCR
IPT
ACCEPTED MANUSCRIPT
12
segmented air pixels to the total amount of pixels in the analysed dataset. For the analysis of pore
and (dehydrated) tissue thicknesses, the corresponding binary images were thinned until a
skeletonized representation of the medial axes was obtained (Hildebrand & Ruegsegger, 1997).
Next, a sphere was fitted on every pixel of the skeleton until the boundary of the material was
reached. The diameters of the fitted spheres give information on the local thicknesses of the
microstructural features.
2.5. Destructive quality assessment
Textural quality measurements
Textural quality attributes of the dried apple rings were measured by a TA-XT plus Texture
Analyser (Stable Micro Systems, UK) through bending-snapping tests fitted with a 50 N load cell and
using the HDP/3PB Three Point Bending Rig. The lower supporting blades were separated at a
distance of 45 mm, and the compressing blade was driven down between the two supports at a
speed of 0.17 mm/s, bending each apple ring until it snapped. From the force/displacement curve,
the following parameters were acquired for that apple ring:
• Hardness (N): maximum force at break
• Total Area (N.mm or mJ): work required to snap the ring (Snapping Work or Rupture
Energy)
• Crispness Index (MPa): computed according to the following formula (Farris, Gobbi,
Torreggiani, & Piergiovanni, 2008):
(Eq. 1)
Where:
L (m): support separation
ACC
EPTE
D M
ANU
SCR
IPT
ACCEPTED MANUSCRIPT
13
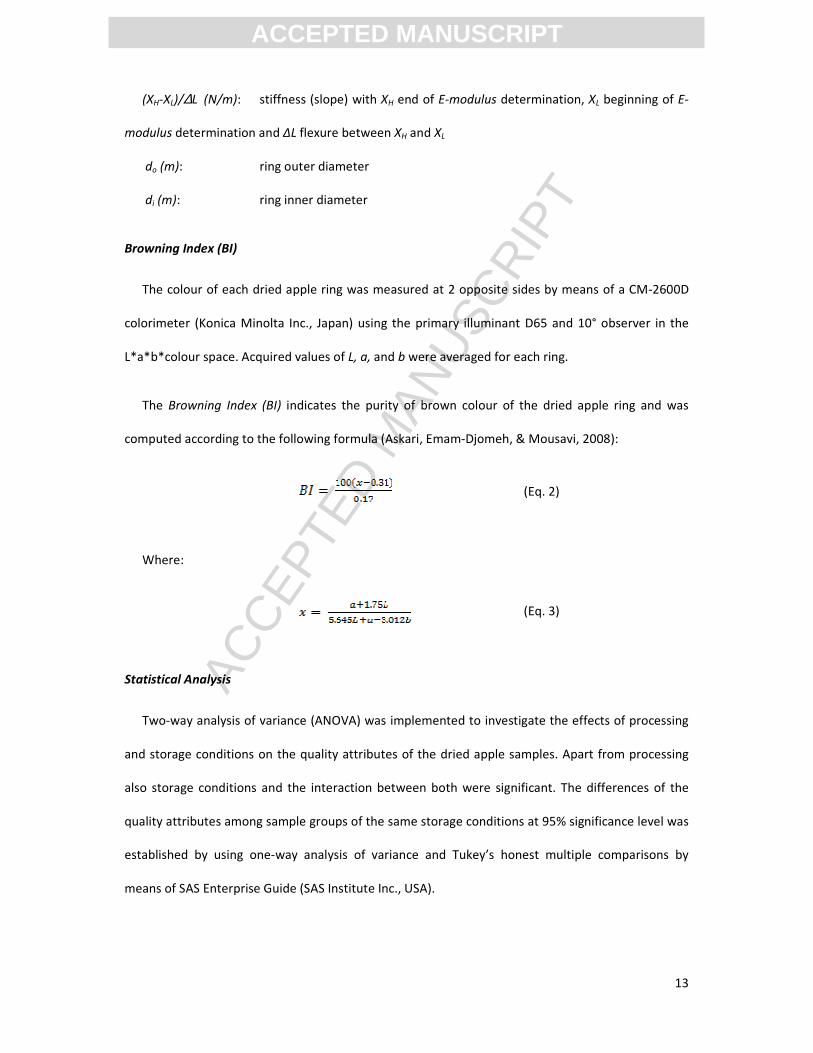
(XH-XL)/∆L (N/m): stiffness (slope) with XH end of E-modulus determination, XL beginning of E-
modulus determination and ΔL flexure between XH and XL
do (m): ring outer diameter
di (m): ring inner diameter
Browning Index (BI)
The colour of each dried apple ring was measured at 2 opposite sides by means of a CM-2600D
colorimeter (Konica Minolta Inc., Japan) using the primary illuminant D65 and 10° observer in the
L*a*b*colour space. Acquired values of L, a, and b were averaged for each ring.
The Browning Index (BI) indicates the purity of brown colour of the dried apple ring and was
computed according to the following formula (Askari, Emam-Djomeh, & Mousavi, 2008):
(Eq. 2)
Where:
(Eq. 3)
Statistical Analysis
Two-way analysis of variance (ANOVA) was implemented to investigate the effects of processing
and storage conditions on the quality attributes of the dried apple samples. Apart from processing
also storage conditions and the interaction between both were significant. The differences of the
quality attributes among sample groups of the same storage conditions at 95% significance level was
established by using one-way analysis of variance and Tukey’s honest multiple comparisons by
means of SAS Enterprise Guide (SAS Institute Inc., USA).

ACC
EPTE
D M
ANU
SCR
IPT
ACCEPTED MANUSCRIPT
14
3. Results and discussion
3.1. Dried apple quality attributes
The average values and standard deviations of the quality parameters (Hardness, Crispness,
Snapping Work, and Browning Index) of the dried apple rings as measured with the reference
methods are presented in Table 1.
Position of Table 1
It can be seen from Table 1, that at all storage conditions (H, CA, and NA) the apple rings which
had been subjected to osmo-dehydration prior to the air-drying are crispier, as indicated by the
higher Crispness Index, than the ones without osmo-dehydration. The crispness is highest for the
OSMO2 rings which had been subjected to a longer osmo-dehydration time. Moreover, the TQ rings
(without osmo-dehydration) required significantly larger Snapping Work or efforts for mastication as
compared to the OSMO1 and OSMO2 rings. On the other hand, only the difference in Hardness
among the H-TQ and H-OSMO2 groups was significant. The Browning Index was significantly higher
for the TQ rings obtained from NA and CA storages, which indicates that the apple rings without
osmo-dehydration had a darker brown colour than the ones with osmo-dehydration.
In general, the texture quality and appearance (colour) of the dried apple rings which had been
subjected to osmo-dehydration (OSMO1 and OSMO2) can be considered better than that of the
rings without osmo-dehydration (TQ). On average, the OSMO2 samples, which had been subjected
longer to osmo-dehydration (3h vs. 1h) were crispier than the OSMO1 samples.

ACC
EPTE
D M
ANU
SCR
IPT
ACCEPTED MANUSCRIPT
15
3.2. Microstructure
The X-ray CT images illustrated in Figure 2 offer a detailed insight in the 3D microstructure of the
scanned samples. The dried apple samples clearly have a highly porous structure as a large number
of irregular black pores is present in between the complex tissue network.
Position of Figure 2
The representative morphometric parameters (porosity, dehydrated tissue and pore thicknesses)
describing the apple ring microstructure calculated on the 3D data are presented in Table 2.
Position of Table 2
As can be seen from Table 2, the pre-treatment of the apple slices by osmo-dehydration prior to
air drying resulted in significantly different microstructural characteristics for the dried apple
samples. The porosity of the NA-OSMO2 samples is significantly higher than the porosity of the NA-
TQ ones. This is also reflected in the different average thicknesses of the tissue as well. The tissues of
TQ samples are also thicker than those of OSMO2 samples. Average pore space diameters (pore
thicknesses) are significantly larger for OSMO2 samples as compared to those for TQ samples.
3.3. SRS
The SRS spectra in the 590-1000 nm range of one H-TQ apple ring are illustrated in Figure 3.

ACC
EPTE
D M
ANU
SCR
IPT
ACCEPTED MANUSCRIPT
16
Position of Figure 3
In Figure 3, the z-axis is the relative reflectance calculated by using an integrating sphere as a
reference as described in section 2.2.2. Fiber 1 is the closest detection fiber and fiber 5 is the
furthest one from the illumination point. The diffuse reflectance spectrum of each detection fiber
shows an increasing trend in the beginning which flattens out at higher wavelengths. This is due to
the absorption of the colour pigments in the apple rings as evidenced visually by their colour
appearance or Browning Index. The small valley at 670 nm which can be seen in several spectra
indicates the presence of chlorophyll in the dried apple flesh. At each wavelength, the diffuse
reflectance values decrease with increasing source-detector distance or fiber position. This can be
explained by the fact that light exiting the sample at a larger distance from the incident light beam
has travelled a longer path through the sample and thus has had more chance to be absorbed or
scattered. In comparison to fresh apple tissue (Nguyen Do Trong, et al., 2013), there is no clear
absorption peak of water at 970 nm. This could have been expected as there is only very little water
left in the tissue after air drying until constant weight.
3.4. Validation of the optical properties estimation on liquid phantoms
In Figure 4 the predicted optical properties (absorption coefficient µa and reduced scattering
coefficient µs’) of the 16 validation phantoms are plotted against their reference values.
Position of Figure 4
ACC
EPTE
D M
ANU
SCR
IPT
ACCEPTED MANUSCRIPT
17
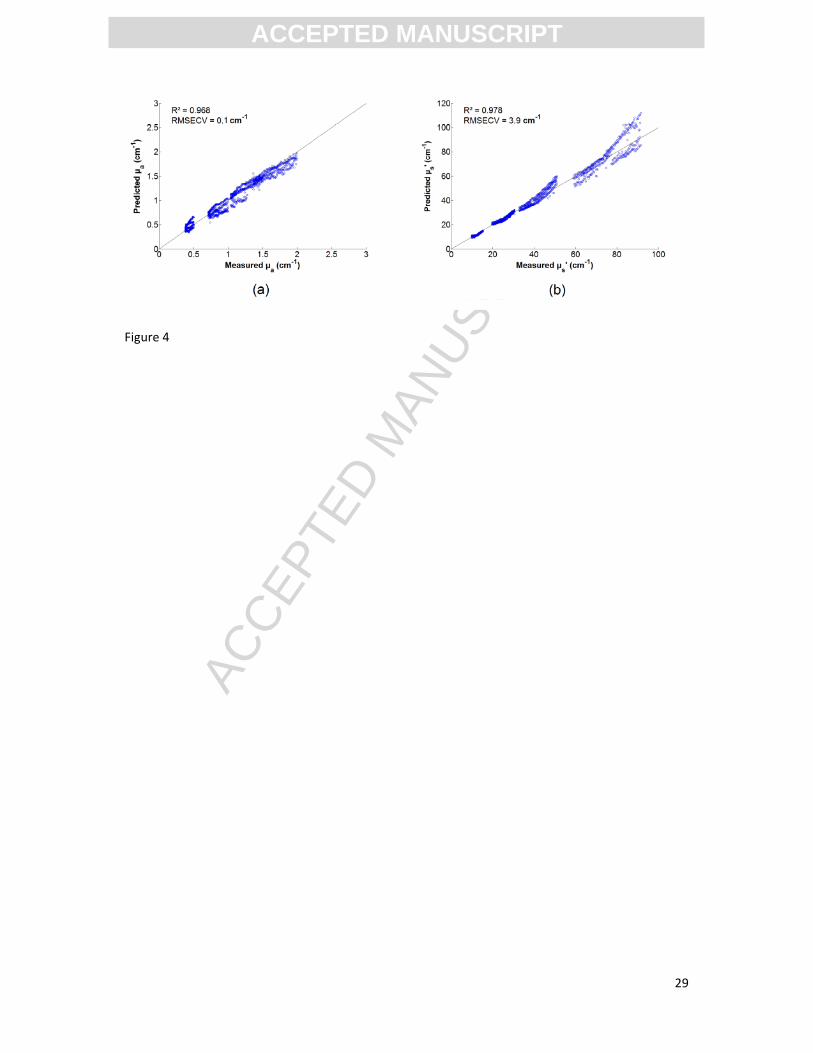
In Figure 4, a very good prediction performance can be observed with R2 values of 0.968 and
0.978, respectively for the absorption coefficient µa and reduced scattering coefficient µs’ values.
Moreover, the mean prediction errors RMSECV (Root Mean Squared Error of Cross-Validation) are
approximately 0.1 cm-1
for µa and 3.9 cm-1
for µs’. In the wavelength range below 80 cm-1
, the
predicted reduced scattering coefficient µs’ are quite close to the measured ones. Beyond 80 cm-1
,
some deviations can be observed. A possible explanation for these deviations could be that the
scattering in the liquid phantoms with higher intralipid concentrations is no longer independent. In
this study we considered a linear relation between the intralipid concentration and the scattering
coefficient values, but it has been shown that this relation may become nonlinear for higher
intralipid concentrations due to dependent scattering (Zaccanti, Del Bianco, & Martelli, 2003).
Further research would be needed to confirm this hypothesis. However, the prediction errors are
sufficiently small as compared to the average reference values of µa (1.0 cm-1
) and µs’ (38.7 cm-1
) in
the validation set to conclude that this approach is useful for deriving the optical properties of the
dried apple rings from the acquired spatially resolved diffuse reflectance spectra.
3.5. Optical properties of dried apples
The estimated optical properties (absorption coefficient µa and reduced scattering coefficient µs’)
spectra of the apple rings are illustrated in Figure 5.
Position of Figure 5
As can be seen from Figure 5, the reduced scattering coefficients µs’ of the TQ apple rings in the
700-1000 nm range are significantly higher than those of the OSMO1 and OSMO2 groups under the
considered confidence intervals for all the storage conditions (H, CA and NA). Although the reduced

ACC
EPTE
D M
ANU
SCR
IPT
ACCEPTED MANUSCRIPT
18
scattering coefficient µs’ values for the OSMO1 group in this range are clearly higher than those for
the OSMO2 group, this difference was not significant. All the scattering profiles exhibit a decreasing
trend with increasing wavelength in the 590-700 nm range. It should be noted here that the
estimated scattering information in the 590-700 nm range may be less reliable than in the 700-1000
nm range as the prediction error of the inverse metamodelling approach presented in Figure 4 (b)
was higher for the higher scattering values. For this reason, the further interpretation of the
scattering information and comparison to the microstructure and textural quality attributes of the
apple rings was limited to the 700-1000 nm range.
The absorption coefficient µa
values of the apple rings show a monotonous decreasing trend until
700 nm after which they remain quite constant and are of small values (Figure 5). For all samples
slight deviations can be observed at 670 nm, indicating the presence of chlorophyll. The higher
absorption values before 670 nm could be related to the formation of chromophores (e.g.,
melanoidins through Maillard reactions) during the air drying process. These observations are in
good agreement with the appearance colour of the apple rings and the acquired SRS profiles as
observed in Figure 3. The absorption coefficient µa
values before 700 nm of TQ apple rings which had
not been pre-treated by osmo-dehydration are significantly higher than those of the OSMO1 and
OSMO2 groups pre-treated by osmo-dehydration under the considered confidence intervals (data
not shown). These are also reflected in the significant higher Browning Index (BI) values of the TQ
apple rings as compared to the OSMO1 and OSMO2 rings (Table 1). The observed differences in µa
values between the OSMO1 and OSMO2 groups were not significant.
3.6. Optical properties-microstructure-texture relations
Further investigation of the scattering information, microstructure, and textural quality attributes
(Hardness, Crispness Index, and Snapping Work) reveals some interesting relations among them. The
apple rings which had not been pre-treated by osmo-dehydration prior to air drying (TQ group) had
less porosity, thicker tissue, and smaller pore sizes than the ones with osmo-dehydration (OSMO2

ACC
EPTE
D M
ANU
SCR
IPT
ACCEPTED MANUSCRIPT
19
group) (Table 2), which consequently made them less crispy and required more rupture energy
during mastication than the osmo-dehydrated apple rings (Table 1). However, the osmo-dehydrated
apple rings still had comparable Hardness as compared to the ones without osmo-dehydration,
which would give positive contributions to the consumers’ perception during the chewing process.
Because of the thicker tissue and smaller pore sizes (Table 2), the TQ apple rings consequently had
more interfaces resulting in a refractive index mismatch (e.g., air pore-tissue, cell-cell regions within
the tissues, intercellular medium-cell compartments…) than the OSMO2 rings. This resulted in higher
scattering coefficient values µs’ for the TQ groups as compared to the OSMO2 groups (Figure 5). A
clear relation between process conditions, microstructure and textural quality has thus been
observed, which is consequently reflected in the scattering coefficient values obtained with SRS.
4. Conclusions
Fresh apple rings from ‘Golden Delicious’ apples at harvest (H) and after five months of storage
under controlled atmosphere (CA) and normal atmosphere (NA) conditions were subjected to 3
different pre-treatments: without osmo-dehydration (TQ) and with osmo-dehydration for 1 hour
(OSMO1) and 3 hours (OSMO2). All the pre-treated apple rings were then air dried until constant
weight. Diffuse reflectance measurements by SRS in the 500-1000 nm range, microstructure
measurements by X-ray micro-CT technique, and destructive reference measurements for texture
and appearance quality attributes were carried out on these samples. The estimated optical
properties (reduced scattering coefficient µs’ and absorption coefficient µa) of the air dried apple
rings from SRS measurements exhibited strong relations with the microstructural information and
the quality parameters from destructive measurements. For all storage conditions (H, CA, and NA),
the TQ apple rings (without osmo-dehydration) had higher scattering, thicker tissue, smaller pore
sizes, were less crispy, and required larger snapping efforts than the OSMO1 and OSMO2 apple rings
(with osmo-dehydration). Moreover, the TQ ring samples also had higher absorption coefficient µa
than the osmo-air-dried ones (OSMO1 and OSMO2), in agreement with their higher Browning Index.

ACC
EPTE
D M
ANU
SCR
IPT
ACCEPTED MANUSCRIPT
20
The observed differences in scattering properties and textural quality (Crispness and Snapping Work)
of the OSMO1 and OSMO2 apple rings were, however, not significant.
It can thus be concluded that there is a clear relation between processing conditions and
microstructure and textural quality in dried apples, which is consequently reflected in the scattering
coefficient values obtained with SRS. As this technique is fast, non-destructive and does not require
sample preparation, it has potential for on-line monitoring of the microstructure of dried apple rings
and more general for drying process optimization.
Acknowledgements
This publication has been produced with the financial support of the European Union (project
FP7-226783 - InsideFood). The opinions expressed in this document do by no means reflect the
official opinion of the European Union or its representatives. The aids from Professor Depeursinge
and his co-workers at the Swiss Federal Institute of Technology (EPFL, Lausanne, Switzerland) in
developing the fiber-optic SRS setup are gratefully acknowledged. The provision of the ooDACE
toolbox from the Department of Information Technology (INTEC), Ghent University, Belgium is
gratefully acknowledged. Nghia Nguyen Do Trong is a PhD student funded by the Interfaculty Council
for Development Cooperation, KU Leuven (IRO scholarship). Mizuki Tsuta would like to acknowledge
the Japanese Society for the Promotion of Science (JSPS) for funding as a JSPS Postdoctoral
Researcher for Research Abroad. We would also like to acknowledge the Hercules Foundation and
the Institute for the Promotion of Innovation through Science and Technology (IWT-Vlaanderen,
doctoral scholarship 093469). Wouter Saeys has been funded as a Postdoctoral Fellow of the
Research Foundation – Flanders (FWO).

ACC
EPTE
D M
ANU
SCR
IPT
ACCEPTED MANUSCRIPT
21
References
Acevedo, N. C., Briones, V., Buera, P., & Aguilera, J. M. (2008). Microstructure affects the rate of
chemical, physical and color changes during storage of dried apple discs. Journal of Food
Engineering, 858, 222 – 231.
Aguilera, J. M. (2005). Why food microstructure? Journal of Food Engineering, 67, 3 – 11.
Araya, X. I. T., Hendrickx, M., Verlinden, B. E., Van Buggenhout, S., Smale, N. J., Stewart, C., & John
Mawson, A. (2007). Understanding texture changes of high pressure processed fresh carrots: A
microstructural and biochemical approach. Journal of Food Engineering, 80 (3), 873 - 884.
Askari, G. R., Emam-Djomeh, Z., & Mousavi, S.M., (2008). Investigation of the effect of microwave
treatment on the optical properties of apple slices during drying. Drying Technology, 26, 1362-1368.
Barrangou, L. M., Drake, M.A., Daubert, C.R., & Foegeding, E.A. (2006). Sensory texture related to
large-strain rheological properties of agar/glycerol gels as a model food. Journal of Texture Studies,
37 (3), 241 - 262.
Borwankar, R.P. (1992). Food texture and rheology: A tutorial review. Journal of Food Engineering,
16, 1 - 16.
Couckuyt, I., Forrester, A., Gorissen, D., De Turck, F., & Dhaene, T. (2012). Blind Kriging:
Implementation and performance analysis. Advances in Engineering Software, 49, 1-13.
Cubeddu, R., D’Andrea, C., Pifferi, A., Taroni, P., Torricelli, A., Valentini, G., Dover, C., Johnson, D.,
Ruiz-Altisent, M., & Valero, C. (2001). Nondestructive quantification of chemical and physical
properties of fruits by time-resolved reflectance spectroscopy in the wavelength range 650-1100
nm. Applied Optics, 40 (4), 538-543.
Decker, N. R., & Ziegler, G. R. (2003). Mechanical properties of aerated confectionery. Journal of
Texture Studies, 34, 437-448.
Farris, S., Gobbi, S., Torreggiani, D., & Piergiovanni, L. (2008). Assessment of two different rapid
compression tests for the evaluation of texture differences in osmo-air-dried apple rings. Journal of
Food Engineering, 88, 484-491.
Herremans, E., Bongaers, E., Estrade, P., Gondek, E., Hertog, M., Jakubczyk, E., Nguyen Do Trong, N.,
Rizzolo, A., Saeys, W., Spinelli, L., Torricelli, A., Vanoli, M., Verboven, P., & Nicolaï, B. (2013).
Microstructure-texture relationships of aerated sugar gels: novel measurement techniques for
analysis and control. Innovative Food Science and Emerging Technologies, 18, 202-211.
Hildebrand, T., & Ruegsegger, P. (1997). A new method for the model independent assessment of
thickness in three dimensional images. Journal of Microscopy, 185, 67-75.

ACC
EPTE
D M
ANU
SCR
IPT
ACCEPTED MANUSCRIPT
22
Huang, H., Yu, H., Xu, H., & Ying, Y. (2008). Near infrared spectroscopy for on/in-line monitoring of
quality in foods and beverages: A review. Journal of Food Engineering, 87 (3), 303–313.
International Nut and Dried Fruit Council, 2013: https://www.nutfruit.org/en/inc-global-statistical-
review-reflects-the-continued-increase-of-the-global-consumption-of-nuts-and-dried-fruits_70983
Itoh, H., De Baerdemaeker, J., Nguyen Do Trong, N., Wang, L., & Saeys, W. (2013). Estimation of pear
ripeness by hyperspectral laser scatter imaging. Proceedings of the 2013 IFAC Bio-Robotics. 27-29
March 2013. Osaka, Japan.
Martens, H., & Næs, T. (1991). Multivariate Calibration. Wiley. ISBN: 978-0-471-93047-1.
Mebatsion, H., Verboven, P., Ho, Q., Verlinden, B., & Nicolaï, B. (2008). Modelling fruit
(micro)structures, why and how? Trends in Food Science & Technology, 19 (2), 59-66.
Nguyen Do Trong, N., Watté, R., Aernouts, B., Verhoelst, E., Tsuta, M., Jakubczyk, E., Gondek, E.,
Verboven, P., Nicolaï, B., & Saeys, W. (2012). Differentiation of microstructures of sugar foams by
means of spatially resolved spectroscopy. Proceedings of SPIE, Volume 8439: Paper 843914.
Nguyen Do Trong, N., Erkinbaev, C., Tsuta, M., De Baerdemaeker, J., Nicolaï, B., & Saeys, W. (2013).
Spatially resolved spectroscopy for nondestructive quality measurements of Braeburn apples
cultivated in sub-fertilization condition. Proceedings of SPIE, Volume 8881, Paper 88810L
Nicolaï, B. M., Beullens, K., Bobelyn, E., Peirs, A., Saeys, W., Theron, K. I., & Lammertyn, J. (2007).
Nondestructive measurement of fruit and vegetable quality by means of NIR spectroscopy: A review.
Postharvest Biology and Technology, 46 (2), 99–118.
Nicolaï, B. M., Verlinden, B. E., Desmet, M., Saevels, S., Saeys, W., Theron, K., Cubeddu, R., Pifferi, A.,
& Torricelli, A. (2008). Time-resolved and continuous wave NIR reflectance spectroscopy to predict
soluble solids content and firmness of pear. Postharvest Biology and Technology, 47, 68-74.
Otsu, N. (1979). A threshold selection method from gray-level histograms. IEEE Transactions on
systems, man, and cybernetics, 9, 62-66.
Qin, J., & Lu, R. (2008). Measurement of the optical properties of fruits and vegetables using spatially
resolved hyperspectral diffuse reflectance imaging technique. Postharvest Biology and Technology,
49, 355-365.
Qin, J., Lu, R., & Peng, Y., (2009). Prediction of apple internal quality using spectral absorption and
scattering properties. Transactions of the ASABE, 52 (2), 499-507.
Rizzolo, A., Vanoli, M., Zerbini, P. E., Jacob, S., Torricelli, A., Spinelli, L., Schouten, R. E., & Tijskens, L.
M. M. (2009). Prediction ability of firmness decay models of nectarines based on the biological shift
factor measured by time-resolved reflectance spectroscopy. Postharvest Biology and Technology, 54,
131-140.

ACC
EPTE
D M
ANU
SCR
IPT
ACCEPTED MANUSCRIPT
23
Romano, G., Argyropoulos, D., Nagle, M., Khan, M. T., & Müller, J. (2012). Combination of digital
images and laser light to predict moisture content and color of bell pepper simultaneously during
drying. Journal of Food Engineering, 109 (3), 438 – 448.
Sacks, J., Welch, W. J., Mitchell, T., & Wynn, H. P. (1989). Design and analysis of computer
experiments. Statistical Science, 4 (4), 409–435.
Saeys, W., Velazco-Roa, M. A., Thennadil, S. N., Ramon, H., & Nicolaï, B. M. (2008). Optical properties
of apple skin and flesh in the wavelength range from 350 to 2200nm. Applied Optics, 47 (7), 908 –
919.
Sigurgisladottir, S., Ingvarsdottir, H., Torrissen, O. J., Cardinal, M., & Hafsteinsson, H. (2000). Effects
of freezing/thawing on the microstructure and the texture of smoked Atlantic salmon (Salmo salar).
Food Research International, 33 (10), 857 – 865.
Staum, J. (2009). Better simulation metamodeling: The why, what, and how of stochastic Kriging.
Proceedings of the Winter Simulation Conference 2009, 119-133.
Szczesniak, A. S., (1971). Consumer awareness of texture and of other food attributes II. Journal of
texture studies, 2 (2), 196 – 206.
Szczesniak, A. S., & Kahn, E. L. (1971). Consumer awareness of and attitudes to food texture I: Adults.
Journal of texture studies, 2 (3), 280 – 295.
Szczesniak, A. S., (1972). Consumer awareness of and attitudes to food texture II: Children and
Teenagers. Journal of texture studies, 3 (2), 206 – 217.
Szczesniak, A. S., (2002). Texture is a sensory property. Food Quality and Preference, 13 (4), 215 –
225.
Torricelli, A., Spinelli, L., Contini, D., Vanoli, M., Rizzolo, A., & Eccher Zerbini, P. (2008). Time-resolved
reflectance spectroscopy for nondestructive assessment of food quality. Sensing and
Instrumentation for Food Quality and Safety, 2, 82−89.
Tu, K., Jancsók, P., Nicolaï, B., & De Baerdemaeker, J. (2000). Use of laser-scattering imaging to study
tomato-fruit quality in relation to acoustic and compression measurements. International Journal of
Food Science & Technology, 35 (5), 503 – 510.
Tuchin, V. (2007). Tissue Optics – Light scattering methods and instruments for medical diagnosis.
(2nd ed.). SPIE Press, Bellingham, Washington, USA.
Tuchin, V. (2008). Handbook of optical sensing of glucose in biological fluids and tissues. CRC Press.
Van Buggenhout, S., Grauwet, T., Van Loey, A., & Hendrickx, M. (2008). Structure/processing relation
of vacuum infused strawberry tissue frozen under different conditions. European Food Research and
Technology, 226 (3), 437 – 448.

ACC
EPTE
D M
ANU
SCR
IPT
ACCEPTED MANUSCRIPT
24
Walter JR., W. M. & Hoover, M. W. (1984). Effect of pre-processing storage conditions on the
composition, microstructure, and acceptance of sweet potato patties. Journal of Food Science, 49
(5), 1258 – 1261.
Xia, J., Weaver, A., Gerrard, D. E., & Yao, G., (2008). Distribution of optical scattering properties of
four beef muscles. Sensing and Instrumentation for Food Quality and Safety, 2, 75-81.
Zaccanti, G., Del Bianco, S., & Martelli, F., (2003). Measurements of optical properties of high-density
media. Applied Optics, 42 (19), 4023 – 4030.
Zerbini, P. E., Grassi, M., Cubeddu, R., Pifferi, A., & Torricelli, A., (2002). Nondestructive detection of
brown heart in pears by time-resolved reflectance spectroscopy. Postharvest Biology and
Technology, 25, 87-97.
Zerbini, P. E., Vanoli, M., Grassi, M., Rizzolo, A., Fibiani, M., Cubeddu, R., Pifferi, A., Spinelli, L., &
Torricelli, A., (2006). A model for the softening of nectarines based on sorting fruit at harvest by
time-resolved reflectance spectroscopy. Postharvest Biology and Technology, 39, 223-232.
ACC
EPTE
D M
ANU
SCR
IPT
ACCEPTED MANUSCRIPT
25
List of figure captions
Figure 1. Schematic illustration of the setup for SRS measurement
Figure 2. Illustration of X-ray CT cross-sectional images of two air dried apple rings: (a) NA-TQ and
(b) NA-OSMO2. Scale bar at the right corner of each image indicates 250 µm.
Figure 3. SRS spectra of one H-TQ apple ring
Figure 4. Scatter plots of predicted versus measured optical properties of the 16 validation
phantoms: (a): absorption coefficient µa; (b): reduced scattering coefficient µs’. The diagonal black
line represents the perfect prediction line. RMSECV: Root Mean Squared Error of Cross-Validation.
Figure 5. Estimated optical properties of the dried apple rings: reduced scattering coefficient µs’
(left) and absorption coefficient µa (right). Mean values are plotted in the main graphs. In the inserts,
thick curves indicate mean values; thin curves represent the mean ± standard deviation.

ACC
EPTE
D M
ANU
SCR
IPT
ACCEPTED MANUSCRIPT
26
Figure 1

ACC
EPTE
D M
ANU
SCR
IPT
ACCEPTED MANUSCRIPT
27
Figure 2

ACC
EPTE
D M
ANU
SCR
IPT
ACCEPTED MANUSCRIPT
28
Figure 3
ACC
EPTE
D M
ANU
SCR
IPT
ACCEPTED MANUSCRIPT
29
Figure 4

ACC
EPTE
D M
ANU
SCR
IPT
ACCEPTED MANUSCRIPT
30
Figure 5

ACC
EPTE
D M
ANU
SCR
IPT
ACCEPTED MANUSCRIPT
31
Table 1. Reference quality attributes of the dried apple rings. Reported values are mean ± standard deviation
(n = 20 for H groups and n = 16 for CA, NA groups). Different letters in each storage condition indicate
significant difference at p ≤ 0.05; symbol * indicates significant difference at p ≤ 0.1.
Sample Hardness (N) Crispness Index (MPa) Snapping Work (mJ) Browning Index (BI)
H-OSMO1 3.1 ± 1.2a,b
61.8 ± 53.9a 1.4 ± 1.0
a 62.6 ± 8.6
a
H-OSMO2 4.0 ± 1.2b 155.9 ± 99.9
b 1.4 ± 0.7
a 64.0 ± 7.3
a,b
H-TQ 2.9 ± 1.3a 20.1 ± 13.6
a 3.8 ± 1.7
b 68.8 ± 4.6
b
CA-OSMO1 7.7 ± 1.6 375.8 ± 179.9b 3.3 ± 2.0
a 66.9 ± 7.8
a
CA-OSMO2 8.5 ± 2.2 376.9 ± 150.9b 3.9 ± 1.2
a 63.6 ± 5.4
a
CA-TQ 7.4 ± 2.3 159.9 ± 77.7a 6.2 ± 2.7
b 84.8 ± 7.0
b
NA-OSMO1 7.5 ± 1.8 247.5 ± 89.4b 3.9 ± 1.1
a 63.5 ± 7.2
a
NA-OSMO2 8.0 ± 1.7 297.6 ± 111.7b 3.8 ± 1.2
a* 61.1 ± 7.7
a
NA-TQ 7.5 ± 1.8 127.2 ± 53.9a 5.0 ± 1.8
a* 73.4 ± 5.9
b
Table 2. Microstructural information of the dried apple rings (NA-OSMO2 and NA-TQ). Reported results are
mean ± standard deviation (n = 4). Different letters indicate significant difference at p ≤ 0.1.
Sample Group Porosity (%) Tissue thickness (µm) Pore thickness (µm)
NA-OSMO2 82.0 ± 1.6b 20.5 ± 0.4
a 134.1 ± 18.1
b
NA-TQ 77.8 ± 1.1a 23.3 ± 1.1
b 101.9 ± 6.2
a

ACC
EPTE
D M
ANU
SCR
IPT
ACCEPTED MANUSCRIPT
32
Highlights
• Spatially resolved diffuse reflectance spectra of osmo-air-dried apple slices were
measured
• Optical scattering and absorption properties were obtained for these apple samples
• Scattering information reflected both apple ring microstructure and textural quality
• Clear process-microstructure-quality relations were observed