NFI:TSX Investor Update - New Flyer...Source: FactSet, Company filings * Total Shareholder Return...
22
0 NFI:TSX Investor Update Q2-17 as at August 10, 2017
Transcript of NFI:TSX Investor Update - New Flyer...Source: FactSet, Company filings * Total Shareholder Return...
0
NFI:TSX Investor Update
Q2-17 as at August 10, 2017
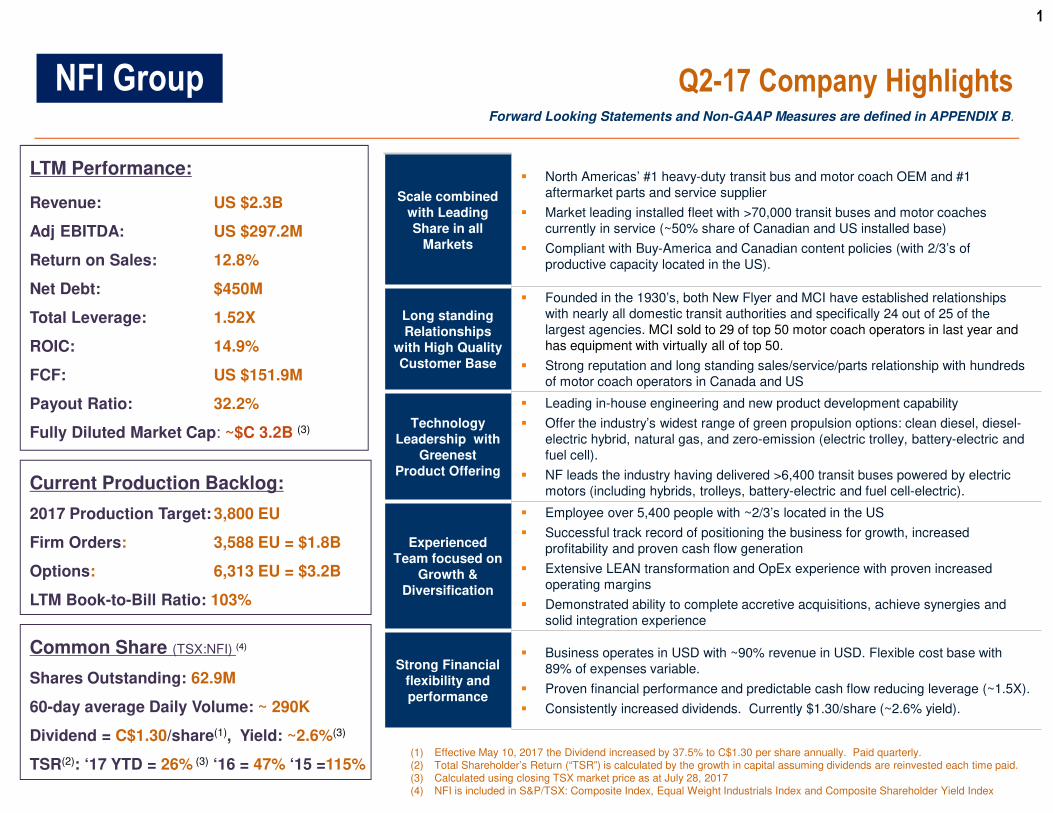
1
Q2-17 Company Highlights
LTM Performance:
Revenue: US $2.3B
Adj EBITDA: US $297.2M
Return on Sales: 12.8%
Net Debt: $450M
Total Leverage: 1.52X
ROIC: 14.9%
FCF: US $151.9M
Payout Ratio: 32.2%
Fully Diluted Market Cap: ~$C 3.2B (3)
Common Share (TSX:NFI) (4)
Shares Outstanding: 62.9M
60-day average Daily Volume: ~ 290K
Dividend = C$1.30/share(1), Yield: ~2.6%(3)
TSR(2): ‘17 YTD = 26% (3) ‘16 = 47% ‘15 =115%(1) Effective May 10, 2017 the Dividend increased by 37.5% to C$1.30 per share annually. Paid quarterly.(2) Total Shareholder’s Return (“TSR”) is calculated by the growth in capital assuming dividends are reinvested each time paid.(3) Calculated using closing TSX market price as at July 28, 2017(4) NFI is included in S&P/TSX: Composite Index, Equal Weight Industrials Index and Composite Shareholder Yield Index
Current Production Backlog:
2017 Production Target: 3,800 EU
Firm Orders: 3,588 EU = $1.8B
Options: 6,313 EU = $3.2B
LTM Book-to-Bill Ratio: 103%
Forward Looking Statements and Non-GAAP Measures are defined in APPENDIX B.
Scale combined with Leading Share in all
Markets
� North Americas’ #1 heavy-duty transit bus and motor coach OEM and #1 aftermarket parts and service supplier
� Market leading installed fleet with >70,000 transit buses and motor coaches currently in service (~50% share of Canadian and US installed base)
� Compliant with Buy-America and Canadian content policies (with 2/3’s of productive capacity located in the US).
Long standing Relationships
with High Quality Customer Base
� Founded in the 1930’s, both New Flyer and MCI have established relationships with nearly all domestic transit authorities and specifically 24 out of 25 of the largest agencies. MCI sold to 29 of top 50 motor coach operators in last year and has equipment with virtually all of top 50.
� Strong reputation and long standing sales/service/parts relationship with hundreds of motor coach operators in Canada and US
Technology Leadership with
GreenestProduct Offering
� Leading in-house engineering and new product development capability
� Offer the industry’s widest range of green propulsion options: clean diesel, diesel-electric hybrid, natural gas, and zero-emission (electric trolley, battery-electric and fuel cell).
� NF leads the industry having delivered >6,400 transit buses powered by electric motors (including hybrids, trolleys, battery-electric and fuel cell-electric).
Experienced Team focused on
Growth & Diversification
� Employee over 5,400 people with ~2/3’s located in the US
� Successful track record of positioning the business for growth, increased profitability and proven cash flow generation
� Extensive LEAN transformation and OpEx experience with proven increased operating margins
� Demonstrated ability to complete accretive acquisitions, achieve synergies and solid integration experience
Strong Financial flexibility and performance
� Business operates in USD with ~90% revenue in USD. Flexible cost base with 89% of expenses variable.
� Proven financial performance and predictable cash flow reducing leverage (~1.5X).
� Consistently increased dividends. Currently $1.30/share (~2.6% yield).
NFI Group
2
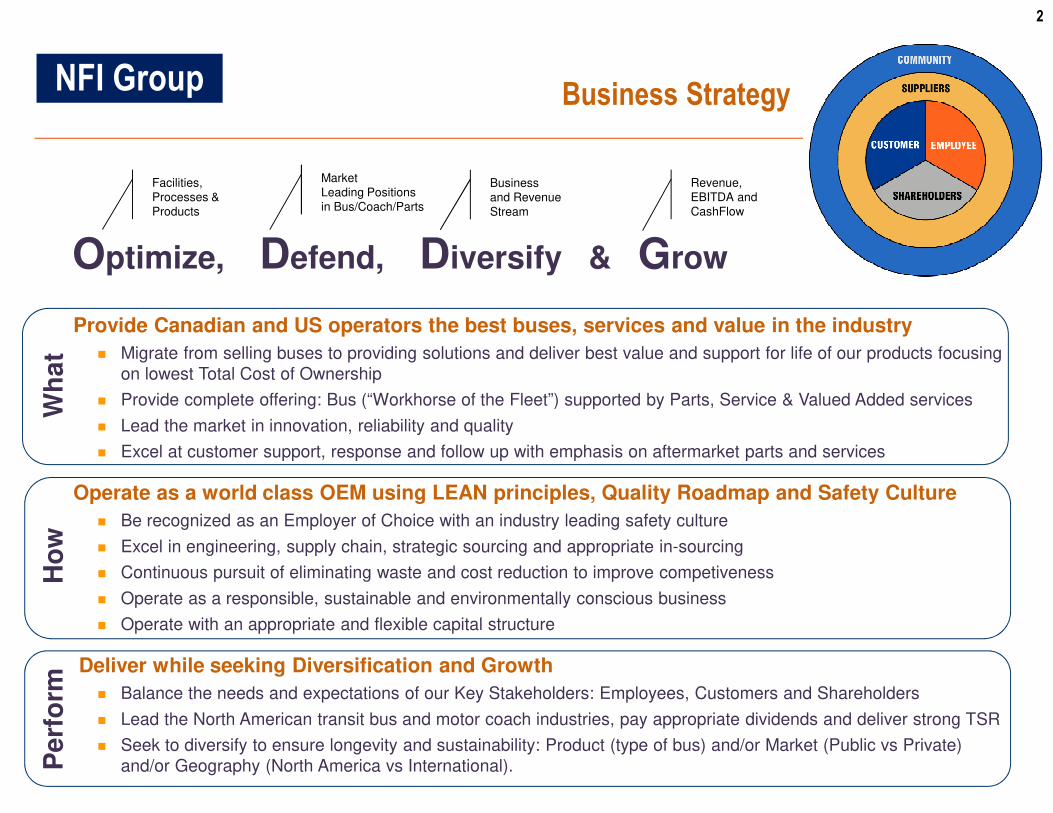
Provide Canadian and US operators the best buses, services and value in the industry
� Migrate from selling buses to providing solutions and deliver best value and support for life of our products focusing on lowest Total Cost of Ownership
� Provide complete offering: Bus (“Workhorse of the Fleet”) supported by Parts, Service & Valued Added services
� Lead the market in innovation, reliability and quality
� Excel at customer support, response and follow up with emphasis on aftermarket parts and services
Operate as a world class OEM using LEAN principles, Quality Roadmap and Safety Culture
� Be recognized as an Employer of Choice with an industry leading safety culture
� Excel in engineering, supply chain, strategic sourcing and appropriate in-sourcing
� Continuous pursuit of eliminating waste and cost reduction to improve competiveness
� Operate as a responsible, sustainable and environmentally conscious business
� Operate with an appropriate and flexible capital structure
Deliver while seeking Diversification and Growth
� Balance the needs and expectations of our Key Stakeholders: Employees, Customers and Shareholders
� Lead the North American transit bus and motor coach industries, pay appropriate dividends and deliver strong TSR
� Seek to diversify to ensure longevity and sustainability: Product (type of bus) and/or Market (Public vs Private) and/or Geography (North America vs International).
+
Facilities, Processes & Products
Market Leading Positions in Bus/Coach/Parts
Business and Revenue Stream
Revenue, EBITDA and CashFlow
Optimize, Defend, Diversify & Grow
Business StrategyNFI GroupW
ha
tH
ow
Pe
rfo
rm

3
846.8
149.3
--
100.0
200.0
300.0
400.0
500.0
600.0
700.0
800.0
900.0
Aug-12 Aug-13 Aug-14 Aug-15 Aug-16
Total
Retu
rnTotal Shareholder Return*
S&P/TSX Composite
Source: FactSet, Company filings
* Total Shareholder Return includes capital appreciation and dividends paid. Calculated using closing TSX market price as at July 28, 2017
Acquired North America’s leading manufacturer of motor coach & parts/service
Acquired US manufacturer of HD transit buses & parts distributor
Acquired Orion’s transit bus parts business from Daimler
Equity investment in NFI by a global bus and coach body manufacturer
Acquired Can/US Composite Supplier
--Aug-12 Aug-13 Aug-14 Aug-15 Aug-16
Acquired US part fabrication supplier
Conversion from IDS to Common Share (NFI)
NFI Group
820.5
145.9

4
Proven Leadership with extensive Industry Experience
Wayne Joseph President, Transit Bus
Joined New Flyer in 2008 as VP Operations and then assumed responsibility as EVP Transit Bus. Prior held executive positions in bus manufacturing for over forty years with NABI, Blue Bird and Flxible, and then at BAE Systems.
Holds a Bachelor of Science in Business Administration and an Accounting Degree and is Certified in Production and Inventory Management (CPIM).
Ian SmartPresident, Motor Coach
Joined New Flyer in 2011 as EVP Aftermarket and prior held various executive positions at Standard Aero for 15 years - one of the world’s largest independent aviation service companies.
Lead the project to privatize and conduct LEAN implementation at a United States Air Force Base.
Holds a Bachelor of Science in Industrial Engineering.
Brian Dewsnup President, Aftermarket Parts
Forrmely NABI’s CFO since 2006 (which NFI acquired in 2013), and then VP Business Development of New Flyer. Led the acquisition of MCI and became VP & GM Aftermarket. Prior served as Controller of Johns Manville's-Waterville operations, and held various capacities at Ford Motor and Visteon.
Holds a Bachelor's in Mechanical Engineering, Masters in Mechanical Engineering, and an MBA in Finance.
Paul SoubryPresident & CEO, NFI Group
Joined New Flyer in 2009 as President and CEO after 24 years with Standard Aero. Holds a Bachelor of Commerce, attended Exec Ed at Harvard Business School and the Institute of Corporate Directors.
In 2003, was named a recipient of ‘Canada’s Top 40 under 40’ award, inducted into the CME Manufacturing Hall of Fame in 2014, and recognized as Canada’s 2016 CEO of the Year by the Financial Post.
David WhiteEVP Supply, NFI Group
Joined New Flyer in 1998 as Corporate Controller, and became Vice President Supply Management in 2002. Prior worked for Deloitte as a Chartered Accountant. Holds a Bachelor of Commerce in Finance and obtained Chartered Accountant designation.
Glenn AshamCFO, NFI Group
Joined New Flyer in 1992. Obtained chartered accountant designation and holds a Bachelor of Commerce. Prior worked with Deloitte providing client services in the areas of accounting, auditing, taxation and management consulting
Colin Pewarchuk, General Counsel, NFI Group
Joined New Flyer in 2006. Prior practiced law with Aikins, Macauley and Thorvaldson and was a Banking Officer with Royal Bank of Canada. Holds a Bachelor of Commerce in Finance and a Bachelor of Laws.
Janice HarperEVP HR, NFI Group
Joined New Flyer in 1998. Holds a Diploma in Creative Communications, a Certificate in Human Resources, is a Charterer Professional in Human Resources (CPHR), a HR Compensation Committee management designation and BA in Communications.
NFI Group

5
#1 Market Share in Transit Bus
Heavy-Duty: Xcelsior®
� Launch in 2009 based on >20 years experience with low floor transit buses. Primary targets is metropolitan & urban fleets
� Offered in 35’, 40’, and 60’ lengths and with the industry’s widest range of propulsion options: clean diesel, diesel-electric hybrid, natural gas, and zero-emission (electric trolley, battery-electric and fuel cell).
Active Canada/US HD Transit Bus Coach Fleet ~85,000
Source: New Flyer Database & Management Estimates
Average Age of the HD Transit Fleet: US = 7.8 years, Canada = 7.3 yearsSource: APTA Public Transportation Factbook 2016
Orion Parts and NABI acquired by NFI in 2013
19%
45%
30%
5%
1%
HD Transit Bus Share (2016 market is ~5,800 units)
Montreal and New YorkOwned by Volvo Truck & Bus
CaliforniaOwned by REV Group
CaliforniaPrivately Owned by
Henry Crown and Company
6
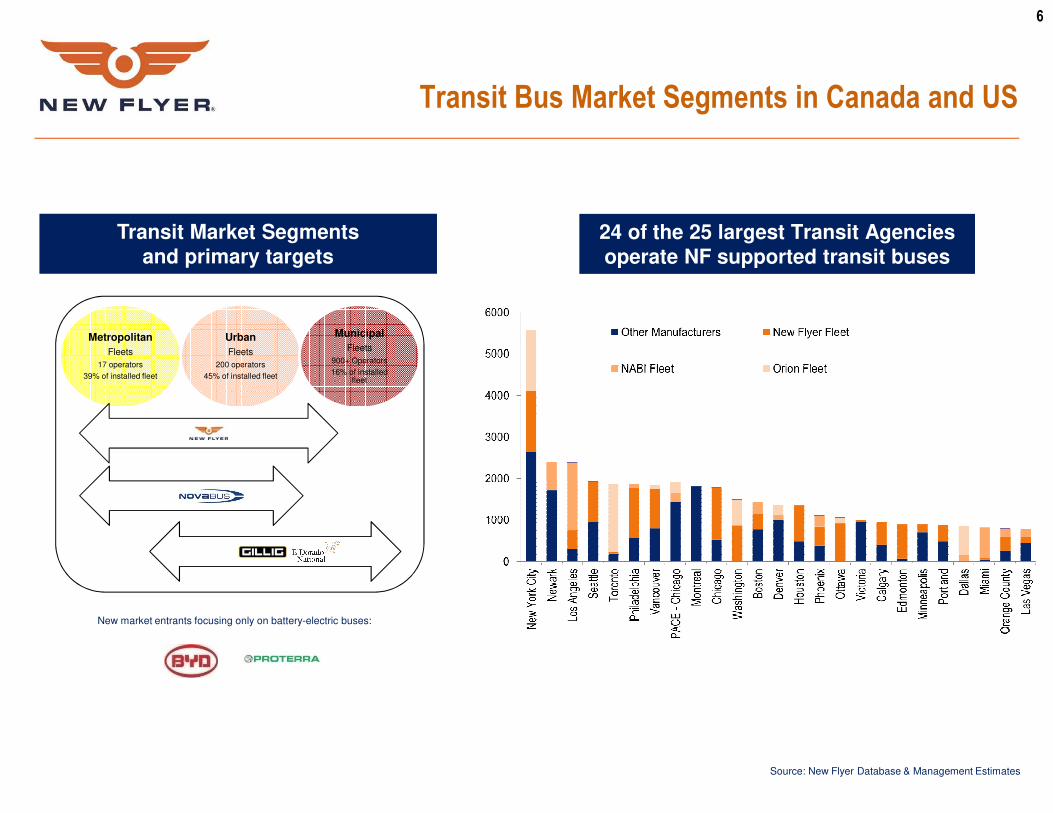
Metropolitan
Fleets
17 operators
39% of installed fleet
Urban
Fleets
200 operators
45% of installed fleet
Municipal
Fleets
900+ Operators
16% of installed fleet
Transit Bus Market Segments in Canada and US
Source: New Flyer Database & Management Estimates
Transit Market Segments and primary targets
24 of the 25 largest Transit Agencies operate NF supported transit buses
New market entrants focusing only on battery-electric buses:
7
28%
39%
26%
7%
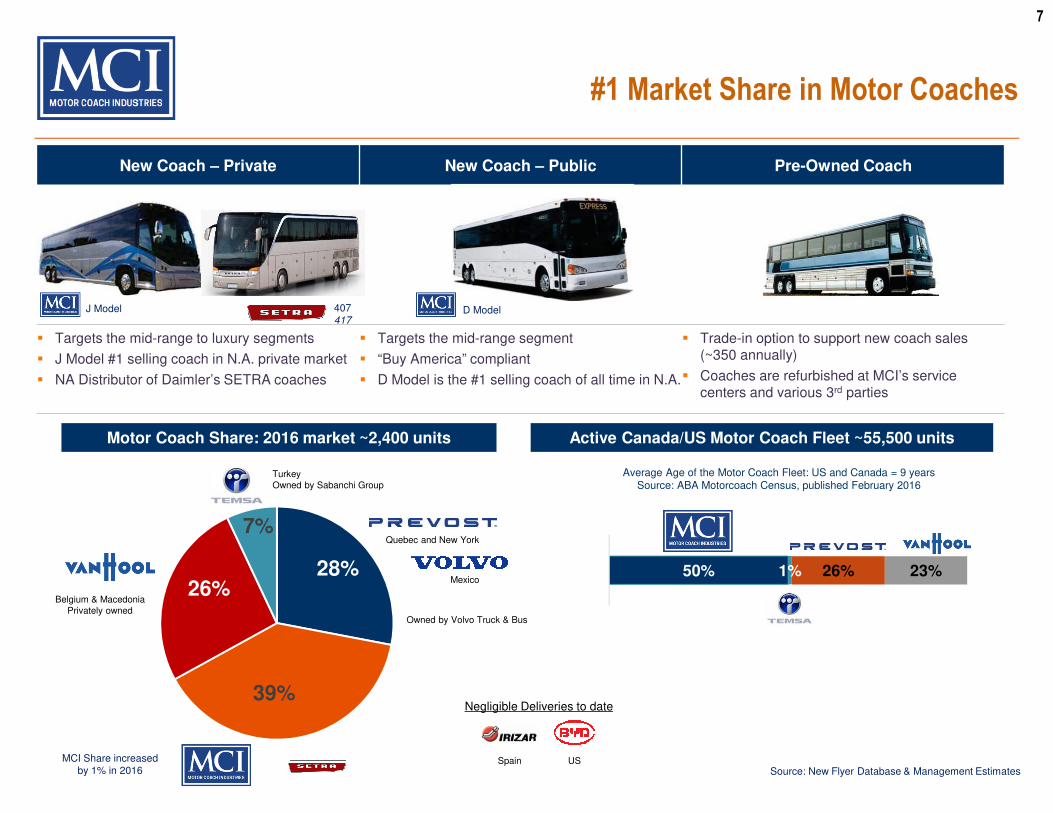
#1 Market Share in Motor Coaches
50% 1% 26% 23%
New Coach – Private New Coach – Public Pre-Owned Coach
� Targets the mid-range to luxury segments
� J Model #1 selling coach in N.A. private market
� NA Distributor of Daimler’s SETRA coaches
� Targets the mid-range segment
� “Buy America” compliant
� D Model is the #1 selling coach of all time in N.A.
� Trade-in option to support new coach sales (~350 annually)
� Coaches are refurbished at MCI’s service centers and various 3rd parties
Active Canada/US Motor Coach Fleet ~55,500 units
Average Age of the Motor Coach Fleet: US and Canada = 9 yearsSource: ABA Motorcoach Census, published February 2016
MCI Share increased by 1% in 2016
J Model D Model407417
Motor Coach Share: 2016 market ~2,400 units
Belgium & MacedoniaPrivately owned
Quebec and New York
TurkeyOwned by Sabanchi Group
Spain US
Mexico
Owned by Volvo Truck & Bus
Negligible Deliveries to date
Source: New Flyer Database & Management Estimates
8
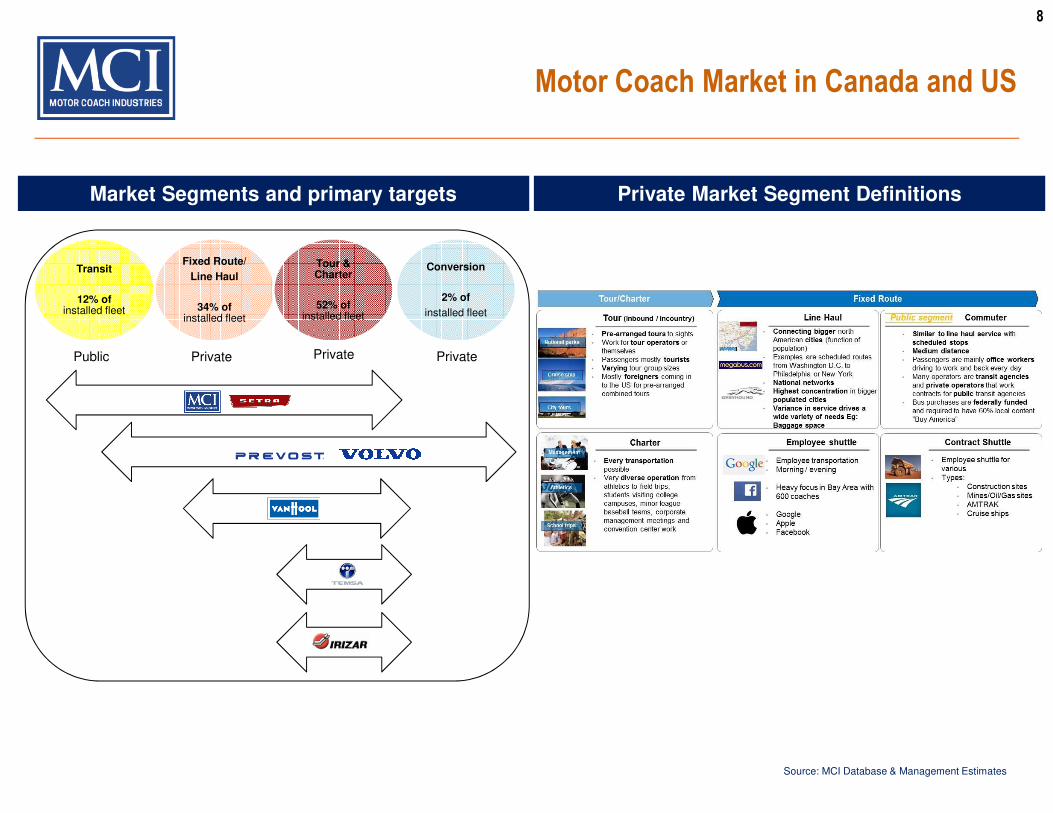
Motor Coach Market in Canada and US
Market Segments and primary targets
Transit
12% of installed fleet
Fixed Route/
Line Haul
34% of installed fleet
Tour & Charter
52% of installed fleet
Conversion
2% of
installed fleet
Public Private Private Private
Source: MCI Database & Management Estimates
Private Market Segment Definitions
9
-
5,000
10,000
15,000
20,000
25,00012
-Jan
-09
12-J
an-1
0
12-J
an-1
1
12-J
an-1
2
12-J
an-1
3
12-J
an-1
4
12-J
an-1
5
12-J
an-1
6
12-J
an-1
7
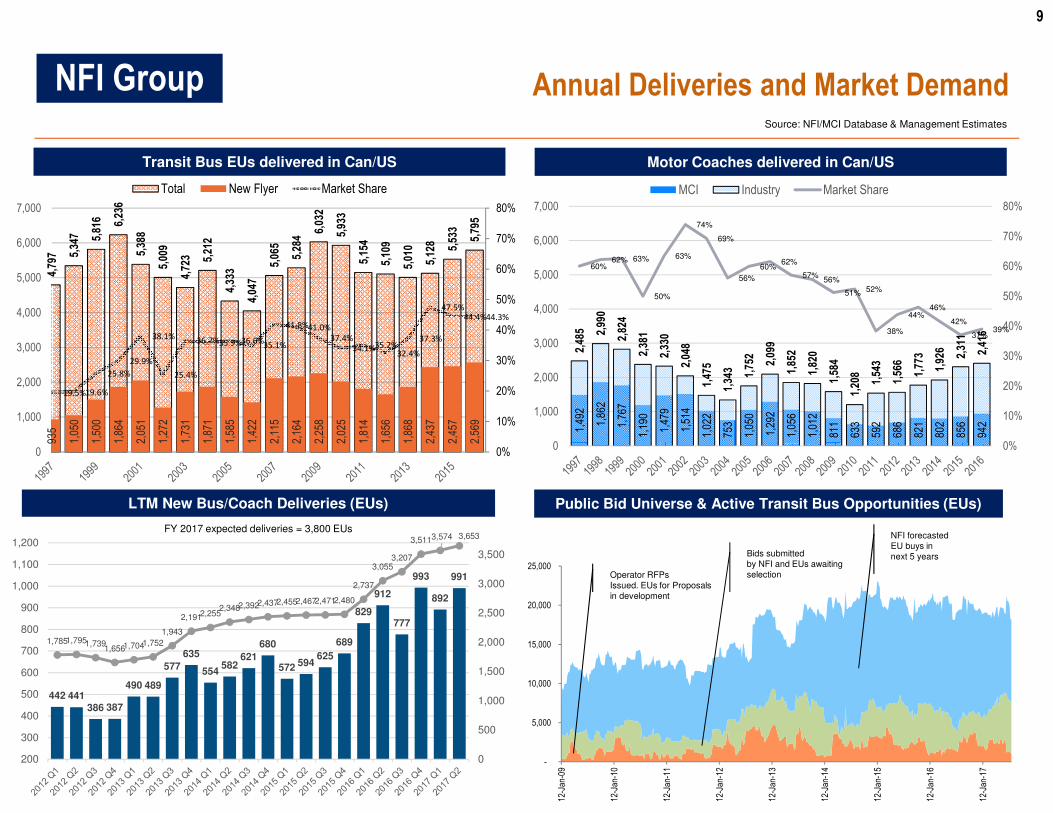
Annual Deliveries and Market Demand
Transit Bus EUs delivered in Can/US Motor Coaches delivered in Can/US
Public Bid Universe & Active Transit Bus Opportunities (EUs)
NFI forecasted EU buys in next 5 yearsBids submitted
by NFI and EUs awaiting selectionOperator RFPs
Issued. EUs for Proposals in development
Source: NFI/MCI Database & Management Estimates
1,49
2
1,86
2
1,76
7
1,19
0
1,47
9
1,51
4
1,02
2
753
1,05
0
1,29
2
1,05
6
1,01
2
811
633
592
686
821
802
856
942
2,48
5 2,99
0
2,82
4
2,38
1
2,33
0
2,04
8
1,47
5
1,34
3 1,75
2
2,09
9
1,85
2
1,82
0
1,58
4
1,20
8
1,54
3
1,56
6
1,77
3
1,92
6
2,31
1
2,41
6
60%62% 63%
50%
63%
74%
69%
56%
60%62%
57%56%
51% 52%
38%
44%46%
42%
37%39%
0%
10%
20%
30%
40%
50%
60%
70%
80%
0
1,000
2,000
3,000
4,000
5,000
6,000
7,000
MCI Industry Market Share
4,79
7 5,34
7 5,81
6 6,23
6
5,38
8
5,00
9
4,72
3 5,21
2
4,33
3
4,04
7
5,06
5
5,28
4
6,03
2
5,93
3
5,15
4
5,10
9
5,01
0
5,12
8 5,53
3
5,79
5
935
1,05
0
1,50
0
1,86
4
2,05
1
1,27
2
1,73
1
1,87
1
1,58
5
1,42
2
2,11
5
2,16
4
2,25
8
2,02
5
1,81
4
1,65
6
1,86
8
2,43
7
2,45
7
2,56
9
19.5%19.6%
25.8%
29.9%
38.1%
25.4%
36.7%35.9%36.6%35.1%
41.8%41.0%
37.4%
34.1%35.2%
32.4%
37.3%
47.5%
44.4%44.3%
0%
10%
20%
30%
40%
50%
60%
70%
80%
0
1,000
2,000
3,000
4,000
5,000
6,000
7,000
Total New Flyer Market Share
LTM New Bus/Coach Deliveries (EUs)
442 441386 387
490 489
577
635
554582
621
680
572 594625
689
829
912
777
993
892
991
1,7851,7951,7391,6561,7041,752
1,943
2,1912,2552,3482,3922,4372,4552,4672,4712,480
2,737
3,0553,207
3,5113,574 3,653
0
500
1,000
1,500
2,000
2,500
3,000
3,500
200
300
400
500
600
700
800
900
1,000
1,100
1,200
NFI Group
FY 2017 expected deliveries = 3,800 EUs
10
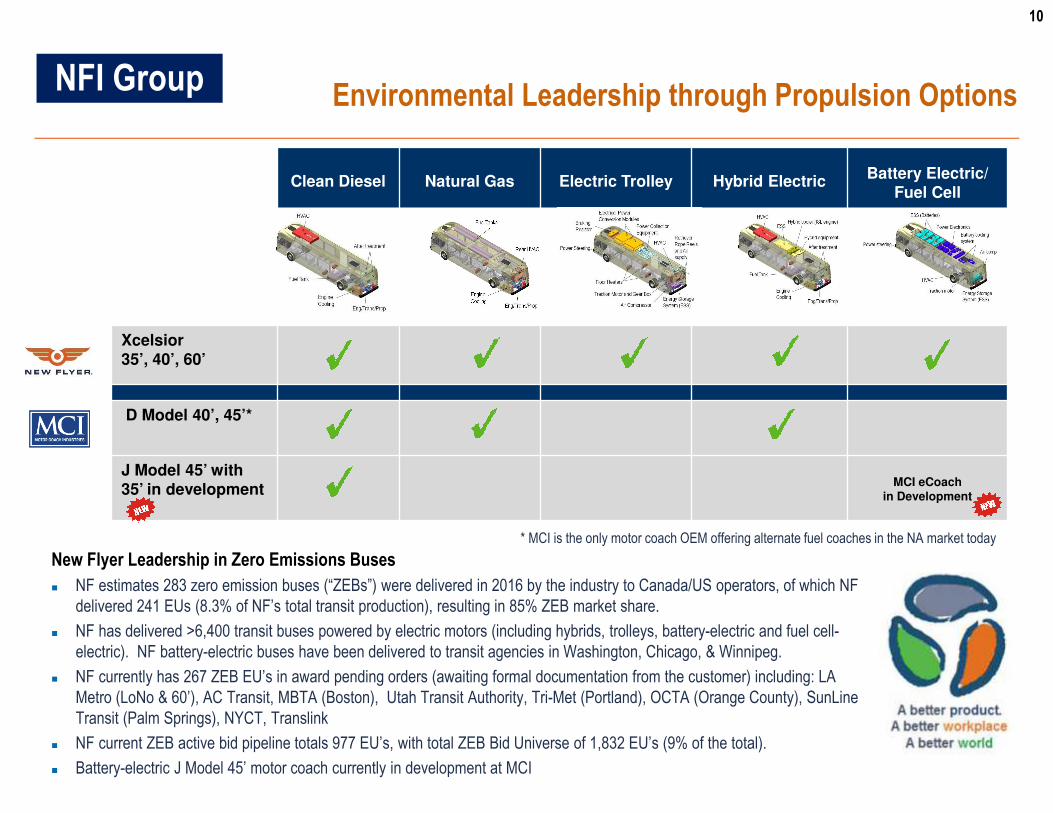
Clean Diesel Natural Gas Electric Trolley Hybrid ElectricBattery Electric/
Fuel Cell
Xcelsior35’, 40’, 60’
D Model 40’, 45’*
J Model 45’ with 35’ in development
MCI eCoachin Development
Environmental Leadership through Propulsion OptionsNFI Group
New Flyer Leadership in Zero Emissions Buses
� NF estimates 283 zero emission buses (“ZEBs”) were delivered in 2016 by the industry to Canada/US operators, of which NF
delivered 241 EUs (8.3% of NF’s total transit production), resulting in 85% ZEB market share.
� NF has delivered >6,400 transit buses powered by electric motors (including hybrids, trolleys, battery-electric and fuel cell-
electric). NF battery-electric buses have been delivered to transit agencies in Washington, Chicago, & Winnipeg.
� NF currently has 267 ZEB EU’s in award pending orders (awaiting formal documentation from the customer) including: LA
Metro (LoNo & 60’), AC Transit, MBTA (Boston), Utah Transit Authority, Tri-Met (Portland), OCTA (Orange County), SunLine
Transit (Palm Springs), NYCT, Translink
� NF current ZEB active bid pipeline totals 977 EU’s, with total ZEB Bid Universe of 1,832 EU’s (9% of the total).
� Battery-electric J Model 45’ motor coach currently in development at MCI
* MCI is the only motor coach OEM offering alternate fuel coaches in the NA market today
11
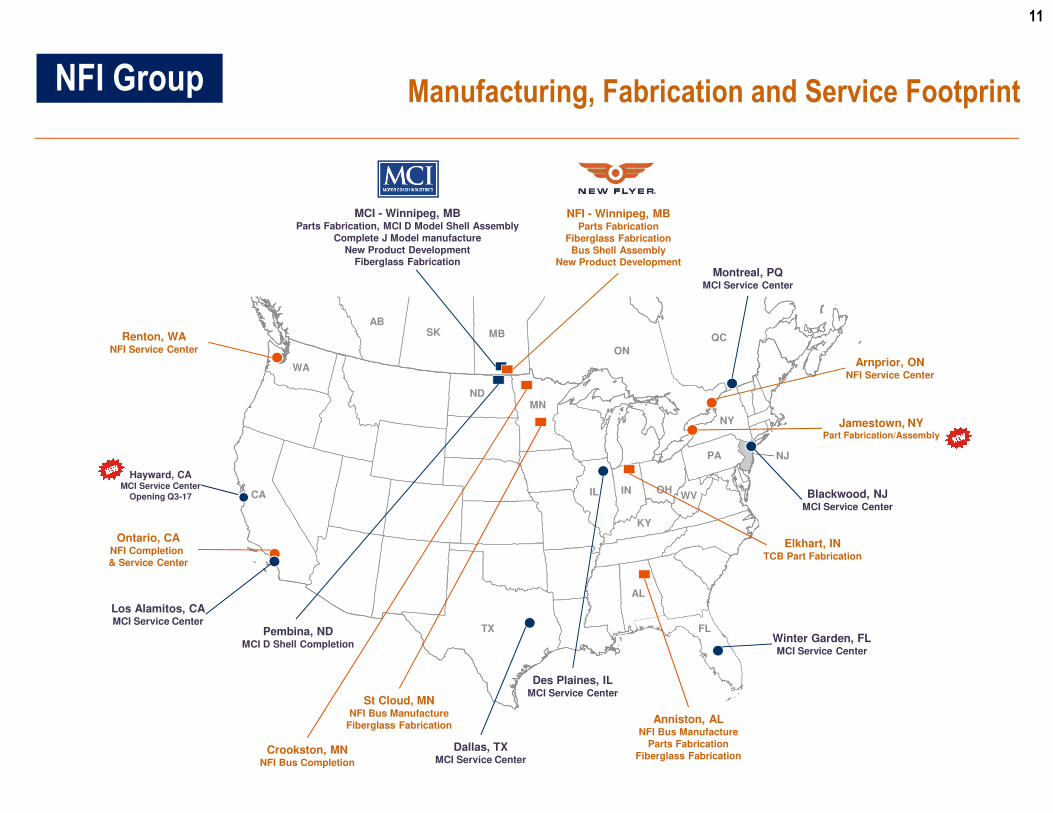
Manufacturing, Fabrication and Service Footprint
`
FL
AL
TX
CA
NDMN
IL IN OH
KY
WV
PA
NY
NJ
SK MB
ON
QC
AB
Renton, WANFI Service Center
Ontario, CANFI Completion & Service Center
Crookston, MNNFI Bus Completion
St Cloud, MNNFI Bus Manufacture
Fiberglass FabricationAnniston, AL
NFI Bus ManufactureParts Fabrication
Fiberglass Fabrication
Elkhart, INTCB Part Fabrication
Arnprior, ONNFI Service Center
NFI - Winnipeg, MBParts Fabrication
Fiberglass FabricationBus Shell Assembly
New Product Development
MCI - Winnipeg, MBParts Fabrication, MCI D Model Shell Assembly
Complete J Model manufactureNew Product Development
Fiberglass FabricationMontreal, PQ
MCI Service Center
Blackwood, NJMCI Service Center
Winter Garden, FLMCI Service Center
Dallas, TXMCI Service Center
Los Alamitos, CAMCI Service Center
Pembina, NDMCI D Shell Completion
Des Plaines, ILMCI Service Center
Jamestown, NYPart Fabrication/Assembly
+
Hayward, CAMCI Service Center
Opening Q3-17
NFI Group
WA

12
The Industry’s most comprehensive Parts offering+
� Widest bus and motor coach product inventory, industry leading distribution network with shortest delivery times.
� Added value through unique offerings (Kits, Mid-life upgrade programs, Vendor Managed Inventory, KanBan, etc).
� New MCI website offering state of the art on-line sales and distribution features.
13
548 641 707 712
1,078 1,1706.2%
8.6%
8.5%12.2%
14.3% 14.9%
0%
2%
4%
6%
8%
10%
12%
14%
16%
0
200
400
600
800
1000
1200
1400
2012 2013 2014 2015 2016 2017 Q2 LTM
Millio
ns
Average Invested Capital for the period Return on Invested Capital
746
9841,132 1,217
1,865 1,951
119
215
319322
409368
0
500
1000
1500
2000
2500
2012 201 3 2014 2015 201 6 2017 Q2 LTM
Bus Aftermarket
4164 57
90
208 221
20
31 50
61
8176
0
50
100
150
200
250
300
350
2012 2013 2014 2015 2016 2017 Q2 LTM
Bus Aftermarket
ROIC = Net operating profit after taxAverage invested capital for the period
Financial Performance
Sales ($M US) Adjusted EBITDA ($M US)
Return on Invested Capital
+
61
95 107
151
289
1,199
1,4511,539
2,274
Quarterly Adjusted EBITDA ($M US)
2972,320
865
16 16 14 14 15 1824 37 20 27 26 35 31 39 36
45
6880
6477 71
85
75 7163 61 59 61
71
95 99108 110 107
119131
141151
188
229
257
289 292 297
020406080
100120140160180200220240260280300
2012 2013 2014 2015 2016 2017
Mill
ions
Adjusted EBITDA LTM Adjusted EBITDA
NFI Group
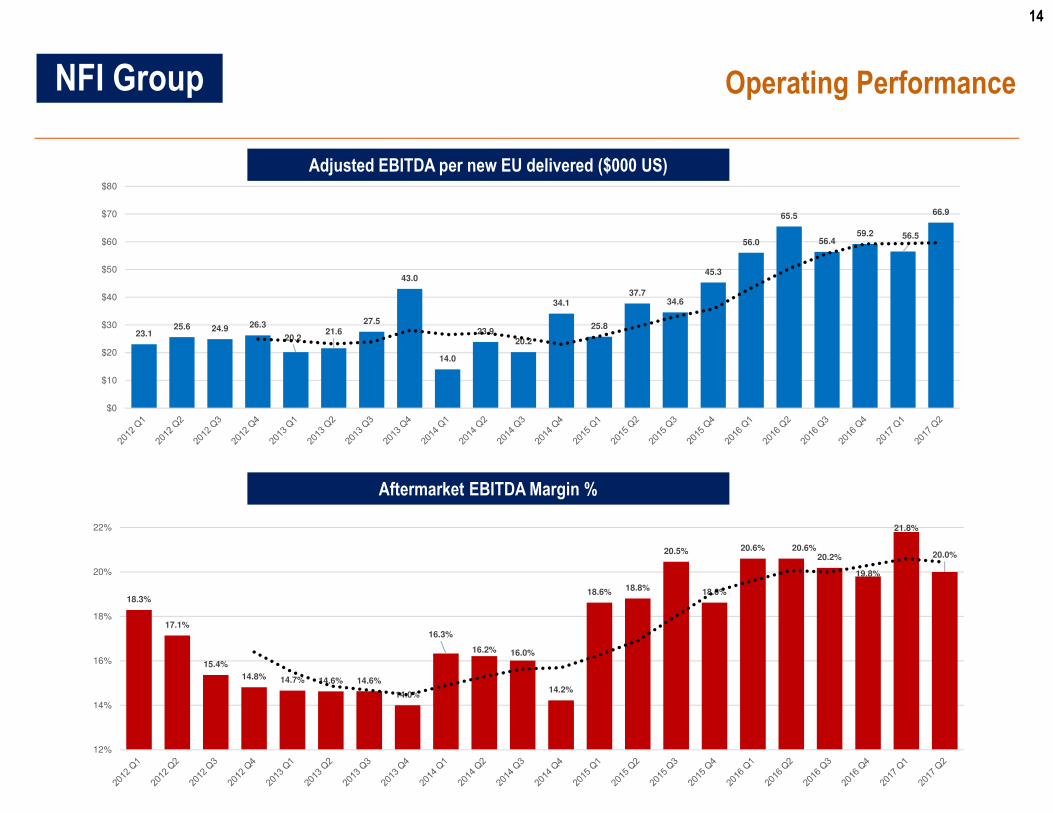
14
Operating Performance
Adjusted EBITDA per new EU delivered ($000 US)
Aftermarket EBITDA Margin %
23.125.6 24.9 26.3
20.221.6
27.5
43.0
14.0
23.920.2
34.1
25.8
37.734.6
45.3
56.0
65.5
56.459.2 56.5
66.9
$0
$10
$20
$30
$40
$50
$60
$70
$80
18.3%
17.1%
15.4%
14.8% 14.7% 14.6% 14.6%
14.0%
16.3%
16.2% 16.0%
14.2%
18.6% 18.8%
20.5%
18.6%
20.6% 20.6%20.2%
19.8%
21.8%
20.0%
12%
14%
16%
18%
20%
22%
NFI Group
15
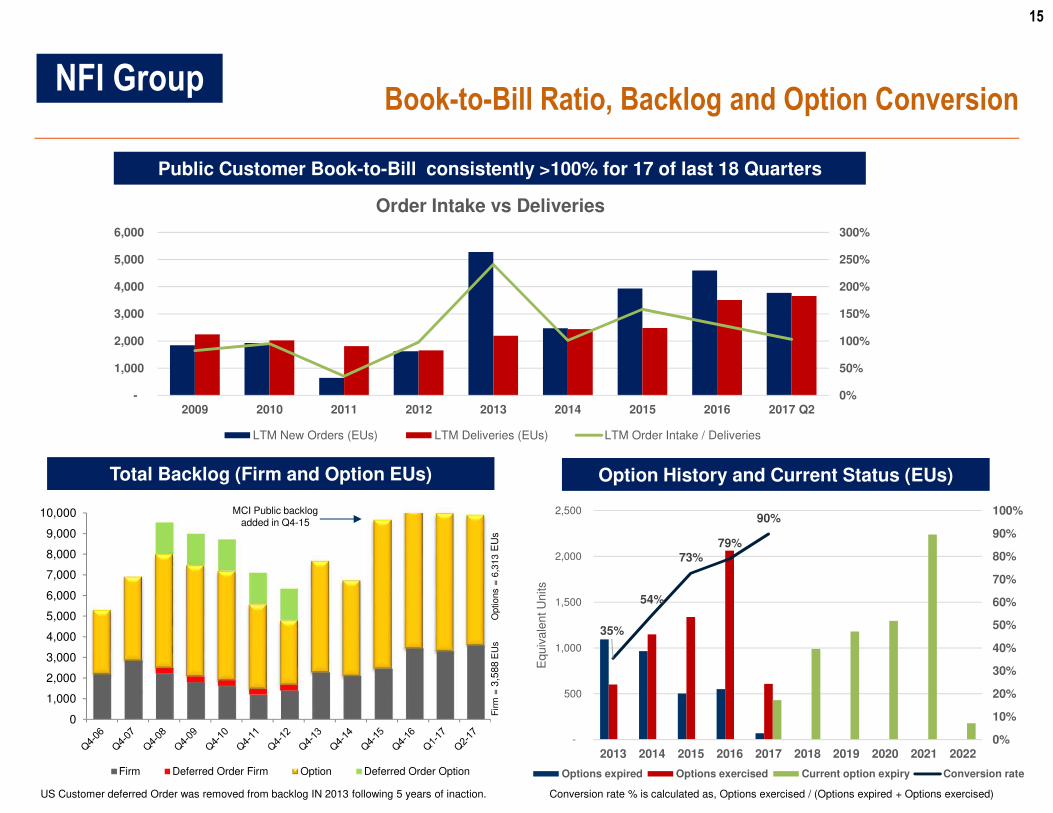
Book-to-Bill Ratio, Backlog and Option Conversion
Public Customer Book-to-Bill consistently >100% for 17 of last 18 Quarters
Total Backlog (Firm and Option EUs)
US Customer deferred Order was removed from backlog IN 2013 following 5 years of inaction.
Firm
= 3
,588
EU
sO
ptions =
6,3
13 E
Us
0
1,000
2,000
3,000
4,000
5,000
6,000
7,000
8,000
9,000
10,000
Firm Deferred Order Firm Option Deferred Order Option
Option History and Current Status (EUs)
Conversion rate % is calculated as, Options exercised / (Options expired + Options exercised)
35%
54%
73%79%
90%
0%
10%
20%
30%
40%
50%
60%
70%
80%
90%
100%
-
500
1,000
1,500
2,000
2,500
2013 2014 2015 2016 2017 2018 2019 2020 2021 2022
Eq
uiv
ale
nt U
nits
Options expired Options exercised Current option expiry Conversion rate
MCI Public backlog added in Q4-15
0%
50%
100%
150%
200%
250%
300%
-
1,000
2,000
3,000
4,000
5,000
6,000
2009 2010 2011 2012 2013 2014 2015 2016 2017 Q2
Order Intake vs Deliveries
LTM New Orders (EUs) LTM Deliveries (EUs) LTM Order Intake / Deliveries
NFI Group
16
Cash Flow Performance
Free Cash Flow and Dividends (C $M)2017 Q2 LTM Adjusted EBITDA to Free Cash Flow ($M)
297.2
19.9
90.5
31.4 3.8 0.4
151.9
48.6 200.5
-
50
100
150
200
250
300
350
+
Free Cash Flow and Dividends ($US)
0.610.87
1.18
1.95
3.64
3.26
0.81
0.210.48
0.97
2.1
2.4
$0.00
$0.50
$1.00
$1.50
$2.00
$2.50
$3.00
$3.50
$4.00
2012 2013 2014 2015 2016 2017 Q2LTM
Free Cash Flow per share (C$) Earnings per share (US$)
Free Cash Flow and Net Earnings ($/share)
27.145.1
65.5
108.3
216.3200.5
33.1 30.7 32.5 33.854.0 64.5
0.0
50.0
100.0
150.0
200.0
250.0
2012 2013 2014 2015 2016 2017 Q2 LTM
Free Cash Flow Dividends
27.1
43.4
59.1
83.4
165.2151.9
33.1 29.6 29.3 26.3
41.149.1
45%46%
55% 55%57%
51%
0%
10%
20%
30%
40%
50%
60%
70%
80%
$0
$50
$100
$150
$200
2012 2013 2014 2015 2016 2017 Q2LTM
Free Cash Flow ("FCF") Dividends Declared FCF as a % of Adjusted EBITDA
NFI Group
17
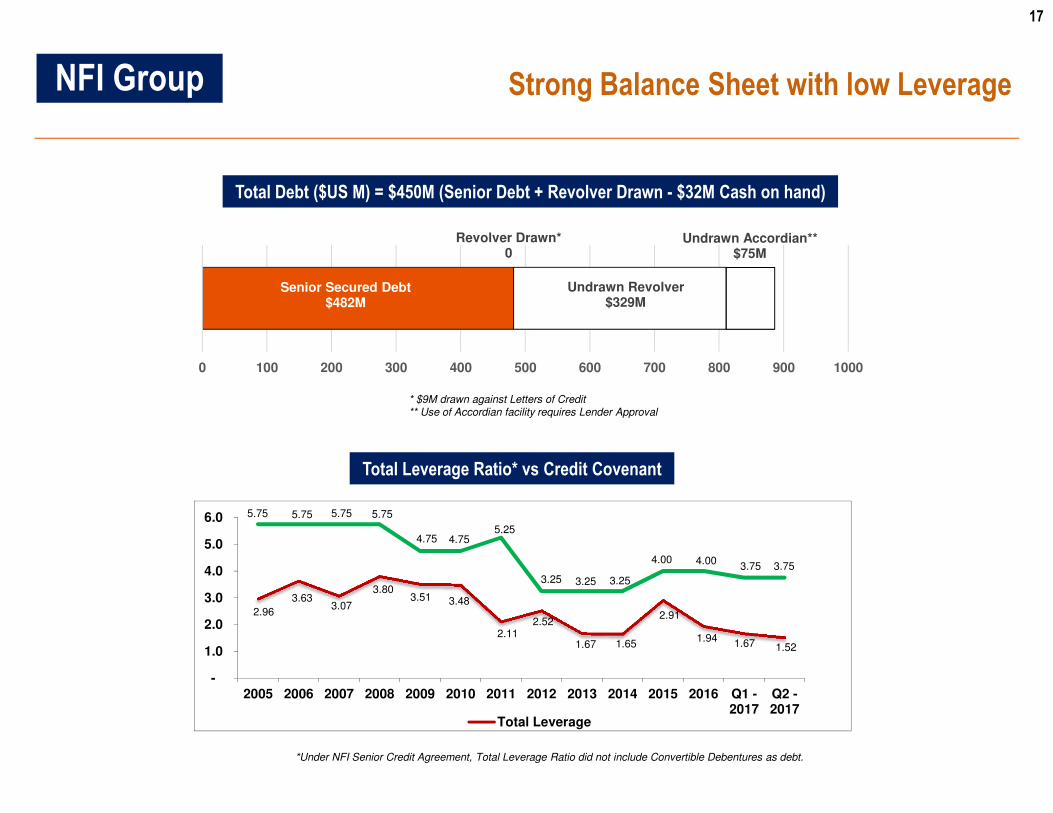
Strong Balance Sheet with low Leverage
*Under NFI Senior Credit Agreement, Total Leverage Ratio did not include Convertible Debentures as debt.
Total Debt ($US M) = $450M (Senior Debt + Revolver Drawn - $32M Cash on hand)
Total Leverage Ratio* vs Credit Covenant
+NFI Group
Senior Secured Debt$482M
Revolver Drawn*0
Undrawn Revolver$329M
Undrawn Accordian**$75M
0 100 200 300 400 500 600 700 800 900 1000
2.96
3.633.07
3.80 3.51 3.48
2.11 2.52
1.67 1.65
2.91
1.94 1.67 1.52
5.75 5.75 5.75 5.75
4.75 4.75 5.25
3.25 3.25 3.25
4.00 4.00 3.75 3.75
-
1.0
2.0
3.0
4.0
5.0
6.0
2005 2006 2007 2008 2009 2010 2011 2012 2013 2014 2015 2016 Q1 -2017
Q2 -2017
Total Leverage
* $9M drawn against Letters of Credit ** Use of Accordian facility requires Lender Approval
18
� New US Administration focus on Infrastructure spending, US economic health and tax
reform could assist with further rejuvenation of the aging transit bus/motor coach fleet
� New Canadian government commitment to federal spending on transit infrastructure
� Proven LEAN manufacturing and OpEx expertise deployment continues company-wide
which has cost reduction and working capital benefits, plus improved competitiveness
� Significant progress made with additional investments planned for critical parts fabrication
� New product offerings in development (35’ coach, battery-electric transit buses and motor
coaches announced). Ground breaking innovation soon to launch for accessible
community segment in motor coach. Vehicle Innovation Centre to launched in Q4-17.
� Potential for synergies resulting from common IT platform across NFI and MCI (in process)
� Potential to grow market share in both core bus (NF) and coach (MCI) OEM segments
� Potential for additional aftermarket share with added cost reduction and working capital
benefits from combining NFI and MCI parts businesses into one (in process)
� Continue M&A opportunities being investigated: Vertical (part fabrication, supply chain and
aftermarket) and Horizontal (other bus types or other bus markets)
Opportunities for Growth and Margin Enhancement+NFI Group
19
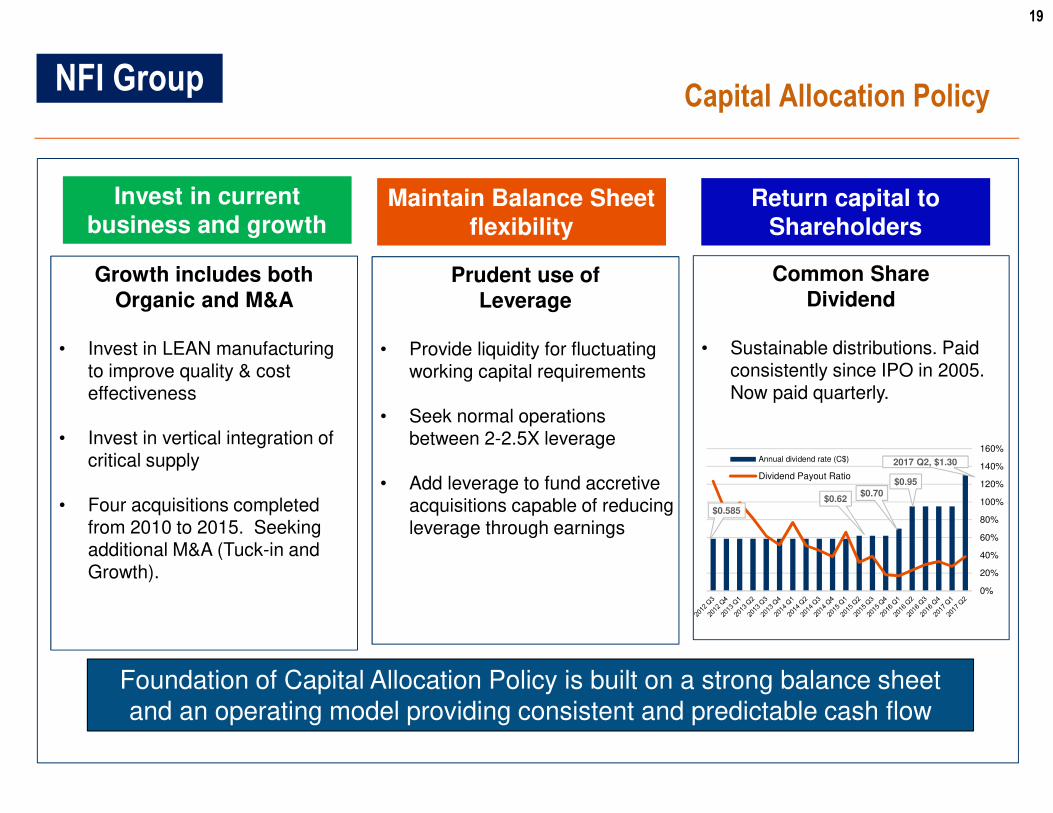
Capital Allocation Policy+
Invest in current business and growth
Maintain Balance Sheet flexibility
Return capital to Shareholders
Growth includes both Organic and M&A
• Invest in LEAN manufacturing to improve quality & cost effectiveness
• Invest in vertical integration of critical supply
• Four acquisitions completed from 2010 to 2015. Seeking additional M&A (Tuck-in and Growth).
Prudent use of Leverage
• Provide liquidity for fluctuating working capital requirements
• Seek normal operations between 2-2.5X leverage
• Add leverage to fund accretive acquisitions capable of reducing leverage through earnings
Common Share Dividend
• Sustainable distributions. Paid consistently since IPO in 2005. Now paid quarterly.
Foundation of Capital Allocation Policy is built on a strong balance sheet and an operating model providing consistent and predictable cash flow
$0.585
$0.62$0.70
$0.95
2017 Q2, $1.30
0%
20%
40%
60%
80%
100%
120%
140%
160%Annual dividend rate (C$)
Dividend Payout Ratio
NFI Group
20
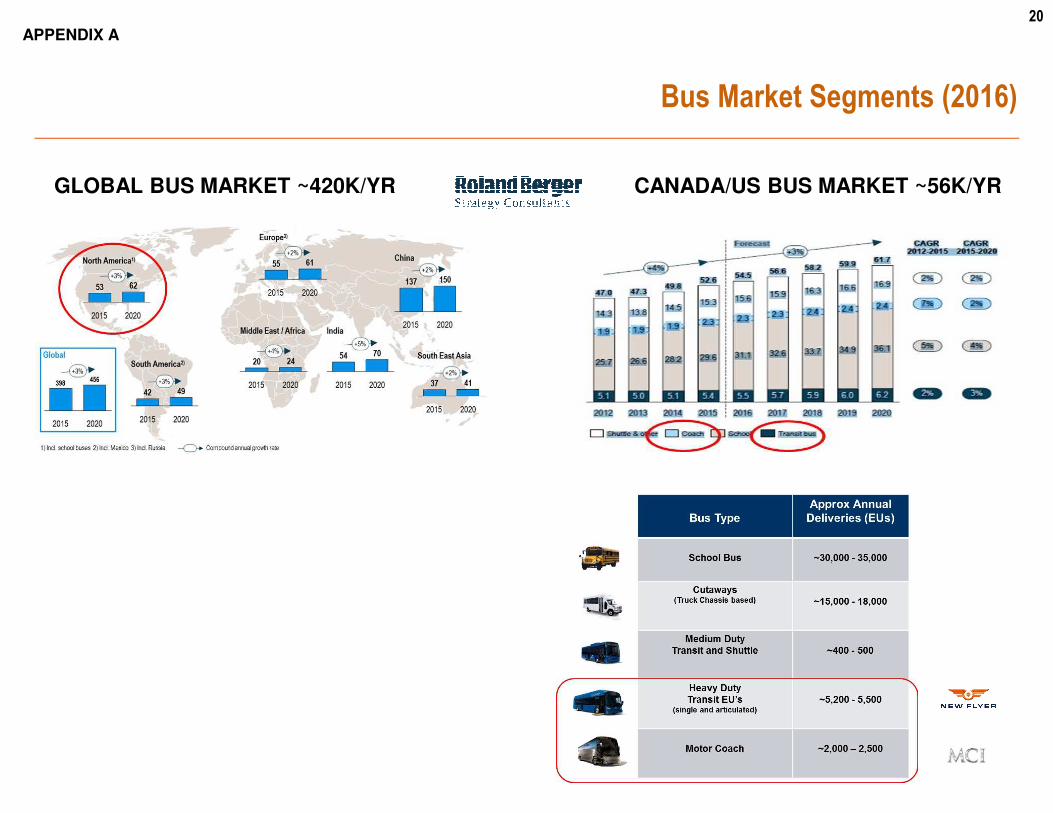
GLOBAL BUS MARKET ~420K/YR CANADA/US BUS MARKET ~56K/YR
Bus Market Segments (2016)
APPENDIX A
21
FORWARD LOOKING STATEMENTS
This investor presentation contains forward-looking statements relating to expected future events, including the integration of the acquired business into New Flyer’s existing business and expected synergies, the
diversification and growth of the combined bus, motor coach and aftermarket parts businesses. Although the forward-looking statements contained in this investor presentation are based upon what management
believes to be reasonable assumptions, investors cannot be assured that actual results will be consistent with these forward-looking statements, and the differences may be material. Actual results may differ
materially from management expectations as reflected in such forward-looking statements for a variety of reasons, including risks related the ability to implement the operational changes necessary to achieve the
intended synergies, acquisitions, joint ventures and other strategic relationships with third parties (including liabilities relating thereto), the covenants contained in the Company’s new senior credit facilities could
impact the ability of the Company to fund dividends, market and general economic conditions and economic conditions of and funding availability for customers to purchase buses and to purchase parts or services,
customers may not exercise options to purchase additional buses, the ability of customers to suspend or terminate contracts for convenience and the other risks and uncertainties discussed in the materials filed with
the Canadian securities regulatory authorities and available on SEDAR at www.sedar.com. Due to the potential impact of these factors, the Company disclaims any intention or obligation to update or revise any
forward-looking statements, whether as a result of new information, future events or otherwise, unless required by applicable law.
FINANCIAL TERMS, DEFINITIONS AND CONDITIONS
References to “EBITDA” are to earnings before interest, income taxes, depreciation and amortization, gains or losses on disposal of property, plant and equipment and unrealized foreign exchange losses or gains
on non-current monetary items. References to “Adjusted EBITDA” are to EBITDA after adjusting for: the effects of certain non-recurring and/or non-operations related items that have impacted the business and are
not expected to recur, including non-recurring costs relating to business acquisitions, product rationalization costs, impairment loss on equipment and intangible assets, equity settled stock-based compensation, fair
value adjustment to MCI’s inventory and deferred revenue, proportion of the total return swap realized, loss on derecognition of long-term debt and costs associated with assessing strategic and corporate initiatives.
Return on Invested Capital “ROIC” is calculated by dividing Net Operating Profit After Tax by Average Invested Capital for the period. References to “Net Operating Profit After Tax” are to Adjusted EBITDA less
depreciation of plant and equipment and income taxes. References to “Invested Capital” are to shareholders’ equity plus long-term debt, obligations under finance leases, other long-term liabilities, convertible
debentures and derivative financial instrument liabilities less cash.
Management believes EBITDA, Adjusted EBITDA, ROIC and Free Cash Flow (as defined below) are useful measures in evaluating the performance of the Company. “Free Cash Flow” means net cash generated by
operating activities adjusted for changes in non-cash working capital items, interest paid, interest expense, income taxes paid, current income tax expense, effect of foreign currency rate on cash, defined benefit
funding, non-recurring transitional costs relating to business acquisitions, costs associated with assessing strategic and corporate initiatives, product rationalization costs, defined benefit expense, cash capital
expenditures, fair value adjustment to MCI’s inventory and deferred revenue, proceeds from disposition of property, plant and equipment, gain received on total return swap settlement, proportion of the total return
swap realized and principal payments on capital leases. However, EBITDA, Adjusted EBITDA, ROIC and Free Cash Flow are not recognized earnings measures and do not have standardized meanings prescribed
by IFRS. Readers of this presentation are cautioned that EBITDA, Adjusted EBITDA and ROIC should not be construed as an alternative to net earnings or loss determined in accordance with IFRS as an indicator of
New Flyer's performance, and Free Cash Flow should not be construed as an alternative to cash flows from operating, investing and financing activities determined in accordance with IFRS as a measure of liquidity
and cash flows. A reconciliation of net earnings and cash flow to EBITDA and Adjusted EBITDA, based on the Financial Statements, has been presented In Management’s Discussion and Analysis of Financial
Condition under the heading “Reconciliation of Net Earnings to EBITDA and Adjusted EBITDA” and “Reconciliation of Cash Flow to EBITDA and Adjusted EBITDA”, respectively. A reconciliation of Free Cash Flow to
cash flows from operations is provided under the heading “Summary of Free Cash Flow”.
New Flyer’s method of calculating EBITDA, Adjusted EBITDA, ROIC and Free Cash Flow may differ materially from the methods used by other issuers and, accordingly, may not be comparable to similarly titled
measures used by other issuers. Dividends paid from Free Cash Flow are not assured, and the actual amount of dividends received by holders of Shares will depend on, among other things, the Company's financial
performance, debt covenants and obligations, working capital requirements and future capital requirements, all of which are susceptible to a number of risks, as described in New Flyer’s public filings available on
SEDAR at www.sedar.com.
All figures are in U.S. dollars unless otherwise noted.
FORWARD LOOKING STATEMENTS, FINANCIAL TERMS, DEFINITIONS AND CONDITIONS
+
APPENDIX B