BLUEPRINT PEEL REGIONAL INVESTMENT BLUEPRINT PROGRESSIVEPROSPEROUS DYNAMIC.

Nexus of Energy, Water and Land Use: A Blueprint for
Sustainable Urban Systems
Symposium 23. Safe, Resilient, and Sustainable Communities12th National Conference on Science, Policy and the Environment
January 18-20, 2012Washington, D.C.
John C. Crittenden, Ph.D., P.E., N.A.E.
Director of the Brook Byers Institute for Sustainable SystemsHightower Chair and GRA Eminent Scholar in Sustainable Systems
Professor, School of Civil & Environmental EngineeringGeorgia Institute of Technology
Atlanta, GA 30332

Sustainable Urban Systems• We need to recreate the anthrosphere to exist within the means
of nature. That is, use renewable resources that nature provides and generate waste nature can assimilate without overwhelming natural cycles.
• This will require us to examine the interactions between the natural, engineered, social and economic systems.

Sustainable Urban Systems• Generate waste that nature can assimilate without
overwhelming natural cycles.• Need to look at fate of toxics, Nitrogen, Phosphorus,
Water, Carbon, etc. cycles.• Lets look at Carbon.

IEA BLUE MAP SCENARIOFOR 2050

Key technologies to reduce Global CO2emissions
Source: Energy Technology Perspectives 2010, Key Graphs, IEA 2010
3.2 Gt C/yr
8 Gt C/yr

Additional investment needs: BLUE Map vs. Baseline ($48 Trillion, 2% GDP)
Source: Energy Technology Perspectives 2010, Key Graphs, IEA 2010
$12 T $1 T$7 T$28 T
Transport is the most important category!

Sustainable Urban Systems
• Use renewable resources that nature provides.• Of the 14 gigatons/year of material is used in
world economy and only 5% is renewable

Resource Consumption for Material Production (Energy Required for top 7 materials 1.5 TW - ~10% of total global energy use)
Credit: Mike Ashby
*Ratio based on mix design for 30 MPa compressive strength at 28 days (http://www.ctre.iastate.edu/pubs/sustainable/strublesustainable.pdf)
538 GW
121 GW
340 GW*
44.4 GW18.5 GW
8.72 GW
435 GW
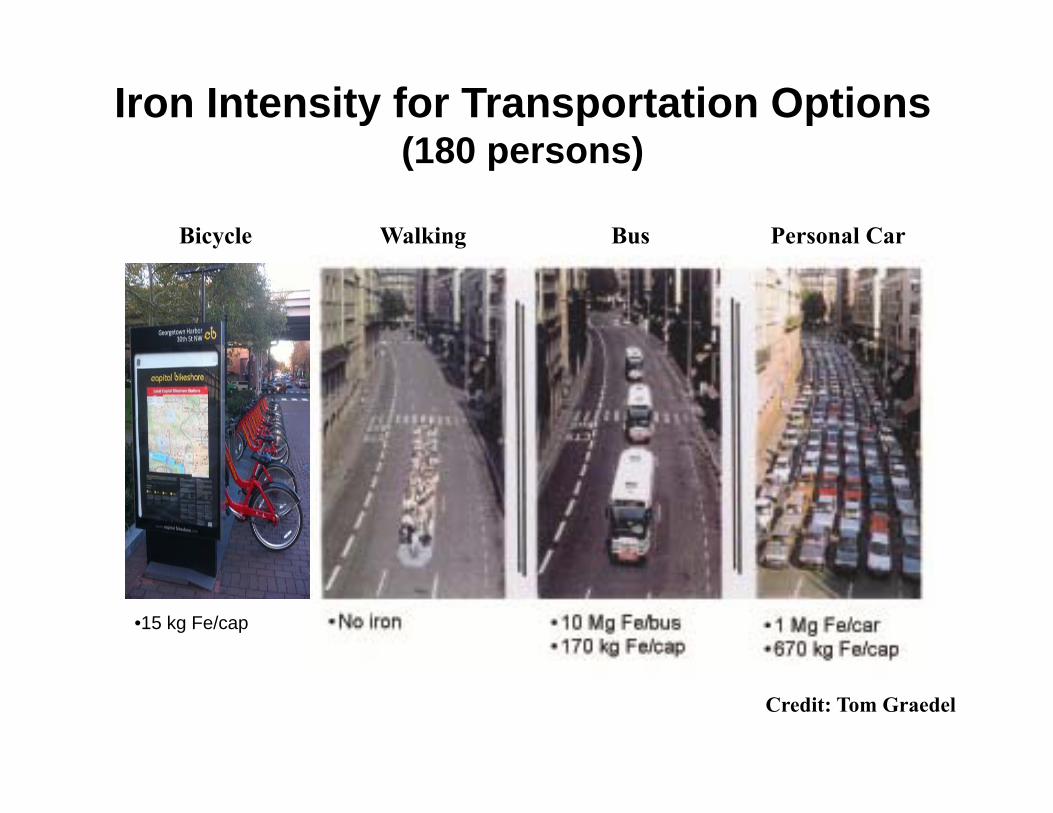
Iron Intensity for Transportation Options (180 persons)
•15 kg Fe/cap
Credit: Tom Graedel
Bicycle Walking Bus Personal Car

Gigaton Problems Need Gigaton Solutions• With 1 billion people using 14 Gt of materials, 12 Gtoe of energy, 2*106 billion Gal of
water and emitting 8 Gt of Carbon per year globally, a shift of scale and paradigm is needed to address the issues of global sustainability.
• From an egalitarian point of view, we should expect this to increase by a factor of 9 for 9 billion people in 2050, if every one has the same life style and uses today's technologies.
• With more than half of the population being urban dwellers, urban infrastructure plays a crucial role in the approach toward sustainability.
• Reduce Childhood mortality as a solution to population growth
0.0
4.0
8.0
12.0
16.0
Population(Total)
Material Use(Gt/yr)
Energy Use (tonof oil equivalent)
Carbon fromfossil fuels(Gt/yr)
Water Use(10Km^3/yr)*
Passenger Cars(Total number of
units)
x 10
9(Giga‐
or Billion)
5% renewable 20% nuclear + renewable
54% of available freshwater

Childhood Mortality and Population Growth
Source: Gapminder.org

Gigaton problems need Gigaton solutions• A substantial fraction of the Gigaton problems derives directly from the
structure and operation of urban infrastructures• Create market incentives or stipulate mandates that get giga-researchers, giga-
investors and giga-entrepreneurs on task
• Thoughts on solving the Gigaton Problem:
• High performance buildings• Efficient power generation• Electrification of transportation• Enhancing ecosystem services and/or avoiding their destruction• Mandates for product performance and take back• Market drivers for energy efficiency ( SEAR 16 versus 13 etc.)• Smart grid• Distributed power and water generation• Biomass reforming to create fuels, commodity chemicals, specialty chemicals• Integrated resource recovery (metals, nutrients, energy etc from waste or shall I say
byproducts)• Implementation of socio-economic policies to favor the market for sustainable
solutions.
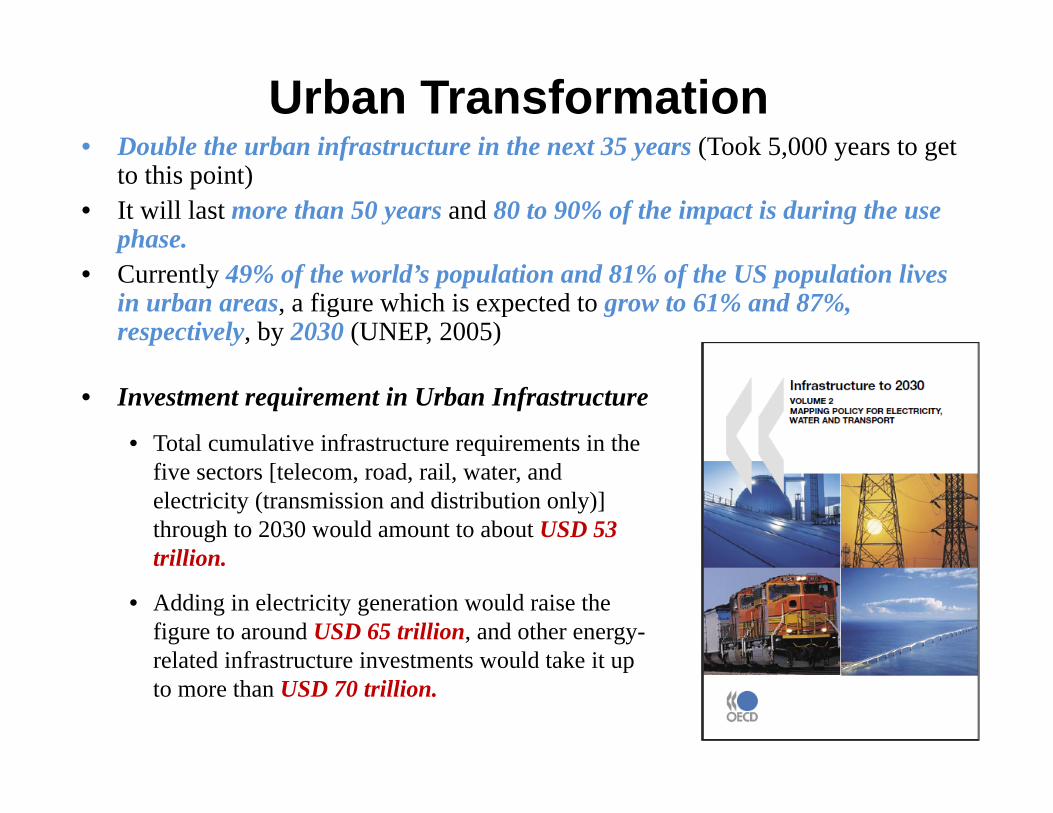
Urban Transformation• Double the urban infrastructure in the next 35 years (Took 5,000 years to get
to this point)• It will last more than 50 years and 80 to 90% of the impact is during the use
phase.• Currently 49% of the world’s population and 81% of the US population lives
in urban areas, a figure which is expected to grow to 61% and 87%, respectively, by 2030 (UNEP, 2005)
• Investment requirement in Urban Infrastructure
• Total cumulative infrastructure requirements in the five sectors [telecom, road, rail, water, and electricity (transmission and distribution only)] through to 2030 would amount to about USD 53 trillion.
• Adding in electricity generation would raise the figure to around USD 65 trillion, and other energy-related infrastructure investments would take it up to more than USD 70 trillion.

The Urban Landscape: A System of SystemsCity
PeopleEconomyTransportationEnergyWater
Waste
BuildingsParks
Government
And many more…
Q: With the next generation of infrastructure, what are the implications if we design, build, and operate these systems separately, as we have done in the past?
Industry
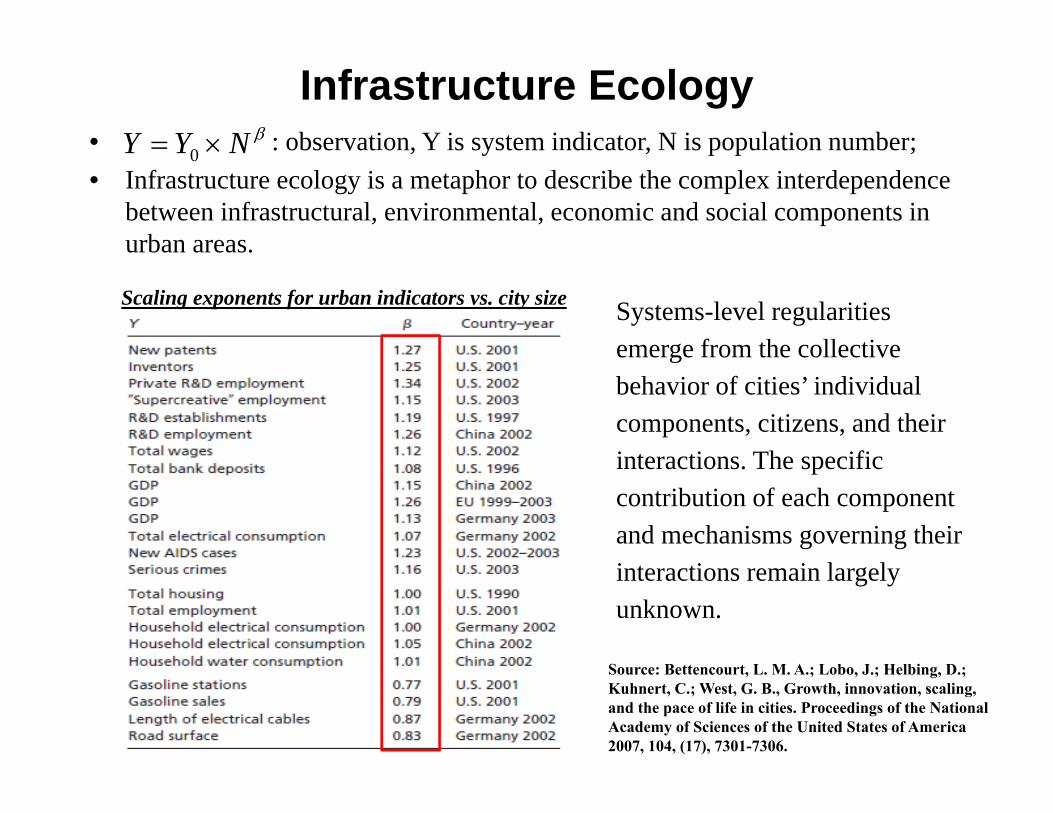
Infrastructure Ecology• : observation, Y is system indicator, N is population number;• Infrastructure ecology is a metaphor to describe the complex interdependence
between infrastructural, environmental, economic and social components in urban areas.
0Y Y N β= ×
Systems-level regularities emerge from the collective behavior of cities’ individual components, citizens, and their interactions. The specific contribution of each component and mechanisms governing their interactions remain largely unknown.
Scaling exponents for urban indicators vs. city size
Source: Bettencourt, L. M. A.; Lobo, J.; Helbing, D.; Kuhnert, C.; West, G. B., Growth, innovation, scaling, and the pace of life in cities. Proceedings of the National Academy of Sciences of the United States of America 2007, 104, (17), 7301-7306.

Interdependence of Different Infrastructure Components

Combined Heat and Power GenerationIn the U.S., combined heat and power • Accounted for 7% of U.S. electricity generation capacity as in 1999.• Had a typical system efficiency of 68%, with some new systems exceeding 90%.• Emitted on average 1/10 of the nitrogen oxides (NOX) per kWh of average utility grid
electricity.
Source: http://www.aceee.org/energy/chp.htm
• Could potentially provide
• 20% of U.S. electricity by 2030, &
• reduce CO2 emissions by 0.2 Gt-C annually
• EU27 produced 366 TWh of CHP electricity , i.e. 11% of the total electricity generation in 2007 .
• Combined Cycle Natural Gas is 60% Efficient – Georgia power retiring 500 MW plant and building 2500 MW at McDonough.
Separate Electric Power
Combined Heat and Power
Total Loss
Sources:US EIA database; http://europa.eu/legislation_summaries/energy/energy_efficiency/l27021_en.htm

Perkins + Will, Atlanta Office• LEED Platinum Building:
– Microturbines are used to for heating and cooling using Adsorption Chillers– Radiant heating floors system– Microturbines also supply 40% of the total electricity
Adsorption Chiller65 kW Microturbine Perkins+Will Office Building

Combined Heat and Power (CHP) GW scale: ~ 1 million homes
Credit: Valerie Thomas.
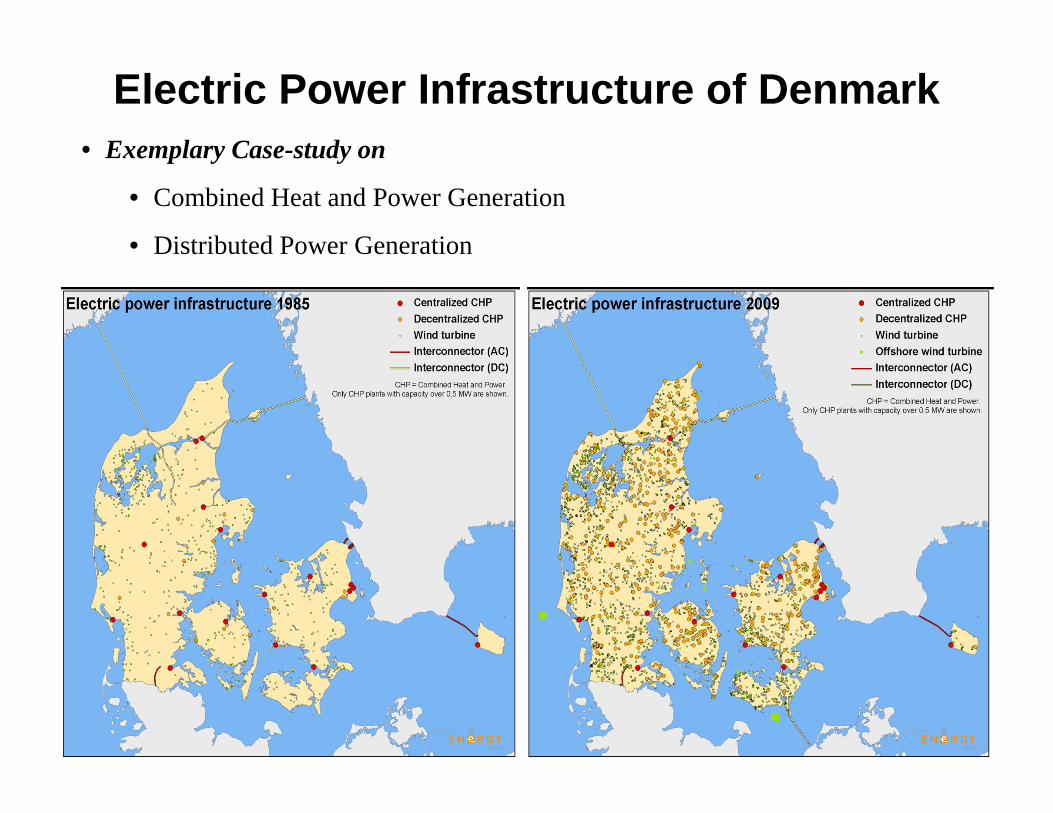
Electric Power Infrastructure of Denmark• Exemplary Case-study on
• Combined Heat and Power Generation
• Distributed Power Generation

Electricity Capacity 13409 MW
Wind Turbine Capacity - Share of Total Electricity Capacity 26%
CHP Production - Share of Total Thermal Electricity 55%
CHP Production - Share of Total District Heating Production 77%
• Today all cities and most towns in Denmark are supplied with district heating.• As much as 55% of all electricity produced in Denmark is from CHPs. No other EU
country has such a large share.• About 30% of the fuel is saved in CHP compared to a situation, where heat and
electricity were supplied by separate productions. • Denmark is in the international forefront with regard to modern CHPs with a net
efficiency ratio of 90-98%.• 60% of the total demand for heating of buildings and supply of hot water is covered by
district heating. A remarkable market share compared to other countries.• The annual statistics document that 9 out of 10 families pay less for their district heat
compared to heat from individual supply from oil or gas.• The use of cleaner fuels also matters. The fuels have for decades been diversified ranging
from coal and natural gas to waste and biomass. It is estimated that CHP and district heating has reduced total national CO2-emission by 8-11 Mt per year.
Electric Power Infrastructure of Denmark

73% of the U.S. light duty vehicle fleet (cars, pickup trucks, SUVs, and vans) can be supported by existing electric power infrastructure
43% if only charging vehicles between 6pm-6am
This is equivalent to 52% of the nation’s oil usage (we import 50% of our oil)
27% of total greenhouse gas emissions can be reduced even if we use coal fired power plants
Key driver: overall improvement in efficiency of electricity generation compared to the conversion process from crude oil to gasoline to the combustion in the vehicle
Utility cost (life-cycle) can be reduced between 7%~26%
Electrification of Personal VehiclesPlug-In Hybrid Electric vehicles (PHEVs) (Source: PNNL, 2007)

Plug-in Hybrid Electric Vehicles (PHEVs) andVehicle-to-Grid (V2G) power
Credit: Kempton and Tomić, 2005
PHEVs can send power back to the grid when parked, and function as distributed storage for intermittent energy from renewable sources
US demand-supply balances during maximum demand with various V2G ratios in 2045
30% V2G penetration could reduce ~100 GW or about ⅓ of the total peak demand of ~300 GW in US by 2045
Source: Modelling Load Shifting Using Electric Vehicles in a Smart Grid Environment – © OECD/IEA 2010

Energy for Water in US
0.00
20.00
40.00
60.00
80.00
2000 2010 2020 2050
Wastewater Collection, Treatment and DischargePotable Water Acquisition, Treatment and Supply
Bill
ion
kWh
Water Collection and Treatment* kWh/MGal
Surface Water Treatment 220
Groundwater Treatment 620
Brackish Groundwater Treatment 3,900-9,700
Seawater Desalination 9,700-16,500
Wastewater Treatment** kWh/MGal
Trickling Filter 950
Activated Sludge 1,300
Advanced Treatment without Nitrification
1,500
Advanced Treatment without Nitrification
1,900
Average Energy requirement for different water and wastewater treatment technologies2
*Includes collection but does not include distribution**More advanced treatment require more energy
Energy consumption by Public Water and Wastewater Utilities (in Billion kWh)1
About 4% of the total electricity consumption in US is for water and wastewater sector.
About 19% of the total electricity consumption in California is for water and wastewater sector (average). 1 EPRI, Water & Sustainability, Volume 4, 2002
2 Stillwell, A S, et al. Energy-Water Nexus in Texas, 2009

Energy Saving Potentialunit Water Supply Wastewater Collection and Treatment Stormwater Collection and Treatment
kWh/kgal 1.7 1.83 1.464
Per house unit land useenergy saving from land use and stormwater management
unit BAU BAU + Rooftop rain harvesting
Compact growth
Compact growth + Rooftop rain harvesting
Compact growth + Rooftop& Rain garden harvesting
kgal 0 0.4 0.2 0.5 0.7
Water saving from energy saving (1.65 gal/kwh based on Atlanta’s energy mix)
100 %
64 %83.5 %
56 %40 %
36 %16.5 %
44 %60 %
0
100
200
300
400
500
600
700
800
BAU BAU+ Rooftop rain harvesting
Compact growth Compact growth+ Rooftop rain harvesting
Compact growth+ Rooftop & Rain garden
harvesting
kWh/
yr
Energy Consumption Energy Saving

Water for Energy in US (gal/kW-hr)
0.38 0.49 0.440.32
0.600.47
12.40
55.10 64.8547.42
18.00
4.42
2.33
0.43
7.85
1.65 2.00
0.10
1.00
10.00
100.00
WesternInterconnect
EasternInterconnect
TexasInterconnect
Arizona Georgia US Aggregate
Thermoelectric Hydro Weighted Average
Gal
/kW
h
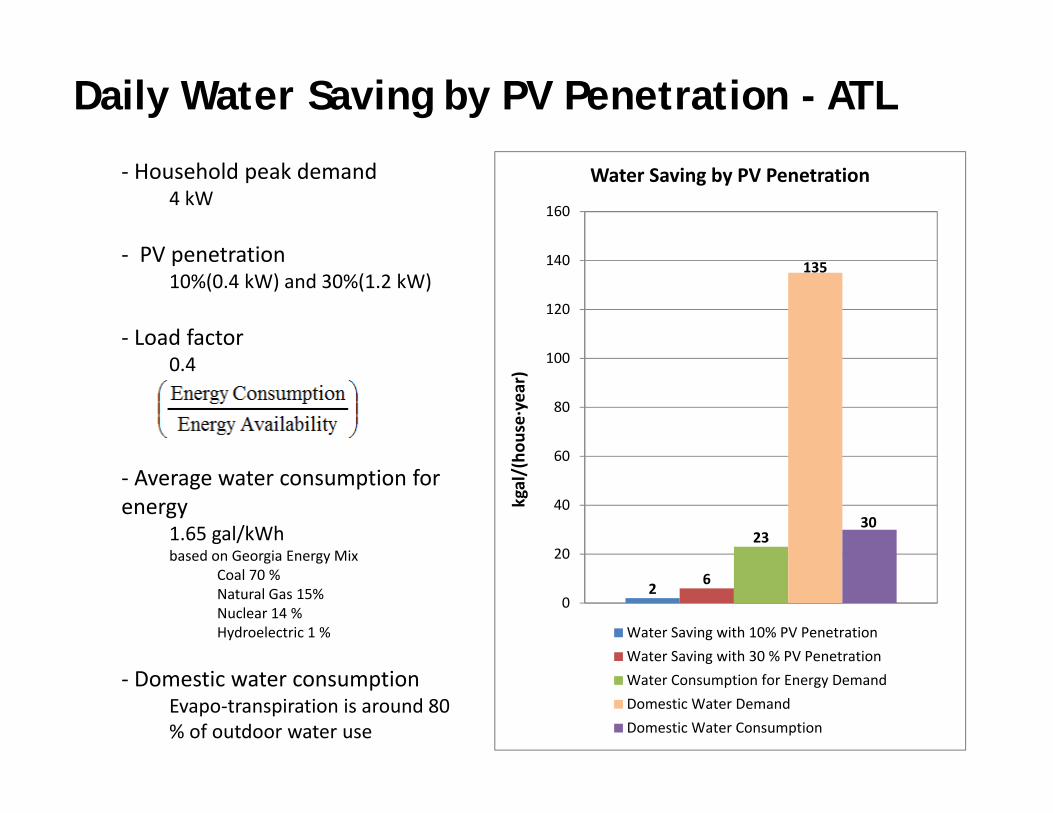
Daily Water Saving by PV Penetration - ATL
‐ Household peak demand 4 kW
‐ PV penetration10%(0.4 kW) and 30%(1.2 kW)
‐ Load factor0.4
‐ Average water consumption for energy
1.65 gal/kWh based on Georgia Energy Mix
Coal 70 %Natural Gas 15%Nuclear 14 %Hydroelectric 1 %
‐ Domestic water consumption Evapo‐transpiration is around 80 % of outdoor water use
2 6
23
135
30
0
20
40
60
80
100
120
140
160
kgal/(ho
use∙year)
Water Saving by PV Penetration
Water Saving with 10% PV PenetrationWater Saving with 30 % PV PenetrationWater Consumption for Energy DemandDomestic Water DemandDomestic Water Consumption

TEST BEDS
The Springs community, located in Chandler, AZ, was first selected and used as a test bed to research microgrid design methods.
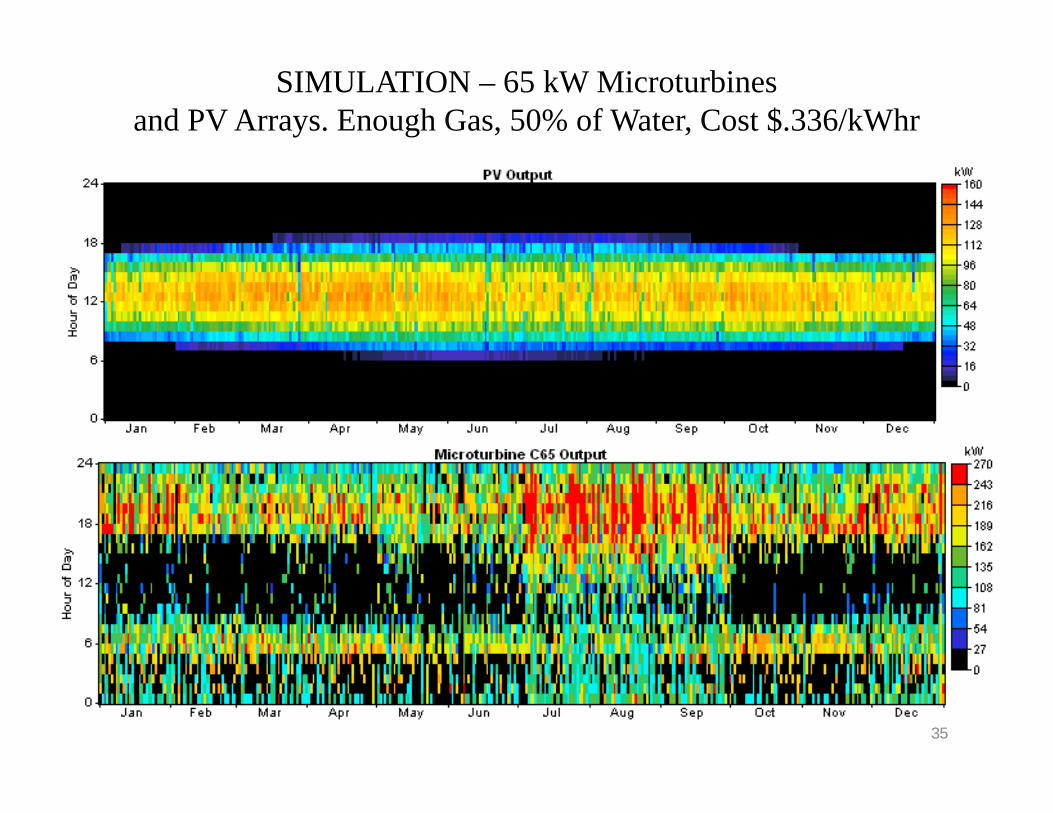
SIMULATION – 65 kW Microturbinesand PV Arrays. Enough Gas, 50% of Water, Cost $.336/kWhr
35

Optimal Microgrid Configuration
36
• Optimal Configuration of microgridsystem ‐ PV capacity : 157 kW‐Microturbine capacity: 270kW for total five units
• COE (cost of electricity)$0.336 per kWh
• Natural gas demand 3830 SCFH (cubic feet per hour) for microturbines= about 0.005 % of Natural gas capacity, 69.699 ~ 101.23 x 10⁶ CFH
Total water demand occupies 54 % of supply
24.5 17 17
200
0.90.4
414
0.1
1
10
100
1000
Demand
Consum
ption
Consum
ption
Demand
Consum
ption (Ope
n Loop
)
Consum
ption (Closed Loop
)
Domestic Waterfor 81 Homes
Waterfor
CentralEnergySupply
Water for 270 kWMicroturbine
WaterMain
Water Cap
acity, gpm
Water Demand and Supply Capacity

Energy for Transportation: Atlanta
0
1
2
3
4
5
6
7
8Co
nv.
Gas
olin
e
Die
sel
CNG
E-85
FFV
(Co
rn)
SI G
asol
ine
HEV
Die
sel H
EV
SI P
HEV
Die
sel P
HEV EV
Die
sel B
us
MAR
TA C
lean
Die
sel B
us
MAR
TA C
NG
Bus
MAR
TA R
ail
En
erg
y U
se P
er
Pass
en
ger
Dis
tan
ce
(MJ/
pe
rso
n-k
m)
-100
0
100
200
300
400
500
Conv
. G
asol
ine
Die
sel
E85
FFV
(Cor
n)
CNG
SI G
asol
ine
HEV
Die
sel H
EV
SI P
HEV
Die
sel P
HEV EV
Die
sel B
us
MAR
TA C
lean
Die
sel B
us
MAR
TA C
NG
Bus
MAR
TA H
eavy
Rai
l
CO
2 O
utp
ut
Per
Pass
en
ger
Dis
tan
ce
(g/
pe
rso
n-k
m)
PTW CO2 Output Per Passenger Distance
WTP CO2 Output Per Passenger Distance
Preliminary Energy & CO2 Results, Atlanta (Base Case) Courtesy: Bras, B; GT
• Poor environmental performance of electric vehicles, all sizes, due to coal fired power plants
– Georgia Power’s Plant Bowen emits about 0.9kg CO2/kWh
• MARTA rail & bus performance bad due to low ridership

Water for Transportation in US
Life Cycle consumptive water use by different transportation fuel alternatives
(Source: Harto, C; et al., Life cycle water use of low-carbon transport fuels, Energy Policy, 2010)

Water for Mobility Network: Metro Atlanta, 2010 and 2030 Conditions
Source: Jeffrey Yen (2011) A system model for assessing water consumption across transportation modes in urban mobility networks, Masters thesis

Case Study: Storm Water Treatment for Vancouver
• It was estimated that there was a $4 billion expense to separate stormwater systems from wastewater. However, when they opted for LID technique implementation there was an estimated $400 million income from increased property value and associated tax revenue.
• The new concept was aptly titled “From Pipe Dreams to Healthy Streams: A Vision for the Still Creek Watershed“

Outline• What is Sustainability and
the Gigaton Problem?• Infrastructure Ecology • Low Impact Development• Complexity and Urban
Development Simulation• Material Flow Analysis• Air Quality, Heat Island,
Noise, Carbon Foot Print Simulations
• Conclusions

LID Techniques for SW ManagementBioretention Cistern Constructed Wetland Dry Pond
Potential effects of LID technique implementation in urbanized areas of Southern California and San Francisco Bay region:
Water Savings (acre-ft/yr) Energy Savings (MWh/yr) CO2 Savings (Mt CO2-equiv.)
Low 229,000 573,000 250,500
Medium 314,500 867,000 379,000
High 405,000 1,225,500 535,500
Grassed Swale Green Roof Infiltration Basin Infiltration Trench
Porous Pavement Rain Barrel Sand Filter Vegetated Filterstrip Wet Pond
Rain Barrel and Green Roof, Atlanta (Southface)
Pervious Pavement Vegetated Swale, Vancouver(Crown Street)
Bioretention Basins

Alternatives and Case Studies
Rainwater Harvesting Green space & Onsite WW reclamation
Sewer Mining and Onsite WW reclamation
Energy Recovery Nutrient Recovery Smart Irrigator
Small Water Fixture

Wastewater as Energy/Nutrient Resource
46
Wastewater Treatment
Domestic sewerAgricultural wastewater
Industrial wastewater
Energy and Nutrient(N, P) Recovery
NH3‐N Removal from Wastewater HABER‐BOSCH processfor Ammonia Fixation
18 MJ (5 kWh)/kg as NH3‐N 32 MJ (9 kWh)/kg as NH3‐N
• Energy Recovery with Anaerobic Digester Biogas (CH4 and H2)Wastewater Organics (potential) 6.8 MJ (1.9 kWh)/m3 , 13 MJ (3.6 kWh)/kg-COD (potential)King County South Treatment Plant(WA) 1.1 MJ (0.3 kWh)/m3 , 2.5 MJ (0.7 kWh)/kg-COD)
for CHP by carbonate fuel cell
• Nutrient Recovery
Global phosphorus reserves may be depleted in 50 ~ 100 years (Gunther, 2005)
Phosphorus available from feces and urine
: 22 % of total global phosphorus demand (Mihelcic, 2011)
Phosphorus available from manure
: 42 % of all P applications to crops in US (Council for Agricultural Science and Technology, 1996)• Energy Use for NH3‐N Removal and Fixation

OutlineWhat is Sustainability and the GigatonProblem?Infrastructure Ecology Low Impact DevelopmentComplexity and Urban Development SimulationMaterial Flow AnalysisAir Quality, Heat Island, Noise, Carbon Foot Print SimulationsConclusions

Modeling a System of Systems
Facility Aging
Demographic Changes
Natural Hazards
Fiscal ConstraintsClimate Change
Natural Environment Systems
Social and Economic Systems
AIR | WATER | HABITAT | LAND | MINERAL RESOURCES
INCOME | EQUITY | SOCIAL STRUCTURE | POLICY FRAMEWORK | HEALTH
System Integration Software
Water Supply
Waste Water
Solid Waste
Urban Growth
Trans-portation
EnergySupply
TechnologicalHazards

RESIN Meeting Sept. 24, 2009
SPATIAL DATABASES FOR URBAN MODELING ‐ 1
The SMARTRAQ project
Supports research on land
use impact on transportation
and air quality
1.3 million parcels in the 13
metropolitan Atlanta non‐
attainment counties

RESIN Meeting Sept. 24, 2009
SMARTRAQ DATA AND ATTRIBUTESAddressRoad TypeCityZip CodeOwner OccupiedCommercial/ResidentialZoningSale PriceSale DateTax ValueAssessed ValueImprovement ValueLand ValueYear BuiltNo. of StoriesBedroomsParkingAcreage
Land Use TypeNumber of UnitsX,Y Coordinate
Estimated Sq FeetTotal Sq Feet

RESIN Meeting Sept. 24, 2009
Floodplain Highway Buffers
Public lands Ramp Buffers
Sewer Service
Lake Buffers
Employment Centers
Parks
IMPORTANT FEATURES

Growth Scenarios in Atlanta:
Land Use
Business as Usual Scenario Compact Growth Scenario
2030 2030
Comparison of two different growth scenarios for Atlanta in 2030 using What-If urban modeling toolCourtesy: French, S; GT

Year 2010
Unit: 1 dot = 250,000 gallon per day (gpd)
Water Use by Location Business as Usual
• Rain harvesting has a potential to supply around 57 % of water demand
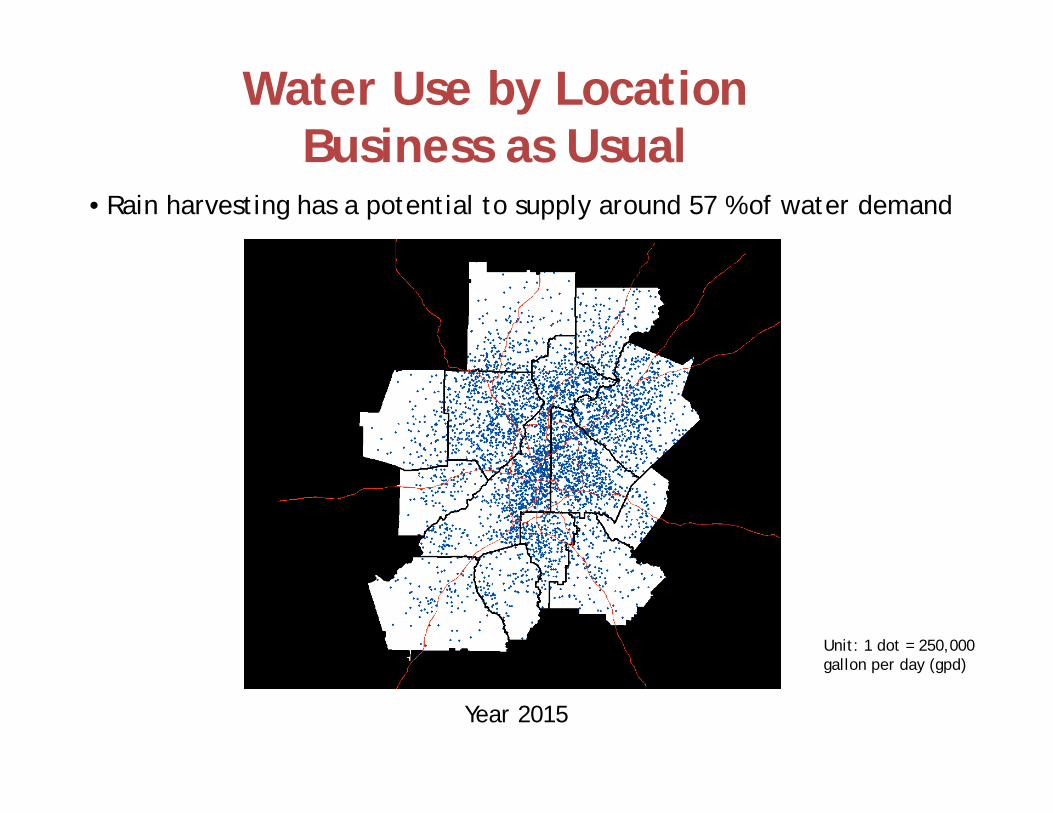
Year 2015
Unit: 1 dot = 250,000 gallon per day (gpd)
Water Use by Location Business as Usual
• Rain harvesting has a potential to supply around 57 % of water demand

Year 2020
Unit: 1 dot = 250,000 gallon per day (gpd)
Water Use by Location Business as Usual
• Rain harvesting has a potential to supply around 57 % of water demand

Year 2025
Unit: 1 dot = 250,000 gallon per day (gpd)
Water Use by Location Business as Usual
• Rain harvesting has a potential to supply around 57 % of water demand

Year 2030
Unit: 1 dot = 250,000 gallon per day (gpd)
Water Use by Location Business as Usual
• Rain harvesting has a potential to supply around 57 % of water demand

Year 2030
Unit: 1 dot = 250,000 gallon per day (gpd)
Water Use by Location Business as Usual
• Rain harvesting has a potential to supply around 57 % of water demand

Projected Residential Material Consumption (BAU)
0
20000
40000
60000
80000
100000
120000
140000
160000
2010 2015 2020 2025 2030
Material D
eman
d (100
0 tons)
steel
gravel
concrete
wood

Projected Residential Electricity Consumption (BAU)
0
10000
20000
30000
40000
50000
60000
70000
2010 2015 2020 2025 2030
Electricity
Con
sumption (GWh) pumps&aux
heat pump
ventilation fans
water heating
space heating
space cooling
Area Lighting
Misc equipment

Emergent Property: Ozone in ATL
69
Credit: Ted Russel

0 100 200 300 400 500
WaterTransportation
LivableBuildEnvironmentLandUseHousingEquity
Environmental/NaturalResourcesEnergy
EconomicDevelopmentCultural/HistoricResources
CommunityServicesandFacilities
CountofPolicyStatements
Evaluated 2305 policy statements from 30 plans for plan quality and commitment to sustainable development•Most plans focus on land use and community services (police, fire, schools). •Only one policy statement in one plan focused on energy
Plan Quality•Mean plan quality score:2.3 out of 4 (range – 1.3 to 3.2) •471 of statements (20%) were high quality – strongly worded, measurable, and specific•644 statements (28%) received no quality points Commitment to Sustainable Development•Average plan 40% statements SD,
•Min 9% ‐Max 80%•Plan policy statement commitment to SDCorrelated with high quality
Planning in Atlanta Metro

Genuine Progress Indicator (GPI)Sum of 24 measures grouped into 4 dimensions
of sustainability • Economic (5): income – adjusted for equality, underemployment, non‐market labor
• Social (5): social cohesion – including family, leisure, and crime
• Environment (5): cost of pollution (air, water, noise, waste)
• Resources (9): natural and man‐made capital
77

Development in Atlanta• Development measured as change in welfare• Welfare measured by GPI
Graph shows average of 28 county results for MSAFROM IT, WE CAN SAY:•GPI increased 1980‐2000•Only Economic dimension positive•Social, Environment, Resources dimensions reduce overall welfare by about half of Economic welfare•Gains in Economic dimension somewhat at the expense of Social and Resource welfare decline
78


![Welcome! [] - Opportunitie… · • Champion of Tourism Productivity Nexus (TPN), an initiative under Malaysia Productivity Blueprint Mr. Uzaidi Udanis has been involved in tourism](https://static.fdocuments.us/doc/165x107/5f0b0fab7e708231d42ea89e/welcome-opportunitie-a-champion-of-tourism-productivity-nexus-tpn.jpg)