
Next Generation Structural Optimization Today -...
15
N e x t G e n e r a t i o n S t r u c t u r a l O p t i m i z a t i o n T o d a y Craig S. Collier, P.E. Mark Pickenheim Phil W. Yarrington Collier Research & Development Corporation 2101 Executive Drive, 6 th Floor Tower Box 72 Hampton, Virginia 23666 collier-research.com e-mail: [email protected] Abstract Characteristics of a next generation software product are presented for a coupled MSC/NASTRAN FEA and structural optimization system. These characteristics include methods for automated structural analysis and optimization such as a statistical approach for determining ‘design-to’ loads and analytical/numerical ‘zooming’ for detailed global to local response. Software characteristics include a collection of standard panel and beam concepts, and an object oriented approach to strength and stability failure analyses. These features are provided in a multiproject, multiuser, secure database environment where the Internet standard Virtual Reality Modeling Language (VRML) is used for visual interpretation of results. © September 1997 by Collier Research & Development Corporation. Published with permission by The MacNeal-Schwendler Corporation for the 1997 MSC Aerospace Users’ Conference Proceedings.
Transcript of Next Generation Structural Optimization Today -...
Next Generation Structural Optimization Today
Craig S. Collier, P.E.Mark Pickenheim
Phil W. Yarrington
Collier Research & Development Corporation2101 Executive Drive, 6th Floor
Tower Box 72Hampton, Virginia 23666
collier-research.come-mail: [email protected]
Abstract
Characteristics of a next generation software product are presented for a coupled
MSC/NASTRAN FEA and structural optimization system. These characteristics include methods
for automated structural analysis and optimization such as a statistical approach for determining
‘design-to’ loads and analytical/numerical ‘zooming’ for detailed global to local response.
Software characteristics include a collection of standard panel and beam concepts, and an object
oriented approach to strength and stability failure analyses. These features are provided in a
multiproject, multiuser, secure database environment where the Internet standard Virtual Reality
Modeling Language (VRML) is used for visual interpretation of results.
© September 1997 by Collier Research & Development Corporation.Published with permission by The MacNeal-Schwendler Corporation for the 1997 MSC Aerospace Users’Conference Proceedings.
2
1 Introduction
A next generation structural optimization system specifically designed for aerospace applications is
presented. The system, called HyperSizer™ [1,2], is coupled with the MSC/NASTRAN finite element
package. HyperSizer is based primarily on detailed stress analysis and secondarily on discrete
optimization. Its underlying method is a departure from typical finite element design sensitivity and
optimization that emphasize numeric optimizers, and model based user defined constraints on strength
and stability failure analyses.
HyperSizer’s built-in detailed analysis capabilities using aerospace methods, and its ease of use, also
makes it suitable as a tool for performing automated structural analysis of airframes and propulsion
components.
2 Analytical/Numerical Characteristics
Four key characteristics of the analytical/numerical approach are identified as implemented with
HyperSizer. They are 1) a panel and beam formulation consistent with, and coupled to Finite Element
Analysis (FEA), 2) extensive list of physics based strength and stiffness failure analyses, 3) ‘design-to’
loads using statistical analyses, and 4) global to local zooming analyses.
Coupling with FEA
In order to automate the analysis and optimization of aerospace structures it is necessary to include an
FEA package [3]. The FEA, a necessary component, computes the thermomechanical internal load
distributions of structure. Because aerospace vehicle internal load distributions are highly indeterminate,
this process is referred to in the aerospace industry as computing ‘ running-loads’ , publishing ‘ internal
loads’ , or finding ‘ load-paths.’ In essence, the integrated effects of flight surface pressures, temperatures,
and accelerated inertia get reduced to force and moment components on panels and beams at all locations
of the vehicle.
Given that FEA is necessary, the questions then become: What else is necessary to automate structural
analysis? What is the best way to determine if the resulting panel and beam forces and moments are
causing failure? There are many different types of failures that may occur with in a structure. Some of
these failures can be predicted with FEA quite easily, some can be accomplished only with very discrete
and finely detailed model meshes (such as local buckling of stiffened panel spans), and then others
cannot be effectively accomplished with FEA (such as empirical crippling analyses). In any case, to
satisfactorily achieve desired accuracy, many different types of Finite Element Models (FEMs) are
usually required in addition to the ‘ loads model’ to predict the multitude of failure possibilities. For an
example of possible failure modes, see the “Applications” section of this paper.
3
In order to provide an effective automated structural analysis and/or optimization system that ensures all
potential failure modes are prevented, it is necessary to include explicit solutions, also known as closed
form solutions. The simplest analogy to this capability is an automated hand stress check performed after
the internal FEA loads are computed. If explicit methods are then used to determine if FEA computed
loads exceed load carrying capacity of the structural members, the final question becomes: What is the
best way to effectively couple explicit and empirical analytical methods with FEA? This question is
addressed in the section called “A Different Approach to Coupling with FEA.”
Closed form, physics based analysis methods
There are many closed form equations in the literature to choose from. Stress analysts are often forced to
make the difficult choice of what analysis method to use for a particular problem. Developers of
automated structural analysis software also make choices in methods to incorporate. At first inspection
this may not seem as challenging as it really is because a survey of leading Aerospace manuals will show
that many companies use similar methods, perhaps the biggest difference being in implementation. This
similarity is basically the foundation of Michael Niu’s books on metallic and composite airframe
structural design and analysis. However, new reference materials continue to be published for many
kinds of analyses. Older methods, in general, were devised for hand type analysis and are not well suited
for software because they make more approximations and assumptions than necessary in the attempt to
reduce calculations. Older methods, including some in aerospace manuals, require more programming
effort to code, integrate, and maintain than more powerful and consistently applied matrix methods.
Some of the best closed form solutions are contained in little known journals, conference proceedings,
NASA Technical Memorandums, and Contractor Reports.
Physics based solutions are preferred over empirical or special case methods when possible. To achieve
consistency, efficiency, and accuracy in application, analytical and numerical methods should be highly
integrated into the solution process. Putting analysis manuals ‘on line’ (i.e. interactive equations) are not
solutions to the higher level of automated analysis and optimization considered here. Finally, the explicit
methods should have complete knowledge of the FEM, detailed design, materials, and design principles
including manufacturing constraints. A robust automated structural analysis system should contain an
extensive list of physics based strength, stability, stiffness, and minimum frequency failure analyses as
well as provisions to include user defined design criteria such as manufacturing minimum sheet gages
and composite material ply layup sequences.
A different approach to coupling with FEA
References 4 and 5 present a formulation for stiffness terms and thermal coefficients of stiffened, fiber-
reinforced composite panels. The formulation is robust enough to handle panels with general cross
sectional shapes, including those which are unsymmetric and/or unbalanced.���������������� ����������� ������� �
and load dependent constitutive material data of each ply, make a laminate which is then used to "build-
up" the stiffened panel membrane, bending, and membrane-bending coupling stiffness terms and thermal
4
coefficients. A technique of implementing this formulation with a single plane of shell finite elements
using the MSC/NASTRAN was revealed that provides accurate solutions of entire airframes or engines
with coarsely meshed models.
Traditional methods used by industry for calculating panel and beam stiffness terms for coarse meshed
models were shown to have several shortcomings. A primary inaccuracy is due to the technique of
computing effective EA and EI for panels at separate neutral axes which preclude the use of a common
finite element reference plane and correct directional coupling.
Design-to loads quantified with statistical analyses
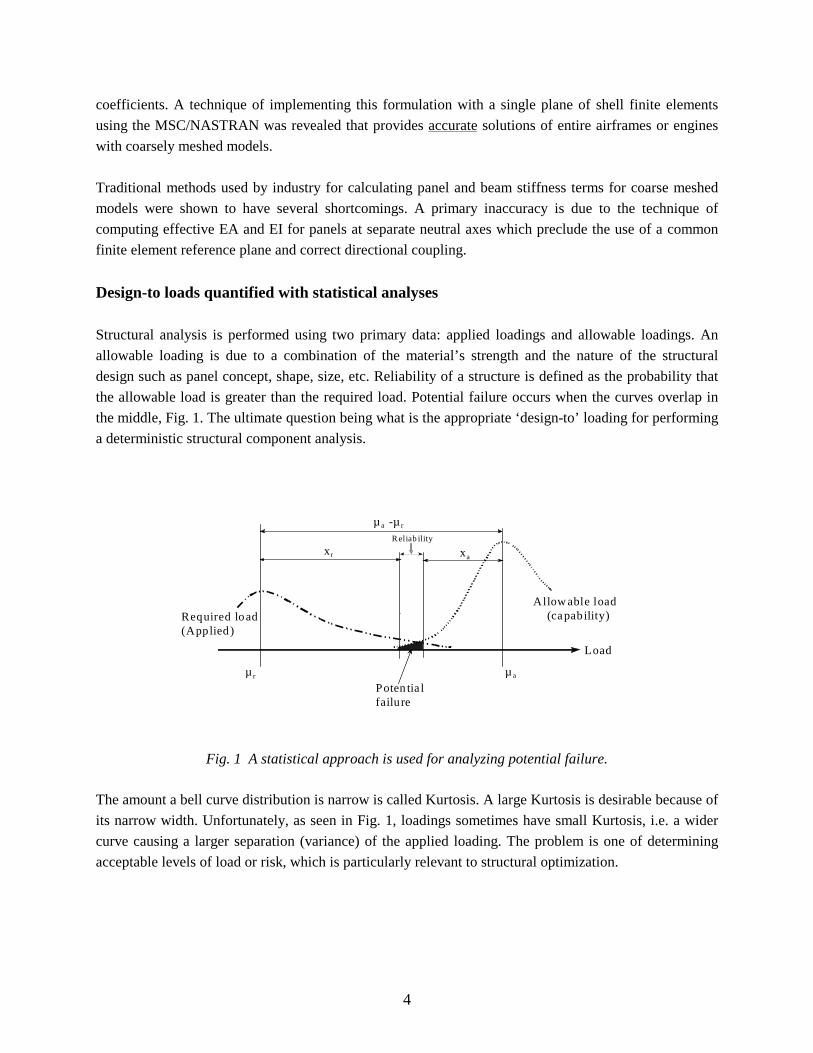
Structural analysis is performed using two primary data: applied loadings and allowable loadings. An
allowable loading is due to a combination of the material’s strength and the nature of the structural
design such as panel concept, shape, size, etc. Reliability of a structure is defined as the probability that
the allowable load is greater than the required load. Potential failure occurs when the curves overlap in
the middle, Fig. 1. The ultimate question being what is the appropriate ‘design-to’ loading for performing
a deterministic structural component analysis.
Fig. 1 A statistical approach is used for analyzing potential failure.
The amount a bell curve distribution is narrow is called Kurtosis. A large Kurtosis is desirable because of
its narrow width. Unfortunately, as seen in Fig. 1, loadings sometimes have small Kurtosis, i.e. a wider
curve causing a larger separation (variance) of the applied loading. The problem is one of determining
acceptable levels of load or risk, which is particularly relevant to structural optimization.
µa -µ r
xr xa
Rel iabil i ty
µ r µa
Potentialfailure
A l low abl e l oad (capabili ty)Required load
(A pplied) L oad
5
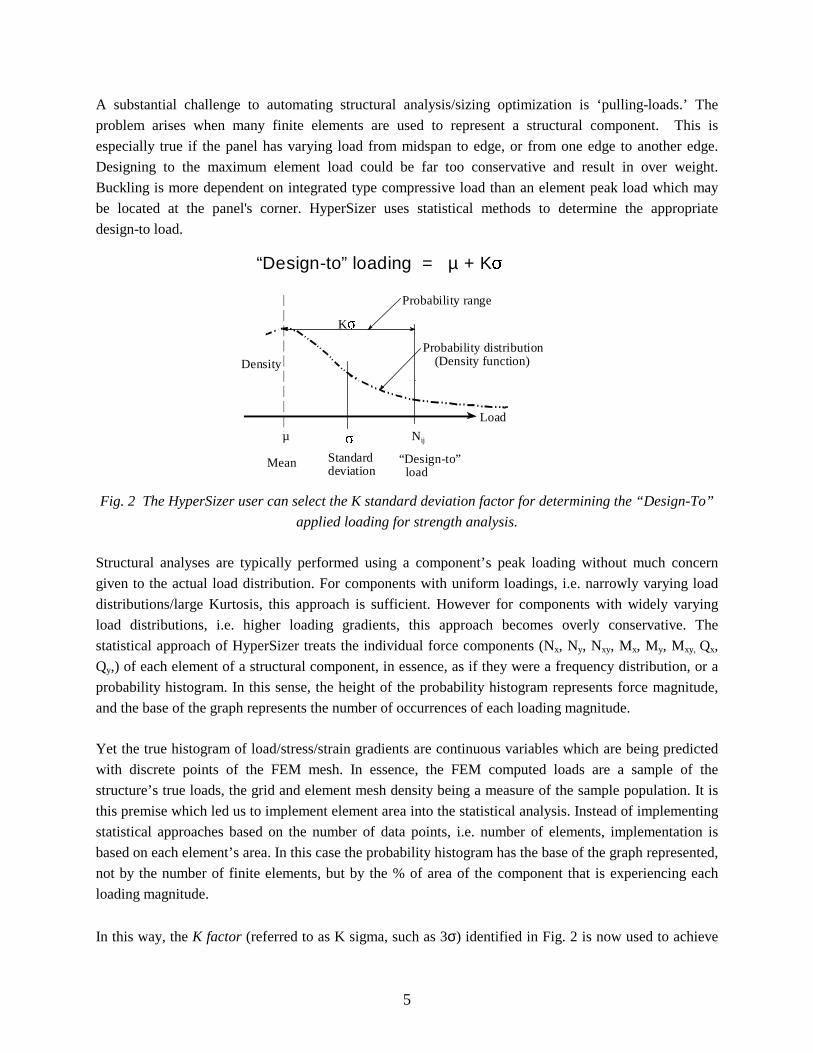
A substantial challenge to automating structural analysis/sizing optimization is ‘pulling-loads.’ The
problem arises when many finite elements are used to represent a structural component. This is
especially true if the panel has varying load from midspan to edge, or from one edge to another edge.
Designing to the maximum element load could be far too conservative and result in over weight.
Buckling is more dependent on integrated type compressive load than an element peak load which may
be located at the panel's corner. HyperSizer uses statistical methods to determine the appropriate
design-to load.
Fig. 2 The HyperSizer user can select the K standard deviation factor for determining the “ Design-To”
applied loading for strength analysis.
Structural analyses are typically performed using a component’s peak loading without much concern
given to the actual load distribution. For components with uniform loadings, i.e. narrowly varying load
distributions/large Kurtosis, this approach is sufficient. However for components with widely varying
load distributions, i.e. higher loading gradients, this approach becomes overly conservative. The
statistical approach of HyperSizer treats the individual force components (Nx, Ny, Nxy, Mx, My, Mxy, Qx,
Qy,) of each element of a structural component, in essence, as if they were a frequency distribution, or a
probability histogram. In this sense, the height of the probability histogram represents force magnitude,
and the base of the graph represents the number of occurrences of each loading magnitude.
Yet the true histogram of load/stress/strain gradients are continuous variables which are being predicted
with discrete points of the FEM mesh. In essence, the FEM computed loads are a sample of the
structure’s true loads, the grid and element mesh density being a measure of the sample population. It is
this premise which led us to implement element area into the statistical analysis. Instead of implementing
statistical approaches based on the number of data points, i.e. number of elements, implementation is
based on each element’s area. In this case the probability histogram has the base of the graph represented,
not by the number of finite elements, but by the % of area of the component that is experiencing each
loading magnitude.
In this way, the K factor (referred to as K sigma, such as 3σ) identified in Fig. 2 is now used to achieve
µ
Probabi li ty distribution
Load
Nij
Density
Probabi li ty range
K
(Density function)
Mean Standarddeviation
“Design-to” load
“Design-to” loading = µ + K
6
the desired confidence limit of the component’s area which is experiencing a level of load.
Conventionally used, K represents the level of a component’s highest loading. This subtle difference in
thought permits the useful analogy of quantifying how much area of a component will confidently
withstand the component’s loading. As a result, for a one-sided distribution, a K factor equal to 1, 2, or 3
indicates 84.13, 97.72, and 99.86 % of the component’s area. The remaining small percentage of
structural component area is best designed with a doubler or a small pad up of additional material.
The standard deviation K factor is used for strength analysis. However, for instability, a different
statistical approach is used by HyperSizer. A key aspect of which is to statistically determine the
percentage of the component’s area that is in the compressive, buckling zone and integrate the
compressive magnitude over that area. In-plane shear loading is considered as being compressive for
shear buckling effects.
Other researchers have applied statistical approaches to stress analysis. Of particular note is the work of
Verderaime [6] which is applicable to isotropic, unstiffened structure such as solid-rocket motor thrust
mounts, casings, shrouds, main frames, supports, fittings, castings, etc. That approach combines
multiaxial applied stresses into one value using the minimum strain energy distortion theory, referred to
as Mises failure criterion. Therefore, multiaxial loadings are stated in terms of a single value to perform
the statistical analyses. As a result of using a single stress value for the statistical procedures, the method
is not applicable to instability failure modes nor stiffened panel structures. The implementation with
HyperSizer is to use unit loadings such as Nx, Ny, Nxy, etc. separately in a statistical manner, so that
composite materials, panel buckling, local buckling, crippling, etc. of airframe structure can also be
handled.
Global to local analyses, Analytical Zooming
Global to local analyses usually means starting an analysis at the system level and then passing system
level responses to a more detailed analysis. For instance, predicted running loads of a particular panel are
passed from the airframe loads model (global) to a more refined model (local) of the panel for
performing local buckling of all of its stiffening span widths. Global to Local analysis may also refer to
the case where the starting point of a composite material analysis may be at the ply macro level, or at the
fiber and matrix constituent micro level. In this case, macromechanics is global and micromechanics is
local. Analytical zooming is a term to indicate performing a global, system level analyses and then
focusing in on a ‘hot spot’ with more rigorous analysis methods, such as the bond line between a
facesheet and an attaching flange of a coresheet.
In order to accommodate this ability to drill down, the global to local analyses must be theoretically
integrated. This insures consistent boundary conditions, strain compatibility, and equilibrium of forces
when moving down in local detail and then back up to the global level. The drilling down process should
be quick and require minimal user effort to accomplish.
7
In addition to consistent stress/strain fields, implementation of these capabilities requires a means to
toggle on/off the different level of analyses. In fact, the ability to select which analyses to perform for
different locations of the vehicle is necessary to reduce run times. For the most part, optimizations should
be done with nearly all of the failure analyses turned on. However, some analyses will be much more
CPU intensive and may not be of interest all the time. A case in point is the general method of cells
approach to viscoelasticity as implemented on the fiber and matrix constituent level of composite
materials. Though powerful and useful, this analysis capability is, by default, turned off in HyperSizer
when a component is generated. Yet, it can easily be turned on for any specific area of the vehicle.
3 Optimization Characteristics
Identified are four key characteristics of the optimization approach as implemented with HyperSizer.
These are the capability to optimize the total structural system quickly in model preparation and
execution time, an object oriented approach to analysis, a library of panel and beam concepts, and a
framework for innovative and advanced optimization.
Optimizing the total structural system
The ability to optimize a total structural system with all design variables turned on is fundamental with
HyperSizer. Since finite element sensitivity analysis and numerical optimizers are not used in this
approach, there is no exponential relationship between run time and model size/number of design
variables. In fact, the only model size limitation is based on practical limits of the linear static solver and
pre/post processors. Run times are quick and do not have local minimum solutions that possibly occur
with numerical optimization. Fast response is important for the user to be able to keep focus. Immediate
feedback on optimization selections, given automatically, helps the user to interact with the solution
process and to be able to stay on track with his design thoughts. This is accomplished with HyperSizer
because there are no file conversions nor a need for graphical pre/post processing.
An advantage of using explicit solutions is that analyses are accomplished rapidly and can consider the
multitude of failure modes and loadcases. HyperSizer’s purpose is to include all possible failure modes in
the assessment of a possible design. The objective is that the user should be able to depend on the
software for capturing all physics based structural integrity checks. As an example taken from reference
7, page 20, in the process of a optimizing a beam, the HyperSizer user need not provide a constraint on
the maximum allowable beam height to width ratio because in addition to simple bending stress criteria,
HyperSizer would also investigate twisting, lateral-torsional buckling etc.
Optimization input data is relatively easy to select. Optimization bounds can be assigned to different
vehicle locations quickly, referred to as groups. Optimization solutions are determined for components
which are a subset of groups. Components are defined during the process of constructing the FEM and
usually represent the smallest piece of manufacturable structure. That is structure fabricated with all of
the same design dimensions such as stiffener spacing, panel height, web thickness, facesheet thickness,
8
layups, etc. Visual interpretation is provided automatically for the current panel concept, component, and
group.
Object oriented approach to analyzing
An object-oriented approach to analyzing panels and beams is suggested in order to provide generality
within the developer’s code. Without such an approach, the code would likely be more error prone and
have less growth potential. Implementation does not require an object-oriented language such as C++.
What is proposed here is to implement a hierarchy of entities that have a parent - child relationship. In
HyperSizer this is carried out by identifying several layers or relationships of the physical objects that
‘build-up’ a panel or beam.
FEM � group � family � component concept ! segment " object
These relationships are used in the database management system to provide data integrity, and in the
computing language, to instruct which operations to perform. An object oriented approach to analysis is
particularly relevant when attempting to optimize a large library of panel and beam concepts.
Library of panel and beam concepts
Stiffness formulations and analysis methods should be able to handle any variation of a panel or beam
concept, and any variation of material usage. From a user’s perspective, a library of commonly used
aerospace panel and beam families and specific concepts (such as Z, J, I, T, and hat stiffened; and
honeycomb, trusscore, and foam sandwiches) to choose from greatly speeds up the analysis and design
process. Panel concepts that are part of a family should use the same design variables, and the
optimization should be able to determine which of the concepts is optimum for a particular component.
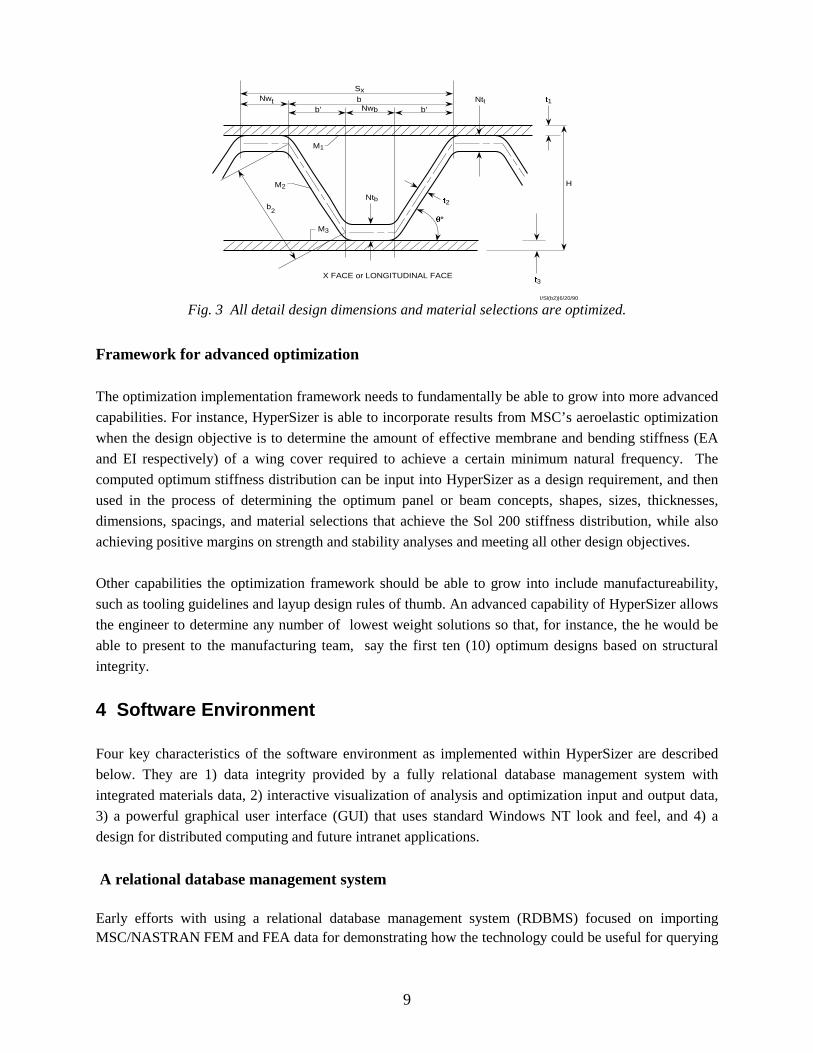
The analyses and optimization should use all of the detailed design variables, Fig 3.
The ability to choose which material (isotropic; polymer, ceramic, or metal matrix composite;honeycomb, etc.) to use for any segment of the panel provides more optimization potential. Likewise, theability to layup hybrid composites that have different ply materials is a benefit. In turn being able tospecify these hybrid laminates for different panel segments is even more desirable, especially when it canbe accomplished easily and with data integrity.
9
Fig. 3 All detail design dimensions and material selections are optimized.
Framework for advanced optimization
The optimization implementation framework needs to fundamentally be able to grow into more advanced
capabilities. For instance, HyperSizer is able to incorporate results from MSC’s aeroelastic optimization
when the design objective is to determine the amount of effective membrane and bending stiffness (EA
and EI respectively) of a wing cover required to achieve a certain minimum natural frequency. The
computed optimum stiffness distribution can be input into HyperSizer as a design requirement, and then
used in the process of determining the optimum panel or beam concepts, shapes, sizes, thicknesses,
dimensions, spacings, and material selections that achieve the Sol 200 stiffness distribution, while also
achieving positive margins on strength and stability analyses and meeting all other design objectives.
Other capabilities the optimization framework should be able to grow into include manufactureability,
such as tooling guidelines and layup design rules of thumb. An advanced capability of HyperSizer allows
the engineer to determine any number of lowest weight solutions so that, for instance, the he would be
able to present to the manufacturing team, say the first ten (10) optimum designs based on structural
integrity.
4 Software Environment
Four key characteristics of the software environment as implemented within HyperSizer are described
below. They are 1) data integrity provided by a fully relational database management system with
integrated materials data, 2) interactive visualization of analysis and optimization input and output data,
3) a powerful graphical user interface (GUI) that uses standard Windows NT look and feel, and 4) a
design for distributed computing and future intranet applications.
A relational database management system
Early efforts with using a relational database management system (RDBMS) focused on importingMSC/NASTRAN FEM and FEA data for demonstrating how the technology could be useful for querying
I/Sl(b2)|6/20/90
bb' b'Nwb
Nwt Ntt t#1
t#2
θ$
°
t#3
H
M1
M2
M3
X FACE or LONGITUDINAL FACE
Sx
b2
Ntb
10
the model and loads in many different ways with SQL. [8]. With HyperSizer, the use of RDBMS hasevolved into including all material and project input and output data having complete integrity viaautomatic cascading updates, deletes, and data locking. Now a multi-project, concurrent multi-userdatabase with different levels of password security provides users full generality of security or sharingpermission.
The benefit of the fully implemented RDBMS to the user is that integrity is guaranteed anytime a changeis made to any data [9]. Design optimization requires much data and the task of maintaining it ischallenging considering there are currently about 500 different data types associated with a designproject. Each of those unique data types contains many data values, and if any one data value were tochange, the RDBMS will automatically ‘cascade’ that change throughout the project. This is valuablebecause anytime data gets modified, renumbered, or renamed, the change is updated throughout allassociated data. If some data is desired to be deleted, but is being referenced by a project, that datacannot be deleted until it is first deleted from every project that references it. If a material’s data ismodified, shear modulus, for example, then all existing projects that reference that property will indicatethat their computed optimization results are no longer valid. At which point the user can leave them asthey are, or re-execute the optimization. This automatic data maintenance provides user convenience andconfidence in all data, including archived project data.
Interactive visualization of data
The non-proprietary, Internet standard Virtual Reality Modeling Language (VRML) Version 2 is usedby HyperSizer for real time, 3D interactive and integrated visualization of model data and computedresults. This form of graphical data representation allows many different internet browsers to be used fordisplay. Therefore project design and analysis image files can quickly be sent to aerospace teamingpartners. User’s may also add to the HyperSizer generated file their own proprietary data for display.
Currently, VRML files are being made for FEM grid and element connectivity and FEA computedelement forces. HyperSizer specific data shown with VRML includes a) airframe and propulsion systemstructural components and optimization groups, b) controlling failure modes, c) optimized panel andbeam design cross sections drawn to scale, and d) cross sectional stresses and margin-of-safety gradients.
Graphical user interface
Optimization imposes burdens on a GUI because of the additional amount of data required for display,such as being able to quickly see margins-of-safety for any location of the airframe, for any panel object,for any failure mode analysis, and for any loadsets. Optimizing material choices present other types ofGUI needs since a reduced set of materials from the complete material’s database need to be filtered to amanageable number for a given project.
The HyperSizer graphical user interface is built on top of the relational database scheme. When adatabase is opened, a Windows 95 Explorer style tree view of the database is presented in a multipledocument environment. All materials and projects in the database can easily be browsed by expandingbranches of the tree. To interact with a specific material or project, forms with standard Windows look
11
and feel are launched from the tree interface. The user can open many different forms at the same time tobrowse different parts of the database. Forms can be navigated, iconified, or closed as needed in themultiple document interface. Tabbed forms are used to organize complex data efficiently whichsimplifies tasks such as viewing margins-of-safety for any location of the airframe, or editing groupoptimization variables. There is additional functionality to manage the system such as creating new users,editing passwords (if needed), and compacting databases.
Distributed computing
A consideration for any aerospace software is its ability to be part of a distributed computingenvironment. One aspect of this is being able to import and export to the leading vendor FEM and FEAformats, i.e. MSC/NASTRAN, PATRAN, FEMAP, I-DEAS, etc. Another aspect of this is automaticallyaccessing loads and FEM data over networks. HyperSizer implements this capability by providing projectlevel control of network links to other discipline data. That is each project carries along in the databasethe full path of computer name and directory of the data source. Therefore, data such as FEA results donot have to be copied or manually accessed by the user whenever an optimization run is invoked.
A final last consideration is that future distributed computing will likely be accomplished within acompany’s intranet. Therefore, software designed today should eventually be able to be served out usingMicrosoft Active X or Sun Java technologies with standard Internet browsers.
5 Applications
Application of the optimization process to a complete airframe and engine is reported in [2]. In that paperthe system level running loads were identified for a Single-Stage-to-Orbit vehicle and used to determinethe optimum panel and beam designs, material selections, layups, and predicted unit weights andmargins-of-safety.
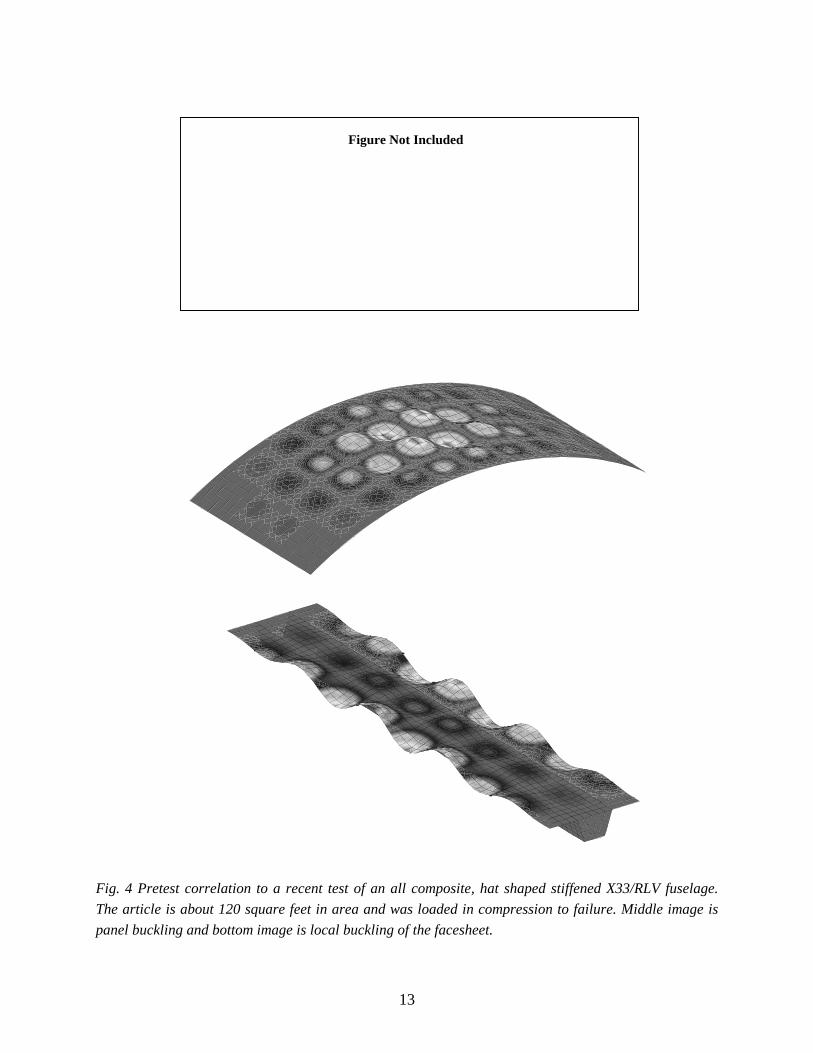
In this section, a recent application of HyperSizer to an approximately $2.5 million dollar structural testof a space launch, all composite cylindrical shell is presented. The article was 10' by 12' with three Jshaped interior ringframes and 43 hat shaped stiffeners, see Fig. 4. The test took place August 1997 atNASA Langley Research Center. The test article was fabricated by a contractor and was representative ofan X33/RLV fuselage design. Loading was longitudinal compression.
The test article’s purpose was primarily to investigate panel buckling. However, HyperSizer pretestanalyses predicted that local buckling of the total facesheet (facesheet over and between the hats) wouldoccur first around 2800 (#/in), preventing the shell from going into a panel buckling mode. Unfortunatelydue to a fabrication problems in the way the hats stiffeners were bonded to the facesheet, they pulled offduring the test prematurely at a load of around 2000 (#/in) causing catastrophic failure. Therefore, panelbuckling was never attained.
12
Important observations about the test correlation process
The general approach used by industry and NASA is to build different FEMs of the test article to capturedifferent structural responses and potential failures. For this test, at least four distinctive (non-HyperSizerrelated) FEMs were built, and a fifth considered but not made due to excessive computationalrequirements.
A model was built similar to the FEM of the bottom image of Fig. 4 to predict stress failure of the paneland ringframe. It was also used to predict facesheet local buckling but its mesh turned out to be too large.A second was built that had 5 hat stiffeners to predict instability interaction of the hats. A third modelwas built similar to the overall panel buckling FEM shown in the middle image of Fig. 4 to predict panelbuckling. This FEM used beam/rod elements for the hat stringers, and as consequence did not correctlyhandle torsional rigidity of the closed cells or the additional transverse bending stiffness due to the cells.Also the stiffness terms for the shell element material and property records did not include the effects ofthe unsymmetric nature of the membrane/bending coupling of the hats, nor their in-plane shear flows.Finally, the local buckling facesheet span widths of the distance between hats was greater than the actualdesign. For these reasons it was thought that another model would be necessary which discretely modeledall 43 hats of the test article to accurately capture panel buckling. However this model was not made dueto the required high grid count.
Only one coarse FEM was required and made for computing running loads for all of HyperSizer’s failurepredictions. The generalized stiffness terms of the 2D, planar, model included the facesheet andcoresheet ply layups, and the beginning and ending locations of the ply drop offs of the hat constructionincluding the additional plies placed in the hat crown. This same FEM was also used to verifyHyperSizer’s panel buckling predictions using MSC/NASTRAN buckling solution as shown in themiddle image of Fig. 4. Note that the FEM was made before knowing the buckling wave length, and thusthe FEM turned out to be not quite fine enough for these buckling waves. However, for coupling withHyperSizer, this mesh density is not a problem since only the static, FEA multiaxial force distribution isrequired for its buckling analyses. The explicit, buckling predictions of HyperSizer includes unsymmetricand bending-twisting stiffnesses and their couplings in both the stiffness formulations and eigenvalueanalyses, and as such overcome the shortcomings identified above with the FEM that was using beam/rodelements for the hat stringers. For verification, the coarsely meshed FEM of the middle image of Fig. 4included these same terms and the MSC/NASTRAN eigenvalue solution compared well to HyperSizer.
To verify HyperSizer’s facesheet local buckling prediction, the FEM of the bottom image of Fig. 4 wasbuilt. HyperSizer predicted buckling at 2800 (#/in) and the FEA eigenvalue using MSC/Nastran was2850 (#/in). In addition to this FEM, An independent FEM built by NASA confirmed local buckling ofthe facesheet around #2800 to 2900#.
13
Fig. 4 Pretest correlation to a recent test of an all composite, hat shaped stiffened X33/RLV fuselage.
The article is about 120 square feet in area and was loaded in compression to failure. Middle image is
panel buckling and bottom image is local buckling of the facesheet.
Figure Not Included
14
Test summary
The analytical approach used by HyperSizer was shown to predict the same failure mode and load as
NASA’s pretest analyses for an X33/RLV all composite fuselage test article. HyperSizer quickly
identified a critical failure mode of a structure so test engineers could focus efforts in making a specific
FEM that addressed this particular concern. Finally, since all of the explicit methods executed in less
than a CPU second, they are extremely useful as an analytical engine for optimization.
6 Conclusions
This paper identifies analytical and software characteristics necessary to provide a next generation
structural optimization capability today. As an existing commercial solution that has these
characteristics, MSC users can benefit from the unique optimization provided with the coupling of
MSC/NASTRAN and HyperSizer. MSC/NASTRAN is used for the internal loads solution of the loads
model and HyperSizer for the aerospace analysis methods, closed form physics based solutions, and
discrete optimization. The user can also benefit from using HyperSizer as an automated structural
analysis tool for metallic and composite aerospace structure as exemplified for this X33/RLV test article.
7 Acknowledgments
Portions of this research were performed for the Hypersonic Vehicle Office/Systems Analysis Office, for
the Vehicle Analysis Branch, and for the Thermal Structures Branch under SBIR contract at Langley
Research Center in Hampton, Virginia.
8 References
1 HyperSizer User’s Manual, Version 1, Collier Research & Development Corp., Hampton, VA, October, 1996
2 Collier, C.S., “An Integrated FEA and Design Optimization System for Composite Structures” , The 1996 MSCWorld Users’ Conference, Newport Beach, CA, June 3-7, 1996
3 Collier, C.S., Spoth, K.A., and Grassi, G.C., "Thermomechanical Finite Element Analysis of Stiffened,Unsymmetric Composite Panels With Two Dimensional Models", The MSC World Users' Conference, Arlington,VA, May 24-28, 1993, Paper No. 31
4 Collier, C.S., "Stiffness, Thermal Expansion, and Thermal Bending Formulation of Stiffened, Fiber-ReinforcedComposite Panels", AIAA/ASME/ASCE/ AHS/ASC 34th Structures, Dynamics, & Materials Conference, La Jolla,CA, April 19-22, 1993, Paper No. AIAA-93-1569
5 Collier, C.S., "Thermoelastic Formulation of Stiffened, Unsymmetric Composite Panels for Finite ElementAnalysis of High Speed Aircraft", 35th AIAA/ASME/ASCE/AHS/ACS Structures, Dynamics, & Materials Confer-ence, Hilton Head, SC, April 18-20, 1994, AIAA paper 94-1579
6 Verderaime, V., “First-Order Reliability Application and Verification Methods for Semistatic Structures” ,Journal of Spacecraft and Rockets, Vol 31, No. 6, Dec. 1994, pages 1050-1053.
15
7 MSC/NASTRAN Design Sensitivity and Optimization Manual, Version 68, The MacNeal-SchwendlerCorporation, Los Angeles, CA , 1994
8 Collier, C.S., and Rasdorf, W.J., "A Finite Element Model and Finite Element Analysis Relational DatabaseManagement System", Proceedings from the 2nd Symposium on Engineering Databases Management, 1988 ASMEInternational Computers in Engineering Conference, San Francisco, CA, August 1988
9 Rasdorf,W.J., Spainhour,L.K., Patton,E.M., Burns,B.P., and Collier,C.S., "A Computer-Aided Analysis SystemWith DBMS Support for Fiber-Reinforced Thick Composite Materials", Proceedings of the 5th Symposium onEngineering Databases Management, 1991 ASME International Computers in Engineering Conference, Santa Clara,CA, August 1991
TRADEMARKS
HyperSizerTM is a trademark of Collier Research and Development CorporationPortions © NASA 1996. All rights reserved.
NASTRAN® is a registered trademark of NASAMSC/NASTRANTM is an enhanced proprietary product of The MacNeal-Schwendler Corporation