
Next Generation Analytics
50
Discover the Blueprint for Next Generation Analytics Jim Parnitzke AAJ Technologies November, 2014
-
Upload
aaj-technologies -
Category
Data & Analytics
-
view
242 -
download
3
Transcript of Next Generation Analytics

Discover the Blueprint for Next Generation AnalyticsJim ParnitzkeAAJ Technologies
November, 2014

Introduction
Jim ParnitzkeBusiness Intelligence and Enterprise Architecture Advisor, Expert, Trusted Partner, and PublisherOver his career he has served in executive, technical, publisher (commercial software), and practice management roles across a wide range of industries.

3
What is new about the next generation?
The five (5) keys for success you need
Strategy and approach (road map development)
• Understanding your current state
• End State - Where do you want to go?
• Gap analysis – uncovering the actionable activities you will need to accomplish success
How to get started
Discussion Topics
4Confidential and Proprietary
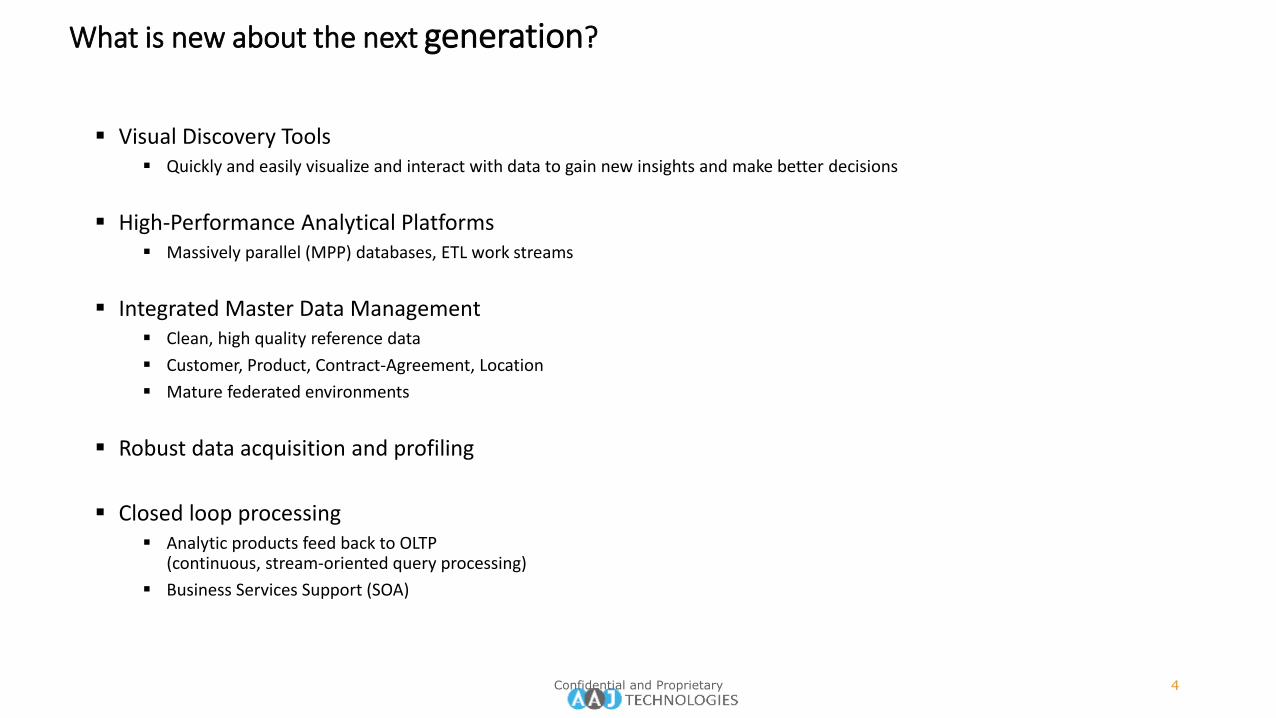
What is new about the next generation?
Visual Discovery Tools Quickly and easily visualize and interact with data to gain new insights and make better decisions
High-Performance Analytical Platforms Massively parallel (MPP) databases, ETL work streams
Integrated Master Data Management Clean, high quality reference data
Customer, Product, Contract-Agreement, Location
Mature federated environments
Robust data acquisition and profiling
Closed loop processing Analytic products feed back to OLTP
(continuous, stream-oriented query processing)
Business Services Support (SOA)

5Confidential and Proprietary
Visual Discovery
6Confidential and Proprietary
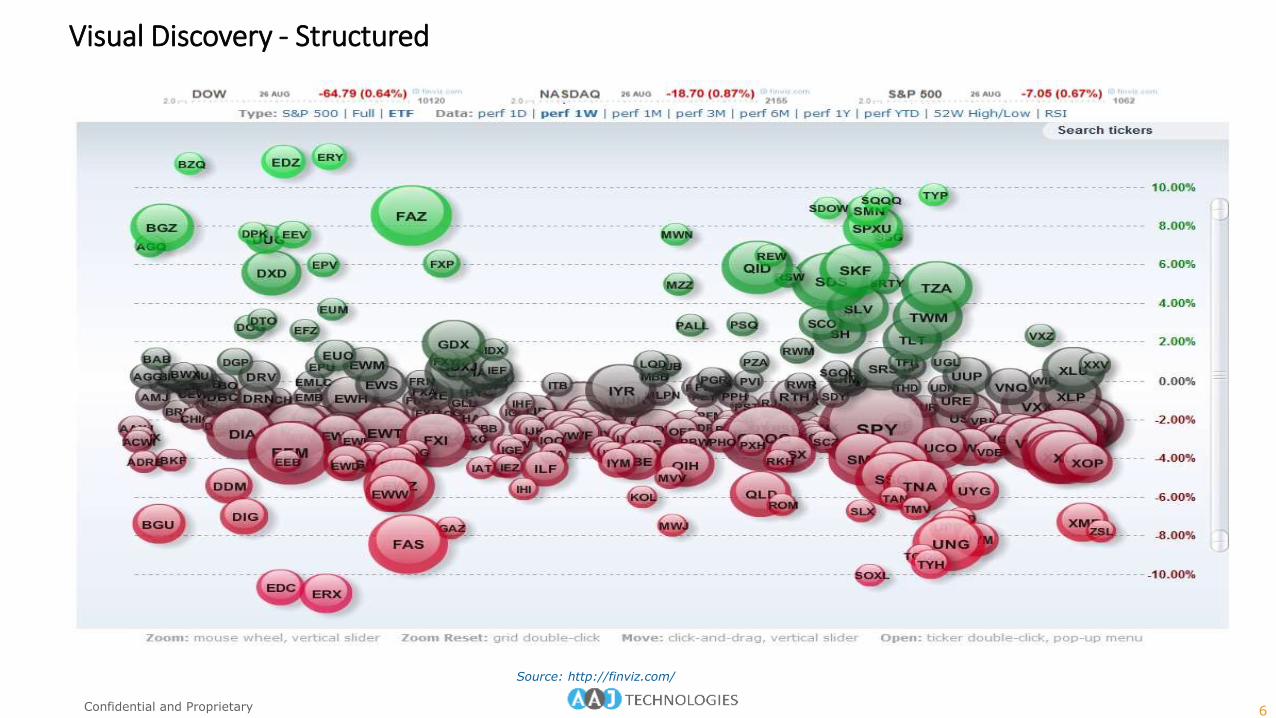
Visual Discovery - Structured
Source: http://finviz.com/

7
Visual Discovery - Unstructured
Source: Wikipedia, National Visualization and Analytics Center, Pacific Northwest Laboratory

8
High-Performance – Large Data Analytics
• Large Data – Map/ReduceIntroduced by Google (based on Skeleton Programming Models, proposed by Murray Cole in 1989) to support distributed computing on large data sets
• Large distributed computations as a sequence of distributed operations on data sets
• Harnesses cluster of machines and executes user defined Map/Reduce jobs across the nodes in the cluster
• Computation in two phases:
• map phase
• reduce phase
• Amazon (AWS) EC2 Elastic Map/ReduceAster Data SQL+Map/Reduce
• Open Source Apache Hadoop
• Used for:• Text tokenization, indexing, and search
• Creation of other kinds of data structures (e.g., graphs)
• Data mining and machine learning (clustering, segmentation, association)
• Predictive Model Markup Language (PMML)

9
High-Performance – Execution
map(String key, String value):// key: document name// value: document contentsfor each word w in value:EmitIntermediate(w, "1");
reduce(String key, Iterator values):// key: a word// values: a list of countsint result = 0;for each v in values:result += ParseInt(v);Emit(AsString(result));

10
High-Performance – Usage
Source: MapReduce: Simplified Data Processing on Large ClustersJeffrey Dean and Sanjay Ghemawat, Google, Inc.

11Confidential and Proprietary
High-Performance Methods
• Decision Trees - Starting point for data exploration. It is primarily a classification algorithm, and works well for predictive modeling of both discrete and continuous attributes. Evaluate how each input attribute in a dataset affects the result of thepredicted attribute.
• Use to find a combination of input attributes and their states to predict the outcome of the predicted attribute.
• Naïve Bayes - Build models used for classification and prediction. Calculate probabilities for each possible state of the input attribute given each state of the predictable attribute. Algorithm supports only discrete (non-continuous) attributes and considers all the input attributes to be independent given the predictable attribute.
• Use the Naïve Bayes algorithm during the initial data exploration phase, and for classification and prediction problems.
• Clustering - Iterative techniques to group records from the dataset into clusters containing similar characteristics.
• Use to explore the data to find relationships and create predictions from the clustering model.
• Association - Based on the a priori algorithm, provides an efficient method for finding N-way correlations within large datasets.
• Use to cycle through the transactions in the database to find which items are most likely to appear together in the transactions of a single user, most often used for market basket analysis.

12
High-Performance Methods
• Sequence Clustering - Combine sequence analysis and clustering for data exploration and prediction. The model is sensitive to the order in which events occur, can correlate sequential and non-sequential information.
• Used to perform click stream analysis to analyze the flow of Web site traffic, to identify which pages are most closely related to the sale of a particular product, and to predict which pages are going to be visited next.
• Time Series - Create models that can be used to predict one or more continuous variables (e.g. an equity price). The algorithm bases its prediction solely on the trends derived from the training data used during the creation of the model. Time Series usesan AutoRegression Trees technique, is very easy to use, and generates highly accurate models.
• Use for statistical analysis devoted to time series. Many data mining products now provide techniques such as ARMA, ARIMA, and Box-Jenkins, determine the model's best fit.
• Neural Net - Similar to Decision Trees and Naïve Bayes, is used primarily for data exploration, classification and prediction.
• Use this artificial intelligence technique to explore all possible data relationships. Because it is such a thorough technique, it is the slowest of the three classification algorithms.

13Confidential and Proprietary
Usage Scenarios
Analytical problem Examples Typical algorithms used
Classification
Assign cases to predefined
classes such as "Good" vs "Bad"
for example.
• Credit risk analysis
• Churn analysis
• Customer retention
• Decision Trees
• Naïve Bayes
• Neural Nets
Segmentation
Develop a taxonomy for
grouping similar cases
• Customer profile analysis
• Mailing campaign
• Clustering
• Sequence Clustering
Association
Advanced counting for
correlations
• Market basket analysis
• Advanced data exploration
• Decision Trees
• Association Rules
Time Series Forecasting
Predict the future
• Forecast sales
• Predict stock prices
• Time Series
Prediction
Predict a value for a new case
(such as a new customer) based
on values for similar cases (such
as existing customers)
• Quote insurance rates
• Predict customer income
• Predict temperature
• All
Deviation analysis
Discover how a case or segment
differs from others
• Credit card fraud detection
• Network infusion analysis
• All

14Confidential and Proprietary
Integrated Master Data Management
Customer
Table (0)Table
(0)Table
(1) Table
(2)
Entity
(1)Entity (0)
Product
Table (0)Table
(0)Table
(1) Table
(2)
Entity
(1)Entity (0)
Supplier
Table (0)Table
(0)Table
(1) Table
(2)
Entity
(1)Entity (0)
Contract
Table (0)Table
(0)Table
(1) Table
(2)
Entity
(1)Entity (0)
Location
Table (0)Table
(0)Table
(1) Table
(2)
Entity
(1)Entity (0)
Right Party (Customer, Suppler) Right Product (Authorized) Right Terms and Conditions (Contract) Right Product Bundle (Components) Right Price Right Cross Reference Right Hierarchy Right Location (variant)
Sales Transaction

15
Robust Data Acquisition and Profiling
Migration Staging
Table Scan
Attribute Scan
Statistical Analysis
Reporting
Integrated Data Store
Common Data Model
Detailed Data
80/20 Rule Applied
Cumulative RC Build
Data Profiling
Metadata Management
Data Integration
Table (0) Table (0)Table (1)
Table (2)
Entity (1)Entity (0)
Table (0) Table (0)Table (1)
Table (2)
Entity (1)Entity (0)
Transformation
Execution
Data Re-engineering
Production Target
Entity (1)Entity (0)
Test Release Candidate
Entity (1)Entity (0)
Reference
Non-Sourced
Data
Release
Candidate
Promotion
Test Results
and quality
index
Data Sources
Current-State
16Confidential and Proprietary
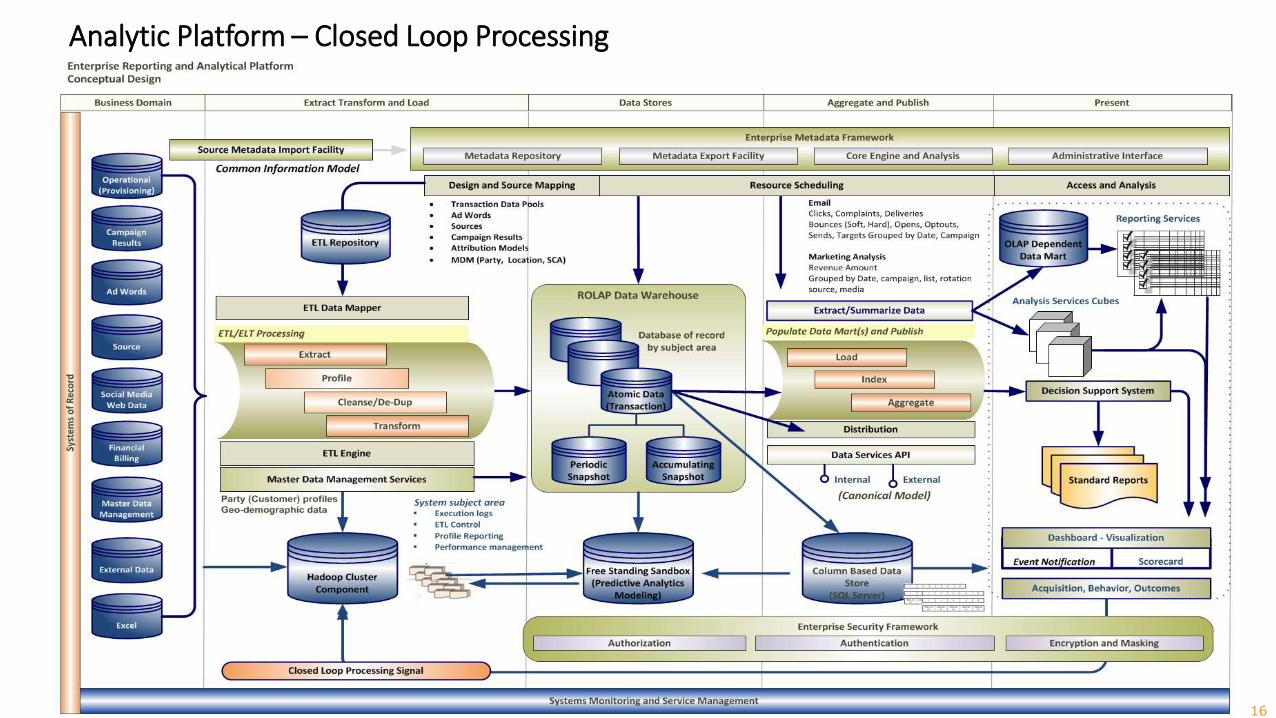
Analytic Platform – Closed Loop Processing

17
Services can be Java, C++, .Net
Content-Based Routing
Shared state to enable stateful services
In Memory Data Grid
Object Space Computational Model

Capture Manage ActAnalyze
Conceptual Design
Replication
Distribution
Mo
bil
e W
ork
Fo
rce
Reporting Services
oneDOT Operational Data
Store
Access and Analysis
Event Notification
Management Reports
Closed Loop Processing Signal
Authorization Authentication Encryption and Masking
Activity Report Cubes
Subscription Registry
Systems Monitoring and Service Management
Executive Dashboard
oneDOT Data Warehouse
Extract, Transform and Load to Analytic
Publish and Distribute
Enterprise Security Framework
Data shipped to external Decision Support system
Database and Network Administration
A handheld application
captures and transmits dots
(GPS coordinates) to collect
the fundamental building blocks
for information products.
Applications auto-generate
alerts, messages,
checklists, events, and more
to the field force member’s
smart phone which results in
a truly proactive, location
intelligent mobile field force.
Operations Center
provides professional
reliable value-added
data base and
network management.
Work force takes
action on up to date,
reliable information.
Optimize the information
about the dots. Deliver
analytic products to define,
build, and operate an
effective organization.
Event Broker
Raw Data Capture
Location and Mapping Framework
18
Analytic Platform – Example Use
19
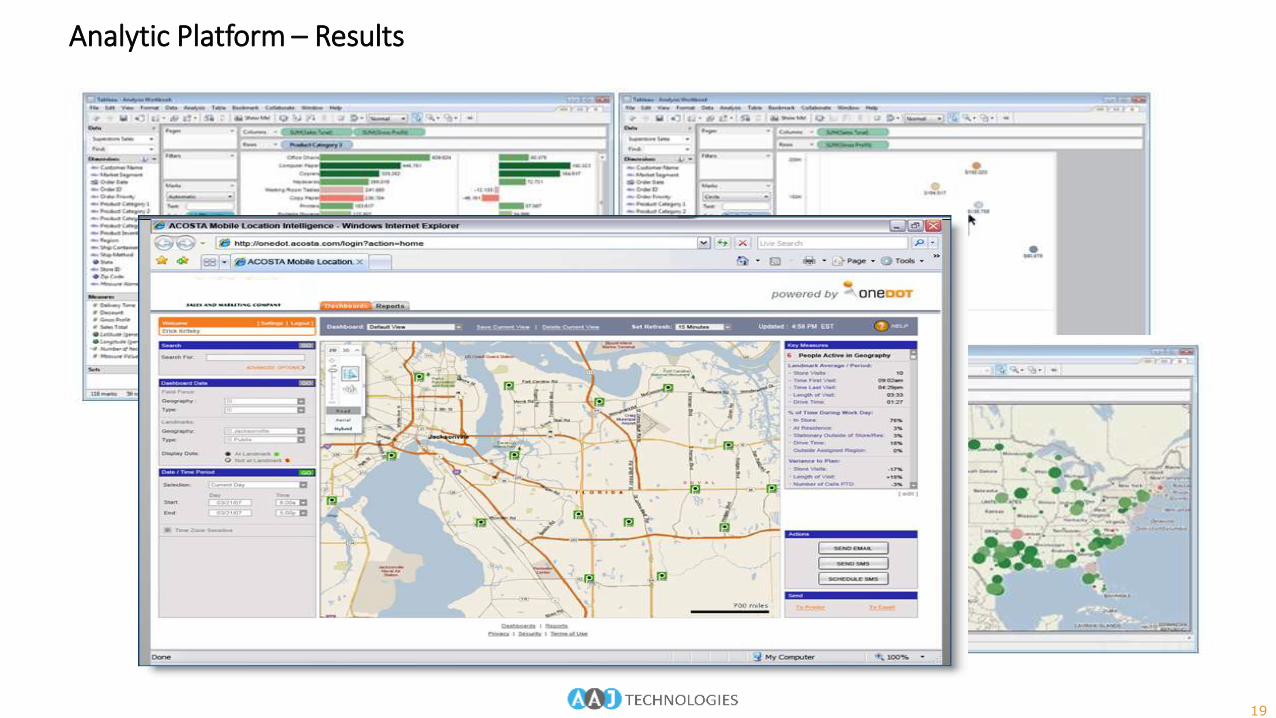
Analytic Platform – Results

20
The five (5) keys for success
People, not Technology
Process, not Project
Value, not Cost
Insight, not Data (Data ≠ Information)
Think out of the box
1
2
3
4
5

21
The five (5) keys for successUnderstanding what counts

People - Insight and Visibility
Customer support rep
“I need better access to information to make better decisions on cross-sell and up-sell opportunities.”
“I need to have the right demographic information so I can better target my opportunity prospecting.”
Sales rep
Chief executive officer (CEO)
“I need to know that the people in my organization have the right goals in place to understand and execute on the strategic initiatives of the company.”
VP, operations
“I need better visibility into my cost of operations so I can target specific cost reduction opportunities that won’t have a negative impact.”
Chief financial officer (CFO)
“I need to improve our analytics capabilities so we can understand our current business performance and do a better job of planning for the future.”
Source: “Creating the Office of Strategy Management” by Robert Kaplan and David P. Norton, Harvard Business School, April 2005
VP, sales and marketing
“I need better visibility into our pipeline performance so I can focus on deals that help me grow business with my most profitable customers.”
Gross Margin?Profit Margin (EBIT, EBITDA, NOPAT)?Operating Expenses?Asset Turnover?Working Capital Management?GMROI?Actual Employee Turnover Costs?
Debt to Asset Ratios?Debt to Capitalization?Interest Coverage?Burden Coverage?Cash Flow? Cash Flow / Share?Return on Total Net Worth?Return on Common Equity?
Earnings Per Share?Share Prices Appreciation?Dividends Per Share?Price to Earning Ratio?Market Book Value?Value Drivers?
Our Market Share?Effectiveness of Campaigns?Selling Together?Not Selling Well?Selling in What Market?
My Customers?Their Competition?My Next Sales Opportunity?What is Selling Now?
1

23
People – What Is Needed
• Address the human-side systematically
• Obtain top level support
• Involve every layer
• Clearly communicate the business case
• Create ownership, install change agents
• Clearly and continually communicate the message
• Assess the cultural impacts and issues
• Prepare for the unexpected
• Define WIIFM (What's in it for me?) for each role or individual
1

24
Distinguish casual users from power users1
Source: The Data Warehousing Institute, Wayne Erickson, February 2009
Monitor, Analyze, and Drill to detail

25
Match Profiles to Tool Categories
Analytic Profile % Users Users Type of Activity Type of User Optimal Tool Category Important Functionality
Miners 3% 3 Creating Statistical
Models
Statistician Data Mining Tools (neural networks,
decision trees, statistical analysis, etc.)
Workbench that supports model
development lifecycle: Database
integration
Developers 7% 7 Create reports,
queries, OLAP cubes,
applications
Programmer, Systems
Analyst, Technology
Savvy Business Analyst
Ad hoc query tools, reports writers, OLAP
tools, development tools
Query complexity, rapid development
and testing, source data access, report
broad- and select-casting
Explorers 10% 10 Analyze large
amounts of data or
data with lots of
attributes in an
interactive,
exploratory fashion
Business Analyst,
"Power Users"
Relational OLAP Performance scalability, analytical
breadth and depth
Planners 20% 20 Perform "what if"
analyses to create
budgets or planning
assumptions in order
to run a department
Managers Spreadsheets, Desktop OLAP, Multi-
Dimensional OLAP, Custom Applications
Read/write capability, collaboration,
integration with Excel
Reviewers 40% 40 Review a consistent
set of data on a
consistent basis, and
drill down to more
detail only when
something in awry in
the data
Managers, Executives,
Customers, and
Suppliers
Interactive reports (parameterized
formatted reports, pivot tables, or OLAP
views that users filter against)
Exception alerts, personalized delivery,
ease of use
Gatherers 20% 20 Retrieve a specific
piece of data in near
real-time to perform a
specific business
process
Customer Service
Representatives,
Administrative Workers
Custom applications, etc. Ease of use, sub-second response
times, reliability
1

26 Confidential and Proprietary
Think Process, Not Projects
Process, Role, and UML Modeling
AS-IS, TO-BE State Models
Optimize Key Processes
Capture Business Rules
Produce Consistent, Repeatable Results
Focus on Value-Added Activity
STRATEGIC INTENT
HISTORICALDATA
ANALYSIS
DEMANDCREATION
BUSINESSPLANNING
PORTFOLIO PLANNING
PROCESS OPTIMIZATION
DEPLOYMENTPLANNING
EXECUTION
RESULTS CAPTURED
Flow/State Maps
Process Simulation
Reverse Goal Seeking
Value Chain Analysis
Protoytpe Evaluation
Financial Results
Operating Performance Metrics
Capacity Utilization
Intangibiles - (HR, Workplace)
Incentive and Goal Compliance
Other Key Performance Indicators
Kaplan and Norton G3 Scorecard
Benchmark to Best Practices
Earned Value Analysis
Activity Based Costing
BEM (EFQM) Model Conformance
Expand the ability of the organization to execute
Add value to meet customer expectations
Improve organization’s ability to respond quickly
Ensure process quality
Attract / Retain Quality Employees
Improve Communications
Enhance the workplace environment
Process Automation
Workflow
Business Rules enforce Policy
Business Activity Monitoring
Managed Devices
Event Notification
Configuration Management
Product and Data Management
Staffing Utilization
Continuity of Business
Risk Management
Software Portfolio Management
Asset Consolidation and Retirement
ROI, IRR, Financial Measures
Cost Center, P&L Opportunities
Total Cost of Ownership
Define Perspectives, Ontologies
Financial
Customer or External Relations
Internal
Learning and Growth
Strategy Maps, KPIs, Org. Models
Managed Costs Optimization
Capital and Operating Budgets
Service Assortment Planning
Investment Criteria
Clarity of strategy links to execution will help
focus the organization to meet objectives and
align with strategic intent...
2

27Confidential and Proprietary
Think Process, Not Projects2
Design Chain Operations Reference
(DCOR) v1.0
Research IntegrateDesign Source DeliverMake
Product Design Chain Supply Chain
Program Design Chain Cycle Time Order Fulfillment Cycle Time
Customer Requirements
Bill of Materials, Specification
Product
Program and Operational
Business Plan
Supply Chain Operations Reference
(SCOR) v9.0
Product Development Global Operations
Product Lifecycle Management

28
Reduce Action Latency
Value
Time
Text
Business Event
Data Stored
Information Delivered
Action Taken
Action Lag
Data Latency
Analysis Latency
Decision Latency
Opportunity
Costs
Planning, analysis, decision and execution cycles are accelerating
3

29
Deliver value to meet business needs
Source: The Data Warehousing Institute, Wayne Erickson, February 2009
3

30
Right platform for the right job
One size does not fit all…
3

31Confidential and Proprietary
Right tools for the right job
Purchase Analytic tools that are not too complex for casual users but are sophisticated enough for power users.
Source: The Data Warehousing Institute, Wayne Erickson, February 2009
3

32
33%
23%
77%
40%
36%
65%
8%
23%
Have significant decision-
support/analytical capabilities
Value Analytical insights to a very
large extent
Have above average analytical
capability within industry
Use analytics across their entire
organization
Source: Competing on Analytics, Thomas Davenport
Insight – The Competitive Edge
Low Performers
High Performers
High performing companies are more likely to use analytic information strategically
4
Web Analytics Standards: http://www.webanalyticsassociation.org/

33
Think out of the box5
Source: FMS Advanced Systems Group, Sentinel Visualizer
• Find hidden relationships • Identify clusters and patterns quickly • Perform ad-hoc analysis, and test theories and scenarios • Organize complex networks into manageable groups• Geospatial Visualizations

34
Think out of the box5

35
Strategy and approachRoad map development

36
IDEAL Method
Initiating
Diagnosing Establishing
Acting
Learning
ProposeFutureActions
AnalyzeandValidate
Pilot/TestSolution
CreateSolution
Develop Approach
Set Priorities
DevelopRecommendations
Characterize Current and Desired
States
CharterInfrastructure
BuildSponsorship
Stimulus for Change
Set Context
ImplementSolution
RefineSolution
Plan Actions
Roadmap for
Management
Improvement
Initiative
Assessment
Roadmap
Initiative
Projects
The IDEAL(SM) Model
The IDEAL model is an organizational
improvement model that serves as a
roadmap for initiating, planning, and
implementing improvement actions.

37
Creating the Road Map2. Future State Definition 3. Initiatives Definition 4. Prioritization
Business
Objectives
Functional
Needs
High Impact
Business
Processes
Org and
Process
Improvement
Cost and
Complexity
Drivers
Functional
Initiatives
Performance
Targets
Guiding
Principals
Architectural
Imperatives
Organization
Initiatives
Organizational
Initiatives
Process
Initiatives
Roadmap
The process will focus on
placing business objectives,
initiatives, and projects on
the roadmap.
1.
2.
3.
4.
5.
5. Roadmap Development
1.
2.
3.
4.
5.
Business and
Technical
Artifacts
Recommendations
Gap Analysis Optimization Planning ProductsDraft FindingsOutputs From Current
State Field Work
1. Current State
Review
Road Map Development – The Pattern

38
Road Map – Program View
2003 2004 2005 - 2006 2007 - 2008
2003 2004 2005 - 2006 2007 - 2008
v46 04.25.2003
Roadmap
QUALITY OF INFORMATION
A-20 | Define testing framework for assessing
ongoing testing needs of tools/products/platforms/
services
Business
Objectives
Objective
Date
Tactical
Initiatives
Strategic
Initiatives
Initiatives
Completed
Process
and
Organization
Objective Groups Functional Initiative Groups Status
INFORMATION ACCESS & SELF SERVICE
TACTICAL INITIATIVES
DATA
PROCESS AND QA
MAKING SYSTEM CHANGES
F-3b | Automate lower-priority
reconciliation processes to reduce
latency 6-12m
F-2c | Enhance DW to improve accuracy and reliability (Enchance support for all downstream
reporting) 12+ m
F-5a | Move reporting to data warehouse out of mainframe 12+ m
F-2b | Implement H-Routing 1-5m
F-3a | Improve high priority reconciliation capabilities (e.g., labor code
exceptions, claim info for rptg) [PROGRAM] 6-12m
A-2 | Create infrastructure for message-based processing 12m
A-17 | Define and pilot new standard development
environment 3-9m
A-9 | Create relational data store for operational data 12-18m
GMAC-MIC TACTICAL
INITIATIVESBUSINESS GOALS
ARCHITECTURAL IMPERATIVES
B-12 | Decrease time it takes to make
complex plan changes - Currently: 6-7
Months
ST Goal:
2 months
(1y)
LT Goal:
1 month (2y)
B-10 | Decrease time it takes to make simple
plan changes - Currently: 2-3 months ST Goal:
2 weeks (1y)
LT Goal:
On Demand
(2y)
F-2d | Web-enabling claims for non-GM
dealers 6-12m
B-15 | Decreasing % of
policy rejects. Current: ? % ST Goal:
5% (6 mos)
LT Goal:
1% (18 mos)
LT Goal:
90% reduction (1
yr)
B-1 | Decreasing claim payment
leakage ($). Current: 2% ST Goal: 1.5% (< 1 yr)
1 year from implementation LT Goal:: 1% ( > 1 yr)
LT Goal:: 20%
reduction (1 yr from roll-
out)
B-4 | Enhancement costs [25-40% are
repetitive] - Current: 200 req & 3.5 $M / yr
PLATFORM & ENTERPRISE APP INTEGRATION
A-23 | Create relational data store for
informational/reporting data 12m
A-21 | Incorporate GMAC security solution into future state arch 6-12m
A-22 | Incorporate GMAC systems management into
future state arch 6-12m
GM INITIATIVES
ST Goal: 25%
reduction (1y AI) LT Goal:: 40% reduction (?)
B-14 | Accuracy of
Coverage. Currently ? LT Goal:
100%
B-13 | Accuracy of Rates
Currently 100% Ongoing Goal: 100%
F-1a" | Enhance front end for
MES to improve quality of info and
reduce back-end errors 1-5 m
F-1a' | Enhance front end for
CDR to improve quality of info
and reduce back-end errors 1-
5m
A-7 | Establish
standard ETL tools
F-2a | Implement process standardization 6-12m
B-8 | Increase the percentage of transactions completed
online & via phone - Current 100 CSR cancellations/day ST Goal: 40%
reduction (?)
B-2 | Reduce training time
Current: 60 days ST Goal: ? (?)
Biz case being defined
F-1b | IVR Expansion -
Implement self-service policy
cancellation , endorsements, and
agreement transfers 1-5 m
B-7 | Receive more timely field reports / real-time field reports - Current:
Data available 30 dy after quarter end (45 dy after tx for Reinsurance) ST Goal Dependant
upon H-Routing LT Goal:: real-time
DRAFT
Consolidation of reporting
functions: Downstream
Reporting Systems
G-5 | DominoDoc Document
Management System
OTHER GMAC/MIC INITIATIVES
G-15 | (MIC) Claims
assignment
replacement
G-16 |(GMCL) eCM
Target 2004G-11 | (MIC) CTI
G-13 | (MIC) QuickRater(Canada)
G-6 | (MIC) Menu-selling
G-9 | (GMAC) eDealer Target 2003
G-11a | (MIC)
CARES/IVR Upgrade Target 2003 / Early
2004
G-2 | (GM) GMDID Replacement
GM INITIATIVES
G-17 | (GM) WINS ? Target ?
G-12 | (GM) GMVIS
G-5 | (GM) Dealer facing applications web-based by 2006
G-7 | (GM) Retail process vision
G-2 | (GM) GMDID Extended
G-10 | (GM) DSP Common Interface
Target
2003
B-11 | Decrease time it takes to make rate
changes
Currently: 3-4 months, up to a year
ST Goal:
2 weeks (1y)
LT Goal:
On Demand (2y)
Define message
layer testing
standards
Define app
monitoring
standards
F-7 | Implement new reinsurance
system 6-12m
F-17
Choose
solution
approaches
1-3m
STRATEGIC INITIATIVES
F-2" | Implement new claims management
system 12+ m
F-3" | Implement new accounting system 9-14m
F-1" | Implement new policy administration system
9-14m
F-5 | Implement Enterprise-Wide Reporting
System for Operational Data 4-10m
F-10 | Implement new accounting feed to General
Ledger (FMS) 6-12m
F-9 | Implement web self-service 6-12m
F-19 | Baseline EDS support for current
mechanical suite of applications (ongoing)
F-16
Define critical
user, functional,
and tech reqs 3m
F-18 | Define deployment
and retirement strategy 1-5m
Design & Build
7-11m
Deployment and
Migration 2m
Design & Build
7-11 m
Deployment and
Migration 2m
Design & Build
10+ m
Deploy
2m
Deploy
1-4m
Design & Build
3-6m
F-3' | Assess
new accounting
system reqs
(3-4 mos)
...Primary Systems Assessed:
GEAC, FMS, Mechanical
Primary Systems Assessed:
MES, CDR, Mechanical, DCS Canada...
Retirement of systems:
GEAC, FMS
Migration of policy functionality off of systems:
Mechanical, DCS Canada, CDR
Retirement of systems:
MES, Possible retirement of DCS Canada
F-1' | Assess
new policy system
requirements
3-4m
...
...
ENTERPRISE REPORTING SYSTEM
CLAIMS MANAGEMENT SYSTEM
POLICY MANAGEMENT SYSTEM
ACCOUNTING SYSTEM
... F-2' |
Assess new
claims sys
reqs 4-5m
Retirement of system:
Likely retirement of Mechanical, DCS Canada
Primary Systems Assessed:
Mechanical, DCS Canada...
F-5' |
Assess
reporting sys
reqs 1-2m
... ...Primary Systems Assessed:
Data Warehouse, Downstream Reporting Systems
PHASES OF GMAC-MIC STRATEGIC INITIATIVES AND PROGRAMS
Ramp-down support
for GEAC/FMS
Ramp-up support for
accounting system assessment
Ramp-up support for policy
system assessment
Key to Phases
PHASE II
PHASE III
PHASE IV
PHASE V
PHASE I RED
ORANGE
YELLOW
GREEN
BLUE
GMAC/MIC INITIATIVES
MIC PROCESS AND ORGANIZATIONAL INITIATIVES
P-1 | Establish a PMO to manage the
execution of the MIC roadmap 6m
P-2 | Create a framework for
program & project level collaboration
across MIC < 6m
P-3 | Improve IT supplier estimate visibility and quality 12m
P-4 | Improve quality & completeness of systems documentation
<12m
P-5 | Impvove business process documentation >12 m
Ramp-down claims
systems support
Ramp-down policy
systems support
Ramp-up support for
claims system assessment
Reporting
system reqs
Define dev
environment testing
standards
2. Future State Definition 3. Initiatives Definition 4. Prioritization
Business
Objectives
Functional
Needs
High Impact
Business
Processes
Org and
Process
Improvement
Cost and
Complexity
Drivers
Functional
Initiatives
Performance
Targets
Guiding
Principals
Architectural
Imperatives
Organization
Initiatives
Organizational
Initiatives
Process
Initiatives
Roadmap
The process will focus on
placing business objectives,
initiatives, and projects on
the roadmap.
1.
2.
3.
4.
5.
5. Roadmap Development
1.
2.
3.
4.
5.
Business and
Technical
Artifacts
Recommendations
Gap Analysis Optimization Planning ProductsDraft FindingsOutputs From Current
State Field Work
1. Current State
Review

39
Road Map – Details
People and Organization Processes Technology and Tools
2007
Q3 Q2 Q3
2008
Legend:
Q1Q4
Environmental Data Management Roadmap (DRAFT) March 31, 2007
External Dependency
Data Warehouse Roadmap – Proprietary and Confidential June 8, 2005
Assemble Development Teams
Iterative Project Planning
Detail Design
Implementation (Pilot)
Transition to Production
Iterative Project Planning
Detail Design
Implementation
Transition to Production
Iterative Project Planning
Detail Design
Initiate Project
Business Case Development
Complete Business Requirements
Pilot Production Begins
LIMS Subject Area Requirements Defined
Initiate KWS Function
Define, Plan, and Align Process Improvements with Business Requirements
Introduce (IRM) function
Extract, Transform, Load Design Processes
Data Staging Process Design and Build
Detail Process
Design Complete
Configure Development/Test
Environment
Configure Production Environment
Deploy warehouse ETL systems processes
Construct and Test
Core Data Warehouse Foundation (Infrastructure)
Deploy
Iterative
Performance Tuning
Completed
Performance Engineering and Tuning
Tool Evaluation and Selection
Complete detailed design
Initiate Service Management functions
Collaborative Application Prototyping BeginsProtyping Iteration
One Ends
For Exposition Only
DRAFT
Initiate Requirements Change Management
Complete Architecture Design
Query Optimization, Schema Development, Performance tuning
Macro Invertebrate
Data Mart
Completed
Macroinvertebrate Reporting Data Mart Staged
--- Control and Manage Project Iterations ---

40
How to get started

41
How to get started
• Evaluate incremental improvements to existing architecture and enabling technology
• Leverage what you already have
• Ensure you have the capability to deliver• Aligned with agreed strategy and goals
• Supporting organization is well defined
• Processes (vertical through planning and budgeting, or horizontal through lateral relationships (matrix) exist or can be adopted to meet the new platform
• Leverage key people and core competencies
• Performance measures and rewards match intent
• Supporting business case is sound and defensible
• Mitigate or minimize technical and design debt in the design and adoption of the new platform (http://c2.com/cgi/wiki?TechnicalDebt)

42
Leverage what you have
Database Platform, Network, Middleware, Security, Naming Services
Reporting Ad hoc Query Visualization Dashboards Microsoft Office
Integration
Scorecards OLAP Visualization Predictive modeling Data Mining
Workflow and Collaboration Development Metadata Management
Integration
Analysis
Information Delivery
Database Servers
OLAP Servers
Application Servers
Availability (Caching and Failover (HA))
Publishing and Distribution Services
Portal Services
Security Providers
Audit Services
Administration and Monitoring Services
Job Scheduling and Production Controls
Infrastructure

43
Ensure you have the capability to deliver
Enhance Organizational Readiness – identify baseline adoption management capability, create executive consensus, highlight missing operational capabilities
Stage the Transformation - consciously choose maturity jumps, understand the expected change in process consistency and complexity, articulate associated operational impacts
Develop Capability-Based Plans – account for internal deployment bandwidth, factor in time to stabilize the foundations, articulate critical dependencies, secure the participation of critical players
Right-Fit Software Solution
Build Organizational
Capability
Drive Organizational Commitment
Market the Compelling Vision – quantify and repeatedly communicate the value to the organization, develop “what’s in it for me” messaging for critical stakeholders
Proactively Manage Stakeholder Buy-In – create opportunities for stakeholder involvement, design usage metrics and incentives to align behavior
Maintain Strong Governance – execute active executive sponsor involvement, define performance outcomes to direct and track success, hold managers accountable for progress
Refine the Operating Model – balance the trade-offs between structure and process, formally assign decision rights, define the new roles
Enhance Change Leadership – develop manager’s communication, expectation and capacity management skills, assign dedicated transition management resources
Develop User Skills – enhance domain specific skills, increase decision management competency
Do not try to build a system whose complexity
exceeds the organization's capabilities

44
Develop a supporting business case
Table of contents
1. Executive summary
Background
2. Current business
Description/economics
3. Proposed project
Description/strategic fit
4. Options evaluation
5. Timescale and investment analysis
6. Standard management practices
7. Appendices
Supporting material
• Analysis of benefits
• Analysis of costs
• Financial spreadsheet
• Metrics – ROI, NPV, etc.
• Risk analysis and mitigation
• Alignment
• Project change mgmt
• Quality assurance
• Project finance
• Reporting
• Governance

45
Plan and design carefully
Business Need
Logical Specification
Gap Analysis
Current
State
End
StateBusiness
Requirements
Work Breakdown
Structure
Functional Specification – (Statement of Work)
Logical View
Physical View
Process View
Development View
Use Case View (+1)
Construction
Deployment
Concurrency
Operational
Functional
Information
Stakeholder Requirements
Reference ArchitectureSupporting Schedules (micro - schedules)
Detailed Planning Products
Product
Breakdown
Structure
Organization
Breakdown
Structure
SEI-CARR Risk
Taxonomy
System
Component
Taxonomy
Predecessor
Successor
Mapping
Project Plan
Supporting Schedules (micro - schedules)
Supporting Schedules (micro - schedules)
Program Alternatives – Contingency Plans
Approach
Strategy
Measures of
Success
Project Plan Project Plan
System (Non-Functional) Requriements
Business Owners View
Sol
utio
n S
peci
ficat
ion
Request for Quotation
Business Case
Common Information
Model
Canonical Model
Operating Model
Modeling the Analytic Blueprint

46
A word about technical debt…
• Metaphor developed by Ward Cunningham…
• Doing things the quick and dirty way sets us up with a technical debt, which is similar to a financial debt
• Like financial debt, technical debt incurs interest payments in the form of the extra effort in future development due to the quick and dirty design choices.
• We can:
– Choose to continue paying the interest, or
– Pay down the principal by refactoring the quick and dirty design into a better design. Although it costs to pay down the principal, we gain by reduced interest payments in the future.
Technical Debt (Ward Cunningham) http://c2.com/cgi/wiki?TechnicalDebt

Questions and reference links
• Beyond Reporting - Delivering Insights with Next-Generation AnalyticsTDWI 2009, Wayne W. Eckerson
• Applied Enterprise ArchitectureJames Parnitzkehttp://www.pragmaticarchitect.wordpress.com
• Analytic Bridge http://www.analyticbridge.com/
• Emerging Standards
The Predictive Model Markup Language (PMML) http://www.dmg.org/
Web Analytics Standards: http://www.webanalyticsassociation.org/
Example Conformance (Google) http://cutroni.com/blog/2008/09/21/google-analytics-compliance-with-waa-standard-metrics/

Summary
Thank You!
What is new about the next generation?
The five (5) keys for success you need
Strategy and approach (road map development)
• Understanding your current state
• End State - Where do you want to go?
• Gap analysis – uncovering the actionable activities you will need to accomplish success
How to get started

AAJ’s Vision

Consultative Services from Experts
Full-Service One-Stop Shop
Latest Technology
SolutionFrameworks
AAJ’s Mission


