Newton Public Schools 100 Walnut Street Newton, MA 02460€¦ · % Massachusetts%Comprehensive ......
21
Mary Eich Assistant Superintendent for Teaching & Learning Telephone: (617) 559B6125 MEMORANDUM To: David Fleishman From: Mary Eich, Assistant Superintendent for Teaching & Learning Date: January 7, 2016 Re: Partnership for Assessing Readiness for College and Career – PARCC 2015 Massachusetts Comprehensive Assessment System B MCAS 2015 In Spring 2015, elementary and middle school students took the first PARCC assessment in Mathematics and English Language Arts. MCAS testing will continued in Science and Technology/Engineering, and in high school. As has been the case with MCAS for 15 years, results of both tests are reported in three ways: district accountability, student growth, and student achievement. Each has its own measures and comparisons. • District accountability is measured by a cumulative Progress and Performance Index (PPI), which computes progress in narrowing achievement gaps among identified subgroups. • Student growth is measured by a percentile (SGP) which compares each student’s growth over two years to that of a computed group of academic peers. Individual SGPs are combined into a median SGP for a group or subgroup. • Student achievement is measured by a scaled score. MCAS scaled scores, grouped into four performance categories, measures student achievement: advanced, proficient, needs improvement, and warning. PARCC scaled scores are grouped into five categories: Level 5, Level 4, Level 3, Level 2, and Level 1. Accountability and student growth are discussed at the district level. Student achievement is discussed by discipline and grade grouping. In the past, we have included an examination of differences in scores among subgroups over a fiveByear period. At this time, the disaggregated data has not been made available for PARCC, so we will defer that discussion to a later report. Similarly, an MCAS report has traditionally included a discussion of implications of the current year’s data for future test administration. Since we have not yet received item analysis data from PARCC, that discussion also will be deferred. Newton Public Schools 100 Walnut Street Newton, MA 02460
Transcript of Newton Public Schools 100 Walnut Street Newton, MA 02460€¦ · % Massachusetts%Comprehensive ......

Mary%Eich%
Assistant%Superintendent%for%Teaching%&%Learning%
Telephone:%(617)%559B6125%
MEMORANDUM %
To:%%% David%Fleishman% %
From:%%Mary%Eich,%Assistant%Superintendent%for%Teaching%&%Learning%
Date:%%% January%7,%2016%
Re:%%% Partnership%for%Assessing%Readiness%for%College%and%Career%–%PARCC%2015%
% Massachusetts%Comprehensive%Assessment%System%B%MCAS%2015%%
!In%Spring%2015,%elementary%and%middle%school%students%took%the%first%PARCC%assessment%in%
Mathematics%and%English%Language%Arts.%MCAS%testing%will%continued%in%Science%and%
Technology/Engineering,%and%in%high%school.%
%
As%has%been%the%case%with%MCAS%for%15%years,%results%of%both%tests%are%reported%in%three%ways:%
district%accountability,%student%growth,%and%student%achievement.%%Each%has%its%own%measures%
and%comparisons.%%%
• District%accountability%is%measured%by%a%cumulative%Progress%and%Performance%Index%%
(PPI),%which%computes%progress%in%narrowing%achievement%gaps%among%identified%
subgroups.%%
• Student%growth%is%measured%by%a%percentile%(SGP)%which%compares%each%student’s%growth%
over%two%years%to%that%of%a%computed%group%of%academic%peers.%%Individual%SGPs%are%
combined%into%a%median%SGP%for%a%group%or%subgroup.%%%
• Student%achievement%is%measured%by%a%scaled%score.%%MCAS%scaled%scores,%grouped%into%
four%performance%categories,%measures%student%achievement:%advanced,%proficient,%needs%
improvement,%and%warning.%%PARCC%scaled%scores%are%grouped%into%five%categories:%Level%
5,%Level%4,%Level%3,%Level%2,%and%Level%1.%
%
Accountability%and%student%growth%are%discussed%at%the%district%level.%%Student%achievement%is%
discussed%by%discipline%and%grade%grouping.%%In%the%past,%we%have%included%an%examination%of%
differences%in%scores%among%subgroups%over%a%fiveByear%period.%%At%this%time,%the%disaggregated%
data%has%not%been%made%available%for%PARCC,%so%we%will%defer%that%discussion%to%a%later%report.%%%
%
Similarly,%an%MCAS%report%has%traditionally%included%a%discussion%of%implications%of%the%current%
year’s%data%for%future%test%administration.%%Since%we%have%not%yet%received%item%analysis%data%from%
PARCC,%that%discussion%also%will%be%deferred.%%%
%
Newton Public Schools 100 Walnut Street
Newton, MA 02460
% 1%Newton%Public%Schools% PARCC%and%MCAS%2015%Report%
Office%of%Teaching%and%Learning% January%2016%
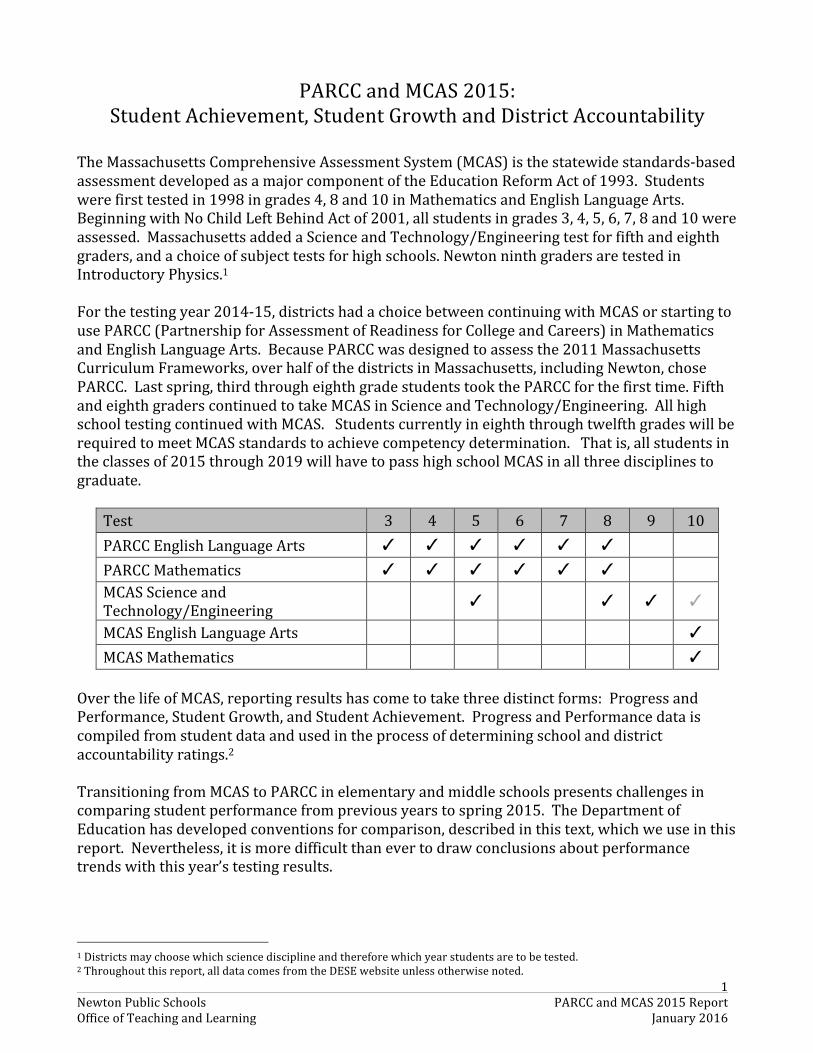
PARCC%and%MCAS%2015:%
Student%Achievement,%Student%Growth%and%District%Accountability%
%The%Massachusetts%Comprehensive%Assessment%System%(MCAS)%is%the%statewide%standardsBbased%
assessment%developed%as%a%major%component%of%the%Education%Reform%Act%of%1993.%%Students%
were%first%tested%in%1998%in%grades%4,%8%and%10%in%Mathematics%and%English%Language%Arts.%%
Beginning%with%No%Child%Left%Behind%Act%of%2001,%all%students%in%grades%3,%4,%5,%6,%7,%8%and%10%were%
assessed.%%Massachusetts%added%a%Science%and%Technology/Engineering%test%for%fifth%and%eighth%
graders,%and%a%choice%of%subject%tests%for%high%schools.%Newton%ninth%graders%are%tested%in%
Introductory%Physics.1%
%
For%the%testing%year%2014B15,%districts%had%a%choice%between%continuing%with%MCAS%or%starting%to%
use%PARCC%(Partnership%for%Assessment%of%Readiness%for%College%and%Careers)%in%Mathematics%
and%English%Language%Arts.%%Because%PARCC%was%designed%to%assess%the%2011%Massachusetts%
Curriculum%Frameworks,%over%half%of%the%districts%in%Massachusetts,%including%Newton,%chose%
PARCC.%%Last%spring,%third%through%eighth%grade%students%took%the%PARCC%for%the%first%time.%Fifth%
and%eighth%graders%continued%to%take%MCAS%in%Science%and%Technology/Engineering.%%All%high%
school%testing%continued%with%MCAS.%%%Students%currently%in%eighth%through%twelfth%grades%will%be%
required%to%meet%MCAS%standards%to%achieve%competency%determination.%%%That%is,%all%students%in%
the%classes%of%2015%through%2019%will%have%to%pass%high%school%MCAS%in%all%three%disciplines%to%
graduate.%
%
Test%% 3% 4% 5% 6% 7% 8% 9% 10%
PARCC%English%Language%Arts% ✓% ✓% ✓% ✓% ✓% ✓% % %
PARCC%Mathematics% ✓% ✓% ✓% ✓% ✓% ✓% % %
MCAS%Science%and%
Technology/Engineering%% % ✓% % % ✓% ✓% ✓%
MCAS%English%Language%Arts% % % % % ✓%
MCAS%Mathematics%% % % % % ✓%
%
Over%the%life%of%MCAS,%reporting%results%has%come%to%take%three%distinct%forms:%%Progress%and%
Performance,%Student%Growth,%and%Student%Achievement.%%Progress%and%Performance%data%is%
compiled%from%student%data%and%used%in%the%process%of%determining%school%and%district%
accountability%ratings.2%%%
%
Transitioning%from%MCAS%to%PARCC%in%elementary%and%middle%schools%presents%challenges%in%
comparing%student%performance%from%previous%years%to%spring%2015.%%The%Department%of%
Education%has%developed%conventions%for%comparison,%described%in%this%text,%which%we%use%in%this%
report.%%Nevertheless,%it%is%more%difficult%than%ever%to%draw%conclusions%about%performance%
trends%with%this%year’s%testing%results.%%%
%
% %
%%%%%%%%%%%%%%%%%%%%%%%%%%%%%%%%%%%%%%%%%%%%%%%%%%%%%%%%1%Districts%may%choose%which%science%discipline%and%therefore%which%year%students%are%to%be%tested.%%%2%Throughout%this%report,%all%data%comes%from%the%DESE%website%unless%otherwise%noted.%

% 2%Newton%Public%Schools% PARCC%and%MCAS%2015%Report%
Office%of%Teaching%and%Learning% January%2016%
District%Accountability:%%Progress%and%Performance%%%
The%Progress%and%Performance%Index%(PPI)%was%new%in%2012,%and%replaced%the%No%Child%Left%
Behind%goal%of%100%percent%student%proficiency%by%2014%with%the%goal%of%reducing%proficiency%
gaps%by%half%by%2017.%%The%proficiency%gap%is%defined%as%“the%distance%between%a%group’s%current%
proficiency%level%and%100%%proficiency.”%%%%
The%PPI%uses%a%100Bpoint%scale%and%combines%information%on%up%to%seven%indicators:%%
o narrowing%proficiency%gaps%in%English%language%arts,%Mathematics,%and%science;%%
o growth%in%English%language%arts%and%Mathematics;%%
o annual%dropout%rates;%and%%
o cohort%graduation%rates.%
Extra%credit%points%are%awarded%for%increasing%the%percentage%of%students%achieving%a%
performance%level%of%advanced%in%English,%Math%and%Science,%and%for%decreasing%the%failure%rate.%%%
Each%school’s%PPI%rating%is%combined%with%PPI%ratings%from%the%past%three%years%to%form%a%
Cumulative%Progress%and%Performance%Index.%%%A%group%must%have%a%Cumulative%PPI%of%75%or%
higher%to%be%considered%making%progress%towards%narrowing%proficiency%gaps.%%%
The%Cumulative%PPI%for%all%students%and%for%the%High%Needs3%student%group%must%be%75%or%higher%
to%be%granted%Level%1%Accountability%and%Assistance%status.%%%A%district%is%assigned%the%
Accountability%and%Assessment%level%of%its%lowest%school.%%%
Seven%of%our%schools,%Burr,%LincolnBEliot,%MasonBRice,%Ward,%Brown,%North%and%South,%are%Level%1%
schools%this%year.%%All%others%are%Level%2%schools,%making%Newton%Public%Schools%a%Level%2%district.%%
%
Student%Growth%%
Student%progress%is%also%measured%with%respect%to%growth%from%previous%years.%%A%Student%
Growth%Percentile%(SGP)%is%computed%for%each%fourth%through%eighth%grade%student%in%
Mathematics%and%English%Language%Arts,%comparing%his%or%her%progress%to%their%academic%peers4%
in%Massachusetts.%
Almost%by%definition,%the%median%Student%Growth%Percentile%is%50.%%SGP%above%60%and%below%40%
are%considered%significant.%%Median%Student%Growth%Percentile%(SGP)%for%2015%PARCC%English%
Language%Arts%is%56%and%for%Mathematic%is%60.%
Median%SGP%in%Mathematics%in%2015%is%60%or%above%at%Mason%Rice,%Peirce,%Williams,%Bigelow,%Day,%
and%Oak%Hill.%In%English%Language%Arts,%median%SGP%is%60%or%above%at%Angier,%Cabot%LincolnBEliot,%
MasonBRice,%Peirce,%Ward,%Bigelow,%Day%and%Newton%South.%%%
Student%Growth%Percentiles%for%subgroups%have%not%been%issued%by%the%Department%of%
Elementary%and%Secondary%Education%at%this%time.%%%
%
% %
%%%%%%%%%%%%%%%%%%%%%%%%%%%%%%%%%%%%%%%%%%%%%%%%%%%%%%%%3%Economically%disadvantaged%students,%English%language%learners,%and%students%with%disabilities%4%The%student%growth%percentile%describes%the%relative%growth%a%student%made%compared%to%other%students%with%the%
same%achievement%history—their%academic%peers.%Academic%peers%are%not%an%actual%set%of%students%but%are%
constructed%using%all%the%state’s%data.%%http://www.doe.mass.edu/mcas/growth/%

% 3%Newton%Public%Schools% PARCC%and%MCAS%2015%Report%
Office%of%Teaching%and%Learning% January%2016%
Student%Achievement%%%% %
The%number%of%points%students%are%awarded%for%correct%responses%on%any%MCAS%test%is%translated%
to%a%scaled%score%of%between%200%and%280.%%%Students%are%assigned%to%a%performance%level%based%
on%scaled%scores.%%%
MCAS%Performance%Level% Scaled%Score%Minimum% Scaled%Score%Maximum%
Advanced% 260% 280%
Proficient% 240% 258%
Needs%Improvement% 220% 238%
Warning%(Failing%Gr10)% 200% 218%%
The%number%of%points%students%are%awarded%for%correct%responses%on%any%PARCC%test%is%
translated%to%a%scaled%score%of%between%650%and%850.%%%Students%are%assigned%to%a%performance%
level%based%on%scaled%scores.%%%
PARCC%Performance%Level%Scaled%Score%
Minimum%
Scaled%Score%
Maximum%
Level%5%–%Exceeds%Expectations% Varies:%783B810% 850%
Level%4%–%Meets%Expectations% 750% Varies:%782B809%
Level%3%–%Approaching%Expectations% 725% 749%
Level%2%–%Partially%Meets%Expectations% 700% 724%
Level%1%–%Did%not%yet%meet%expectations% 650% 699%
%
Throughout%this%report,%student%achievement%levels%in%2015%assessments%are%compared%to%
previous%years.%%In%the%case%of%English%Language%Arts%and%Mathematics%in%grades%3%–%8,%this%
comparison%is%not%exact,%since%the%scaled%
scores%are%allocated%to%five%performance%
levels%rather%than%four%for%MCAS.%%%
The%Massachusetts%Department%of%
Elementary%and%Secondary%Education%
has%defined%PARCC%Performance%Levels%
4%and%5%as%“meeting%or%exceeding%
expectations.”%%%For%purposes%of%
comparing%PARCC%2015%to%previous%
years’%MCAS,%Levels%4%and%5%are%
equivalent%to%Proficient%and%Advanced.%%%
PARCC%Performance%Level%1%is%
equivalent%to%MCAS%Warning,%leaving%
PARCC%Proficiency%Levels%2%and%3%
equivalent%to%MCAS%Needs%Improvement.%%
Level%3%Is%represented%in%lavender,%
distinguish%but%connect%it%to%“Needs%
Improvement.”%%%
%
3% 4% 2%
16% 12%6%
11%
51%48%
55%
30%35%
26%
2013%%%%%%%%%%
MCAS%
2014%%%%%%%%%%%
MCAS%
2015%%%%%%%%%%%%%
PARCC%
EXAMPLE%COMPARISON%
MCAS%and%PARCC!
Level%5/Advanced%
Level%4/Proiicient%
Level%3/Needs%
Improvement%
Level%2/Needs%
Improvement%
Level%1/Warning%

% 4%Newton%Public%Schools% PARCC%and%MCAS%2015%Report%
Office%of%Teaching%and%Learning% January%2016%
Differences%in%Performance%Between%Modes%of%PARCC%Administration%%
Individual%schools%were%able%to%make%a%choice%of%administration%modes%for%PARCC%2015.%%Eleven%
elementary%schools%and%two%middle%schools%chose%computerBbasedBtesting,%while%four%
elementary%schools%and%two%middle%schools%chose%paperBbased%testing.%%We%expected%that%
computerBbased%testing%would%be%a%more%challenging%for%the%adults%who%had%to%make%sure%all%the%
equipment%was%available%and%correctly%configured%and%all%the%systems%to%transmit%student%
responses%worked%at%all%times.%%Our%Technology%team%began%working%on%the%infrastructure%early%
in%2015%and%continued%onsite%monitoring%through%the%last%day%of%testing%in%May.%%Building%
administrators%and%teachers,%who%had%become%expert%MCAS%administrators,%worked%through%
unfamiliar%requirements%and%routines,%and%for%the%most%part,%testing%ran%smoothly.%%%
%
What%we%did%not%expect%was%a%significant%difference%in%student%achievement%between%computerB%
based%testing%schools%and%paperBbased%testing%schools.%%%
%
In%our%computerBbased%middle%schools,%78%%of%all%students%
tested%scored%at%Levels%4%and%5%in%English%Language%Arts,%
compared%to%86%%in%our%paper%based%schools.%%Differences%
were%less%extreme%but%still%evident%in%math.%%%
%
%
Distribution%of%Student%Scores%in%Middle%Schools%
%
%% %
78%%
22%%
ELA%PARCC%2015%%
Computer%Administration%Schools%
%%%4%+%5%
%%%1%+%2%+%3%86%%
14%%
ELA%PARCC%2015%%
PaperBBased%Administration%Schools%
%%%4%+%5%
%%%1%+%2%+%3%
76%%
25%%
Math%PARCC%2015%%
Computer%Administration%Schools%
%%4%+%5%
%%%1%+%2%+%3%
79%%
21%%
Math%PARCC%2015%%
PaperBBased%Administration%Schools%
%%4%+%5%
%%%1%+%2%+%3%
PaperBBased%Schools%
Bigelow,%Day%
%
ComputerBBased%Schools%
Brown,%Oak%Hill%

% 5%Newton%Public%Schools% PARCC%and%MCAS%2015%Report%
Office%of%Teaching%and%Learning% January%2016%
%
Disparities%in%scores%were%more%extreme%in%
elementary%schools.%%In%our%computerBbased%schools,%
71%%of%all%students%tested%scored%at%Levels%4%and%5%in%
English%Language%Arts,%compared%to%88%%in%our%
paper%based%schools,%a%difference%of%17%points.%%
Mathematics%scores%were%similarly%skewed,%with%
69%%of%all%students%tested%on%a%computer%scoring%at%
Level%4%or%5,%compared%to%79%%of%those%who%were%
tested%with%paper.%%
%
%
%
%
%
Distribution%of%Student%Scores%in%Elementary%Schools%
%
%%
%
%
%
71%%
29%%
ELA%PARCC%2015%%
Computer%Administration%Schools%
%%%4%+%5%
%%%1%+%2%+%3%88%%
12%%
ELA%PARCC%2015%!Paper%Administration%Schools!
%%%4%+%5%
%%%1%+%2%+%3%
69%%
31%%
Math%PARCC%2015%!Computer%Administration%Schools!
%%%4%+%5%
%%%1%+%2%+%3%79%%
21%%
Math%PARCC%2015%!Paper%Administration%Schools!
%%%4%+%5%
%%%1%+%2%+%3%
PaperBBased%Schools%
Angier,%LincolnBEliot,%Mason%Rice,%
Ward%%
%
ComputerBBased%Schools%
Bowen,%Burr,%Cabot,%Countryside,%
Franklin,%Horace%Mann,%Memorial%
Spaulding,%Peirce,%Underwood,%
Williams,%Zervas%%

% 6%Newton%Public%Schools% PARCC%and%MCAS%2015%Report%
Office%of%Teaching%and%Learning% January%2016%
Student%Achievement%in%English%Language%Arts%%
%
Student%progress%in%English%
Language%Arts%is%assessed%every%
year%beginning%in%third%grade%
and%continuing%through%middle%
school.%%Writing%is%assessed%in%
every%grade%through%extended%
response%items.%%
Elementary:%Grades%3B5%%
Performance%of%students%in%
grades%3,%4%and%5%continues%to%be%
strong,%despite%a%slight%decline%
between%Proficient%and%
Advanced%in%2014%and%Levels%4%
and%5%in%2015.%
Student%Growth%Percentiles%in%
grade%4%dropped%from%67%in%
2014%MCAS%to%57%in%2015%
PARCC.%%Similarly,%in%grade%5,%
Student%Growth%Percentiles%
dropped%from%58%in%2014%MCAS%
to%53%in%2015%PARCC.%%%
Student%Growth%Percentiles%are%
not%computed%for%Grade%3,%since%
that%is%the%first%year%of%testing.%%
%
%
Grades%4%&%5%ELA%
SGP% 2013% 2014% 2015%
4th% 65% 67% 57%
5th% 66% 58% 53%
%
%%%
%
%
%
41% 37%
17%
44% 47%
63%
13%11% 12%6%5% 4% 1%
2013%MCAS%%
n=1022%
2014%MCAS%%
n=932%
2015%PARCC%%%
n=955%
English%Language%Arts%Grade%5%
Level%1/Warning%
Level%2/Needs%
Improvement%
Level%3/Needs%
Improvement%
Level%4/Proiicient%
Level%5/Advanced%
25% 32% 31%
51%49% 46%
15%17% 15%5%6% 4% 2%
2013%MCAS%%
n=929%
2014%MCAS%%
n=975%
2015%PARCC%%%
n=948%
English%Language%Arts%Grade%4%
Level%1/Warning%
Level%2/Needs%
Improvement%
Level%3/Needs%
Improvement%
Level%4/Proiicient%
Level%5/Advanced%
21% 22%13%
59% 56%
56%
19%
19% 18%9%
2% 4% 3%
2013%MCAS%%
n=979%
2014%MCAS%%
n=972%
2015%PARCC%%%
n=920%
English%Language%Arts%Grade%3%
Level%1/Warning%
Level%2/Needs%
Improvement%
Level%3/Needs%
Improvement%
Level%4/Proiicient%
Level%5/Advanced%

% 7%Newton%Public%Schools% PARCC%and%MCAS%2015%Report%
Office%of%Teaching%and%Learning% January%2016%
English%Language%Arts:%%%
Middle%School%All%Grades%6%B%8%
As%the%charts%at%right%show,%
Newton%Middle%School%students%
continue%to%achieve%at%high%levels%
in%English%Language%Arts,%despite%
a%drop%in%students%scoring%
Proficient%and%Advanced%in%2014%
to%students%scoring%at%Levels%4%
and%5%in%2015.%
Consistent%with%past%years%of%
MCAS%middle%school%scores,%
seventh%and%eighth%graders%
substantially%outperformed%sixth%
graders.%%%%%
Student%Growth%Percentiles%
increased%by%10%points%in%Grade%6,%
9%points%in%Grade%7,%and%4%points%
in%Grade%8.%%
%
Middle%School%ELA%
SGP% 2013% 2014% 2015%
6th% 58% 48% 58%
7th% 46% 51% 60%
8th% 59% 58% 62%
%
%
%%
27% 23%
44%
61% 66%41%
10%9% 7%4%3% 3% 1%
2013%MCAS%%
n=922%
2014%MCAS%%
n=906%
2015%PARCC%%%
n=921%
English%Language%Arts%Grade%7%
Level%1/Warning%
Level%2/Needs%
Improvement%
Level%3/Needs%
Improvement%
Level%4/Proiicient%
Level%5/Advanced%
33% 30% 25%
52% 53%53%
15%10% 12%
5%5% 5% 2%
2013%MCAS%%
n=905%
2014%MCAS%%
n=970%
2015%PARCC%%%
n=884%
English%Language%Arts%Grade%6%
Level%1/Warning%
Level%2/Needs%
Improvement%
Level%3/Needs%
Improvement%
Level%4/Proiicient%
Level%5/Advanced%
3% 2% 1%5% 4% 3%
10%
49%59% 48%
43%34% 37%
2013%MCAS%%%%%%%%%%%%%%%%%%%%%%
n=894%
2014%MCAS%%%%%%%%%%%%%%%
n=932%
2015%PARCC%%%
n=880%
English%Language%Arts%Grade%8%
Level%5/Advanced%
Level%4/Proiicient%
Level%3/Needs%
Improvement%
Level%2/Needs%
Improvement%
Level%1/Warning%

% 8%Newton%Public%Schools% PARCC%and%MCAS%2015%Report%
Office%of%Teaching%and%Learning% January%2016%
English%Language%Arts:%%High%School%Grade%10%
We%have%made%substantial%progress%in%increasing%the%percentage%of%Newton%Public%Schools%
sophomores%scoring%in%the%advanced%performance%level%in%the%past%six%years%–%more%than%
doubling%the%rate%from%35%%in%2008%to%72%%in%2015.%%%
We%have%also%reduced%the%number%of%students%failing%the%English%Language%Arts%Grade%10%MCAS,%
from%2%%to%1%,%and%in%the%“needs%improvement”%performance%level%from%8%%to%3%.%%%
%
Differences%in%Achievement%Among%Subgroups%%
The%commitment%of%teachers%to%narrowing%the%achievement%gap%has%significantly%reduced%the%
needs%improvement%and%failure%rates%of%African%American/Black,%Low%Income,%and%High%Needs5%
students%in%English%Language%Arts%Grade%10%MCAS.%%%
African%American/Black%students%rates%of%scoring%below%proficient%have%fallen%from%36%%in%2010%
to%16%%in%2015.%%Similarly,%Economically%Disadvantages%students’%rates%fell%from%30%%in%2010%to%
11%%in%2015;%and%rates%for%high%needs%students%dropped%from%20%%in%2011%to%11%%in%2015%
Additionally,%the%percent%of%African%American,%Low%Income%and%High%Needs%students%scoring%
Advanced%increased%substantially%in%the%2015%MCAS%administration.%%%
Still,%differences%in%achievement%at%the%advanced%level%are%striking.%%While%72%%of%Newton%tenth%
graders%achieved%an%advanced%performance%level,%only%a%little%over%a%half%as%many%African%
American,%Low%Income%and%High%Needs%students%did%the%same.%
%
%
%%%%%%%%%%%%%%%%%%%%%%%%%%%%%%%%%%%%%%%%%%%%%%%%%%%%%%%%5%Economically%Disadvantaged%students,%English%Language%Learners,%and%students%with%disabilities%
45%58% 61%
70%64%
72%
44%
35% 35%27%
33%24%
8% 6% 3% 2% 3% 3%2% 1% 1% 1% 1% 1%
2010%%%%%%%%%%%%
n=844%
2011%%%%%%%%%%%%%
n=868%
2012%%%%%%%%%%%%
n=908%
2013%%%%%%%%%%
n=894%
2014%%%%%%%%%%%%
n=942%
2015%%%%%%%%%%%%
n=955%
English%Language%Arts%MCAS%Grade%10%
All%Students%
Advanced% Proiicient% Needs%Improvement% Failing%

% 9%Newton%Public%Schools% PARCC%and%MCAS%2015%Report%
Office%of%Teaching%and%Learning% January%2016%
%
%
%
11%24% 18%
35% 25%38%
52%50%
75%57%
59%46%
36% 22%7% 6% 12% 15%
0% 4% 0% 2% 4% 2%
2010%%%
n=44%
2011%%%
n=50%
2012%%%
n=55%
2013%%%
n=51%
2014%%%
n=51%
2015%%%%%%%%%%%%
n=48%
English%Language%Arts%MCAS%Grade%10%
African%American/Black%Students%
Advanced% Proiicient% Needs%Improvement% Failing%
13% 20% 26%46%
33% 41%
57%55%
63%47%
54% 48%
27% 23%10% 7% 12% 10%3% 2% 1% 0% 1% 1%
2010%%%
n=102%
2011%%%
n=88%
2012%%%
n=116%
2013%%%%%%
n=116%
2014%%%
n=109%
2015%%%%%%%%%%%%
n=122%
%English%Language%Arts%MCAS%Grade%10%
Economically%Disadvantaged%Students%
Advanced% Proiicient% Needs%Improvement% Failing%
26% 31% 40% 34% 39%
54%58% 50% 56% 49%
16%9% 6% 8% 8%
4% 2% 4% 2% 3%
2011%%%%%%%%%%%%%%%%%%%%%
n=273%
2012%%%%%%%%%%%%%%%%%%%%%%%%%%%%
n=325%
2013%%%%%%%%%%%%%%%%%%
n=299%
2014%%%%%%%%%%%%%%%%%%%
n=321%
2015%%%%%%%%%%%%
n=308%
%English%Language%Arts%MCAS%Grade%10%
HIgh%Needs%Students%
Advanced% Proiicient% Needs%Improvement% Failing%

% 10%Newton%Public%Schools% PARCC%and%MCAS%2015%Report%
Office%of%Teaching%and%Learning% January%2016%
Mathematics%%%
Student%achievement%in%
Mathematics%is%assessed%every%
year%beginning%in%third%grade%and%
continuing%through%eighth%grade.%
In%2015,%elementary%and%middle%
school%students%were%assessed%
with%PARCC%for%the%first%time.%%
High%School%students%continued%
to%take%MCAS%in%grade%10%as%part%
of%their%competency%
determination.%%
%
%
Mathematics%Elementary:%%
Grades%3%B%5%
%
Student%achievement%in%
elementary%school%Mathematics%
continues%to%be%high%compared%to%
the%state%average.%%However,%the%
percent%of%students%scoring%at%
Levels%4%and%5%in%PARCC%
elementary%mathematics%is%
substantially%lower%than%previous%
years’%percent%of%students%scoring%
Proficient%and%Advanced%on%
elementary%Mathematics%MCAS.%%
%
Student%Growth%Percentiles%were%
54%and%56%in%grades%4%and%5%
respectively.%%%
%%
Grades%4%&%5%Math%
SGP% 2013% 2014% 2015%
4th% 71% 63% 54%
5th% 65% 52% 56%
%
%
56% 53%
23%
27% 28%
50%
16%11% 13%
7%6% 7% 2%
2013%MCAS%%
n=1026%
2014%MCAS%%
n=933%
2015%PARCC%%%
n=957%
Math%Grade%5%
MCAS%and%PARCC%All%Students!
Level%1/Warning%
Level%2/Needs%
Improvement%
Level%3/Needs%
Improvement%
Level%4/Proiicient%
Level%5/Advanced%
42% 44%
15%
33% 34%
56%
16%21% 18%
9%4% 4% 3%
2013%MCAS%%
n=934%
2014%MCAS%%
n=979%
2015%PARCC%%%
n=947%
Math%Grade%4%
MCAS%and%PARCC%All%Students!
Level%1/Warning%
Level%2/Needs%
Improvement%
Level%3/Needs%
Improvement%
Level%4/Proiicient%
Level%5/Advanced%
52% 53%
23%
33% 33%
38%
20%
11% 11% 7%4% 3% 2%
2013%MCAS%%
n=981%
2014%MCAS%%
n=977%
2015%PARCC%%%
n=924%
Math%Grade%3%
MCAS%and%PARCC%All%Students!
Level%1/Warning%
Level%2/Needs%
Improvement%
Level%3/Needs%
Improvement%
Level%4/Proiicient%
Level%5/Advanced%
% 11%Newton%Public%Schools% PARCC%and%MCAS%2015%Report%
Office%of%Teaching%and%Learning% January%2016%
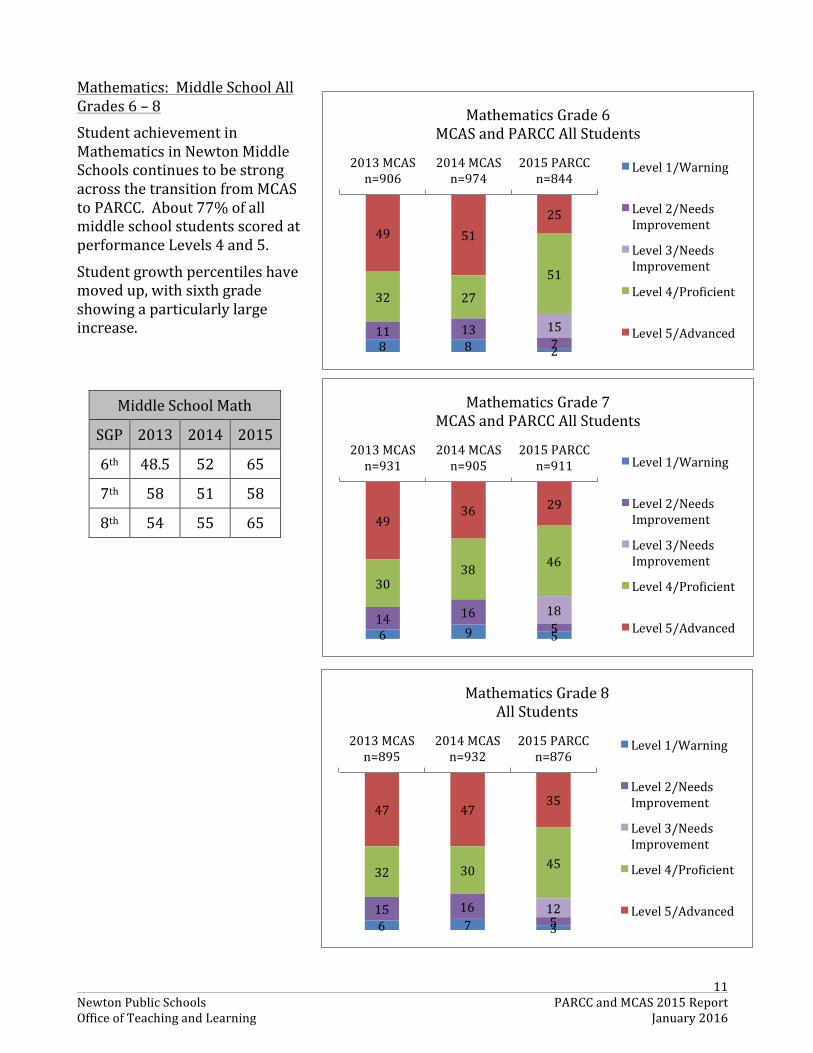
Mathematics:%%Middle%School%All%
Grades%6%–%8%%
Student%achievement%in%
Mathematics%in%Newton%Middle%
Schools%continues%to%be%strong%
across%the%transition%from%MCAS%
to%PARCC.%%About%77%%of%all%
middle%school%students%scored%at%
performance%Levels%4%and%5.%%%
Student%growth%percentiles%have%
moved%up,%with%sixth%grade%
showing%a%particularly%large%
increase.%%%
%
%%
Middle%School%Math%
SGP% 2013% 2014% 2015%
6th% 48.5% 52% 65%
7th% 58% 51% 58%
8th% 54% 55% 65%
%
%
47% 47%35%
32% 30%45%
12%15% 16%5%6% 7% 3%
2013%MCAS%%%%
n=895%
2014%MCAS%%
n=932%
2015%PARCC%%%
n=876%
Mathematics%Grade%8%%
All%Students!
Level%1/Warning%
Level%2/Needs%
Improvement%
Level%3/Needs%
Improvement%
Level%4/Proiicient%
Level%5/Advanced%
49% 51%
25%
32% 27%
51%
15%11% 13%7%8% 8% 2%
2013%MCAS%%
n=906%
2014%MCAS%%
n=974%
2015%PARCC%%%
n=844%
Mathematics%Grade%6%%
MCAS%and%PARCC%All%Students!
Level%1/Warning%
Level%2/Needs%
Improvement%
Level%3/Needs%
Improvement%
Level%4/Proiicient%
Level%5/Advanced%
49%36%
29%
30%38%
46%
18%14%
16%
5%6% 9% 5%
2013%MCAS%%
n=931%
2014%MCAS%%
n=905%
2015%PARCC%%%
n=911%
Mathematics%Grade%7%
MCAS%and%PARCC%All%Students!
Level%1/Warning%
Level%2/Needs%
Improvement%
Level%3/Needs%
Improvement%
Level%4/Proiicient%
Level%5/Advanced%

% 12%Newton%Public%Schools% PARCC%MCAS%2014%Report%
Office%of%Teaching%and%Learning% January%2016%
Mathematics:%%High%School%Grade%10%
The%percentage%of%students%
scoring%in%the%proficient%and%
advanced%performance%levels%on%
the%tenth%grade%Mathematics%
MCAS%has%grown%from%90%%in%
2010%to%94%%in%2015.%%Looking%
further%back,%Mathematics%
student%achievement%has%
increased%from%a%low%of%51%%
proficient%and%advanced%in%
1999.%%%
The%percent%of%students%scoring%
advanced%has%increased%from%
76%%to%81%%in%the%same%period.%%%
%
Differences%in%Achievement%
Among%Subgroups%
As%the%line%graph%below%shows,%
progress%on%increasing%the%number%of%students%achieving%at%the%proficient%and%advanced%
performance%levels%on%the%Mathematics%Grade%10%MCAS%has%included%improvements%in%the%
achievement%rate%of%African%American/Black%High%Needs,%and%Low%Income%students,%despite%a%
decline%in%2015%scores.%%%%
However,%the%performance%gap%is%still%significant,%particularly%in%the%advanced%level.%%%
%
%
%
%
%
%
%
76% 74% 77% 76% 81% 81%
14% 18% 17% 16%13% 13%
7% 6% 4% 5% 4% 5%3% 2% 2% 3% 1% 1%
2010%%%%%%
n=849%
2011%%%%%%
n=866%
2012%%%
n=904%
2013%%%%%%
n=897%
2014%%%
n=943%
2015%%%%%%%%%%%%
n=955%
Mathematics%Grade%10%
MCAS%All%Students%
ADVANCED% PROFICIENT% NEEDS%IMPROVEMENT% FAILING%
50%
55%
60%
65%
70%
75%
80%
85%
90%
95%
100%
2008% 2009% 2010% 2011% 2012% 2013% 2014% 2015%
Percent%of%Students%Scoring%Proiicnet%and%
Advanced%%
Mathematics%MCAS%Grade%10%
Comparative%Achievement%All%Newton%Students% African%American/Black%
Low%Income% High%Needs%

% 13%Newton%Public%Schools% PARCC%MCAS%2014%Report%
Office%of%Teaching%and%Learning% January%2016%
%
46% 52% 47%58% 55%
33%32%
31%27% 28%
14% 11% 14%11% 13%
7% 5% 8% 4% 5%
2011%%%%%%%%
n=270%
2012%%%%%%%%
n=323%
2013%%%%%%%%
n=301%
2014%%%%%%%%
n=321%
2015%%%%%%%%%%%%%%%%%
n=308%
Mathematics%Grade%10%
High%Needs%Students%
Advanced% Proiicient% Needs%Improvement% Failing%
42% 43% 47% 48% 56% 54%
25%35% 37% 28%
30% 30%25%
16% 13% 20% 9% 12%8% 6% 3% 4% 5% 3%
2010%%%
n=102%
2011%%%%%%%%
n=88%
2012%%%
n=115%
2013%%%%%
n=120%
2014%%%
n=110%
2015%%%%%%%%%%%%
n=122%
Mathematics%Grade%10%
Economically%Disadvantaged%Students%
Advanced% Proiicient% Needs%Improvement% Failing%
36% 30% 33% 32%49% 47%
20% 40%47% 40%
29% 30%34%
18%18%
23% 14% 17%9% 12% 2% 6% 8% 6%
2010%%%%%%%%%%%
n=44%
2011%%%%%%%%%%
n=50%
2012%%%%%%%%%%
n=55%
2013%%%%%%%%%%%%
n=53%
2014%%%%%%%%%%
n=51%
2015%%%%%%%%%%%%
n=47%
Mathematics%Grade%10%
African%American/Black%Students%
Advanced% Proiicient% Needs%Improvement% Failing%

% 14%Newton%Public%Schools% PARCC%MCAS%2014%Report%
Office%of%Teaching%and%Learning% January%2016%
Science%and%Technology/%Engineering%%
Only%students%in%Grades%5%and%8%and%high%school%take%an%MCAS%in%Science%and%
Technology/Engineering.%%As%such,%they%are%a%de%facto%cumulative%test%of%three%or%more%
years%of%science%instruction.%%The%tests%are%presently%based%on%the%2006%Science%Curriculum%
Frameworks.%%The%release%of%the%Next%Generation%Science%Standards%last%year%will%inform%
changes%in%Massachusetts%Curriculum%Frameworks,%which%are%expected%to%be%finalized%in%
early%2016.%
%Elementary%Schools:%Grade%5%
Student%performance%on%the%
Grade%5%Science%and%
Technology/Engineering%MCAS%
has%been%variable%in%the%past%five%
years,%with%the%proficient%and%
advanced%rates%declining%in%2014%
and%2015.%%However,%students%in%
our%district%have%continued%to%
outperform%their%statewide%peers.%%%
%
%%
%
Middle%Schools:%Grade%8%%
%
When%students%enter%middle%school,%Science%becomes%a%core%subject,%with%students%
receiving%instruction%daily,%usually%from%a%licensed%science%teacher.%%Technology/%
Engineering%becomes%one%of%five%offerings%in%the%Fine%and%Applied%Arts%rotation,%with%
students%receiving%instruction%an%average%of%40%days%per%year,%usually%from%a%licensed%
engineering%teacher.%%
%
Student%achievement%in%Grade%8%
Science%and%Technology/%
Engineering%remained%stable%
through%2014%–%with%the%percent%
of%students%scoring%in%the%
advanced%and%proficient%levels%
changing%from%64%%in%2010%to%
63%%in%2014.%%Students%scored%less%
well%in%2015,%with%only%58%%
achieving%at%the%proficient%or%
advanced%levels.%%
%
%
%%% %
31% 30% 37% 39% 34% 25%
45% 45% 34% 34% 37%42%
20% 22% 23% 22% 24% 29%
3% 4% 6% 6% 8% 4%
2010%%%%%%%%
n=855%
2011%%%%%
n=967%
2012%%%%%%%
n=933%
2013%%%%%%%%%
n=1025%
2014%%%%
n=932%
2015%%%%
n=78%
Science%and%Tech/Engineering%%
Grade%5%%All%Students%
Advanced% Proiicient% Needs%Improvement% Failing%
11% 8% 11% 12% 9% 6%
53% 49% 52% 52% 54% 52%
29% 36% 28% 29% 31% 35%
8% 7% 9% 7% 6% 7%
2010%%
n=846%
2011%
n=818%
2012%%
n=869%
2013%%
n=893%
2014%%
n=926%
2015%%%%
n=918%
Science%and%Tech/Engineering%Grade%8%%
All%Students%%
Advanced% Proiicient% Needs%Improvement% Failing%
% 15%Newton%Public%Schools% PARCC%MCAS%2014%Report%
Office%of%Teaching%and%Learning% January%2016%
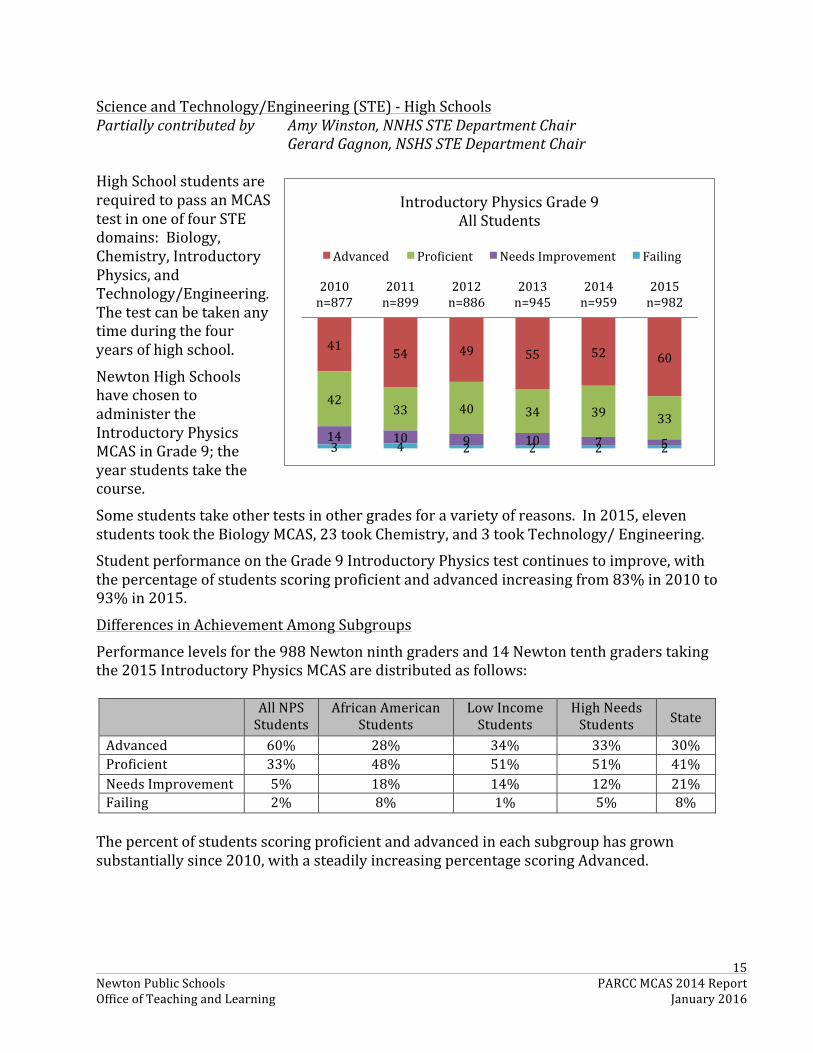
Science%and%Technology/Engineering%(STE)%B%High%Schools%
Partially(contributed(by(( Amy(Winston,(NNHS(STE(Department(Chair(((( ( ( Gerard(Gagnon,(NSHS(STE(Department(Chair(
%
High%School%students%are%
required%to%pass%an%MCAS%
test%in%one%of%four%STE%
domains:%%Biology,%
Chemistry,%Introductory%
Physics,%and%
Technology/Engineering.%%
The%test%can%be%taken%any%
time%during%the%four%
years%of%high%school.%%
Newton%High%Schools%
have%chosen%to%
administer%the%
Introductory%Physics%
MCAS%in%Grade%9;%the%
year%students%take%the%
course.%%%
Some%students%take%other%tests%in%other%grades%for%a%variety%of%reasons.%%In%2015,%eleven%
students%took%the%Biology%MCAS,%23%took%Chemistry,%and%3%took%Technology/%Engineering.%
Student%performance%on%the%Grade%9%Introductory%Physics%test%continues%to%improve,%with%
the%percentage%of%students%scoring%proficient%and%advanced%increasing%from%83%%in%2010%to%
93%%in%2015.%%%
Differences%in%Achievement%Among%Subgroups%
Performance%levels%for%the%988%Newton%ninth%graders%and%14%Newton%tenth%graders%taking%
the%2015%Introductory%Physics%MCAS%are%distributed%as%follows:%
%% All%NPS%
Students%
African%American%
Students%
Low%Income%
Students%
High%Needs%
Students%State%
Advanced% 60%% 28%% 34%% 33%% 30%%
Proficient% 33%% 48%% 51%% 51%% 41%%
Needs%Improvement% 5%% 18%% 14%% 12%% 21%%
Failing% 2%% 8%% 1%% 5%% 8%%
%
The%percent%of%students%scoring%proficient%and%advanced%in%each%subgroup%has%grown%
substantially%since%2010,%with%a%steadily%increasing%percentage%scoring%Advanced.%%%
% %
41%54% 49% 55% 52% 60%
42%33% 40% 34% 39%
33%
14% 10% 9% 10% 7% 5%3% 4% 2% 2% 2% 2%
2010%%%%%%%
n=877%
2011%%%%%%%
n=899%
2012%%%%%%%%
n=886%
2013%%%%%%%%%%
n=945%
2014%%%%%%
n=959%
2015%%%%%%
n=982%
Introductory%Physics%Grade%9%
All%Students%
Advanced% Proiicient% Needs%Improvement% Failing%

% 16%Newton%Public%Schools% PARCC%MCAS%2014%Report%
Office%of%Teaching%and%Learning% January%2016%
(
10% 10% 10% 15% 11%28%
46%
45% 42%51% 63%
48%334%
28% 38%28% 20% 18%
10%17% 10% 6% 7% 5%
2010%%%%%%%
n=50%
2011%%%%%%%
n=58%
2012%%%%%%%%
n=46%
2013%%%%%%%%%%
n=53%
2014%%%%%%
n=46%
2015%%%%%%
n=40%
Introductory%Physics%Grade%9%
African%American/Black%Students%
Advanced% Proiicient% Needs%Improvement% Failing%
10%21% 24% 25% 20%
34%
42%44% 41% 43% 52%
51%35%
21% 28% 22% 22%14%14% 14% 6% 10% 6% 1%
2010%%%%%%%
n=103%
2011%%%%%%%
n=114%
2012%%%%%%%%%%%%%
n=99%
2013%%%%%%%%%%
n=108%
2014%%%%%%
n=136%
2015%%%%%%
n=96%
Introductory%Physics%Grade%9%
Low%Income%Students%
Advanced% Proiicient% Needs%Improvement% Failing%
24% 22% 24% 25% 33%
42% 48% 47% 51%51%
23% 22% 23% 18% 12%11% 7% 6% 6% 5%
2011%%%%%%%
n=287%
2012%%%%%%%%
n=277%
2013%%%%%%%%%%
n=306%
2014%%%%%%
n=303%
2015%%%%%%
n=307%
Introductory%Physics%Grade%9%
High%Needs%Students%
Advanced% Proiicient% Needs%Improvement% Failing%

% 17%Newton%Public%Schools% PARCC%MCAS%2014%Report%
Office%of%Teaching%and%Learning% January%2016%
Student%Achievement%Compared%to%Massachusetts%Averages%%%(Newton%Public%Schools%students%continue%to%outperform%their%statewide%peers%in%every%test%
at%every%level%as%the%charts%below%indicate.%%%
(
((
0%
20%
40%
60%
80%
100%
Grade%3% Grade%4% Grade%5% Grade%6% Grade%7% Grade%8% Grades%3%B%
8%
English%Language%Arts%PARCC%2015%
Percent%of%Students%Scoring%Level%4%and%5%
(Meets%or%Exceeds%Expectations)%
Newton%
State%
0%
20%
40%
60%
80%
100%
Grade%3% Grade%4% Grade%5% Grade%6% Grade%7% Grade%8% Grades%3%B%
8%
Mathematics%PARCC%2015!Percent%of%Students%Scoring%Levels%4%and%5%
(Meets%or%Exceeds%Expectations)%
Newton%
State%

% 18%Newton%Public%Schools% PARCC%MCAS%2014%Report%
Office%of%Teaching%and%Learning% January%2016%
((((( (
0%
20%
40%
60%
80%
100%
Grade%5% Grade%8% Grade%9%Physics% Grade%10%
Science%and%Technology/Engineering%MCAS%2015!Percent%of%Students%Scoring%Proiicient%or%Higher!
NEWTON%
STATE%
0%
20%
40%
60%
80%
100%
English%Language%Arts% Mathematics%
MCAS%Grade%10%2015%
Percent%of%Students%Scoring%Proiicient%or%Advanced%
NEWTON%
STATE%

% 19%Newton%Public%Schools% PARCC%MCAS%2014%Report%
Office%of%Teaching%and%Learning% January%2016%
Appendix:(From(the(Massachusetts(Department(of(Elementary(and(Secondary(Education:((MCAS%and%PARCC:%SUSTAINING%A%RELIABLE%GROWTH%MEASURE%6%
Over%the%past%three%years,%testing%and%measurement%experts%in%states%[using%PARCC]%that%use%Student%Growth%Percentiles%(SGP)%as%a%measure%of%student%growth%have%been%analyzing%issues%related%to%sustaining%the%reliability%of%SGPs%as%we%transition%from%our%legacy%assessment%(e.g.,%MCAS)%to%PARCC.%%The%conclusion%is%that%given%representative%samples%of%student%data,%SGPs%will%be%reliable%whether%a%student%who%has%taken%MCAS%for%the%prior%year%or%two%takes%MCAS%or%PARCC%in%2015.%%Following%is%a%graphic%that%highlights%how%the%percentile%underpinnings%of%the%SGP%support%this%conclusion.%%Understanding%that%perception%is%just%as%important%as%the%mathematical%evidence,%ESE%will%convene%a%forum%for%interested%parties%to%review%and%better%understand%these%analyses.%%
%
% %
%%%%%%%%%%%%%%%%%%%%%%%%%%%%%%%%%%%%%%%%%%%%%%%%%%%%%%%%6%Retrieved%from%http://www.doe.mass.edu/parcc/%%January%5,%2016%
0%
10%
20%
30%
40%
50%
60%
70%
80%
90%
100%
MCAS%Grade%3% PARCC%Grade%4%%
2015%PARCC%Growth%Percentiles%%
Level%1% Level%2% Level%3%% Level%4%% Level%5%
Representative%
sample%2014%MCAS%
100s%of%
stds@%
252%
99!
50%
1%

% 20%Newton%Public%Schools% PARCC%MCAS%2014%Report%
Office%of%Teaching%and%Learning% January%2016%
Appendix:((From(the(Massachusetts(Department(of(Elementary(and(Secondary(Education:(MCAS%and%PARCC:%HOW%WE%WILL%COMPARE%RESULTS7%
!The%procedure%used%to%compare%the%results%(student%scores)%from%two%different%tests%is%called%“equipercentile%linking.”%%Below%you%will%find%a%schematic%that%provides%an%overview%of%how%the%process%works:%%the%left%column%shows%actual%MCAS%achievement%data%sorted%by%percentiles%while%the%right%column%shows%a%“simulation”%of%what%PARCC%achievement%data%might%be%(no%actual%data%yet%exists),%once%again%sorted%by%percentiles.%%The%arrows%show%how%we%will%identify%which%scores%on%PARCC%are%equivalent%to%levels%(and%scores)%in%MCAS.%%You%are%likely%already%familiar%with%such%comparisons%since%this%process%is%used%to%compare,%e.g.,%SAT%and%ACT%scores,%and%ACCESS%and%MEPA%scores.%%%%
%
%%%%%%%%%%%%%%%%%%%%%%%%%%%%%%%%%%%%%%%%%%%%%%%%%%%%%%%%7%Retrieved%from%http://www.doe.mass.edu/parcc/%%January%5,%2016%