News U Can Use - Mutual fund · Indian economy slowed to 2.8% on a yearly basis in May 2016 ......
20
News U Can Use July 01, 2016
Transcript of News U Can Use - Mutual fund · Indian economy slowed to 2.8% on a yearly basis in May 2016 ......

News U Can UseJuly 01, 2016

Slide
The Week that was…
27th June to 01st July
2
Slide
Indian Economy
3
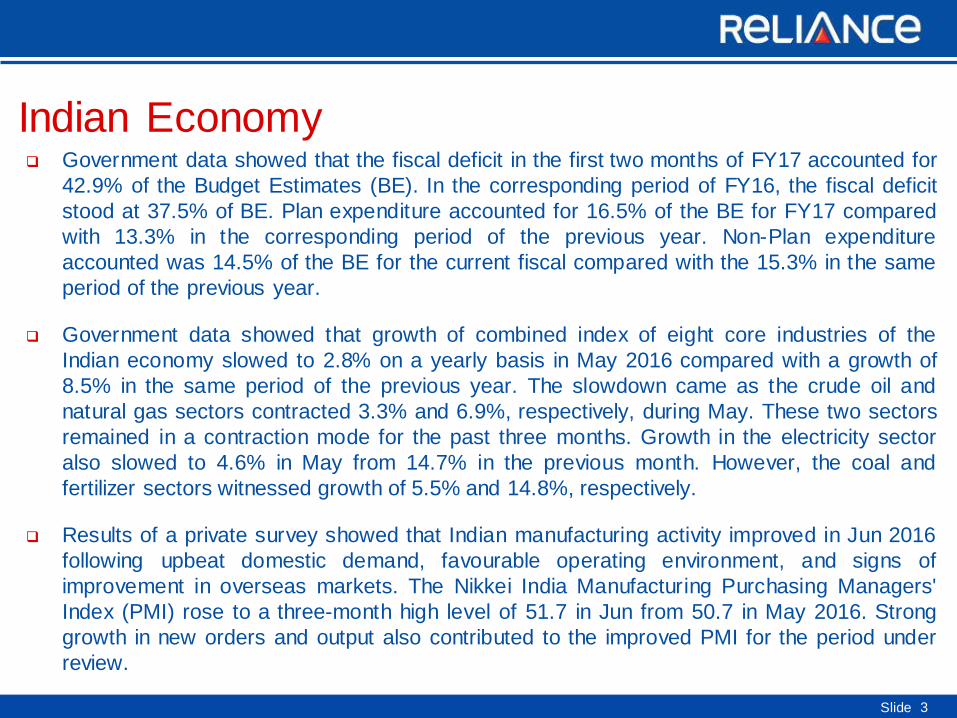
Government data showed that the fiscal deficit in the first two months of FY17 accounted for
42.9% of the Budget Estimates (BE). In the corresponding period of FY16, the fiscal deficit
stood at 37.5% of BE. Plan expenditure accounted for 16.5% of the BE for FY17 compared
with 13.3% in the corresponding period of the previous year. Non-Plan expenditure
accounted was 14.5% of the BE for the current fiscal compared with the 15.3% in the same
period of the previous year.
Government data showed that growth of combined index of eight core industries of the
Indian economy slowed to 2.8% on a yearly basis in May 2016 compared with a growth of
8.5% in the same period of the previous year. The slowdown came as the crude oil and
natural gas sectors contracted 3.3% and 6.9%, respectively, during May. These two sectors
remained in a contraction mode for the past three months. Growth in the electricity sector
also slowed to 4.6% in May from 14.7% in the previous month. However, the coal and
fertilizer sectors witnessed growth of 5.5% and 14.8%, respectively.
Results of a private survey showed that Indian manufacturing activity improved in Jun 2016
following upbeat domestic demand, favourable operating environment, and signs of
improvement in overseas markets. The Nikkei India Manufacturing Purchasing Managers'
Index (PMI) rose to a three-month high level of 51.7 in Jun from 50.7 in May 2016. Strong
growth in new orders and output also contributed to the improved PMI for the period under
review.

Slide 4
Indian Equity MarketDomestic Equity Market Indices
Indices 01-Jul-16 1 Week Return YTD Return
S&P BSE Sensex 27144.91 2.83% 3.76%
Nifty 50 8328.35 2.96% 4.59%
S&P BSE Mid-Cap 11857.56 4.81% 5.44%
S&P BSE Small-Cap 11885.43 5.38% -0.46%Source: MFI Explorer
RatiosS&P BSE
Sensex CNX Nifty
S&P BSE
Mid Cap
S&P BSE
Small Cap
P/E 19.78 22.86 25.18 42.36
P/B 2.87 3.38 2.5 2
Dividend Yield 1.44 1.25 1.2 0.91
Source: BSE, NSE Value as on July 01, 2016
NSE Advance/Decline Ratio
Date Advances Declines Advance/Decline Ratio
27-Jun-16 1221 339 3.60
28-Jun-16 1043 530 1.97
29-Jun-16 1177 396 2.97
30-Jun-16 1040 528 1.97
01-Jul-16 890 703 1.27Source: NSE
Indian equity market went up during
the week as investors digested the
“Brexit” concerns after the cabinet
approved the recommendation of
7th Pay Commission. The regulatory
announcement is expected to boost
consumer spending as there will be
more disposable income in the
hands of central government
employees.
Hopes of more foreign fund inflow
buoyed market sentiment after
income tax department notified that
Foreign Tax Credit rules will be
effective from Apr 1, 2017.
Favourable monsoon forecast for
this year and impressive
manufacturing activities in Jun 2016
triggered positivity in the market.

Slide 5
Indian Equity Market (contd.)Sectoral Indices
IndicesLast Returns (in %)
Closing 1-Wk 1-Mth
S&P BSE Auto 19782.3 3.16% 2.78%
S&P BSE Bankex 20618.6 3.55% 3.76%
S&P BSE CD 12016.6 4.10% 2.50%
S&P BSE CG 15186.5 6.22% 5.63%
S&P BSE FMCG 8608.95 5.71% 5.33%
S&P BSE HC 15653.9 4.88% 2.78%
S&P BSE IT 11158.3 -1.31% -4.41%
S&P BSE Metal 8571.39 4.66% 8.41%
S&P BSE Oil & Gas 9989.54 6.48% 7.20%
Source: Reuters Values as on July 01, 2016
On the BSE sectoral front, barring S&P
BSE IT and S&P BSE Teck, all the indices
closed in the green. S&P BSE Realty was
the top gainer, up 8.36%, followed by S&P
BSE Oil & gas and S&P BSE Capital
Goods, which went up 6.48% and 6.22%,
respectively.
Buying interest was seen in metal and
mining sector following the Union cabinet’s
approval of the National Mineral
Exploration Policy for accelerating the
upstream activity in the country through
enhanced participation from the private
sector.Indian Derivatives Market Review
Nifty Jun 2016 settled at spot rate of 8,287.75. Nifty Jul 2016 Futures were at 8,355.15
points, a premium of 26.80 points, over the spot closing of 8,328.35 points. The turnover
on NSE’s Futures and Options segment stood at Rs. 22.09 lakh crore during the week to
Jul 1, compared with Rs. 17.44 lakh crore recorded in the previous week.
The Put-Call ratio stood at 0.94, compared with the previous session’s close of 0.91.
The Nifty Put-Call ratio stood at 0.99, compared with the previous session’s close of 1.07.

Slide 6
Domestic Debt Market
Debt Indicators
(Yield %)
Current
Value
1-Wk
Ago
1-Mth
Ago
6-Mth
Ago
Call Rate 6.25 6.38 6.32 6.73
91 Day T-Bill 6.54 6.75 6.82 7.14
08.27% 2020, (5 Yr GOI) 7.24 7.31 7.37 7.64
07.59% 2026, (10 Yr GOI) 7.42 7.47 7.49 7.73
Source: Reuters Values as on July 01, 2016
Bond yields fell compared with
previous week on hopes that central
banks across the globe will ease their
monetary policies following the
Britain’s exit from the European
Union. Expectations of above normal
monsoons and lower crude oil prices
further boosted market sentiments.
However, an unexpected
announcement by Haryana to issue
bonds under the Ujjwal Discom
Assurance Yojna (UDAY) scheme
and profit bookings from the recent
rally in the domestic debt market
capped some gains during the week.
Yield on 10-year benchmark bond
(7.59% GS 2026) fell 5 bps to close
at 7.42% compared with the previous
week’s close of 7.47%. The yields
moved in the range of 7.41% to
7.48% during the week.
7.40
7.44
7.48
27-Jun 28-Jun 29-Jun 30-Jun 1-Jul
Yie
ld i
n %
10 -Yr Benchmark Bond ( % )
Source: CCIL

Slide 7
Domestic Debt Market (Spread Analysis)
MaturityG-Sec Yield
(%)
Corporate Yield
(%)
Spread
bps
1 Year 7.10 7.69 59
3 Year 7.27 7.90 63
5 Year 7.52 8.07 56
10 Year 7.64 8.17 54
Source: Reuters Values as on July 01, 2016
Yields on gilt securities fell across the
maturities in the range of 2 bps to 13
bps.
Corporate bond yields fell across the
maturities in the range of 4 bps to 11
bps.
Difference in spread between AAA
corporate bond and gilt securities
contracted across the maturities in the
range of 1 bps to 6 bps, barring 5- and
15-year maturities which expanded 4
bps each. Spread on 7-year paper
remained unchanged.
-22
-11
0
6.50
7.20
7.90
3 Mths 6 Mths 1 Yr 5 Yrs 10 Yrs 20 Yrs 30 Yrs
India Yield Curve Shift (%) (W-o-W)
Change in bps 01-Jul-16 24-Jun-16
Yie
ldin
%C
hange
in b
ps
Source: Reuters

Slide 8
Regulatory Updates in India
The cabinet committee approved the recommendations of the 7th Pay Commission.
Eventually, the overall hike in salary and allowance of central government employees and
pensioners will be 23.5%. This recommendation will have a positive impact on the demand
for consumer durables and services with modest risk on inflation.
The Reserve Bank of India (RBI), in its Financial Stability Report for Jun 2016, opined that
the Indian economy stands apart in comparison to other economies due to a stable financial
system. The central bank further underlined the importance of structural reforms and
continuation of sound domestic policies.
The cabinet approved the National Mineral Exploration Policy (NMEP), which will allow the
government to auction 100 prospective mineral blocks that have been identified by the
Geological Survey of India for exploration and boosting the country's mining potential. The
policy proposed that the private entities involved in carrying regional and detailed
exploration, will get a certain share of revenue (by way of royalty or premium accruing to the
state government) in mining operation from the successful bidder after the e-auction of the
mineral block.

Slide 9
Regulatory Updates in India (contd..) Capital market regulator Securities and Exchange Board of India (SEBI) issued new norms
for foreign portfolio investors. Per the new rule, FPIs who had issued participatory notes
under the earlier regulations will be allowed to hold the position till the date of expiry of such
positions or till end of Dec 2020. However, SEBI added that participatory notes subscribers
can’t take fresh positions or renew the old positions.
The cabinet has approved the model Shops and Establishment Act, which will allow cinema
halls, restaurants, shops, banks, and other such workplaces to remain open throughout day
and night. The act will allow women to work during the night in such places with mandatory
cab services and other workplace facilities.

Slide 10
Global News/Economy Data from the U.S. Commerce Department showed that economic activity in the U.S.
increased faster than previously estimated in the first quarter of 2016. Growth in Gross
Domestic Product (GDP) was upwardly revised to 1.1% for the first quarter of 2016, from the
initial estimate of 0.8%. However, the quarter’s growth was slower than 1.4% growth
witnessed in the fourth quarter of the last fiscal, but was higher than market expectations of
1.0%.
According to Eurostat, eurozone’s consumer prices increased after five months by 0.1% YoY
in Jun 2016 after falling 0.1% in May 2016.
According to Office for National Statistics, U.K. Gross Domestic Product grew 0.4% QoQ in
the first quarter of 2016. It was slower than the 0.7% expansion seen in the fourth quarter of
2015. On a yearly basis, GDP climbed 2%.
According to the Ministry of Internal Affairs and Communications, consumer prices in Japan
fell less than expected by 0.4% YoY in May 2016 after 0.3% decline in Apr 2016.
According to National Bureau of Statistics, China’s manufacturing sector remained almost
stagnant in Jun 2016. Manufacturing Purchasing Managers’ Index stood at 50.0, slightly
lower than May 2016’s score of 50.1 and was as per expectations. Also, the Caixin
manufacturing PMI for China fell to 48.6 in Jun from 49.2 in May.

Slide 11
Global Equity MarketsGlobal Indices
Indices 01-Jul-161-Week
Return
YTD
Return
Dow Jones 17949.37 3.15% 4.67%
Nasdaq 100 4437.445 3.54% -1.34%
FTSE 100 6577.83 7.15% 7.95%
DAX Index 9776.12 2.29% -4.93%
Nikkei Average 15682.48 4.89% -15.00%
Straits Times 2846.37 4.06% 0.37%
Source: Reuters
U.S.
Market gained as Britain did not
invoke Article 50 of the Lisbon Treaty,
which would initiate the formal
process of quitting the European
Union, eased concerns on the U.K.’s
exit and the market began to gain
momentum. Further support came
from rise in crude oil prices and faster
than anticipated growth in the U.S.
economic activity for the first quarter
of 2016.Europe
Despite the “Brexit” shock, markets gained during the week after several central banks
around the world assured to take prudent measures to maintain stability in the global
financial market. Improved crude oil prices and investors’ preference to buy beaten-down
stocks at cheaper valuation also helped to mitigate the effect. Brexit concerns eased as
Britain has not yet formally initiated the exit procedure.
Asia
Asian bourses traded on a positive note following the global peers. Rise in crude oil prices
and hopes of more stimulus measures to offset the “Brexit” impact helped the bourses.
Weak Chinese and Japanese economic data also spurred expectations for further
monetary stimulus measures from the respective central banks.

Slide 12
Global Debt (U.S.) The 10-year U.S. Treasury yield fell
12 bps to close at 1.46%, compared
with the previous week’s close of
1.58%.
The U.S treasury prices surged
initially as its safe haven appeal
boosted on persisting concerns over
global economic health following
Britain’s exit from the European
Union (EU).
However, gains were capped as U.S.
Treasury prices fell after a major
credit rating agency lowered its long-
term credit rating on EU to 'AA' from
'AA+' and the ISM manufacturing
Purchasing Managers’ Index for Jun
2016 came better than expected in
the U.S.
1.44
1.46
1.48
1.50
27-Jun 28-Jun 29-Jun 30-Jun 1-Jul
US 10-Year Treasury Yield Movement
Source: Reuters
Slide 13
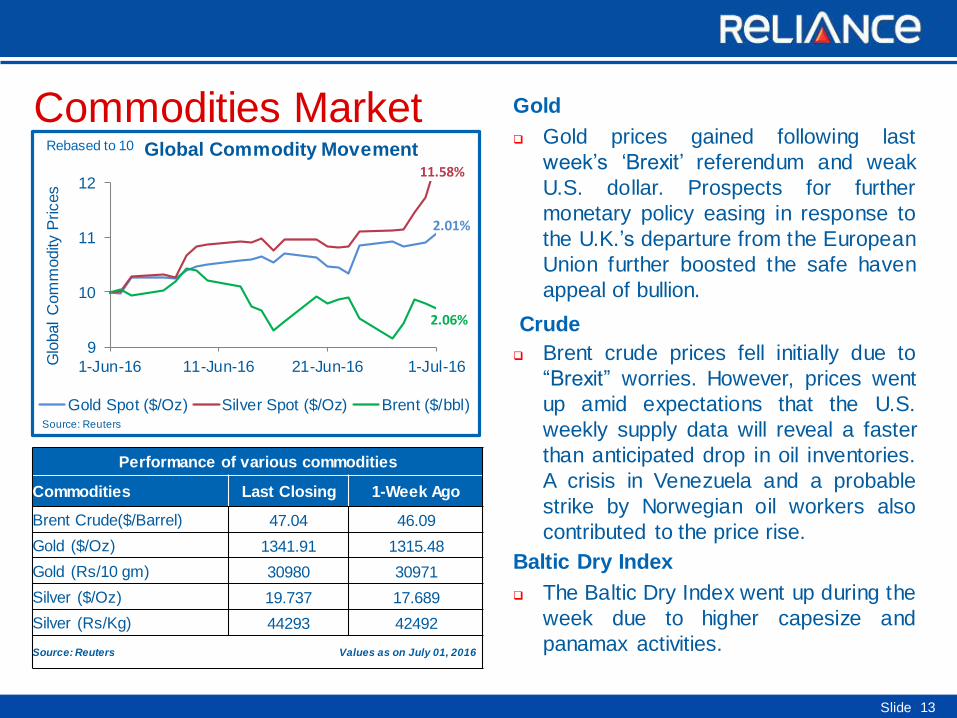
Commodities Market
Performance of various commodities
Commodities Last Closing 1-Week Ago
Brent Crude($/Barrel) 47.04 46.09
Gold ($/Oz) 1341.91 1315.48
Gold (Rs/10 gm) 30980 30971
Silver ($/Oz) 19.737 17.689
Silver (Rs/Kg) 44293 42492
Source: Reuters Values as on July 01, 2016
Gold
Gold prices gained following last
week’s ‘Brexit’ referendum and weak
U.S. dollar. Prospects for further
monetary policy easing in response to
the U.K.’s departure from the European
Union further boosted the safe haven
appeal of bullion.
Crude
Brent crude prices fell initially due to
“Brexit” worries. However, prices went
up amid expectations that the U.S.
weekly supply data will reveal a faster
than anticipated drop in oil inventories.
A crisis in Venezuela and a probable
strike by Norwegian oil workers also
contributed to the price rise.
Baltic Dry Index
The Baltic Dry Index went up during the
week due to higher capesize and
panamax activities.
9
10
11
12
1-Jun-16 11-Jun-16 21-Jun-16 1-Jul-16
Global Commodity Movement
Gold Spot ($/Oz) Silver Spot ($/Oz) Brent ($/bbl)
Glo
bal
Com
modity
Prices
Rebased to 10
Source: Reuters
2.06%
2.01%
11.58%

Slide 14
Currencies Markets
Movement of Rupee vs Other Currencies
Currency Last Closing 1-Wk Ago
US Dollar 67.44 68.01
Pound Sterling 89.55 92.96
EURO 74.74 75.10
JPY(per 100 Yen) 65.67 66.45
Source: RBI Figures in INR , Values as on July 01, 2016
Rupee
The rupee witnessed its biggest weekly
gain against the U.S. dollar since Mar
2016 following gains in the domestic equity
market.
Euro
The euro gained slightly over the weekend
against the greenback after dollar fell on
profit-taking and rebound in risk appetite
stemming from reduced concerns
surrounding Britain's exit from the EU.
Pound
The pound weakened against the
greenback as markets were still recovering
from the “Brexit” shock. However, it found
support after Bank of England governor
hinted at a summer rate-cut to stimulate
Britain’s economy.
Yen
The yen fell against the greenback on
improved risk appetite.
9.00
9.70
10.40
11.10
1-Jun-16 11-Jun-16 21-Jun-16 1-Jul-16
USD GBP Euro JPYSource: RBI
Cu
rren
cy P
rice
s (i
n te
rms
of I
NR
)
Rebased to 10 Currency Movement
-1.17%
-0.47%
-0.84%
-3.67%

Slide
The Week that was…
27th June to 01st July
15

Slide 16
The Week that was (June 27 – July 01)
Date EventsPresent Value
Previous Value
Monday, June 27, 2016 China Industrial Profits (YoY) (May) 3.70% 4.20%
Tuesday, June 28, 2016U.S. Consumer Confidence Index (Jun) 98.0 92.4
U.S. Gross Domestic Product (Q1) 1.10% 0.80%
Wednesday, June 29, 2016
U.S. Pending Home Sales (YoY) (May) 2.40% 1.80%
German Consumer Price Index (YoY) 0.30% 0.10%
U.S. Personal Income (May) 0.20% 0.50%
Japan Retail Trade (YoY) (May) -1.90% -0.90%
U.K. Mortgage Approval (May) 67.04K 66.21K
Thursday, June 30, 2016
Eurozone Consumer Price Index (Jun) 0.10% -0.10%
German Retail Sales (YoY) (May) 2.60% 2.30%
Japan Industrial Production (YoY) (May) -0.10% -3.30%
U.K. Gross Domestic Product (YoY) (Q1) 2.00% 2.00%
Friday, July 01, 2016
Japan Consumer Price Index (YoY) (May) -0.40% -0.30%
China Manufacturing PMI (Jun) 50.0 50.1
U.S. ISM Manufacturing (Jun) 53.2 51.3
Japan Jobless Rate (May) 1.36 1.34

Slide 17
The Week Ahead…
July 04 to July 08

Slide 18
The Week AheadDay Event
Monday, July 04
UK Construction PMI (June)
Euro-Zone Producer Price Index (YoY) (May)
Tuesday, July 05
China Caixin PMI Composite (June)
Japan Nikkei PMI Composite (June)
U.S. Markit/CIPS UK Composite PMI (June)
Euro-Zone Retail Sales (YoY) (May)
U.S. Factory Orders (May)
Eurozone Markit PMI Composite (June)
Wednesday, July 06 U.S. ISM Non-Manufacturing Composite (June)
Thursday, July 07
U.K. Industrial Production (YoY) (May)
U.K. NIESR Gross Domestic Product Estimate (June)
Friday, July 08
U.S. Unemployment Rate (Jun)
U.S. Change in Non-farm Payrolls (Jun)
Japan Trade Balance - BOP Basis (Yen) (May)

Slide 19
DisclaimerThe information herein is meant only for general reading purposes and contains all factual and statistical information pertaining to Industry and marketswhich have been obtained from independent third party sources and which are deemed to be reliable. The information provided cannot be consideredas guidelines, recommendations or as a professional guide for the readers. It may be noted that since Reliance Nippon Life Asset ManagementCompany Limited (RNLAM) (formerly Reliance Capital Asset Management Limited) has not independently verified the accuracy or authenticity of suchinformation or data, or for that matter the reasonableness of the assumptions upon which such data and information has been processed or arrive data;RNLAM does not in any manner assures the accuracy or authenticity of such data and information. Some of the statements & assertions contained inthese materials may reflect RNLAM’s views or opinions, which in turn may have been formed on the basis of such data or information. The Sponsor(s),the Investment Manager, the Trustee or any of their respective directors, employees, affiliates or representatives do not assume any responsibility for,or warrant the accuracy, completeness, adequacy and reliability of such data or information. Whilst no action has been solicited based upon theinformation provided herein, due care has been taken to ensure that the facts are accurate and opinions given are fair and reasonable, to the extentpossible. This information is not intended to be an offer or solicitation for the purchase or sale of any financial product or instrument. Recipients of thisinformation should rely on information/data arising out of their own investigations. Before making any investments, the readers are advised to seekindependent professional advice, verify the contents in order to arrive at an informed investment decision. None of the Sponsor(s), the InvestmentManager, the Trustee, their respective directors, employees, affiliates or representatives shall be liable in any way for any direct, indirect, special,incidental, consequential, punitive or exemplary damages, including on account of lost profits arising from the information contained in this material.
All information contained in this document has been obtained by ICRA Online Limited from sources believed by it to be accurate and reliable. Althoughreasonable care has been taken to ensure that the information herein is true, such information is provided ‘as is’ without any warranty of any kind, andICRA Online Limited or its affiliates or group companies and its respective directors, officers, or employees in particular, makes no representation orwarranty, express or implied, as to the accuracy, suitability, reliability, timelines or completeness of any such information. All information containedherein must be construed solely as statements of opinion, and ICRA Online Limited, or its affiliates or group companies and its respective directors,officers, or employees shall not be liable for any losses or injury, liability or damage of any kind incurred from and arising out of any use of thisdocument or its contents in any manner, whatsoever. Opinions expressed in this document are not the opinions of our holdingcompany, ICRA Limited(ICRA), and should not be construed as any indication of credit rating or grading of ICRA for any instruments that have been issued or are to be issuedby any entity.

Thank you