News from Xerox - Persberichten.com · News from Xerox For Immediate Release Xerox Corporation 45...
30
News from Xerox For Immediate Release Xerox Corporation 45 Glover Avenue P.O. Box 4505 Norwalk, CT 06856-4505 tel +1-203-968-3000 Xerox Reports Second-Quarter 2010 Earnings; Increases Full-Year Guidance • GAAP EPS of 16 cents; adjusted EPS of 24 cents • Total revenue up 48 percent as reported, up 2 percent pro forma • Operating margin of 10.1 percent, up nearly one point pro forma • $1.1 billion first-half 2010 operating cash flow; expect to deliver $2.6 billion full year NORWALK, Conn., July 22, 2010 – Xerox Corporation (NYSE: XRX) announced today second-quarter 2010 results that include adjusted earnings per share of 24 cents and $678 million in operating cash flow. Adjusted EPS excludes 8 cents from restructuring charges and amortization of intangibles as well as acquisition-related and litigation costs, resulting in GAAP EPS of 16 cents. “Our second-quarter results reflect strong across-the-board performance in driving revenue growth, generating cash and expanding earnings,” said Ursula Burns , Xerox chairman and chief executive officer. “Through the first half of the year, we’ve made excellent progress in scaling our services business and strengthening our leadership in the marketplace. We expect this progress will continue, positioning us well to increase our earnings expectations for the full year.” Second-quarter revenue of $5.5 billion was up 48 percent including a 1 point negative impact from currency. On a pro-forma basis, with ACS in the company’s 2009 results, total revenue grew 2 percent or 3 percent in constant currency. Revenue from technology, which represents the sale of document systems as well as the supplies , technical service and financing of products, was up 3 percent or 4 percent in constant currency. Total install activity for Xerox equipment was up 45 percent, reflecting strong demand across all segments including a 56 percent increase in entry-level printers and multifunction devices. Revenue from services was up 1 percent on a pro-forma basis, and represents the company’s business process, IT and document outsourcing offerings. “We’re seeing consistent trends that indicate the benefit of our broad product line and expanded services as well as modest economic improvements,” added Burns. “Demand continues to improve for Xerox technology, especially in developing markets and from small and mid-sized businesses . With annuity revenue representing 83 percent of total revenue and signings for Xerox services up 12 percent, our business is strengthened by multi-year contracts for business process and document management .”
-
Upload
truongthien -
Category
Documents
-
view
225 -
download
0
Transcript of News from Xerox - Persberichten.com · News from Xerox For Immediate Release Xerox Corporation 45...

News from Xerox For Immediate Release Xerox Corporation
45 Glover Avenue P.O. Box 4505 Norwalk, CT 06856-4505 tel +1-203-968-3000
Xerox Reports Second-Quarter 2010 Earnings; Increases Full-Year Guidance • GAAP EPS of 16 cents; adjusted EPS of 24 cents • Total revenue up 48 percent as reported, up 2 percent pro forma • Operating margin of 10.1 percent, up nearly one point pro forma • $1.1 billion first-half 2010 operating cash flow; expect to deliver $2.6 billion
full year
NORWALK, Conn., July 22, 2010 – Xerox Corporation (NYSE: XRX) announced today second-quarter 2010 results that include adjusted earnings per share of 24 cents and $678 million in operating cash flow. Adjusted EPS excludes 8 cents from restructuring charges and amortization of intangibles as well as acquisition-related and litigation costs, resulting in GAAP EPS of 16 cents.
“Our second-quarter results reflect strong across-the-board performance in driving revenue growth, generating cash and expanding earnings,” said Ursula Burns, Xerox chairman and chief executive officer. “Through the first half of the year, we’ve made excellent progress in scaling our services business and strengthening our leadership in the marketplace. We expect this progress will continue, positioning us well to increase our earnings expectations for the full year.”
Second-quarter revenue of $5.5 billion was up 48 percent including a 1 point negative impact from currency. On a pro-forma basis, with ACS in the company’s 2009 results, total revenue grew 2 percent or 3 percent in constant currency. Revenue from technology, which represents the sale of document systems as well as the supplies, technical service and financing of products, was up 3 percent or 4 percent in constant currency. Total install activity for Xerox equipment was up 45 percent, reflecting strong demand across all segments including a 56 percent increase in entry-level printers and multifunction devices. Revenue from services was up 1 percent on a pro-forma basis, and represents the company’s business process, IT and document outsourcing offerings.
“We’re seeing consistent trends that indicate the benefit of our broad product line and expanded services as well as modest economic improvements,” added Burns. “Demand continues to improve for Xerox technology, especially in developing markets and from small and mid-sized businesses. With annuity revenue representing 83 percent of total revenue and signings for Xerox services up 12 percent, our business is strengthened by multi-year contracts for business process and document management.”
In February, Xerox closed on its acquisition of business process and IT outsourcing firm, Affiliated Computer Services (ACS). The resulting joint sales activities between Xerox and ACS as well as increased interest in the company’s diverse portfolio of outsourcing offerings led to a significant second-quarter increase in the pipeline for services contracts.
Second-quarter gross margin was 34.8 percent, and selling, administrative and general expenses were 21.1 percent of revenue. On a pro-forma basis, operating margin of 10.1 percent was up nearly one point, driven by improvements in both gross margin and SAG as a percent of revenue.
The $678 million in second-quarter operating cash flow contributed to $1.1 billion in cash flow for the first half of the year. The company reiterated its expectations to deliver $2.6 billion in operating cash for the full year.
For the third quarter, Xerox expects GAAP earnings in the range of 14 to 16 cents per share. Third-quarter adjusted EPS is expected to be 19 to 21 cents per share. Full-year GAAP earnings are expected to be 47 to 51 cents per share. Full-year adjusted EPS is expected to be 88 to 92 cents, an increase from the company’s previous guidance of 75 to 85 cents per share.
About Xerox Xerox Corporation is a $22 billion leading global enterprise for business process and document management. Through its broad portfolio of technology and services, Xerox provides the essential back-office support that clears the way for clients to focus on what they do best: their real business. Headquartered in Norwalk, Conn., Xerox provides leading-edge document technology, services, software and genuine Xerox supplies for graphic communication and office printing environments of any size. Through ACS, A Xerox Company, which Xerox acquired in February 2010, Xerox also offers extensive business process outsourcing and IT outsourcing services, including data processing, HR benefits management, finance support and customer relationship management services for commercial and government organizations worldwide. The 130,000 people of Xerox serve clients in more than 160 countries. For more information, visit http://www.xerox.com, http://news.xerox.com or http://www.acs-inc.com. For investor information, visit http://www.xerox.com/investor.
-XXX- Media Contact: Carl Langsenkamp, Xerox Corporation, +1-585-423-5782, [email protected]
Non GAAP Measures: This release refers to the following non-GAAP financial measures: • Adjusted EPS (earnings per share) for the second quarter and for third quarter
and full year 2010 guidance that excludes several discrete items. • Pro-forma current period revenue and operating margin, with ACS included in
the company’s 2009 result for the comparable 2010 period. • Constant Currency revenue growth that excludes the effects of currency
translation. Refer to the “Non-GAAP Financial Measures” section of this release for a discussion of these non-GAAP measures and their reconciliation to the reported GAAP measure.
Page 2

This release contains "forward-looking statements" as defined in the Private Securities Litigation Reform Act of 1995. The words “anticipate,” “believe,” “estimate,” “expect,” “intend,” “will,” “should” and similar expressions, as they relate to us, are intended to identify forward-looking statements. These statements reflect management’s current beliefs, assumptions and expectations and are subject to a number of factors that may cause actual results to differ materially. These factors include but are not limited to: the unprecedented volatility in the global economy; the risk that unexpected costs will be incurred; the outcome of litigation and regulatory proceedings to which we may be a party; actions of competitors; changes and developments affecting our industry; quarterly or cyclical variations in financial results; development of new products and services; interest rates and cost of borrowing; our ability to protect our intellectual property rights; our ability to maintain and improve cost efficiency of operations, including savings from restructuring actions; changes in foreign currency exchange rates; changes in economic conditions, political conditions, trade protection measures, licensing requirements and tax matters in the foreign countries in which we do business; reliance on third parties for manufacturing of products and provision of services; the risk that we will not realize all of the anticipated benefits from the acquisition of Affiliated Computer Services, Inc.; our ability to recover capital investments; the risk that subcontractors, software vendors and utility and network providers will not perform in a timely, quality manner; the risk that multi-year contracts with governmental entities could be terminated prior to the end of the contract term; the risk that individually identifiable information of customers, clients and employees could be inadvertently disclosed or disclosed as a result of a breach of our security; and other factors that are set forth in the “Risk Factors” section, the “Legal Proceedings” section, the “Management’s Discussion and Analysis of Financial Condition and Results of Operations” section and other sections of our Quarterly Report on Form 10-Q for the quarter ended March 31, 2010 and our 2009 Annual Report on Form 10-K filed with the Securities and Exchange Commission. The Company assumes no obligation to update any forward-looking statements as a result of new information or future events or developments, except as required by law.
For open commentary, industry perspectives and views from events visit http://twitter.com/xeroxcorp, http://twitter.com/xeroxevents, http://www.facebook.com/xeroxcorp, http://www.xerox.com/blogs or http://www.xerox.com/podcasts.
Xerox® and the sphere of connectivity design are trademarks of Xerox Corporation in the United States and/or other countries.
Page 3

Xerox Corporation
Condensed Consolidated Statements of Income (Unaudited)
(in millions, except per-share data) 2010 2009 % Change 2010 2009 % Change
RevenuesSales 1,791$ 1,602$ 12% 3,469$ 3,096$ 12% Service, outsourcing and rentals 3,553 1,951 82% 6,423 3,831 68% Finance income 164 178 (8%) 337 358 (6%)
Total Revenues 5,508 3,731 48% 10,229 7,285 40%
Costs and ExpensesCost of sales 1,172 1,065 10% 2,254 2,069 9% Cost of service, outsourcing and rentals 2,359 1,100 * 4,230 2,200 92% Equipment financing interest 61 68 (10%) 125 137 (9%)Research, development and engineering expenses 194 202 (4%) 399 406 (2%)Selling, administrative and general expenses 1,163 1,013 15% 2,262 2,017 12% Restructuring and asset impairment charges 11 (1) * 206 (3) *Acquisition-related costs 15 - * 63 - *Amortization of intangible assets 85 15 * 142 29 *Other expenses, net 128 72 78% 238 155 54%
Total Costs and Expenses 5,188 3,534 47% 9,919 7,010 41%
320 197 62% 310 275 13% Income tax expense 112 59 90% 134 78 72% Equity in net income (loss) of unconsolidated affiliates 28 9 * 26 (1) *
Net Income 236 147 61% 202 196 3%
Less: Net income attributable to noncontrolling interests 9 7 29% 17 14
Net Income Attributable to Xerox 227$ 140$ 62% 185$ 182$ 2%
Basic Earnings per Share 0.16$ 0.16$ - 0.14$ 0.21$ (33%)Diluted Earnings per Share 0.16$ 0.16$ - 0.14$ 0.21$ (33%)
Income before Income Taxes & Equity Income
21%
(1)
Six Months EndedJune 30,
* Percent change not meaningful.(1) Referred to as "Pre-Tax Income" throughout the remainder of this document.
Three Months EndedJune 30,
Page 4

Xerox Corporation Condensed Consolidated Balance Sheets (Unaudited)
June 30, December 31,(in millions, except share data in thousands) 2010 2009AssetsCash and cash equivalents 1,082$ 3,799$ Accounts receivable, net 2,974 1,702 Billed portion of finance receivables, net 210 226 Finance receivables, net 2,183 2,396 Inventories 1,026 900 Other current assets 1,023 708 Total current assets 8,498 9,731 Finance receivables due after one year, net 3,999 4,405 Equipment on operating leases, net 504 551 Land, buildings and equipment, net 1,622 1,309 Investments in affiliates, at equity 1,150 1,056 Intangible assets, net 3,495 598 Goodwill 8,446 3,422 Deferred tax assets, long-term 635 1,640 Other long-term assets 1,665 1,320 Total Assets 30,014$ 24,032$ Liabilities and Equity Short-term debt and current portion of long-term debt 358$ 988$ Accounts payable 1,670 1,451 Accrued compensation and benefits costs 830 695 Other current liabilities 1,834 1,327 Total current liabilities 4,692 4,461 Long-term debt 9,259 8,276 Liability to subsidiary trust issuing preferred securities 649 649 Pension and other benefit liabilities 2,023 1,884 Post-retirement medical benefits 970 999 Other long-term liabilities 737 572 Total Liabilities 18,330 16,841
Series A Convertible Preferred Stock 349 -
Common stock 1,384 871 Additional paid-in capital 6,475 2,493 Retained earnings 5,729 5,674 Accumulated other comprehensive loss (2,403) (1,988) Xerox Shareholders' Equity 11,185 7,050 Noncontrolling interests 150 141 Total Equity 11,335 7,191 Total Liabilities and Equity 30,014$ 24,032$
Shares of common stock issued and outstanding 1,383,047 869,381
Page 5

Xerox Corporation Condensed Consolidated Statements of Cash Flows (Unaudited)
Three Months Ended Six Months EndedJune 30, June 30,
(in millions) 2010 2009 2010 2009
Cash Flows from Operating Activities:Net income 236$ 147$ 202$ 196$ Adjustments required to reconcile net income to cash flows from operating activities:
Depreciation and amortization 279 168 520 337 Provision for receivables 43 78 93 146 Provision for inventory 8 13 17 29 Net loss (gain) on sales of businesses and assets 1 (7) (1) (9) Undistributed equity in net (income) loss of unconsolidated affiliates (12) (4) (9) 6 Stock-based compensation 30 14 57 31 Provision for litigation, net 36 - 36 - Payments for litigation, net (36) - (36) (28) Restructuring and asset impairment charges 11 (1) 206 (3) Payments for restructurings (55) (78) (94) (165) Contributions to pension benefit plans (30) (31) (63) (59) Decrease (increase) in accounts receivable and billed portion of finance receivables 62 138 (135) 305 Collections of deferred proceeds from sales of receivables 42 - 42 - (Increase) decrease in inventories (61) 187 (198) 82 Increase in equipment on operating leases (64) (64) (122) (127) Decrease in finance receivables 70 118 201 231 (Increase) decrease in other current and long-term assets (8) 27 13 44 Increase (decrease) in accounts payable and accrued compensation 18 (105) 187 (273) Decrease in other current and long-term liabilities (12) (35) (66) (138) Net change in income tax assets and liabilities 110 32 107 34 Net change in derivative assets and liabilities (22) (28) (4) (68) Other operating, net 32 40 100 60
Net cash provided by operating activities 678 609 1,053 631
Cash Flows from Investing Activities:Cost of additions to land, buildings and equipment (83) (11) (134) (48) Proceeds from sales of land, buildings and equipment 6 6 25 9 Cost of additions to internal use software (44) (28) (69) (56) Acquisitions, net of cash acquired (4) - (1,528) (145) Net change in escrow and other restricted investments (9) (3) 6 (3) Other investing 4 - 4 -
Net cash used in investing activities (130) (36) (1,696) (243)
Cash Flows from Financing Activities:Net proceeds (payments) on secured financings 1 (15) (3) (40) Net (payments) proceeds on other debt (396) 151 (2,035) (266) Common stock dividends (60) (38) (97) (75) Preferred stock dividends (3) - (3) - Proceeds from issuances of common stock 2 - 117 - Repurchases related to stock-based compensation (2) (11) (2) (11) Excess tax benefits from stock-based compensation 6 - 10 - Other financing (5) (5) (9) (8)
Net cash (used in) provided by financing activities (457) 82 (2,022) (400) Effect of exchange rate changes on cash and cash equivalents (19) 17 (52) 4
Increase (decrease) in cash and cash equivalents 72 672 (2,717) (8) Cash and cash equivalents at beginning of period 1,010 549 3,799 1,229 Cash and Cash Equivalents at End of Period 1,082$ 1,221$ 1,082$ 1,221$
Page 6
Financial Review Summary Revenues
(in millions) 2010 2009 % ChangePro-forma(3)
% Change 2010 2009
Revenue CategoryEquipment sales 930$ 828$ 12% 12% 17% 22%Supplies, paper and other 861 774 11% 7% 16% 21%
Sales 1,791 1,602 12% 9% 33% 43%Service, outsourcing and rentals 3,553 1,951 82% (1%) 64% 52%Finance income 164 178 (8%) (8%) 3% 5%Total Revenues 5,508$ 3,731$ 48% 2% 100% 100%
Segment Technology 2,555$ 2,476$ 3% 3% 46% 66%Services 2,529 850 198% 1% 46% 23%Other 424 405 5% 5% 8% 11%Total Revenues 5,508$ 3,731$ 48% 2% 100% 100%Memo:
Annuity Revenue(1) 4,578$ 2,903$ 58% - 83% 78%Color(2) 1,567$ 1,456$ 8% 8%
June 30, Percent of Total RevenueThree Months Ended
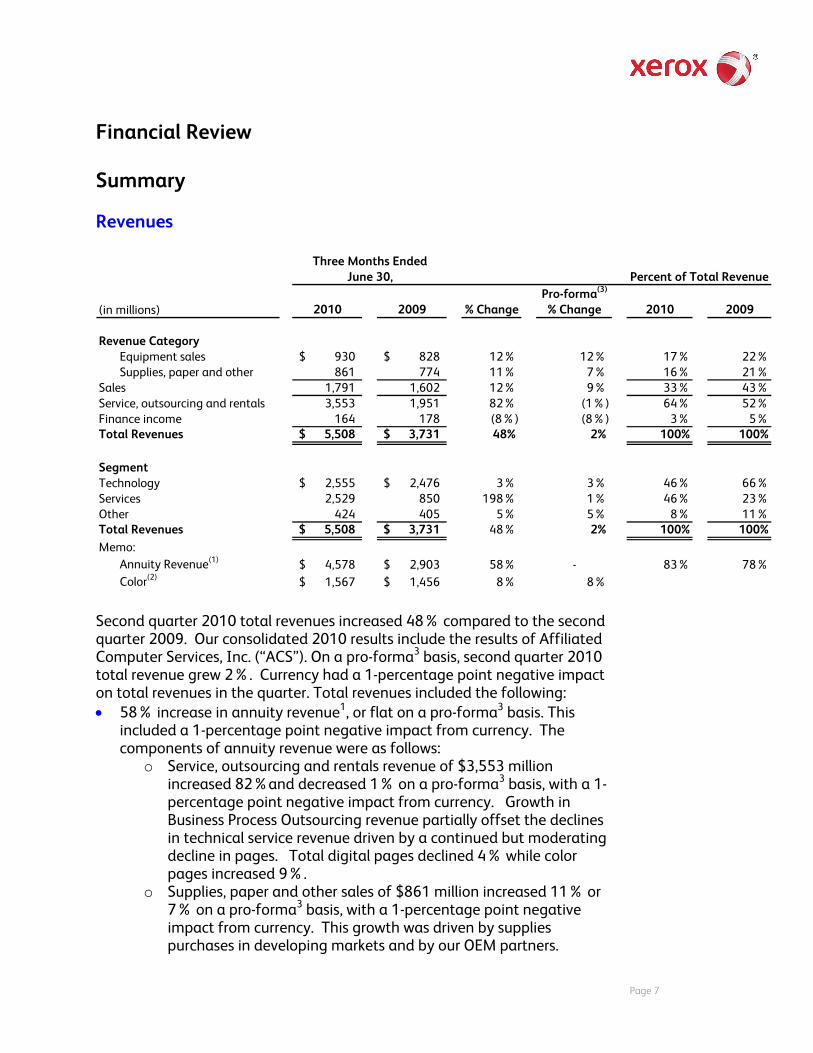
Second quarter 2010 total revenues increased 48% compared to the second quarter 2009. Our consolidated 2010 results include the results of Affiliated Computer Services, Inc. (“ACS”). On a pro-forma3 basis, second quarter 2010 total revenue grew 2%. Currency had a 1-percentage point negative impact on total revenues in the quarter. Total revenues included the following: • 58% increase in annuity revenue1, or flat on a pro-forma3 basis. This
included a 1-percentage point negative impact from currency. The components of annuity revenue were as follows:
o Service, outsourcing and rentals revenue of $3,553 million increased 82%and decreased 1% on a pro-forma3 basis, with a 1-percentage point negative impact from currency. Growth in Business Process Outsourcing revenue partially offset the declines in technical service revenue driven by a continued but moderating decline in pages. Total digital pages declined 4% while color pages increased 9%.
o Supplies, paper and other sales of $861 million increased 11% or 7% on a pro-forma3 basis, with a 1-percentage point negative impact from currency. This growth was driven by supplies purchases in developing markets and by our OEM partners.
Page 7

• 12% increase in equipment sales revenue, including a 2-percentage point negative impact from currency. Growth in install activity was partially offset by the impact of product mix and price declines of 5% to 10%.
• 8% increase in color revenue2, including a 1-percentage point negative impact from currency, reflects:
o 5% increase in color annuity revenue, including a 1-percentage point negative impact from currency. The increase was driven by higher color page volumes.
o 15% increase in color equipment sales revenue, including a 3-percentage point negative impact from currency. The increase was driven by higher installs from new products.
Net Income Second quarter 2010 net income attributable to Xerox was $227 million, or $0.16 per diluted share. On an adjusted basis, net income attributable to Xerox was $342 million, or $0.24 per diluted share. Second quarter 2009 net income attributable to Xerox was $140 million, or $0.16 per diluted share. On a comparable adjusted basis, net income attributable to Xerox was $158 million, or $0.18 per diluted share. The adjustments to net income include:
(in millions; except per share amounts) Net Income EPS Net Income EPSReported 227$ 0.16$ 140$ 0.16$
Adjustments:Xerox and Fuji Xerox restructuring charge 12 0.01 9 0.01 Acquisition-related costs 14 0.01 - - Amortization of intangible assets 53 0.04 9 0.01 ACS shareholders litigation settlement 36 0.02 - -
115 0.08 18 0.02
Adjusted 342$ 0.24$ 158$ 0.18$
Three Months EndedJune 30, 2010
Three Months EndedJune 30, 2009
The calculations of basic and diluted earnings per share are included as Appendix I. See Non-GAAP financial measures for calculation of adjusted EPS.
Page 8

Notes for Financial Review: (1)Annuity revenue is largely a function of the equipment placed at customer
locations, the volume of prints and copies that our customers make on that equipment, the mix of color pages, as well as revenue associated from outsourcing services. Annuity revenue = Service, outsourcing and rentals + Supplies, paper and other sales + Finance income.
(2)Color revenues represent a subset of total revenues and exclude Global Imaging Systems (“GIS”) revenues.
(3)Growth on a pro-forma basis reflects the inclusion of ACS’s adjusted results
from April 1st through June 30th in 2009. See the “Non-GAAP Financial Measures” section for an explanation of these non-GAAP financial measures.
Operations Review
(in millions)Total
RevenuesSegment
Profit (Loss)Segment Margin
2010Technology 2,555$ 273$ 10.7% Services 2,529 319 12.6% Other 424 (93) (21.9%)Total 5,508$ 499$ 9.1%
2009Technology 2,476$ 248$ 10.0% Services 850 61 7.2% Other 405 (80) (19.8%)Total 3,731$ 229$ 6.1%
2009 Pro-forma(1)
Technology 2,476$ 248$ 10.0% Services 2,510 282 11.2% Other 405 (111) (27.4%)Total 5,391$ 419$ 7.8%
Three Months Ended June 30,
Refer to Appendix II for the reconciliation of Segment Profit to Pre-tax Income.
Page 9

Technology Our Technology segment includes the sale of document systems and supplies, provision of technical service and financing of products. Revenue
(in millions) 2010 2009 Change
Equipment sales 816$ 738$ 11%Post sale revenue(2) 1,739 1,738 -Total Revenue 2,555$ 2,476$ 3%
Three Months EndedJune 30,
Second quarter 2010 Technology revenue of $2,555 million increased 3%, including a 1-percentage point negative impact from currency. Total revenues included the following: • 11% increase in equipment sales revenue with a 1-percentage point
negative impact from currency driven by growth across most regions, with particularly strong growth in developing markets.
• Post sale revenue was flat with a 1-percentage point negative impact from currency driven primarily by growth in supplies in developing markets and sales to our OEM partners.
• Technology revenue mix is 22% entry, 57% mid-range and 21% high-end.
Segment ProfitSecond quarter 2010 Technology profit of $273 million increased $25 million from second quarter 2009, predominantly reflecting gross profit flow-through from higher revenue. Installs Entry • 78% increase in installs of A4 black-and-white multifunction devices
driven by growth in developing markets. • 44% increase in installs of A4 color multifunction devices driven by
strong growth across all regions. • 16% increase in installs of color printers due to higher sales to OEM
partners. Mid-Range • 4% decrease in installs of mid-range black-and-white devices driven by
lower demand in large enterprises and indirect channels.
Page 10

• 26% increase in installs of mid-range color devices driven primarily by demand for new products, such as the ColorQubeTM, WorkCentre® 7120 / 7700 and the continued strong demand for the Xerox 700.
High-End • 7% decrease in installs of high-end black-and-white systems, reflecting
declines across most product segments. • 24% increase in installs of high-end color systems reflecting strong
demand for the recently launched Xerox Color 800 and 1000. Note: Install activity percentages include installations for Document Outsourcing and the Xerox-branded product shipments to GIS. Descriptions of “Entry”, “Mid-Range” and “High-End” can be found in Appendix II. Services Our Services segment comprises three service offerings: Business Process Outsourcing (“BPO”), Document Outsourcing (“DO”) and Information Technology Outsourcing (“ITO”). RevenueSecond quarter 2010 Services total revenue of $2,529 million increased 198% or 1% on a pro-forma1 basis. Currency did not impact total revenues in the quarter.
• BPO delivered pro-forma1 revenue growth of 3% and represented 53% of total Services revenue.
• Document outsourcing decreased 2% and included a 1-percentage point negative currency impact and represented 33% of total Services revenue.
• Information technology outsourcing decreased 1% on a pro-forma1 basis and represented 14% of total Services revenue.
Segment Profit Second quarter 2010 Services profit of $319 million increased $258 million, or $37 million on a pro-forma1 basis, from second quarter 2009 driven by BPO revenue growth and lower cost and expense driven by restructuring and synergy savings. Metrics Pipeline Our BPO and ITO sales pipeline, including synergy opportunities, grew approximately 29% over the second quarter 2009. This sales pipeline includes the Total Contract Value (“TCV”) of new business opportunities that potentially could be contracted within the next six months and excludes business opportunities with estimated annual recurring revenue in excess of $100 million. The DO sales pipeline grew
Page 11
approximately 7% over the second quarter 2009. The DO sales pipeline includes all active deals with $10 million or greater in TCV. Signings Signings (“Signings”) are defined as estimated future revenues from contracts signed during the period, including renewals. Services Signings were strong with an estimated $4.2 billion in TCV for the quarter. Combined with the previous three quarters; the trailing twelve month growth was 12% as compared to the comparable prior year period. • BPO Signings of $2.8 billion TCV • DO Signings of $0.9 billion TCV • ITO Signings of $0.5 billion TCV Signings growth was driven by strong Signings in both our BPO and DO businesses. We signed significant new business in the following areas: • Electronic payment cards • Telecom and hardware services • Enterprise Print Services in both US and Europe Note: TCV is estimated total revenue for future contracts for pipeline or signed contracts for Signings as applicable. Other Revenue Second quarter 2010 Other revenue of $424 million increased 5%, including a 1-percentage point negative impact from currency. This was driven by an increase in GIS’s network integration and electronic presentation systems and higher paper and supplies sales. Paper comprised approximately 60% of the second quarter 2010 and 2009 Other segment revenue. Segment Profit Second quarter 2010 Other loss of $93 million increased $13 million from second quarter 2009, driven primarily by higher interest expense that offsets gross profit flow-through from higher revenue.
Page 12

Costs, Expenses and Other Income Gross Margin
2010 2009
Sales 34.6% 33.5% 1.1 pts 1.4 ptsService, outsourcing and rentals 33.6% 43.6% (10.0) pts - ptsFinancing income 62.8% 61.8% 1.0 pts 1.0 ptsTotal Gross Margin 34.8% 40.2% (5.4) pts 0.4 pts
Pro-forma(1)
Change
Three Months EndedJune 30,
Change
Second quarter 2010 total gross margin of 34.8% decreased 5.4-percentage points and increased 0.4-percentage points on a pro-forma1 basis as compared to the second quarter 2009 and included a 0.3-percentage point benefit from a duties refund as a result of a favorable settlement of a European import classification claim. Sales gross margin increased 1.1-percentage points and increased 1.4-percentage points compared to the second quarter 2009 on a pro-forma1 basis and included the benefit from the duties refund. The positive impact of cost improvements and favorable mix more than offset the impact of price declines and unfavorable year-over-year transaction currency. Service, outsourcing and rentals margin decreased 10-percentage points and was flat compared to the second quarter 2009 on a pro-forma1 basis. On a pro-forma basis, positive mix offset the impact of unfavorable year-over-year transaction currency. Research, Development and Engineering Expenses (“RD&E”)
(in millions) 2010 2009
R&D 160$ 172$ Sustaining Engineering 34 30 Total RD&E Expenses 194$ 202$
RD&E % Revenue 3.5% 5.4% (1.9) pts (0.2) pts
(12)$ 4
(8)$
(12)$ 4
(8)$
Three Months EndedJune 30,
ChangePro-forma(1)
Change
Page 13

RD&E of $194 million in the second quarter 2010 was $8 million lower than the second quarter 2009 reflecting the benefits from restructuring and productivity improvements. We invest in technological research and development, particularly in color, software and services. We believe that our R&D spending is sufficient to remain technologically competitive. Xerox R&D is strategically coordinated with Fuji Xerox. Selling, Administrative and General Expenses (“SAG”)
2010 2009
SAG % Revenue 21.1% 27.2% (6.1) pts (0.3) pts
Three Months EndedJune 30,
Pro-forma(1)
ChangeChange
SAG expenses of $1,163 million in the second quarter 2010 were $150 million higher than the second quarter 2009 and $9 million higher on a pro-forma1 basis, including a $5 million favorable impact from currency. The pro-forma SAG expense increase reflects the following: • $58 million increase in selling expenses, reflecting increased demand
generation advertising and higher commissions partially offset by the benefits from restructuring and productivity improvements.
• $14 million decrease in general and administrative expenses, reflecting the benefits from restructuring and operational improvements.
• $35 million decrease in bad debt expenses to $46 million, reflecting an improving write-off trend. 2010 second quarter bad debt expense continues to remain less than one percent of receivables.
Restructuring and Asset Impairment Charges During the second quarter 2010, we recorded an additional $11 million of net restructuring and asset impairment charges, which included approximately $16 million of severance costs related to headcount reductions of approximately 300 employees primarily in North America. These costs were partially offset by $6 million of net reversals for changes in estimated reserves from prior period initiatives. The restructuring reserve balance as of June 30, 2010, for all programs was $197 million, of which approximately $179 million is expected to be spent over the next twelve months. Acquisition Related Costs Costs of $15 million were incurred during the second quarter 2010 in connection with our acquisition of ACS. These costs include $11 million of transaction costs, which represent external costs directly related to
Page 14

completing the acquisition of ACS and primarily reflected legal costs associated with the recently settled ACS shareholders litigation. The remainder of the acquisition related costs represents external incremental costs directly related to the integration of ACS and Xerox. These costs include expenditures for consulting, systems integration and corporate communication services. Amortization of Intangible Assets During the second quarter 2010, we recorded $85 million of expense related to the amortization of intangible assets, which is $70 million higher than second quarter 2009. The increase primarily reflects the amortization of intangibles associated with our acquisition of ACS. As a result of the ACS acquisition, amortization of acquired intangibles for 2010 is expected to be approximately $250 million higher than the prior year. Worldwide Employment Worldwide employment of 130,800 at June 30, 2010 increased approximately 77,200 from year-end 2009 primarily due to additional headcount acquired with the ACS acquisition. Other Expenses, Net
(in millions) 2010 2009
Non-financing interest expense 92$ 63$ Interest income (4) (6)Loss (gains) on sales of businesses and assets 1 (7) Currency (gains) losses, net (2) 1ACS shareholders litigation settlement 36 - Litigation matters 1 5 All other expenses, net 4 16
Total Other Expenses, Net 128$ 72$
Three Months EndedJune 30,
Non-Financing Interest Expense Second quarter 2010 non-financing interest expense of $92 million was $29 million higher than second quarter 2009 due to higher debt balances primarily as a result of our $2 billion Senior Note offering used to finance the acquisition of ACS. ACS Shareholders Litigation Settlement Second quarter 2010 ACS shareholders litigation settlement expense of $36 million reflects the previously disclosed settlement of claims by ACS
Page 15

shareholders arising out of Xerox’s acquisition of ACS and is net of insurance proceeds. All Other Expenses, Net Second quarter 2010 all other expenses, net decreased $12 million from second quarter 2009 driven in part by lower interest expense on Brazil tax and labor contingencies. Income Taxes
Three Months Ended Three Months Ended
(in millions)Pre-Tax Income
Income Tax
ExpenseEffective Tax Rate
Pre-Tax Income
Income Tax
ExpenseEffective Tax Rate
Reported 320$ 112$ 35.0% 197$ 59$ 29.9%
Adjustments:Xerox restructuring charge 11 4 - - Acquisition-related costs 15 1 - - Amortization of intangible assets 85 32 15 6 ACS shareholders litigation settlement 36 - - -
Adjusted 467$ 149$ 31.9% 212$ 65$ 30.7%
June 30, 2010 June 30, 2009
Second quarter 2010 effective tax rate was 35.0%. On an adjusted basis, second quarter 2010 tax rate was 31.9%3, which was lower than the U.S. statutory tax rate primarily due to a tax benefit associated with the utilization of foreign tax credits partially offset by a tax expense associated with tax law changes. Second quarter 2009 effective tax rate was 29.9%. On an adjusted basis, the second quarter 2009 tax rate was 30.7%3, which was lower than the U.S. statutory tax rate primarily due to the net tax benefits from the geographical mix of income before taxes and the related tax rates in those jurisdictions. Our effective tax rate is based on nonrecurring events as well as recurring factors, including the geographical mix of income and the related tax rates in those jurisdictions and available foreign tax credits. In addition, our effective tax rate will change based on discrete or other nonrecurring events that may not be predictable. We anticipate that our effective tax rate for the remaining quarters of 2010 will be approximately 32%, excluding the effects of any discrete events.
Page 16

Equity in Net Income of Unconsolidated Affiliates Equity in net income of unconsolidated affiliates of $28 million improved $19 million compared to second quarter 2009, which reflects our 25% share of Fuji Xerox’s higher net income driven by higher revenue and cost improvements. Second quarter 2010 equity income includes charges of $5 million related to our share of Fuji Xerox after-tax restructuring compared to $9 million of charges for the second quarter 2009. Notes for Operations Review: (1) Results for the Services segment, Gross Margin and SAG are discussed
primarily on a pro-forma basis and include ACS’s estimated results for April 1st through June 30th in 2009 since actual comparisons against the prior year would not otherwise be meaningful. See the “Non-GAAP Financial Measures” section for an explanation of these non-GAAP financial measures.
(2) Post sale revenue does not include outsourcing revenue which is reported in our
Services segment. (3) See the “Non-GAAP Financial Measures” section for an explanation of this non-GAAP financial measure. Capital Resources and Liquidity The following table summarizes our cash and cash equivalents for the three months ended June 30, 2010 and 2009:
(in millions) 2010 2009 Change
Net cash provided by operating activities 678$ 609$ 69$ Net cash used in investing activities (130) (36) (94) Net cash (used in) provided by financing activities (457) 82 (539)
(19) 17 (36) Increase in cash and cash equivalents 72 672 (600) Cash and cash equivalents at beginning of period 1,010 549 461 Cash and Cash Equivalents at End of Period 1,082$ 1,221$ (139)$
June 30,
Effect of exchange rate changes on cash and cash equivalents
Three Months Ended
Cash Flows from Operating Activities Net cash provided by operating activities was $678 million in the second quarter 2010 reflecting the inclusion of ACS as well as approximately $20 million of cash outflows for acquisition related costs. The $69 million
Page 17

increase in cash from second quarter 2009 was primarily due to the following: • $282 million increase in pre-tax income before depreciation and
amortization, litigation and restructuring. • $123 million increase due to higher accounts payable and accrued
compensation primarily related to the higher level of inventory purchases.
• $23 million increase due to lower restructuring payments. • $248 million decrease as a result of higher inventory levels reflecting
increased activity. • $36 million decrease due to the net settlement of the ACS shareholders
litigation. • $34 million decrease due to an increase in accounts receivable of $76
million reflecting higher revenues partially offset by collections of $42 million of deferred proceeds from prior quarter sales of receivables.
• $33 million decrease as a result of up-front costs associated with service contracts.
Cash Flows from Investing Activities Net cash used in investing activities was $130 million in the second quarter 2010. The $94 million decrease in cash from second quarter 2009 was primarily due to an increase in capital expenditures (including internal use software) of $88 million as a result of the inclusion of ACS in 2010. Cash Flows from Financing Activities Net cash used in financing activities was $457 million in the second quarter 2010. The $539 million decrease in cash from second quarter 2009 was primarily due to the following: • $547 million decrease from higher net repayments on other debt.
Second quarter 2010 reflects the repayment of $950 million of Senior Notes offset by net proceeds of $602 million from borrowings under the Credit Facility and net payments of $48 million on other debt. Second quarter 2009 reflects the issuance of $750 million in Senior Notes, as well as net payments of $599 million on the Credit Facility.
• $22 million decrease reflecting dividends on a larger number of outstanding shares as a result of the acquisition of ACS.
• $16 million increase primarily due to lower debt payments on secured financings.
Page 18

Customer Financing Activities The following represents our Total finance assets, net associated with our lease and finance operations:
June 30, December 31,(in millions) 2010 2009
Total Finance receivables, net (1) 6,392$ 7,027$ Equipment on operating leases, net 504 551Total Finance Assets, net 6,896$ 7,578$
The reduction of $682 million in Total finance assets, net includes unfavorable currency of $383 million.
(1) Includes (i) billed portion of finance receivables, net, (ii) finance receivables, net and (iii) finance receivables due after one year, net as included in our Condensed Consolidated Balance Sheets.
The following summarizes our debt as of June 30, 2010 and December 31, 2009:
June 30, December 31,(in millions) 2010 2009
Principal debt balance 9,398$ 9,122$ Net unamortized discount (1) (11) Fair value adjustments 220 153
Total Debt 9,617 9,264 Less: current maturities and short-term debt (358) (988)
Total Long-Term Debt 9,259$ 8,276$
Our lease contracts permit customers to pay for equipment over time rather than at the date of installation, therefore, we maintain a certain level of debt (that we refer to as financing debt) to support our investment in these lease contracts, which are reflected in Total finance assets, net. For this financing aspect of our business, we maintain an assumed 7:1 leverage ratio of debt to equity as compared to our finance assets. Based on this leverage, the following represents the breakdown of total debt between financing debt and core debt:
June 30, December 31,(in millions) 2010 2009
Financing Debt(2) 6,034$ 6,631$ Core Debt 3,583 2,633 Total Debt 9,617$ 9,264$
Page 19

(2) Financing debt includes $5,593 million and $6,149 million as of June 30, 2010 and
December 31, 2009, respectively, of debt associated with Total finance receivables, net and is the basis for our calculation of "equipment financing interest" expense. The remainder of the financing debt is associated with Equipment on operating leases.
Sales of Accounts Receivables We have facilities in the U.S., Canada and several countries in Europe that enable us to sell, on an on-going basis, certain accounts receivables without recourse to third-parties. The accounts receivables sold are generally short-term trade receivables with payment due dates of less than 60 days. Accounts receivables sales activity for the second quarter 2010 and 2009 were as follows:
(in millions) 2010 2009
Accounts receivable sales 535$ 373$ Deferred proceeds 73 - Fees associated with sales 3 3 Estimated increase on operating cash flows (1) 86 111
Three MonthsEnded June 30,
(1) Represents the difference between current and prior period receivable sales adjusted for the effects of the deferred proceeds and currency.
Forward-Looking Statements This release contains "forward-looking statements" as defined in the Private Securities Litigation Reform Act of 1995. The words “anticipate,” “believe,” “estimate,” “expect,” “intend,” “will,” “should” and similar expressions, as they relate to us, are intended to identify forward-looking statements. These statements reflect management’s current beliefs, assumptions and expectations and are subject to a number of factors that may cause actual results to differ materially. These factors include but are not limited to: the unprecedented volatility in the global economy; the risk that unexpected costs will be incurred; the outcome of litigation and regulatory proceedings to which we may be a party; actions of competitors; changes and developments affecting our industry; quarterly or cyclical variations in financial results; development of new products and services; interest rates and cost of borrowing; our ability to protect our intellectual property rights; our ability to maintain and improve cost efficiency of operations, including savings from restructuring actions; changes in foreign currency exchange rates; changes in economic conditions, political conditions, trade protection measures, licensing requirements and tax matters in the foreign countries in which we do business; reliance on third parties for manufacturing of products and provision of services; the
Page 20
risk that we will not realize all of the anticipated benefits from the acquisition of Affiliated Computer Services, Inc.; our ability to recover capital investments; the risk that subcontractors, software vendors and utility and network providers will not perform in a timely, quality manner; the risk that multi-year contracts with governmental entities could be terminated prior to the end of the contract term; the risk that individually identifiable information of customers, clients and employees could be inadvertently disclosed or disclosed as a result of a breach of our security; and other factors that are set forth in the “Risk Factors” section, the “Legal Proceedings” section, the “Management’s Discussion and Analysis of Financial Condition and Results of Operations” section and other sections of our Quarterly Report on Form 10-Q for the quarter ended March 31, 2010 and our 2009 Annual Report on Form 10-K filed with the Securities and Exchange Commission. The Company assumes no obligation to update any forward-looking statements as a result of new information or future events or developments, except as required by law. Non-GAAP Financial Measures We have reported our financial results in accordance with generally accepted accounting principles (“GAAP”). In addition, we have discussed the non-GAAP measures described below. A reconciliation of these non-GAAP financial measures to the most directly comparable financial measures calculated and presented in accordance with GAAP are set forth below as well as in the 2010 second quarter presentation slides available at http://www.xerox.com/investor. These non-GAAP financial measures should be viewed in addition to, and not as a substitute for, the Company’s reported results prepared in accordance with GAAP. Adjusted Earnings Measures To better understand the trends in our business and the impact of the ACS acquisition, we believe it is necessary to adjust the following amounts determined in accordance with GAAP to exclude the effects of the certain items as well as their related income tax effects: • Net income and Earnings per share (“EPS”) – 2010 second quarter actual
and EPS guidance for the 2010 third quarter and full-year • Effective tax rate • Operating income and margin
The above have been adjusted for the following items: • Restructuring and asset impairment charges (including those incurred by
Fuji Xerox): Restructuring and asset impairment charges consist of costs primarily related to severance and benefits for employees terminated pursuant to formal restructuring and workforce reduction plans. We exclude these charges because we believe that these historical costs do
Page 21
not reflect expected future operating expenses and do not contribute to a meaningful evaluation of our current or past operating performance. In addition, such charges are inconsistent in amount and frequency. Such charges are expected to yield future benefits and savings with respect to our operational performance.
• Acquisition related costs: We incurred significant expenses in connection with our acquisition of ACS which we generally would not have otherwise incurred in the periods presented as a part of our continuing operations. Acquisition related costs include transaction and integration costs, which represent external incremental costs directly related to completing the acquisition and the integration of ACS and Xerox. We believe it is useful for investors to understand the effects of these costs on our total operating expenses.
• Amortization of intangible assets: The amortization of intangible assets is driven by our acquisition activity which can vary in size, nature and timing as compared to other companies within our industry and from period to period. Accordingly, due to the incomparability of acquisition activity among companies and from period to period, we believe exclusion of the amortization associated with intangible assets acquired through our acquisitions allows investors to better compare and understand our results. The use of intangible assets contributed to our revenues earned during the periods presented and will contribute to our future period revenues as well. Amortization of intangible assets will recur in future periods.
• Other discrete, unusual or infrequent costs and expenses: In addition, we have also excluded the following additional items given the discrete, unusual or infrequent nature of these items on our results of operations for the period – 1) ACS shareholders litigation settlement (Q2); 2) Venezuela devaluation (Q1) and 3) Medicare subsidy tax law change (income tax effect only) (Q1). We believe exclusion of these items allows investors to better understand and analyze the results for the period as compared to prior periods as well as expected trends in our business.
Pro-forma Basis To better understand the trends in our business, we discuss our 2010 operating results by comparing them against adjusted 2009 results which include ACS historical results for the comparable period. Accordingly, we have included ACS’s 2009 estimated results for the comparable period, April 1st through June 30th in 2009 in our reported 2009 results and, in the context of our first quarter and year-to-date results from February 5, 2009. We refer to comparisons against these adjusted 2009 results as “pro-forma” basis comparisons. ACS 2009 historical results have been adjusted to reflect fair value adjustments related to property, equipment and computer software as well as customer contract costs. In addition, adjustments were made for deferred revenue, exited businesses and other material non-recurring costs associated with the acquisition. We believe comparisons on a
Page 22
pro-forma basis are more meaningful than the actual comparisons given the size and nature of the ACS acquisition. We believe the pro-forma basis comparisons allow investors to have better understanding and additional perspective of the expected trends in our business as well as the impact of the ACS acquisition on the Company’s operations. Constant Currency To better understand trends in our business, we believe that it is helpful to adjust revenue to exclude the impact of changes in the translation of foreign currencies into U.S. dollars. We refer to this adjusted revenue as “constant currency.” Currencies for developing market countries (Latin America, Brazil, Middle East, India, Eurasia and Central-Eastern Europe) that we operate in are reported at actual exchange rates for both actual and constant revenue growth rates because (1) these countries historically have had volatile currency and inflationary environments and (2) our subsidiaries in these countries have historically taken pricing actions to mitigate the impact of inflation and devaluation. Management believes the constant currency measure provides investors an additional perspective on revenue trends. Currency impact can be determined as the difference between actual growth rates and constant currency growth rates. Management believes that these non-GAAP financial measures provide an additional means of analyzing the current periods’ results against the corresponding prior periods’ results. However, these non-GAAP financial measures should be viewed in addition to, and not as a substitute for, the Company’s reported results prepared in accordance with GAAP. Our non-GAAP financial measures are not meant to be considered in isolation or as a substitute for comparable GAAP measures and should be read only in conjunction with our consolidated financial statements prepared in accordance with GAAP. Our management regularly uses our supplemental non-GAAP financial measures internally to understand, manage and evaluate our business and make operating decisions. These non-GAAP measures are among the primary factors management uses in planning for and forecasting future periods. Compensation of our executives is based in part on the performance of our business based on these non-GAAP measures. A reconciliation of these non-GAAP financial measures and the most directly comparable measures calculated and presented in accordance with GAAP are set forth on the following tables:
Page 23

Net Income and EPS reconciliation:
(in millions; except per share amounts) Net Income EPS Net Income EPSReported 227$ 0.16$ 140$ 0.16$
Adjustments:Xerox and Fuji Xerox restructuring charge 12 0.01 9 0.01 Acquisition-related costs 14 0.01 - - Amortization of intangible assets 53 0.04 9 0.01 ACS shareholders litigation settlement 36 0.02 - -
115 0.08 18 0.02
Adjusted 342$ 0.24$ 158$ 0.18$
Three Months EndedJune 30, 2010
Three Months EndedJune 30, 2009
Average shares for the calculation of adjusted EPS were 1,446 million and include 27 million shares associated with the Series A convertible preferred stock and therefore excludes the quarterly dividends of $6 million. On a quarterly basis we evaluate the dilutive effect of the Series A convertible preferred stock on an “if-converted” basis.
Q3 2010 FY 2010
GAAP EPS $ 0.14 - $ 0.16 $ 0.47 - $ 0.51
Adjustments:Xerox restructuring charge 0.01 0.14 Fuji Xerox restructuring charge - 0.02 Acquisition related costs - 0.04 Amortization of intangible assets 0.04 0.14 Venezuela devaluation - 0.02 ACS shareholders litigation settlement 0.03 Senior note redemption 0.01 Medicare subsidy tax law change - 0.01
0.05 0.41
Adjusted EPS $ 0.19 - $ 0.21 $ 0.88 - $ 0.92
Est. weighted avg shares for adj EPS* 1,419 1,389
Earnings Per Share
*Q3 2010: Average shares exclude 27 million shares associated with the Series A convertible preferred stock because to include them would be anti-
Page 24

dilutive. However, the quarterly dividend of $6 million associated with the preferred stock has been taken into account in the EPS guidance range. *FY 2010: Average shares include a pro-rata portion of the 27 million shares associated with the Series A convertible preferred stock. As a result, the 2010 dividends of $21 million have been excluded when calculating the full-year EPS guidance range. Note: we evaluate the dilutive effect of the Series A convertible preferred stock on an “if-converted” basis. Effective Tax reconciliation:
Three Months Ended Three Months Ended
(in millions)Pre-Tax Income
Income Tax
ExpenseEffective Tax Rate
Pre-Tax Income
Income Tax
ExpenseEffective Tax Rate
Reported 320$ 112$ 35.0% 197$ 59$ 29.9%
Adjustments:Xerox restructuring charge 11 4 - - Acquisition-related costs 15 1 - - Amortization of intangible assets 85 32 15 6 ACS shareholders litigation settlement 36 - - -
Adjusted 467$ 149$ 31.9% 212$ 65$ 30.7%
June 30, 2010 June 30, 2009
Operating Income / Margin reconciliation:
(in millions) Amount Revenue MarginPre-tax Income/Margin - Reported 320$ 5,508$ 5.8%
Adjustments:Xerox restructuring charge 11 Acquisition-related costs 15 Amortization of intangible assets 85 Other expenses, net 128
Operating Income/Margin - Adjusted 559$ 5,508$ 10.1%
June 30, 2010Three Months Ended
Page 25

Pro-forma: Total Xerox: Three Months Ended June 30,
(in millions)As Reported
2010As Reported
2009Pro-forma
2009 (1) ChangePro-forma
Change
Revenue CategoryEquipment sales 930$ 828$ 828$ 12% 12%Supplies, paper and other 861 774 808 11% 7%
Sales 1,791 1,602 1,636 12% 9%Service, outsourcing and rentals 3,553 1,951 3,577 82% (1%)Finance income 164 178 178 (8%) (8%)Total Revenues 5,508$ 3,731$ 5,391$ 48% 2%
Service, outsourcing and rentals 3,553$ 1,951$ 3,577$ 82% (1%)Add: Finance income 164 178 178 Add: Supplies, paper and other sales 861 774 808 Annuity Revenue 4,578$ 2,903$ 4,563$ 58% -
Gross Profit:Sales 619$ 537$ 543$ Service, outsourcing and rentals 1,194 851 1,200 Financing income 103 110 110
Total 1,916$ 1,498$ 1,853$
Gross Margin:Sales 34.6% 33.5% 33.2% 1.1 pts 1.4 ptsService, outsourcing and rentals 33.6% 43.6% 33.6% (10.0) pts - ptsFinance 62.8% 61.8% 61.8% 1.0 pts 1.0 pts
Total 34.8% 40.2% 34.4% (5.4) pts 0.4 pts
RD&E 194$ 202$ 202$ RD&E % Revenue 3.5% 5.4% 3.7% (1.9) pts (0.2) pts
SAG 1,163$ 1,013$ 1,154$ SAG % Revenue 21.1% 27.2% 21.4% (6.1) pts (0.3) pts
NOTES:(1) Pro-forma reflects ACS's 2009 estimated results from April 1st through June 30th in 2009 adjusted to
reflect fair value adjustments related to property, equipment and computer software as well as customercontract costs. In addition, adjustments were made for deferred revenue, exited businesses and othermaterial non-recurring costs associated with the acquisition.
Page 26

Total Xerox: Three Months Ended June 30,
(in millions)As Reported
2010As Reported
2009Pro-forma
2009 (1) ChangePro-forma
Change
Pre-tax Income 320$ 197$ 387$
Adjustments:Xerox restructuring charge 11 (1) (1) Acquisition related costs 15 - - Amortization of intangible assets 85 15 15 Other expenses, net 128 72 97 Adjusted Operating Income 559$ 283$ 498$
Pre-tax Income Margin 5.8% 5.3% 7.2% 0.5 pts (1.4) ptsAdjusted Operating Margin 10.1% 7.6% 9.2% 2.5 pts 0.9 pts
NOTES:(1) Pro-forma reflects ACS's 2009 estimated results from April 1st through June 30th in 2009 adjusted to
reflect fair value adjustments related to property, equipment and computer software as well as customercontract costs. In addition, adjustments were made for deferred revenue, exited businesses and othermaterial non-recurring costs associated with the acquisition.
Services Segment: Three Months Ended June 30,
(in millions)As Reported
2010As Reported
2009Pro-forma
2009 (1) ChangePro-forma
Change
Document Outsourcing 836$ 850$ 850$ (2%) (2%)Business Processing Outsourcing (2) 1,341 - 1,306 * 3%Information Technology Outsourcing 352 - 354 * (1%)
Total Revenue - Services 2,529$ 850$ 2,510$ 198% 1%
Segment Profit - Services 319$ 61$ 282$ * 13%
Segment Margin - Services 12.6% 7.2% 11.2%
* Percent change not meaningful.
NOTES:(1) Pro-forma reflects ACS's 2009 estimated results from April 1st through June 30th in 2009 adjusted to
reflect fair value adjustments related to property, equipment and computer software as well as customercontract costs. In addition, adjustments were made for deferred revenue, exited businesses and othermaterial non-recurring costs associated with the acquisition.
(2) BPO does not include at this time historic Xerox BPO services, those are included in Document Outsourcing
-XXX-
Page 27

APPENDIX I
Xerox Corporation Earnings per Common Share
(in millions, except per share data. Shares in thousands)
2010 2009 2010 2009
Basic Earnings per Share:
Net income attributable to Xerox 227$ 140$ 185$ 182$ Accrued Dividends on preferred stock (6) - (9) -
Adjusted net income available to common shareholders 221$ 140$ 176$ 182$
Weighted average common shares outstanding 1,383,283 870,161 1,265,080 868,782
Basic Earnings per Share 0.16$ 0.16$ 0.14$ 0.21$
Diluted Earnings per Share:
Net income attributable to Xerox 227$ 140$ 185$ 182$ Accrued Dividends on preferred stock (6)$ -$ (9)$ -$ Interest on Convertible Securities, net - - - -
Adjusted net income available to common shareholders 221$ 140$ 176$ 182$
Weighted average common shares outstanding 1,383,283 870,161 1,265,080 868,782 Common shares issuable with respect to: Stock options 14,393 325 12,439 322 Restricted stock and performance shares 18,984 6,448 16,756 8,144 Convertible preferred stock - - - - Convertible securities 1,992 1,992 - - Adjusted weighted average common shares outstanding 1,418,652 878,926 1,294,275 877,248
Diluted Earnings per Share 0.16$ 0.16$ 0.14$ 0.21$
The following securities were not included in the computation of diluted earnings per share because to do so would have been anti-dilutive (in thousands of shares):Stock options 109,790 44,398 111,744 44,401 Restricted stock and performance shares 12,852 8,482 15,080 6,786 Convertible preferred stock 26,966 - 26,966 - Convertible Securities - - 1,992 1,992
149,608 52,880 155,782 53,179
Dividends per Common Share 0.0425$ 0.0425$ 0.085$ 0.085$
June 30, June 30,Three Months Ended Six Months Ended
Page 28

APPENDIX II
Xerox Corporation Reconciliation of Segment Operating Profit to Pre-Tax Income
(in millions) 2010 2009Segment Profit 499$ 229$ Reconciling items:
Restructuring and asset impairment charges (11) 1 Restructuring charges of Fuji Xerox (5) (9) Acquisition-related costs (15) - Amortization of intangible assets (85) (15) ACS shareholders litigation settlement (36) - Equity in net income of unconsolidated affiliates (28) (9) Other 1 -
Pre-Tax Income 320$ 197$
June 30,Three Months Ended
Our reportable segments are aligned to how we manage the business and view the markets we serve. Our reportable segments are Technology, Services and Other. Technology: The Technology segment is centered around strategic product
groups, which share common technology, manufacturing and product platforms. This segment includes the sale of document systems and supplies, provision of technical service and financing of products. Our products range from:
“Entry”, which includes A4 devices and desktop printers. “Mid-Range”, which includes A3 devices that generally
serve workgroup environments in mid to large enterprises. This includes products that fall into the market categories, Color 41+ppm <$100K and Light Production 91+ppm <$100K.
“High-End”, which includes production printing and publishing systems that generally serve the graphic communications marketplace and large enterprises.
Services: The Services segment comprises three service offerings,
Document Outsourcing, which includes Managed Print Services and historic Xerox Business Process Outsourcing services, Business Process Outsourcing and Information Technology Outsourcing.
Page 29

Other: The Other segment includes Xerox Supplies Business Group
(“XSBG”) (predominantly paper), Wide Format Systems, licensing revenue, GIS network integration solutions and electronic presentation systems, and non-allocated corporate items.
Page 30