News from Rohde&Schwarz · for GSM interference analysis GSM Network Scanner R&S®TSMU-K13 (option)...
60
2006/II 190 News from Rohde & Schwarz EMI test receiver featuring unparalleled measurement speed All-in-one solution: phase noise tester and high-end spectrum analyzer Compact UHF low-power transmitters for closing coverage gaps
Transcript of News from Rohde&Schwarz · for GSM interference analysis GSM Network Scanner R&S®TSMU-K13 (option)...

2006/ II
190
News from Rohde & Schwarz
EMI test receiver featuring unparalleled measurement speed
All-in-one solution: phase noise tester and high-end spectrum analyzer
Compact UHF low-power transmitters for closing coverage gaps

�
MOBILE RADIO
Coverage measurement systemsRadio Network Analyzer R&S®TSMUAutomatic detection of interferences in GSM networks ..................................................4
Test systemsRF Performance Test System R&S®TS9970Displaying and evaluating spatial radiation characteristics...........................................10
Protocol testersProtocol Tester R&S®CRTU-WValidated tests for videotelephony in 3G networks ........................................................13
R&S®CRTU / R&S®CMU�00Test cases for “Push to talk over Cellular” ......................................................................16
Spectrum analyzersSpectrum Analyzers R&S®FSP/R&S®FSUAnalyzing HSDPA and HSUPA signals ............................................................................19
Handheld Spectrum Analyzer R&S®FSH3Code domain power measurement on 3GPP base stations ..........................................��
WPAN / WLAN / WWAN
Signal generators / signal analyzersSignal Generators R&S®SMx / Analyzers R&S®FSQ / FSLWiMAX goes mobile – new T&M solutions are required .............................................�4
GENERAL PURPOSE
Signal analyzersSpectrum Analyzer R&S®FSLAnalyzing TV signals in cable networks ..........................................................................�8
When equipped with the R&S®TSMU-K13 option, the R&S®TSMU, which is a compact test system for coverage measurements in WCDMA and GSM networks, automatically detects the sources of co-channel and adjacent-channel interference in GSM networks (page 4).
A software for the Test System R&S®TS9970 evaluates the radiation characteristics of mobile phone antennas and makes development and certification as well as report generation much easier (page 10).
44849
The new EMI Test Receivers R&S®ESU comply with all commercial and military standards
for EMI measurements. They perform these measurements with maximum accuracy and at
unparalleled speed (page 39).
News from Rohde&Schwarz Number 190 (�006/ II)
NUMBER 190 �006/ II Volume 46

3
Phase noise testersSignal Source Analyzer R&S®FSUPPhase noise tester and spectrum analyzer up to 50 GHz ...............................................30
Test receiversMeasuring Receiver R&S®FSMRHigh-precision sensor modules for convenient measurements .....................................34
TechnologyLXI – the new LAN standard for networking T&M equipment ......................................36
EMC/FIELD STRENGTH
Test receiversEMI Test Receiver R&S®ESUMaximum precision at unparalleled measurement speed .............................................39
Spectrum analyzersSpectrum Analyzer R&S®FSUScope of functions expanded for EMI precompliance measurements ..........................44
BROADCASTING
ReferenceVHF FM broadcast transmitters for foreign missions of the German Armed Forces .....48
Shenzhen subway equipped with DVB-T transmitter technology from Rohde&Schwarz ...50
TV transmittersUHF Low-Power Transmitter Family R&S®SV8000Power is not always a matter of size ..............................................................................5�
GeneratorsR&S®DV-H�64 transport stream libraryTransport and elementary streams for the H.�64 compression standard .....................55
MISCELLANEOUS
Newsgrams ......................................................................................................................57
Unique: A combination of phase noise tester and high-end spectrum analyzer, the new Signal Source Analyzer R&S®FSUP offers all functions required for completely characterizing oscilla-tors (page 30).
The Power Sensor Modules R&S®NRP-Z27/-Z37 for the Measuring Receiver R&S®FSMR enable absolute level measurements with utmost preci-sion and convenience, eliminating the need for switching between the measuring receiver and the power meter (page 34).
The low-power transmitters of the R&S®SV8000 UHF transmitter family are ideal for closing cov-erage gaps. They feature compact design, flexi-bility and intelligent standby systems (page 52).
News from Rohde&Schwarz Number 190 (�006/ II)
Published by Rohde&Schwarz GmbH&Co. KG · Mühldorfstrasse 15 · 81671 München Support Center: Tel. (+49) 018051�4�4� · E-mail: [email protected] Fax (+4989) 41�9-13777 · Editor and layout: Ludwig Drexl�� Redaktion – Technik (German)· Editor and layout: Ludwig Drexl�� Redaktion – Technik (German)Editor and layout: Ludwig Drexl�� Redaktion – Technik (German) English translation: Dept. 9MC7 · Photos: Rohde&Schwarz · Printed in Germany · Circulation (German�� English and French) 80000 approx. 4 times a year · ISSN 00�8-9108 · Supply free of charge through your nearest Rohde&Schwarz representative · Reproduction of extracts permitted if source is stated and copy sent to Rohde&Schwarz München. R&S® is a registered trademark of Rohde&Schwarz GmbH&Co. KG. Trade names are trademarks of the owners. CDMA2000® is a registereds a registered trademark of Telecommunications Industry Association (TIA USA). The Bluetooth® word mark and logos are owned by the Bluetooth SIG�� Inc. and any use of such marks by Rohde&Schwarz is under license.

4
Radio Network Analyzer R&S®TSMU
Automatic detection of interferences in GSM networks
The R&S®TSMU is a compact test
system for coverage measurements
in WCDMA and GSM networks. With
the R&S®TSMU-K13 option, it auto-
matically detects the sources of co-
channel and adjacent-channel inter-
ference in GSM networks, evaluates
the data and displays the results.
FIG 1 The R&S®TSMU automatically detects, analyzes and displays the results of co-channel and adjacent-channel interferences in GSM networks during a drive test.
Interferences – a frequent impairment in radio networks
In addition to criteria such as attractive prices�� a product portfolio matching cus-tomer‘s needs�� a comprehensive range of services and effective marketing�� a network operator‘s image and economic success depend primarily on the tech-nical performance of the radio network. Yet precisely the need to ensure and optimize the quality of radio networks poses a permanent challenge to net-work operators. This involves�� for exam-ple�� detecting the impairments that most
frequently occur in radio networks�� i.e. interferences. Solving this problem with conventional measuring equipment is very difficult and time-consuming. The Radio Network Analyzer R&S®TSMU from Rohde&Schwarz (FIG 1) makes this task a great deal easier. In conjunc-tion with the R&S®ROMES measurement software�� this specialist for the analy-sis of receive conditions in mobile radio networks automatically detects and ana-lyzes interferences during drive tests and displays the results in a straightforward manner.
448�0/�
News from Rohde&Schwarz Number 190 (�006/ II)
MOBILE RADIO Coverage measurement systems

5
Interferences may have a variety of causes. Radio networks are never com-plete; they are continuously being expanded�� for example by adding new base stations or transmit channels. Changes usually have to be made under great pressure of time�� which places considerable demands on frequency planning and network operation. Such measures often affect existing frequency plans that were optimized for the orig-inal radio scenarios. Interference may also be caused by incorrectly set fre-quencies or carriers of other networks�� both in one‘s own country and in neigh-boring countries. The problem of inter-ference is aggravated in areas close to the border.
System components for GSM interference analysis
The following components are required for interference analysis in GSM net-works (FIG 6):
PC (e.g. notebook) for performing the measurementsRadio Network Analyzer R&S®TSMUCoverage Measurement Software R&S®ROMES including functionality for GSM interference analysisGSM Network Scanner R&S®TSMU-K13 (option)Test mobile phone (e.g. Sagem OT�90 supporting C/I parameter) and associ-ated driver in R&S®ROMESGPS system and associated driver in R&S®ROMESList of GSM base stations of network operator
◆
◆
◆
◆
◆
◆
◆
BTS 4203310
SC202570
BTS 3694026
BTS 2254053
BTS 1902015
FIG 2 Radio scenario with five base stations, one of them acting as a serving cell. The channel numbers are listed in the table.
SC BTS 1 BTS 2 BTS 3 BTS 4C0
(BCCH)�0 90 �5 69 �0
C1 �5 �0 40 40 33C2 70 15 53 �6 10
Potential interference channels
Type of interference
C0 of serving cell (channel 20) C0 of BTS 4 (channel �0) C0C0C1 of BTS 1 (channel �0) C0Cx
C1 of serving cell (channel 25) C0 of BTS � (channel �5) CxC0C� of BTS 3 (channel �6) CxCx (adjacent channel)
C2 of serving cell (channel 70) C0 of BTS 3 (channel 69) CxC0 (adjacent channel)
FIG 3 Complete list of interferences that may occur in the radio scenario shown in FIG 2.
Interferences are defined in a variety of ways; the explanations below therefore concentrate on typical problems encoun-tered in the radio field. Interferences are most commonly caused by the mutual interaction of GSM useful frequencies. Co-channel or adjacent-channel interferences cause serious problems in signal recep-tion. Interferences may also result from unwanted external frequencies radiat-ing into the network�� e.g. emissions from unshielded appliances or frequencies used by the military.
FIG � shows a radio scenario with five base stations (BTS)�� one of these acting as the serving cell (SC) for the terminal. The base
station uses carrier C0 (referred to as the BCCH carrier) of the serving cell to transmit to the terminal the information it requires to identify and synchronize to the cell. This transmission takes place via timeslot T0. In the remaining timeslots of the BCCH car-rier�� traffic data (voice or data) is transmitted. Channels C1 and C� transport traffic data only. The other four base stations also trans-mit data on their respective BCCHs and chan-nels C1 and C��� but are at this moment not actively communicating with the terminal.
FIG 3 shows all interferences that may occur in this scenario�� stating all co-channels and adjacent channels that may impair the cur-rent SC. In accordance with the GSM stan-dard�� the BCCH transmits at maximum power in each of its timeslots (possibly only dummy bursts) and will therefore be received by the terminal permanently and with the high-est level. The traffic channels Cx (C1 and C�) are differently loaded during their eight time-slots�� depending on the traffic volume; plus�� their transmit power can be controlled. Their total power is as a rule lower than that of the BCCH carrier�� and the interferences they cause can therefore usually be considered lower than that caused by the BCCH carrier. Of the eight timeslots of the BCCH carrier�� the R&S®TSMU only measures and analyzes timeslot T0 (FIG 4). The remaining timeslots are not considered in the analysis for the reasons stated above. In the case of a C0Cx interference (traffic channel Cx interferes with channel C0)�� only the BCCH belonging to the Cx is analyzed as an interference fre-quency.
What causes interferences in GSM networks?
FIG 4 The eight timeslots of the BCCH carrier.
T0C0 T1 T2 T3 T4 T5 T6 T7
FCCH, SCH, BCCH, CCCH
News from Rohde&Schwarz Number 190 (�006/ II)
6
Five steps to reach your goal
GSM interference analysis basically is performed in five steps:
The test mobile phone is operating in the endless call mode (e.g. voice call). The RxLev and RxQual parameters and�� if supported by the phone�� the C/I parameter are analyzed.If one or more parameters exceed pre-defined thresholds�� the scanner will identify this as being caused by inter-ference (FIG 8).Potential interference frequencies are determined by comparing the current serving cell channel against co-chan-nels or adjacent channels that are included in the BTS list and lie within the user-defined radius (FIG 9).The cell identities (CIs) measured with the GSM network scanner are com-pared against the CIs of the potential interference frequencies included in the base station list.Results found are displayed in plain text�� giving the name of the cell as stated in the BTS list.
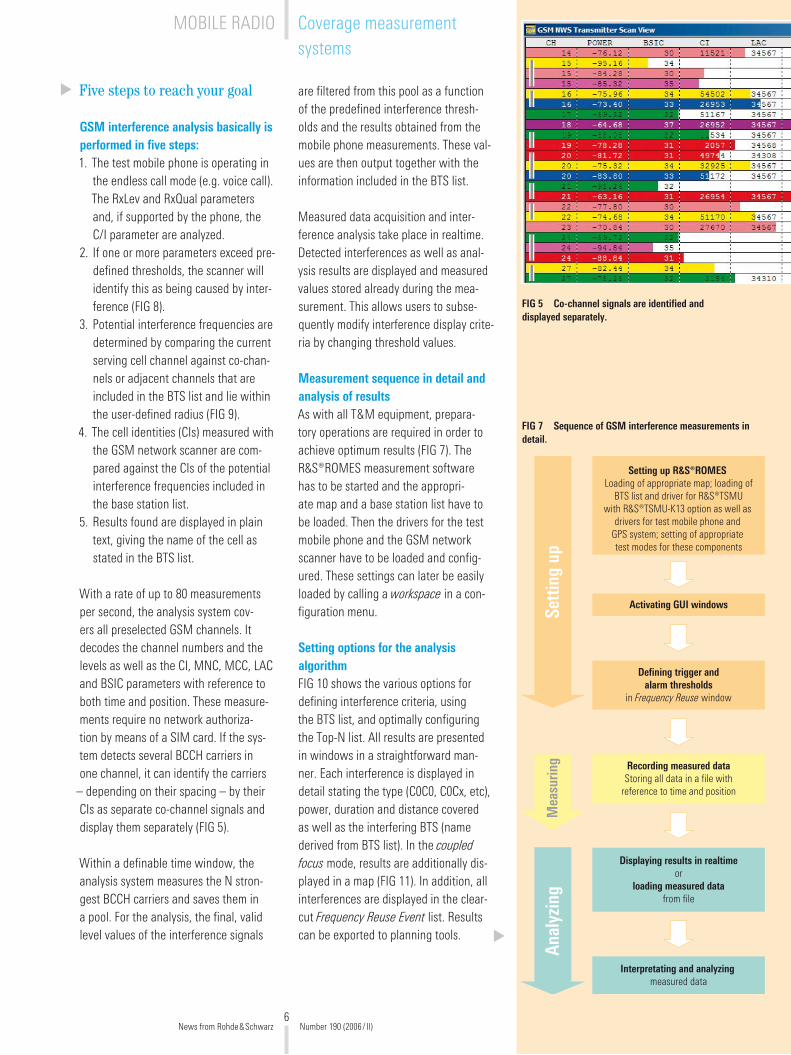
With a rate of up to 80 measurements per second�� the analysis system cov-ers all preselected GSM channels. It decodes the channel numbers and the levels as well as the CI�� MNC�� MCC�� LAC and BSIC parameters with reference to both time and position. These measure-ments require no network authoriza-tion by means of a SIM card. If the sys-tem detects several BCCH carriers in one channel�� it can identify the carriers
– depending on their spacing – by their CIs as separate co-channel signals and display them separately (FIG 5).
Within a definable time window�� the analysis system measures the N stron-gest BCCH carriers and saves them in a pool. For the analysis�� the final�� valid level values of the interference signals
1.
�.
3.
4.
5.
FIG 5 Co-channel signals are identified and displayed separately.
are filtered from this pool as a function of the predefined interference thresh-olds and the results obtained from the mobile phone measurements. These val-ues are then output together with the information included in the BTS list.
Measured data acquisition and inter-ference analysis take place in realtime. Detected interferences as well as anal-ysis results are displayed and measured values stored already during the mea-surement. This allows users to subse-quently modify interference display crite-ria by changing threshold values.
Measurement sequence in detail and analysis of resultsAs with all T&M equipment�� prepara-tory operations are required in order to achieve optimum results (FIG 7). The R&S®ROMES measurement software has to be started and the appropri-ate map and a base station list have to be loaded. Then the drivers for the test mobile phone and the GSM network scanner have to be loaded and config-ured. These settings can later be easily loaded by calling a workspace in a con-figuration menu.
Setting options for the analysis algorithmFIG 10 shows the various options for defining interference criteria�� using the BTS list�� and optimally configuring the Top-N list. All results are presented in windows in a straightforward man-ner. Each interference is displayed in detail stating the type (C0C0�� C0Cx�� etc)�� power�� duration and distance covered as well as the interfering BTS (name derived from BTS list). In the coupled focus mode�� results are additionally dis-played in a map (FIG 11). In addition�� all interferences are displayed in the clear-cut Frequency Reuse Event list. Results can be exported to planning tools.
FIG 7 Sequence of GSM interference measurements in detail.
Setting up R&S®ROMESLoading of appropriate map; loading of
BTS list and driver for R&S®TSMUwith R&S®TSMU-K13 option as well as
drivers for test mobile phone and GPS system; setting of appropriate test modes for these components
Activating GUI windows
Defining trigger andalarm thresholds
in Frequency Reuse window
Recording measured dataStoring all data in a file with
reference to time and position
Displaying results in realtimeor
loading measured datafrom file
Interpretating and analyzingmeasured data
Sett
ing
upAn
alyz
ing
Mea
surin
g
News from Rohde&Schwarz Number 190 (�006/ II)
MOBILE RADIO Coverage measurement systems

7
NotebookWindows XP,
1.8 GHz, 512 Mbyte RAM, 20 Gbyte hard disk
Radio Network AnalyzerR&S®TSMU
with GSM network scanner (R&S®TSMU-K13)
Fire wire
Installed
on notebook
R&S®ROMESincluding
GPSUSB or
RS-232-C
12 V DC
PPS12 V DC
12 V DC
BTS listUSB orRS-232-C
GSM-test mobilephone
Batt.
Batt.
GSM network scannersoftware
12 V DC
FIG 6 Components required for GSM interference analysis.
FIG 8 Frequency Reuse Event display listing interferences determined as a function of the set thresholds.
FIG 9 Frequency Reuse C0 display.
Markedinterference frequency 1
Data of interferencefrequency 1
Step 3
Steps 4 and 5
News from Rohde&Schwarz Number 190 (�006/ II)

8
An investment that pays off rapidly
Detecting and identifying interferences used to be an extremely time-consum-ing procedure. The Radio Network Ana-lyzer R&S®TSMU automatically detects and analyzes interfering base stations in a short time�� including plain-text display�� without requiring any manual rework-ing. The R&S®ROMES software ensures highly convenient�� flexible and efficient operation of the system.
Highlights of the ¸TSMU with the ¸TSMU-K13 GSM option
Efficient�� time-saving optimization of GSM�� GPRS and EDGE radio networks independently of the infrastructureCovers all GSM frequencies (GSM450/850 / 900/1800/1900/GSM-E/GSM-R)Multichannel capability within a measure-ment setupHigher measurement speed and measurement accuracy than obtainable with test mobile phonesRequires no network authorization by means of SIM cardCan be used with GSM�� GPRS and EDGE test mobile phones for triggering and signalingIdentification and analysis of roaming prob-lems and interferences originating�� for exam-ple�� from networks of neighboring countriesAutomatic off-the-air measurement and demodulation of all GSM channelsDecoding of type 1 to 4 system information such as NCC�� BCC�� CI�� LAC�� MNC and MCC; output of ARFCN�� RF level�� and name and position of base stationSupplies coverage measurement data�� i. e. one measurement value per time stamp and position
◆
◆
◆
◆
◆
◆
◆
◆
◆
◆
Condensed data of the R&S®TSMU with R&S®TSMU-K13 optionSensitivity <–11� dBmLevel error ±1 dBMinimum C/I for initial decoding of CI�� MNC�� MCC�� LAC�� etc >�.5 dBLevel measurement rate including the decoding of CI�� BSIC�� LAC�� MNC�� MCC up to 80 channels/sCycle times (typ. / max.) GSM900 1.54 s / 3 s GSM1800 4.65 s / 9 s GSM-R 0.�5 s / 0.5 s
Abbreviations
ARFCN Absolute radio frequency channel number
BCC Base station color code
BCCH Broadcast control channel
BSIC Base station identity code
BTS Base transmitter station
C/I Carrier-to-interference ratio
CI Cell identity
CCCH Common control channel
FCCH Frequency correction channel
LAC Location area code
MCC Mobile country code
MNC Mobile network code
NCC Network color code
SC Serving cell
SCH Synchronization channel
Summary
The Radio Network Analyzer R&S®TSMU from Rohde&Schwarz is a high-end analysis tool for radio coverage mea-surements. With the appropriate options installed�� this compact solution not only supports network operators in planning and optimizing their GSM networks�� but also helps them set up and structure WCDMA and HSDPA networks.
Christian Fischer; Johann Maier
More information and data sheets on R&S®TSMU and R&S®ROMES at
www.rohde-schwarz.com (search term: TSMU/ROMES)
REFERENCESRadio Network Analyzer R&S®TSMU: Unprecedented quality for mobile measure-ments in GSM networks. News from Rohde&Schwarz (�005) No. 186�� pp 4–7
News from Rohde&Schwarz Number 190 (�006/ II)
MOBILE RADIO Coverage measurement systems

9
FIG 10 Menu for defining the thresholds and other parameters for interference analysis.
FIG 11 Complete, straightforward and correlated representation of results.
C/I trigger threshold Radius forBTS search
Number ofinterference frequenciesin time window
Limit valuesfor analysis
Types ofinterference frequencies
RxLev/RXQualtrigger thresholds
for hopping ornon-hopping mode
News from Rohde&Schwarz Number 190 (�006/ II)

10
RF Performance Test System R&S®TS9970
Displaying and evaluating spatial radiation characteristics
The RF Performance Test System
R&S®TS9970 (FIG 1) evaluates the
spatial radiation characteristic of
mobile phone antennas in accor-
dance with the CTIA standard, for
example. Measured data is reduced to
a two-dimensional display in the polar
diagram. The third dimension can be
displayed again by using additional
software.
FIG 1 The RF Performance Test System R&S®TS9970 determines important RF characteristics of wireless communications equipment under realistic operating conditions.
Life is much easier in 3D
Measured values used for evaluating the radiation characteristic of mobile radio antennas�� for example�� are displayed in tables or in polar diagrams (two-dimen-sional display). If only a few test points are displayed�� experts can easily evalu-
ate the strengths and weaknesses of an EUT. This is quite different if many test points and a complex characteristic are displayed. The R&S®RPS16-3D extension to the R&S®RPS16 software makes life much easier; it creates a three-dimen-sional display fast and easily – a great help in development and certification.
4437
0/4
More information and data sheet on the test system at
www.rohde-schwarz.com (search term: TS9970)
REFERENCES[*] Test Plan for Mobile Station OTA Perfor-
mance�� Revision �.1; CTIA Certification; April �005
News from Rohde&Schwarz Number 190 (�006/ II)
MOBILE RADIO Test systems

11
EIRP Theta90 Phi0
EIRP Theta90 Phi90
EIRP Theta0 Phi0
EIRP Theta90 Phi180
EIRP Theta90 Phi270
EIRP Theta180 Phi0
Data.Rp; 19.05.2006 13:01:05
File Header
R&S RPS16 Measurement Result: CTIAGSM_810 hor + ver
TestType=TXChannel=810Band=1900 MHzFrequency=1909.800000MHzxxxxxxxxxxxSAM Phantom, RightBattery BL-5C13.01.2005Check meas. camera slide open
Calculated Values
Total Radiated Power (dBm) 24,9854Peak EIRP (dBm) 33,0538Directivity (dBi) 8,0685NHPRP 45° (dBm) 23,6198NHPRP 30° (dBm) 22,1004Front/Back Ratio 14,8834PhiBW (°) 86,8PhiBW Up (°) 41,2PhiBW Down(°) 45,5ThetaBW (°) 59,2ThetaBW Up(°) 11,5ThetaBW Down(°) 47,6Boresight Phi (°) 315,0Boresight Theta (°) 135,0Maximum Power (dBm) 33,0538Minimum Power (dBm) 6,8021Average Power (dBm) 25,2553Max/Min Ratio (dB) 26,2517Max/Avg Ratio (dB) 7,7985Min/Avg Ratio (dB) -18,4533
Information
Data.Rp; 19.05.2006 13:01:05
Use in development
Design engineers would be glad if they could�� so to speak�� get hold of measured data and analyze it in greater detail. With the new software they can actually do this – in a split second it calculates a three-dimensional representation based on the measured data and displays it (FIG �). You can interactively rotate the representation or take a closer look at special areas using the zoom function. Data can be colored according to mea-sured values�� which makes visual evalu-ation fast and easy. You can select spe-cial test points using a marker and then obtain more detailed information. And you can also display the horizontal and vertical cross section of measured data.
The software makes it fast and easy to evaluate the measured data. For pre-sentation and documentation purposes it also allows you to copy the individual view to the clipboard for further process-ing�� to store it as a graphic or directly send it to a printer without any addi-tional processing steps required.
Reports for certification
In certification�� the main focus is on gen-erating clear and conclusive reports which contain the most important cri-teria. Here�� too�� this visualization tool is ideal: After loading the measured data�� the printout of the most important cal-culated data and an overview of dif-ferent views with EUT characteristics can be generated with only two mouse clicks (FIG 3). The currently implemented report function is based on the charac-teristic values defined in [*]. For further individual requirements regarding report generation�� the calculated data and graphics can be exported to programs such as Microsoft Word or Excel.
FIG 2 3D graph with marker and horizontal and vertical cross-sectional information.
FIG 3 The software generates conclusive reports with just a few mouse clicks. The layout of the different graph views can be set.
EIRP Theta90 Phi0
EIRP Theta90 Phi90
EIRP Theta0 Phi0
EIRP Theta90 Phi180
EIRP Theta90 Phi270
EIRP Theta180 Phi0
Data.Rp; 19.05.2006 13:01:05
File Header
R&S RPS16 Measurement Result: CTIAGSM_810 hor + ver
TestType=TXChannel=810Band=1900 MHzFrequency=1909.800000MHzxxxxxxxxxxxSAM Phantom, RightBattery BL-5C13.01.2005Check meas. camera slide open
Calculated Values
Total Radiated Power (dBm) 24,9854Peak EIRP (dBm) 33,0538Directivity (dBi) 8,0685NHPRP 45° (dBm) 23,6198NHPRP 30° (dBm) 22,1004Front/Back Ratio 14,8834PhiBW (°) 86,8PhiBW Up (°) 41,2PhiBW Down(°) 45,5ThetaBW (°) 59,2ThetaBW Up(°) 11,5ThetaBW Down(°) 47,6Boresight Phi (°) 315,0Boresight Theta (°) 135,0Maximum Power (dBm) 33,0538Minimum Power (dBm) 6,8021Average Power (dBm) 25,2553Max/Min Ratio (dB) 26,2517Max/Avg Ratio (dB) 7,7985Min/Avg Ratio (dB) -18,4533
Information
Data.Rp; 19.05.2006 13:01:05
News from Rohde&Schwarz Number 190 (�006/ II)

1�
Convenient operation
The most important values can be entered via a toolbar (FIG 4). Further set-tings can be made in the menu bar. Dif-ferent tabs for evaluating data are avail-able depending on the relevant opera-tion. They can be selected via the follow-ing tabs:
Raw Data The first tab displays the contents of the loaded file. The contents can be copied to the clipboard or directly printed.
Converted Data The second tab con-tains the key values in tables�� e.g. TRP (Total Radiated Power) / TIS (Total Iso-tropic Sensitivity)�� Maximum�� Mini-mum�� 3 dB Aperture�� etc�� as well as data resulting from the horizontal and vertical
measurement from which the resulting overall data was calculated and also dis-played in a table. You can print this table or copy it for further processing to Excel via the clipboard.
Graph The following three tabs con-tain the three-dimensional display of measured data – divided into overall data�� horizontal and vertical data. Each view can be copied to the clipboard�� directly printed or stored as a graphic using the buttons in the toolbar. You can also generate graphics with different fixed views.
Pictures The last tab allows you to look at an overview or preview of the graphics last generated and to store selected graphics or all of them.
FIG 4 The graphical user interface of the R&S®RPS16-3D software.
Intuitive operation in three dimensions
A sophisticated assignment between displayed data and mouse movements as well as an intuitive mouse configura-tion makes working in the three-dimen-sional representation convenient and efficient. Various presettings are offered�� e.g. for line colors or surface display. But you can also define the colors yourself. A two-stage interpolation allows you to graphically process measurements with a limited number of test points and to set markers between test points.
Summary
The R&S®RPS16-3D software from Rohde&Schwarz is a postprocessing tool for evaluating radiation characteristics which makes development�� certification and report generation convenient and easy. Go and get your third dimension of measured data back!
Andreas Ulm
News from Rohde&Schwarz Number 190 (�006/ II)
MOBILE RADIO Test systems

13
Protocol Tester R&S®CRTU-W
Validated tests for videotelephony in 3G networks
3G mobile radio standards such as
UMTS allow the use of mobile video-
telephony to simultaneously transmit
audio and video signals. For this
purpose, standardization bodies have
defined guidelines specifying that
video phone calls be made via circuit-
switched connections on the basis
of the 3G-324M protocol. Whether
a mobile phone functions in confor-
mance with these guidelines can now
be verified and, if necessary, certified
for the first time by performing vali-
dated tests with the R&S®CRTU-W
protocol tester.
Circuit-switched connections
The standardization bodies‘ first approach was to base all mobile video applications on the Internet protocol (IP). However�� this packet-switched trans-mission was dropped because latency in transmission is still too high in most cur-rent mobile IP networks. Moreover�� qual-ity of service (QoS) is insufficient dur-ing the entire time of the connection and IP networks require a bandwidth that is several times higher than with cir-cuit-switched connections. Considering these drawbacks�� only circuit-switched realtime connections are currently suit-able for video applications.
The 3G-324M standard
Based on the H.3�4 standard�� which defines audiovisual communications in public analog telephone networks�� the 3G-3�4M protocol was developed for mobile radio networks�� which have a comparatively high susceptibility to transmission errors. The protocol was enhanced by special audio and video codecs for mobile radio. It can thus orga-nize the exchange of audio�� video�� data and signaling information via separate logical channels on a common transpar-ent 64 kbit/s channel in the transmit and receive direction (FIG 1).
Video codecsH.263
(MPEG-4)
Command & controlH.245
Audio codecsG.723.1
AMR
Datasharing
protocols
Control Audio I/O DataVideo I/O
LC 0 LC 2 LC 3LC 1
MultiplexerH.223
with annexes A&B
Logicalchannel
3G modem
FIG 1 Schematic of a 3G-324M system, derived from the H.324 standard.
News from Rohde&Schwarz Number 190 (�006/ II)
MOBILE RADIO Protocol testers

14
Different logical channels converge in the multiplexers�� which play a key role in 3G-3�4M systems. After a call has been set up between two mobile phones�� the multiplexers – in accordance with the 3G-3�4M protocol – define the start level�� which is the highest mobile level supported by both terminals. By select-ing the start level�� the format and struc-ture of the information to be transmit-ted is defined. Based on this informa-
tion�� the terminals inform each other about their individual performance fea-tures�� i.e. about the available audio and video codecs�� the multiplexer capacity and the scope of the supported radio options. To avoid potential conflicts dur-ing the opening procedures of bidirec-tional channels�� the protocol defines which of the terminals is to act as mas-ter and which as slave�� and which is to assume control if necessary.
Milliseconds are key to acceptance
The duration of the call setup�� the length of the time delay and the synchroniza-tion accuracy of voice and pictures sig-nificantly contribute to the acceptance and success of videotelephony. Setting up a videotelephony call takes about four seconds�� which is twice as long as with pure voice telephony�� but is still within the generally accepted limits.
FIG 2 Complete decoding of an ASN.1 (abstract syntax notation) message of the H.245 protocol.
Sequence
Message selected from sequence
Evaluation
News from Rohde&Schwarz Number 190 (�006/ II)
MOBILE RADIO Protocol testers

15
FIG 3 Extract from a message log file.
Latency and synchronization of audio and video applications strongly influ-ence how subscribers perceive a mobile videotelephony call. End-to-end latency should therefore be no more than 150 ms; however�� modern mobile video services exhibit latencies up to 300 ms. A suitably implemented multiplexer pro-vides considerable room for improve-ment because the entire data flow is handled via the multiplexer�� which makes it a main cause of latencies.
For subscribers to experience video con-versations as being natural�� the picture /sound skew (lip synchronicity) must be 50 ms or less. However�� as it takes much longer to process a video signal than a voice signal�� the audio data must be adequately delayed in the multiplexer to achieve a satisfying lip synchronicity result.
Indispensable: the test solution from Rohde&Schwarz
The R&S®CRTU-WF01 option for the R&S®CRTU-W protocol tester from Rohde&Schwarz allows the videote-lephony functions of WCDMA mobile phones to be verified and certified by using validated test cases. These test cases�� which are part of the GCF WI-19 (Global Certification Forum Work Item) document�� help to prove whether sig-naling�� i.e. the exchange of command and control information�� is carried out in accordance with the specification. By using specification-conforming use-ful data�� a videotelephony sequence on mobile phones can be tested for proper audiovisual quality.
While a test case is running�� the pro-tocol tester records the exchanged sig-naling information in a message log file (FIGs � and 3). By activating several fil-ters�� the data volume can be processed for possible subsequent analysis from different angles. A sophisticated algo-
rithm facilitates and visualizes the track-ing of the messages via the individual protocol layers. In addition to signaling information�� audio and video information is recorded in separate files and is avail-able for postprocessing and analysis.
Future prospects
Limited video services such as multime-dia messaging service (MMS) for pic-tures�� video clips and sound are already being exchanged via IP in the mobile radio network. Until IP-based realtime video communications is feasible�� man-ufacturers of mobile phones for videote-lephony must rely on the 3G-3�4M pro-
More information and data sheet on the R&S®CRTU at
www.rohde-schwarz.com (search term: CRTU)
tocol and suitable test methods. The test cases provided by Rohde&Schwarz are indispensable for certification purposes
– in addition to being a powerful devel-opment tool.
Thomas A. Kneidel
News from Rohde&Schwarz Number 190 (�006/ II)
16
R&S®CRTU / R&S®CMU200
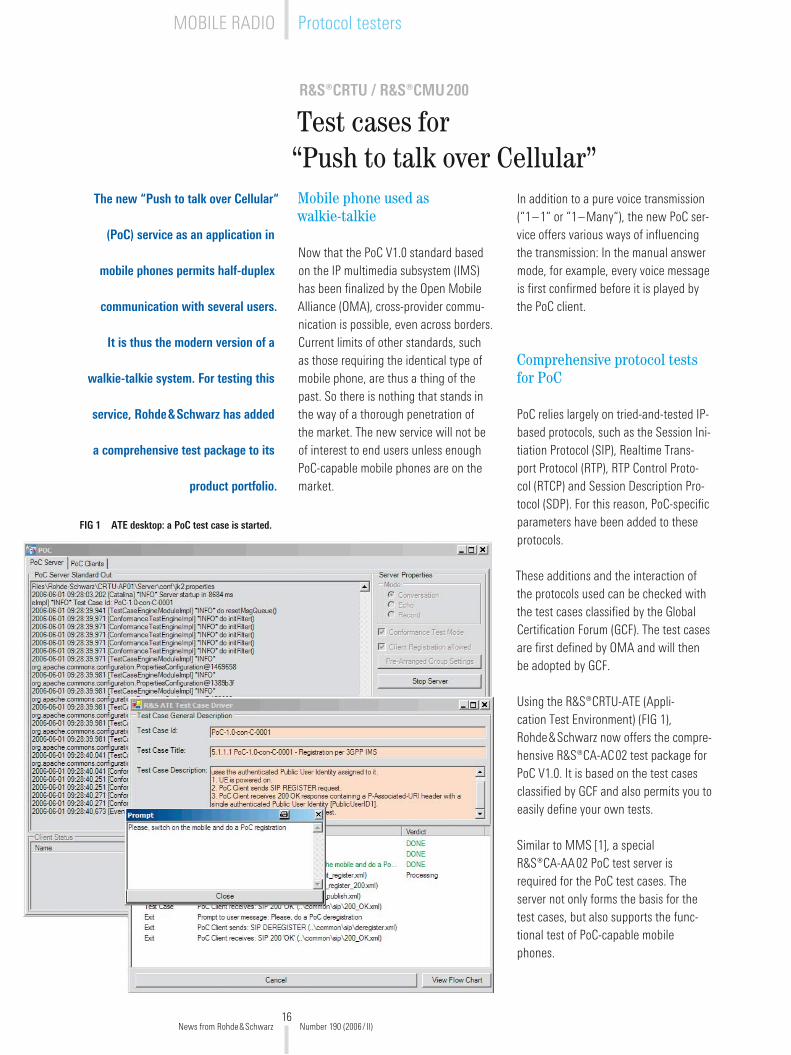
Test cases for “Push to talk over Cellular”
The new “Push to talk over Cellular“
(PoC) service as an application in
mobile phones permits half-duplex
communication with several users.
It is thus the modern version of a
walkie-talkie system. For testing this
service, Rohde&Schwarz has added
a comprehensive test package to its
product portfolio.
Mobile phone used as walkie-talkie
Now that the PoC V1.0 standard based on the IP multimedia subsystem (IMS) has been finalized by the Open Mobile Alliance (OMA)�� cross-provider commu-nication is possible�� even across borders. Current limits of other standards�� such as those requiring the identical type of mobile phone�� are thus a thing of the past. So there is nothing that stands in the way of a thorough penetration of the market. The new service will not be of interest to end users unless enough PoC-capable mobile phones are on the market.
In addition to a pure voice transmission (“1–1“ or “1–Many“)�� the new PoC ser-vice offers various ways of influencing the transmission: In the manual answer mode�� for example�� every voice message is first confirmed before it is played by the PoC client.
Comprehensive protocol tests for PoC
PoC relies largely on tried-and-tested IP-based protocols�� such as the Session Ini-tiation Protocol (SIP)�� Realtime Trans-port Protocol (RTP)�� RTP Control Proto-col (RTCP) and Session Description Pro-tocol (SDP). For this reason�� PoC-specific parameters have been added to these protocols.
These additions and the interaction of the protocols used can be checked with the test cases classified by the Global Certification Forum (GCF). The test cases are first defined by OMA and will then be adopted by GCF.
Using the R&S®CRTU-ATE (Appli-cation Test Environment) (FIG 1)�� Rohde&Schwarz now offers the compre-hensive R&S®CA-AC0� test package for PoC V1.0. It is based on the test cases classified by GCF and also permits you to easily define your own tests.
Similar to MMS [1]�� a special R&S®CA-AA0� PoC test server is required for the PoC test cases. The server not only forms the basis for the test cases�� but also supports the func-tional test of PoC-capable mobile phones.
FIG 1 ATE desktop: a PoC test case is started.
News from Rohde&Schwarz Number 190 (�006/ II)
MOBILE RADIO Protocol testers

17
The R&S®CA-AA0� PoC test server offers the following test modes [�]:
Conversation Several PoC clients can communicate with each otherEcho A PoC client gets its own voice messages backRecord The voice messages are saved as a file
Separating the test cases from the func-tional elements in the test server has made the various protocols less complex.
◆
◆
◆
You can therefore easily compile the desired messages and parameters with-out having to know the protocol in detail.
As with MMS�� the test cases are defined in the eXtensible Markup Language (XML) and can thus be expanded or modified without any complex tools. A simple text or XML editor is sufficient.
The message flow�� the parameters to be tested and the response messages can
be flexibly defined. The PoC test suite from Rohde&Schwarz is thus not only of interest for conformance tests but
– owing to its flexibility – also offers a wide range of applications in develop-ment:
Regression testingStability testsTesting the insensitivity to errored messages (robust implementation)Testing the behavior of compliant pro-tocol variants
◆
◆
◆
◆
FIG 2 Analysis following a PoC test – the message flow is displayed here.
News from Rohde&Schwarz Number 190 (�006/ II)

18
The generated analyses of the tested scenario (message flow�� log file) are cru-cial for protocol tests. The PoC test suite not only offers straightforward error analysis but also a graphically processed message flow between the DUT and the test server. Potential errors in the imple-mentation can thus be determined fast and accurately (FIG �).
Connection
The R&S®CRTU-ATE runs on any com-mercial PC with Windows XP or �000. This PC needs an IP connection to a Universal Radio Communication Tes-
PoC(Push to talkover cellular)
¸CA-AA 02
MMS(Multimedia
message service)¸CA-AA 01
Futureapplication enabler
and toolbox
Servers including analysis and development tools
Application testing(E)GRPS / WCDMA / CDMA2000®
¸CMU-K92 / -K96 / -K87
Serving scenario(E)GRPS / WCDMA
¸CRTU-GD 04 / -WD 04
¸CMU 200 ¸CRTU-G / -W
Framework / desktop / message loggingATE – Application Test Environment ¸CA-AP 01
PoC¸CA-AC 02
MMS¸CA-AC 01
(Validated) test cases
VTVideo telephony
¸CRTU-WF 01
¸CRTU-W
Future test cases
FIG 3 Test software program for the R&S®CMU200 and the R&S®CRTU-G / -W.
More information and data sheet on the R&S®CMU200 and the R&S®CRTU-G/-W
at www.rohde-schwarz.com
(search term: type designation)
REFERENCES[1] R&S®CRTU-G / -W: MMS tests on
multimedia mobile phones. News from Rohde&Schwarz (�005) No. 185�� pp 4–6
[�] R&S®CMU�00 / CRTU-G / -W: Standard-ized test solutions for PoC mobile phones. News from Rohde&Schwarz (�005) No. 188�� pp 14–16
ter R&S®CMU�00 or to a Protocol Tes-ter R&S®CRTU-G / -W with the corre-sponding software (FIG 3). Since PoC is a purely IP-based service�� it can be utilized independent of the radio access network (RAN) used. Standards such as WCDMA�� GSM/GPRS or CDMA�000® can thus be used as RAN.
Owing to the flexibility of IP and the PoC test suite from Rohde&Schwarz�� you can not only operate the test suite via a sys-tem simulator but also connect a DUT – e.g. via a test or live network – for devel-opment purposes. The only prerequisite is a direct IP connection between PoC client and test server.
Summary
The integrated PoC test solution from Rohde&Schwarz allows you to easily and conveniently test PoC implemen-tations in compliance with GCF criteria. The available test cases are based on the OMA specifications. The structure of the test cases lets you define your own test cases and scenarios fast and easily. For this reason�� the R&S®CA-AA0� and R&S®CA-AC0� PoC test suites are not only of interest for conformance tests but also for the development of PoC-capable user equipment.
Stefan Diebenbusch
News from Rohde&Schwarz Number 190 (�006/ II)
MOBILE RADIO Protocol testers
19
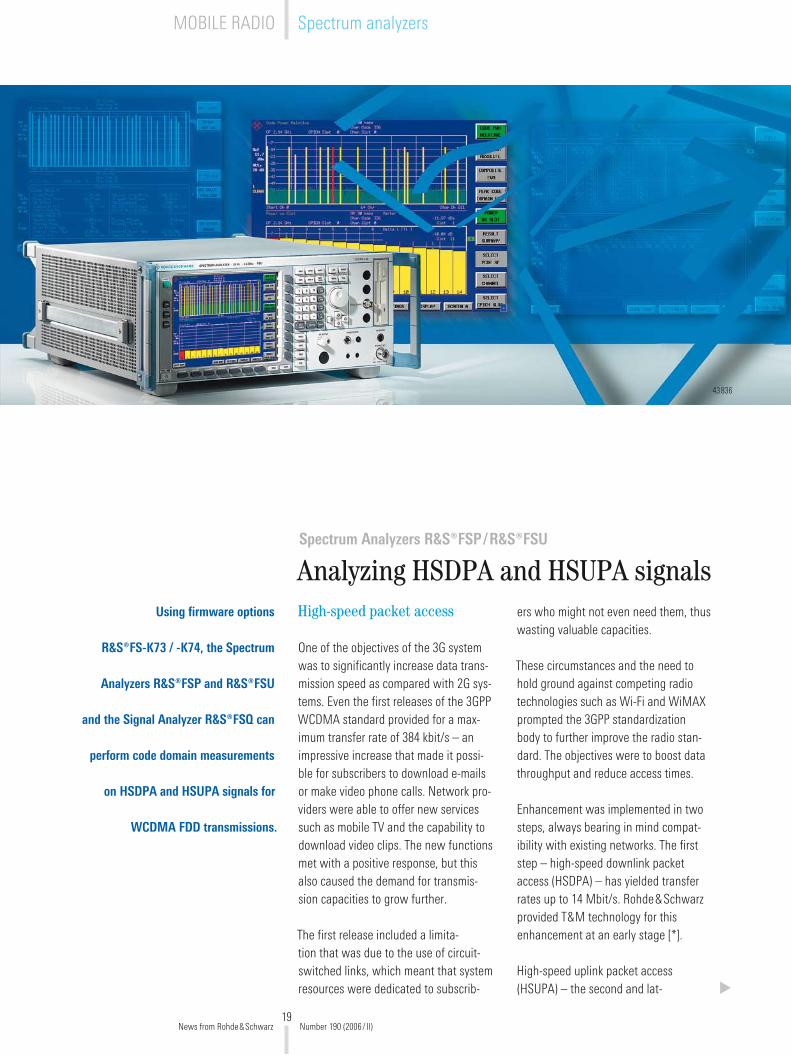
Spectrum Analyzers R&S®FSP/R&S®FSU
Analyzing HSDPA and HSUPA signalsUsing firmware options
R&S®FS-K73 / -K74, the Spectrum
Analyzers R&S®FSP and R&S®FSU
and the Signal Analyzer R&S®FSQ can
perform code domain measurements
on HSDPA and HSUPA signals for
WCDMA FDD transmissions.
High-speed packet access
One of the objectives of the 3G system was to significantly increase data trans-mission speed as compared with �G sys-tems. Even the first releases of the 3GPP WCDMA standard provided for a max-imum transfer rate of 384 kbit/s – an impressive increase that made it possi-ble for subscribers to download e-mails or make video phone calls. Network pro-viders were able to offer new services such as mobile TV and the capability to download video clips. The new functions met with a positive response�� but this also caused the demand for transmis-sion capacities to grow further.
The first release included a limita-tion that was due to the use of circuit-switched links�� which meant that system resources were dedicated to subscrib-
ers who might not even need them�� thus wasting valuable capacities.
These circumstances and the need to hold ground against competing radio technologies such as Wi-Fi and WiMAX prompted the 3GPP standardization body to further improve the radio stan-dard. The objectives were to boost data throughput and reduce access times.
Enhancement was implemented in two steps�� always bearing in mind compat-ibility with existing networks. The first step – high-speed downlink packet access (HSDPA) – has yielded transfer rates up to 14 Mbit/s. Rohde&Schwarz provided T&M technology for this enhancement at an early stage [*].
High-speed uplink packet access (HSUPA) – the second and lat-
43836
News from Rohde&Schwarz Number 190 (�006/ II)
MOBILE RADIO Spectrum analyzers

�0
est enhancement of the standard – has increased uplink transfer rates to 5.76 Mbit/s. HSDPA and HSUPA together are referred to as HSPA (high-speed packet access). HSPA transfer rates by far exceed the rate of � Mbit/s specified by ITU for 3G systems. HSPA-compatible WCDMA networks are there-fore also called 3.5G systems.
HSPA measurements using ¸FSx analyzers
Rohde&Schwarz has already adapted part of its T&M product portfolio to meet the new requirements of the standard�� thus supporting manufacturers of termi-nal equipment and network components in designing their HSPA solutions.
Rohde&Schwarz has added HSUPA capability to the R&S®FS-K7�/ -K73/ -K74 application firmware packages for its R&S®FSQ�� R&S®FSP and R&S®FSU signal and spectrum analyzers. Thus�� besides HSDPA functionality�� the firm-ware now also includes extensive func-tions for transmitter measurements on HSUPA base stations and mod-ules. R&S®FS-K74 is integrated into R&S®FS-K7� and provides modula-tion test capabilities for HSDPA and HSUPA signals in the downlink. The R&S®FS-K73 option provides HSDPA and HSUPA measurements in the uplink.
Higher-order modulationA very common method of increasing data throughput is to adapt the modu-lation to the current propagation con-ditions. This method is used by several standards such as GSM/EDGE�� 1xEV-DO or Wi-Fi.
In accordance with the first WCDMA release�� a specific code in the code domain was assigned to each sub-scriber in the downlink for their payload. This code is referred to as DPCH and is always QPSK-modulated. With HSDPA��
each subscriber is also assigned a DPCH for the payload and control information. In addition�� each mobile terminal shares one or more high-speed channels (HS-PDSCH) with other subscribers for data reception. Via one or more HS-SCCHs�� the base station signals which termi-nal it will send data to. QPSK or 16QAM modulation is used�� depending on the propagation conditions.
The analyzer firmware must be able to identify the modulation type in order to demodulate signals correctly. The R&S®FS-K74 option performs this task automatically (FIG 1).
For HSDPA base station tests�� the 3GPP TS�5.141 standard specifies a new measurement for determining modula-tion quality. Test model 5 contains the signals for this measurement. The sig-nals include control channels�� traffic channels and two�� four or eight 16QAM HSDPA channels and are used to deter-mine the error vector magnitude (EVM). The new measurement using test model 5 places substantially higher demands on base stations.
Previous releases provided for two mea-surements for determining modulation quality; these covered the peak code domain error (PCDE) and the EVM. The EVM is measured using one or option-ally two active codes. The PCDE mea-surement is a highly demanding task for developers of transmitters because the test signal has a higher crest factor�� which means correspondingly greater stress for the transmitter. The stipulated PCDE of approx. –33 dB corresponds to a composite EVM of 30%.
Requirements for HSDPA are even more stringent�� stipulating an EVM of <1�.5% as well as the use of a considerably more complex signal. This makes EVM measurements very demanding. Using the R&S®FS-K74 option�� these mea-surements pose no problems. Featuring
an internal EVM as low as <1.5%�� the option has virtually no effect on mea-surement results.
HPSK modulation�� which may also be understood to be “scrambled dual BPSK“�� is used in the uplink. HSPA is a multicode transmission method�� with the peak value of the signal increasing from approx. 3.5 dB to approx. 6.5 dB rel-ative to the average value. This means greater stress for the modulator and the power amplifier in the terminal. New test procedures defining the signal structure are currently under develop-ment. An EVM of 1�.5% is allowed; how-ever�� a signal with a higher crest fac-tor must be used for measuring the EVM. The R&S®FS-K73 option supports multi-code EVM measurements (FIG �).
AbbreviationsBPSK Binary phase shift keying
CPICH Common pilot channel
DPCH Dedicated physical channel
E-DPDCH Enhanced dedicated physi-cal data channel
HPSK Hybrid phase shift keying
HS-PDSCH High-speed physical down-link shared channel
HS-SCCH High-speed shared control channel
PCDE Peak code domain error
P-CCPCH Primary common control physical channel
PICH Pilot channel
QPSK Quadrature phase-shift keying
S-CCPCH Secondary common control physical channel
News from Rohde&Schwarz Number 190 (�006/ II)
MOBILE RADIO Spectrum analyzers

�1
FIG 1 Shown in red:
16QAM modula-tion automatically
detected by the software.
FIG 2 The upper half of the screen shows the code domain
in the Q compo-nent of the signal.
The signal contains various codes;
the code marked red represents an
E-DPDCH with 1920 kbit/s.
Full demodulation down to bit levelTo be able to adapt modulation and cod-ing appropriately�� the base station and the mobile terminal continuously mon-itor propagation conditions and signal current conditions to each other. More-over�� they exchange information as to whether demodulation was successful or transmission has to be repeated.
The analysis firmware demodulates sig-nals down to bit level (FIG 3). In conjunc-tion with the R&S®FSQ‘s large memory capable of saving up to 100 frames�� the firmware is an excellent tool for analyz-ing the signaling procedures described above.
Johan Nilsson
FIG 3 Demodulation down
to bit level.
More information, data sheet and brochure at
www.rohde-schwarz.com (search term: FS-K73 / -K74)
REFERENCES[*] Analyzers R&S®FSP/FSU/FSQ: Test
of HSDPA base stations. News from Rohde&Schwarz (�004) No. 181�� pp 16–17
News from Rohde&Schwarz Number 190 (�006/ II)

��
Handheld Spectrum Analyzer R&S®FSH3
Code domain power measurement on 3GPP base stations
For more than three years, the Hand-
held Spectrum Analyzer R&S®FSH3
has been used to perform a variety
of T&M tasks that are instru-
mental in installing and maintaining
mobile radio base stations. The
new R&S®FSH-K4 software option
now also provides code domain
power analysis for 3G base stations,
including EVM and scrambling code
determination.
FIG 1 The versatile measurement functions of the R&S®FSH3 offer a broad scope of applications, including the installation and maintenance of a mobile radio base station, on-site analyses of faults in RF cables and applications in development and service.
Measuring the code domain power in the field
So far�� only high-end spectrum analyz-ers have been able to analyze the code domain power of 3G base stations. How-ever�� due to their size and weight�� they are suitable for field applications only to a limited extent. The R&S®FSH3 (FIG 1)�� however�� was specially designed for on-
site operation: This compact�� lightweight tool can even be operated without AC supply.
To perform code domain analysis�� the R&S®FSH3 has now been enhanced by an additional memory for I/Q data. The analyzer can thus record a signal section with a length of approx. 1.� ms�� which is sufficient to detect the code channels
More information and data sheet at www.rohde-schwarz.com
(search term: FSH3)
4388
8/�e
News from Rohde&Schwarz Number 190 (�006/ II)
MOBILE RADIO Spectrum analyzers

�3
required for code domain analysis and determine their power as well as other characteristics.
In addition to the overall power of the 3G signal�� the R&S®FSH3 also outputs the power values of the following code channels:
Common pilot channel (CPICH) Primary common control physical channel (P-CCPCH)Primary synchronization channel (P-SCH)Secondary synchronization channel (S-SCH)
But analyzing the signal quality is even more beneficial: If required�� the analyzer additionally determines the error vector magnitude (EVM) of the CPICH and the P-CCPCH. The signal-to-noise ratio also considerably affects signal quality. In a WCDMA system�� the Ec/I0 value�� i.e. the ratio of the chip energy (Ec) to the power density of the interference signal (I0)�� is decisive. Naturally�� the R&S®FSH3 also supports this measurement (FIG �). Last but not least�� the carrier frequency error is measured and displayed. By directly feeding the base station reference fre-quency into the R&S®FSH3�� measure-ment accuracy can be enhanced.
Indispensable: Level Adjust and scrambling code search
What‘s the base station‘s transmit power? Which scrambling code has been used for the code channels? These are key questions posed prior to starting measurements on a base station�� and the R&S®FSH3 automatically gives the answers. Simply press the Level Adjust function button�� and the analyzer will search for the optimum level setting for the applied power. Another press of a button�� and the R&S®FSH3 determines the scrambling code of the base station and automatically uses it for decoding the code channels. You can also get a
◆
◆
◆
◆
FIG 2 The R&S®FSH3
displays all results in clear, concise tables.
FIG 3 Display of all
detected scrambling codes with their
CPICH power.
quick overview of adjacent base stations. If required�� up to eight scrambling codes and their CPICH power are displayed in a list. The list is automatically sorted according to the magnitude of the power values (FIG 3).
In practice�� only four operating steps are required to display the measured code domain values:
Select the 3GPP CDP functionEnter the center frequencyUse “Level Adjust“ to optimize the level settingStart the scrambling code search
For base stations with two antennas�� you can additionally select the antenna the R&S®FSH3 should synchronize to (antenna diversity).
◆
◆
◆
◆
Summary
Installing and maintaining a base sta-tion without the aid of the R&S®FSH3 is almost inconceivable. Equipped with a vector transmission and reflection mea-surement option (R&S®FSH-K�)�� a dis-tance-to-fault option (R&S®FSH-B�) and the new code domain power analysis option (R&S®FSH-K4)�� the R&S®FSH3 provides in a compact and lightweight box all the features that make an engi-neer‘s heart swell.
Rainer Wagner
News from Rohde&Schwarz Number 190 (�006/ II)

�4
Signal Generators R&S®SMx / Analyzers R&S®FSQ / FSL
WiMAX goes mobile – new T&M solutions are required
Now that the IEEE802.16e-2005 stan-
dard has been adopted, WiMAX radio
technology will also support mobile
applications. This will place addi-
tional demands on the required T&M
equipment.
The new IEEE802.16e-2005 standard ensures mobility
Worldwide interoperability for micro-wave access (WiMAX) was originally introduced to replace broadband cable networks such as DSL. Now that the IEEE80�.16e-�005 standard has been adopted�� WiMAX will also support mobile applications. This was made pos-sible by extensions in the MAC layer�� which handles communications setup and data processing. There have also been significant improvements in the physical layer of the standard.
Stationary applications primarily employ the OFDM [1] multicarrier method�� which serves all subscribers one after the other. This means that all carriers are each assigned to one and only one subscriber and that they each have the same mod-ulation type and power value per time-slot.
For mobile applications�� the expanded OFDMA method is used. It can handle different subscribers simultaneously. Several physical carriers are combined into subchannels�� and each subscriber is assigned a specific number of sub-channels�� depending on the bandwidth required. Downlink (DL) and uplink (UL) maps show which channels are allo-cated and when and to whom they are allocated. The physical carriers are allo-cated to the subchannels via permu-tation algorithms (DL-PUSC�� DL-FUSC�� UL-PUSC�� etc)�� which change over time and thus define various zones.
In comparison to OFDM�� ODFMA also allows a variable number of carriers (1�8�� 51��� 10�4 or �048)�� which makes it pos-sible to optimally adapt modulation to transmission requirements with different bandwidths.
These extensive enhancements of the physical layer place new demands on T&M equipment. Signal generation equipment is responsible for coding the data and modulation for the different subscribers in accordance with the stan-dard�� for distributing the data and mod-ulation to the corresponding carriers and for creating the maps. In signal analysis�� the carriers must then be reallocated to the different subscribers on the basis of these maps and demodulated�� and the results must be clearly displayed for the operator.
FIG 1 By means of the zone table, it is possible to configure various zones within a frame as well as several segments in a zone.
Multi-segment-
zone
Otherzones
News from Rohde&Schwarz Number 190 (�006/ II)
WPAN / WLAN / WWAN Signal generators / signal analyzers

�5
WiMAX signals with the ¸SMx vector signal generators
The new R&S®SMx-K49 option�� which is available for the R&S®SMU�00A�� SMJ100A and SMATE�00A signal gen-erators as well as with R&S®WinIQSIM� software for the I/Q Modulation Generator R&S®AFQ100A�� deliv-ers OFDM signals in accordance with the IEEE80�.16-�004 standard and OFDMA signals in accordance with the IEEE80�.16e-�005 standard. The latest firmware version �.0� includes a multi-carrier system that allows the genera-tion of WiMAX multicarrier scenarios even when the generator is equipped with only a single baseband path and RF path. For this purpose�� you select the desired scenario in the WiMAX main menu of the generator; this scenario is saved as a waveform by simply press-ing a button and is then available to the multicarrier system as input signal. The multicarrier system calculates a total sig-nal with the set frequency offset of the individual signals.
In the Frame Configuration menu you can determine the zones within a frame as well as the segments within a zone. In the example shown in FIG 1�� the first PUSC zone is occupied by three seg-ments. It is followed by a FUSC zone as well as another PUSC zone. FIG � graphically displays the assignment of the bursts�� i.e. the zone allocated to a subscriber in the DL map�� as a time characteristic within the zones. The R&S®SMU�00A generates this graphic at the press of a button and illustrates the currently set signal configuration in realtime.
In the configuration menu for bursts�� you can set up to 64 differently config-ured bursts per zone (FIG 3). For each burst�� the QPSK�� 16QAM and 64QAM modulation modes as well as the com-plete channel coding with standard con-
FIG 2 Graphical display of the bursts (green) within the zones.
FIG 3 Configuration menu for the bursts within a zone.
Segment 0
First PUSC zone with three segments
FUSC zone PUSC zone
Segment 1
Segment 2
Channel coding with convolution and turbo codes
Transmitdiversitywith twoantennas
Automatic generation of FCH, DL-MAP and UL-MAP bursts is possible
volution codes or turbo codes are avail-able. The automatically generated FCH�� DL-MAP and UL-MAP bursts send all the necessary details about the signal setup to the receiver�� thus allowing quick and easy receiver tests.
The new R&S®SMx-K49 option also offers transmit diversity (space-time cod-ing�� STC) for two antennas. Equipped with this option�� an R&S®SMU�00A with two baseband paths and two RF paths can generate both STC transmit signals simultaneously. This feature will make it possible to test MIMO applica-tions.
News from Rohde&Schwarz Number 190 (�006/ II)

�6
Signal analysis with the R&S®FSQ
The new R&S®FSQ-K93 option is an enhancement of the R&S®FSQ-K9� option for the Signal Analyzer R&S®FSQ. Equipped with this option�� the R&S®FSQ can be used for measurements on OFDMA signals in accordance with the IEEE80�.16-�004 and 80�.16e-�005 stan-dards. You can perform measurements on WiMAX OFDMA signals directly on the analyzer without requiring an exter-nal PC.
Before you can analyze signals of base stations�� for example�� you have to exactly define the DL map. For this pur-pose�� the new option provides a conve-nient editor that allows you to determine the number of subscribers and modula-tion modes�� the number of active sub-channels�� as well as the number and type of permutation zones (FIG 4). This map can also be read in directly by the R&S®FSQ if it is connected to an R&S®SMU�00A; otherwise you can use the setting files of the generator. In future�� the R&S®FSQ-K93 option will be able to detect DL maps automatically and thus allow automatic demodulation.
If you have set the other parame-ters such as frequency�� guard inter-val�� recording time�� etc�� the measure-ment can be started. As already known from the R&S®FSQ-K9� option�� chan-nel estimation in signal analysis can be performed during the preamble or dur-ing the entire data transmission. You can also adapt the tracking parame-ters to the measurement tasks. After the measurement is started�� the measured burst is displayed on the screen (FIG 5). A green bar at the bottom edge of the screen shows that the pulse has been detected and demodulated.
Now you can query all data that is nec-essary for analyzing WiMAX OFDMA sig-nals. A list shows all important param-
eters such as EVM�� I/Q error�� frequency error and symbol time error at a glance (FIG 6). Especially in OFDMA applica-tions�� it is important that the individ-
ual parameters are also available for each subscriber. For each subscriber�� EVM and power are therefore individ-ually listed in a submenu. In addition��
FIG 4 Definition of the DL map. The WiMAX signal consists of a PUSC zone, which is analyzed (see check mark in first table), and a FUSC zone. The second table shows the burst configuration; it can also be displayed graphically.
FIG 5 The upper part of the screen shows the recorded signal (power versus time). The lower part of the screen shows the constellation diagram. Since different bursts exhibit different modulation modes 64QAM, 16QAM and QPSK are displayed.
News from Rohde&Schwarz Number 190 (�006/ II)
WPAN / WLAN / WWAN Signal generators / signal analyzers

�7
the demodulated raw data – i.e. the bit stream – can be read out. Besides this numeric data�� the R&S®FSQ-K93 option can also generate graphics such as
spectrum flatness�� constellation diagram�� EVM versus carriers (FIG 7) or versus symbols�� which is helpful when develop-ing WiMAX applications.
AbbreviationsEVM Error vector magnitudeFCH Frame control headerFUSC Fully utilized subchannel
allocationMAC Medium access controlMIMO Multiple input multiple outputOFDM Orthogonal frequency division
multiplexingOFDMA Orthogonal frequency division
multiple accessPUSC Partially utilized subchannel
allocationQAM Quadrature amplitude modulationQPSK Quadrature phase shift keying
Summary – an all-in-one measurement solution
The combination of the Signal Genera-tor R&S®SMx and the Signal Analyzer R&S®FSQ offers an all-in-one measure-ment solution for the physical character-istics of stationary and mobile WiMAX applications. The two instruments also provide the basis for special WiMAX sys-tem solutions from Rohde&Schwarz�� such as radio conformance test systems. Due to its demodulation bandwidth�� which is unique in this price class�� the Spectrum Analyzer R&S®FSL can also be used to analyze WiMAX signals and thus provides a cost-efficient solution for production applications. Although the R&S®FSL does not feature the outstand-ing RF characteristics of the R&S®FSQ
– its sensitivity is not quite as high�� e.g. its EVM values are 10 dB less – it is still absolutely sufficient for production pur-poses.
Gernot Bauer; Dr Wolfgang Wendler
More information and data sheets at www.rohde-schwarz.com
(search term: type designation)
REFERENCE[1] Signal Generator R&S®SMU�00A /
Signal Analyzer R&S®FSQ: Complete test solution for WiMAX applications. News from Rohde&Schwarz (�005) No. 187�� pp 33–37
FIG 6 List of all relevant parameters, averaged over all bursts, that were detected within the record-ing period.
FIG 7 Display of the EVM values versus the physical carriers, here NFFT of 1024. The gaps in the traces indicate that not all carriers are used (PUSC zone).
News from Rohde&Schwarz Number 190 (�006/ II)

�8
Spectrum Analyzer R&S®FSL
Analyzing TV signals in cable networks
A new application software option
adds measurements on analog and
digital TV signals in cable networks to
the application range of the Spectrum
Analyzer R&S®FSL. Using this option,
service technicians can perform
complete measurements by pressing
a single button; it also offers various
setting capabilities for laboratory use.
More information and data sheet at www.rohde-schwarz.com
(search term: FSL)
FIG 1 The Spectrum Analyzer R&S®FSL: compact, easy to carry …
Measurements on analog and digital TV signals
Equipped with the new Cable TV Mea-surements R&S®FSL-K�0 option�� the R&S®FSL (FIGs 1 and �) combines the advantages of a full-featured spectrum analyzer with those of a TV analyzer. It is extremely versatile – regardless of whether you use it for regular mainte-nance of cable networks�� development of TV components or servicing. In the lab�� flexible setting capabilities are important whereas during work in the cable duct�� performing the necessary measure-ments quickly and easily�� ideally at the press of a button�� is what counts.
The special thing about measurements in cable networks is that usually you have to repeat the same measurements in many channels – also on different measurement points such as amplifiers
44�77/10_n
or building entrance facilities. For any measurement�� the R&S®FSL-K�0 option offers the appropriate presettings that are based on a channel table. The typi-cal procedure when performing a mea-surement on a cable�� for example�� is to select the channel table�� set the channel number�� and you‘re done! It doesn‘t mat-ter whether you have a mix of analog and digital channels – the R&S®FSL-K�0 option masters all typical measurements in all important TV standards�� including CSO and CTB for analog requirements as well as MER�� constellation and APD for digital requirements (FIGs 3 to 7). Most measurements can even be performed in the In-Service mode�� i.e. without indi-vidual channels being switched off by the network operator. Users in the lab can of course manually adapt the instru-ment default settings to meet their spe-cific measurement requirements.
Predefined or user-generated chan-nel tables minimize the operating steps for measurements in cable networks to a minimum by providing typical chan-nel spacings. Once tables have been set up�� they can be copied and distributed to all field technicians. By means of con-venient dialogs�� you can easily adapt the supplied channel tables to the local transmitter assignment.
The R&S®FSL is an indispensable tool: powerful�� versatile and easy to handle.
Thomas Reichert; Jochen Pliquett
News from Rohde&Schwarz Number 190 (�006/ II)
GENERAL PURPOSE Signal analyzers

�9
Off-Service modeIn-Service mode
Analog TVSpectrum ✓ ✓
Carriers: level and frequencies of vision and sound carriers ✓
Carrier to noise ratio (C/N) ✓ ✓
Composite second (order) beat (CSO) ✓ ✓
Composite triple beat (CTB) ✓
Video scope ✓
Vision modulation ✓
Hum ✓
Digital TVSpectrum ✓ ✓
Modulation errors: EVM�� MER�� phase jitter�� carrier frequency off-set�� symbol rate offset�� carrier suppression�� quadrature offset�� amplitude imbalance
✓
Constellation ✓
Echo pattern: channel impulse response ✓
Channel power ✓ ✓
Amplitude probability distribution (APD) ✓ ✓
Cumulative complementary distribution function (CCDF) ✓ ✓
TV analyzerTilt ✓ ✓
FIG 4 Vision modulation measurement of an analog TV signal.
FIG 6 Result table with modulation errors of a digital TV signal.
Analog TV Digital TV
B / G�� D / K�� I�� K1�� L�� M�� N QAM J.83/A (DVB-C Europe) QAM J.83/B (US Cable) QAM J.83/C (Japanese Cable)
PAL�� NTSC�� SECAM 16QAM to 10�4QAM Symbol rates 0.1 to 7.15 Msymbol/s
FIG 3 The Cable TV Measurements R&S®FSL-K20 option handles all typical measure-ments on analog and digital TV signals.
FIG 2 … and well protected for use in the field.
FIG 7 The R&S®FSL-K20 option supports all important TV standards.
FIG 5 Setting menu for analog TV signals.
44�7
7/14
News from Rohde&Schwarz Number 190 (�006/ II)

30
Signal Source Analyzer R&S®FSUP
Phase noise tester and spectrum analyzer up to 50 GHzMeasurements at a keystroke
In simple commercial applications�� phase noise can usually be measured by a spectrum analyzer such as the R&S®FSP with the R&S®FS-K40 applica-tion firmware for phase noise measure-ments [1]. However�� if more accuracy and flexibility are called for�� for example when analyzing DRO�� SAW or YIG oscil-lators�� measurements with the phase- locked loop (PLL) or phase comparator method are preferable (see box).
The phase comparator method usually requires complex test setups. Moreover�� the effort involved in calibrating the
tester is considerably higher than with spectrum analyzer measurements. But this does not apply to the R&S®FSUP – it performs phase comparator measure-ments at a keystroke. Plus�� it is a very flexible tool that allows you to easily adapt the test setup to specific require-ments. Both external and internal ref-erence sources can be used. You can decide which source is to be used to adjust the 90° phase offset on the com-parator.
Moreover�� you can conveniently config-ure the measurement parameters band-width�� filter type and number of aver-ages as well as the offset frequency
The new Signal Source Analyzer
R&S®FSUP (FIG 1) is unique. A combi-
nation of phase noise tester and high-
end spectrum analyzer, the R&S®FSUP
offers all functions required for
completely characterizing oscillators.
It is thus the ideal all-in-one instru-
ment for developing high-end transmit
and receive modules.
FIG 1 The R&S®FSUP is the only instrument worldwide that combines
a spectrum analyzer and a phase noise tester up to 50 GHz.
4447
3/4
News from Rohde&Schwarz Number 190 (�006/ II)
GENERAL PURPOSE Phase noise testers

31
Phase comparator
DUT
Reference source
PLL
= 90°
FIG 2 Schematic of the phase comparator method: The reference signal is mixed with the DUT signal; the phase noise can be measured at the output after a lowpass. The 90° offset is adjusted at the reference signal source.
FIG 3 Typical measurement using the phase comparator method: Signal frequency, level and resid-ual noise can be read off the display. The R&S®FSUP automatically detects unwanted interference, which can be blanked out. Spurious – including accurate frequency values – is listed in the display‘s top right corner.
How the phase comparator measurement method works
Applying this method�� the DUT signal is mixed with the signal from the reference source. If both signals exhibit the same frequency�� a DC voltage is obtained at the output of the mixer or phase comparator that is superimposed by the noise of the DUT and the reference source (FIG �). If the signals exhibit a 90° phase offset on the phase comparator�� pure phase noise can be measured. In this case�� the ampli-tude noise is suppressed by up to 30 dB. With 0° phase offset�� only the amplitude noise is output.
range. The menu layout is similar to that of Application Firmware R&S®FS-K40�� making operation – as usual – very easy�� especially switching between the dif-ferent measurement modes. Predefined settings for fast and highly stable mea-surements also facilitate operation.
After you start the phase noise measure-ment�� UNLOCKED�� LOCKING or LOCKED will be displayed to indicate the state of the PLL as well as to show whether the PLL is locked and a successful measure-ment can be started. You can adjust the loop bandwidth to your specific require-ments; the voltage on the phase detec-tor will be displayed during the measure-ment.
Other convenient functions
During the measurement�� an efficient algorithm can list any interference that is sinusoidally caused by power fre-quency interference or phase detector frequency�� for example (FIG 3). Alterna-tively�� you can eliminate clearly defined interference by calculation or suppress it. The R&S®FSUP also displays integral parameters such as residual phase or residual frequency modulation (residual FM/ϕM) or RMS jitter. The calculation includes the entire measurement range as standard�� but you can also define integration limits.
To perform exact measurements on oscillators�� the phase noise of the inter-nal reference signal must be negligi-ble compared to that of the DUT. The internal source of the R&S®FSUP exhib-its outstanding phase noise measure-ment values (FIG 4): At an input fre-quency of 1 GHz and a frequency offset of 10 kHz�� the value is –134 dBc(1 Hz)�� at a frequency offset of 10 MHz only
–170 dBc(1 Hz).
News from Rohde&Schwarz Number 190 (�006/ II)

3�
Cross-correlation for reduced phase noise
The R&S®FSUP-B60 option enhances the signal source analyzer with a second parallel receive path up to 8 GHz (FIG 5)�� permitting cross-correlation between the two symmetrical paths and thus eliminating the uncorrelated inherent noise of the two reference sources. As a result�� sensitivity is no longer limited by the phase noise of the internal refer-ence sources. This improves the dynamic range by up to �0 dB�� depending on the number of averages (FIG 6).
Integrated high-end spectrum analyzer
The R&S®FSUP signal source analyzer includes a high-end spectrum analyzer that also allows phase noise to be mea-sured directly in the spectrum. This method determines the spectral power density in the sidebands. It is�� how-ever�� more time-consuming. Sensitivity is lower because the carrier is not sup-pressed�� which significantly limits the dynamic range. Moreover�� cross-cor-relation cannot be performed; ampli-tude and phase noise cannot be differ-entiated. Last but not least�� this method makes the calculation and suppression of spurious more difficult.
Nevertheless�� phase noise measure-ments with the spectrum analyzer are a must in some applications because they allow considerably higher frequency off-sets to be measured. This method inev-itably complements phase noise mea-surements and is indispensable when measuring harmonics or spurious.
The R&S®FSUP offers attractive features such as the spurious emissions measure-ment function�� which are not included in the usual scope of functions provided by a spectrum analyzer. You can define dif-ferent sweep ranges including special
parameters in a list. The analyzer then automatically searches for interference and spurious in these sweep ranges. The analyzer evaluates up to 100000 mea-surement points and lists the result in a table.
Another important function for charac-terizing signal sources is the adjacent-channel power (ACP) measurement. Convenient functions in the R&S®FSUP ensure quick measurements. Predefined standard settings are available�� but you can also define channel widths and channel spacing. Plus�� the analyzer‘s wide dynamic range is setting new stan-dards in signal source analysis.
In the time domain�� the R&S®FSUP func-tions similar to an AM/FM/ϕM demod-ulator. It records the oscillator signal as a function of time�� and thus displays set-tling and switching processes of high-frequency sources with high resolution.
Complete oscillator characterization
To record an oscillator‘s characteristics and measure its phase noise by means of the phase comparator method�� the supply and tuning voltage of the oscilla-tor must be accurately set. For this pur-pose�� the R&S®FSUP provides two inde-pendent�� very low-noise DC outputs whose supply and tuning voltages can be set separately in clear-cut menus (FIG 7). Plus�� you can define the order in which the various voltages are added after the measurement has been started. An additional output with negative sup-ply voltage is provided for special appli-cations.
The R&S®FSUP takes into account prac-tical considerations by allowing you to modify the tuning voltage at a constant supply voltage (tuning characteristic) or�� vice versa�� the supply voltage at a con-stant tuning voltage (DC dependencies).
A combination of both versions�� referred to as pushing�� is also available. More-over�� the analyzer can measure typical fundamental as well as harmonic param-eters. You can select the tuning voltage or the frequency for scaling the x-axis.
Summary
The R&S®FSUP�� which provides a max-imum input frequency of 50 GHz�� is the world‘s only tool that combines a phase noise tester and a spectrum analyzer in a single box. It is thus ideal for develop-ment and production as it reduces the costs for signal source analysis�� provides straightforward test setups and offers higher flexibility. In addition�� all func-tions can be remote-controlled via LAN or GPIB�� making it easy to integrate the signal source analyzer into production lines.
Hagen Eckert; Dr Wolfgang Wendler
More information and data sheet at www.rohde-schwarz.com
(search term: FSUP)
REFERENCES[1] Spectrum Analyzers R&S®FSP/FSU/
FSQ: Phase noise testers of unparalleled quality. News from Rohde&Schwarz (�005) No. 186�� pp �4–�6
News from Rohde&Schwarz Number 190 (�006/ II)
GENERAL PURPOSE Phase noise testers

33
Referencegenerator 2
PLL
Harmonics generator
A/D
DividerRFinput
Signalprocessing
Referencegenerator 1
PLL
A/DLNA 1
LNA 2
Display
Harmonics generator
Option R&S®FSUP-B60
¸FSUP
FIG 5 Schematic of the cross-correlation for increasing sensitivity during phase noise measurements.
FIG 6 The measurement on an oscillator with subsequent filter illustrates the increase in sensitivity due to cross-correlation. The yellow trace represents a measurement without cross-correlation; the two other measurements were performed with cross-correlation. You can clearly see how sen-sitivity can be augmented by up to 20 dB, depending on the number of averages.
FIG 4 Typical phase noise of the internal reference source of the R&S®FSUP at different input frequencies.
FIG 7 Menu for setting the DC
output and the output for negative supply voltage.
–20
–40
–60
–80
–100
–120
–140
–160
–180100 Hz1 Hz 1 kHz 10 kHz 100 kHz 1 MHz 10 MHz 30 MHz10 Hz
Offset frequency
SSB
phas
e no
ise
in d
Bc
26 GHz18 GHz10 GHz
3 GHz1 GHz
AbbreviationsDRO Dielectric resonator oscillatorPLL Phase-locked loopSAW Surface acoustic waveVCO Voltage-controlled oscillatorYIG Yttrium iron garnet
News from Rohde&Schwarz Number 190 (�006/ II)

34
Measuring Receiver R&S®FSMR
High-precision sensor modules for convenient measurements
The new Power Sensor Modules
R&S®NRP-Z27 and -Z37 for the
Measuring Receiver R&S®FSMR
(FIG 1) enable absolute level measure-
ments with utmost precision and
convenience, eliminating the need
for switching between the measuring
receiver and the power sensor.
Level calibration with utmost precision
The Measuring Receiver R&S®FSMR [*] combines a power meter�� a modu-lation and audio analyzer and a high-grade spectrum analyzer in a single unit. It is a specialist for high-precision mea-surements for calibrating signal gener-ators and attenuators. The R&S®FSMR is ideal for measuring the output level of signal sources with levels typically ranging from +10 dBm to –130 dBm. The new power sensor modules for the R&S®FSMR enable high-precision level measurements at maximum user con-venience as they include a power sen-sor and a power splitter�� which makes the tedious and error-prone switching between the power sensor and the mea-suring receiver unnecessary.
Previously�� such measurements were performed as follows: First�� the power sensor was connected to the device under test (DUT) and the absolute power determined; the resulting value was used as a reference for the subsequent measurements. Second�� the power sen-sor was screwed off�� and the RF inputs of the measuring receiver and the DUT were connected via a cable. With the generator settings remaining unchanged�� the level was measured with the mea-suring receiver and normalized to the reference value previously determined. Based on this normalization�� it was pos-sible to perform absolute measurements with utmost precision – due to the R&S®FSMR‘s extremely high linearity and large measurement range. If several frequencies had to be covered�� these steps had to be repeated for each test frequency involved.
The new Power Sensor Modules R&S®NRP-Z�7 and -Z37 now greatly enhance the convenience as well as accuracy of such measurements�� because the power sensor and the mea-suring receiver are connected in paral-lel via an integrated power splitter. The time-consuming and error-prone switch-ing between the power sensor and the measuring receiver is thus a thing of the past. And the power sensor modules offer an additional advantage: They per-form all necessary corrections automati-cally (see box). So why choose a tedious method when a convenient one is avail-able?
Michael Wöhrle
FIG 1 The R&S®FSMR with the Power Sensor Module R&S®NRP-Z27.
44439/�
News from Rohde&Schwarz Number 190 (�006/ II)
GENERAL PURPOSE Test receivers

35
More information at www.rohde-schwarz.com (search term: NRP-Z27 / -Z37)
REFERENCES[*] Measuring Receiver R&S®FSMR – Single�� compact instrument for
calibrating signal generators. News from Rohde&Schwarz (�005) No.185�� pp 18–�1
– Measurement Uncertainties in RF Level Measurements Using the Measuring Receiver R&S®FSMR. Application Note 1MA9� from Rohde&Schwarz
At first glance�� the new power sensor modules do not seem to include any striking features: They contain a power splitter that routes part of the DUT output power to the measuring receiver�� and a thermal power sensor that measures the DUT power (FIG �). A common setup used before�� of identical or slightly varied design. Accepting this solution�� however�� means putting up with a loss in accuracy.
The core of the problem is inadequate isolation between the outputs of the power splitter. As a result�� the power sensor will be affected by any mismatch of the other output�� as well as any variation of such mismatch. Even slightly bending the connection cable or switch-ing the attenuator of the measuring receiver�� let alone replacing the measuring receiver�� will immediately increase measurement uncer-tainty. Calibrating the setup would necessitate calibration points every 10 MHz – assuming spline interpolation between the calibra-tion points.
In its Power Sensor Modules R&S®NRP-Z�7 and -Z37�� Rohde&Schwarz combines several measures to ensure that the modules offer unequaled measuring convenience while still featur-ing extremely high accuracy. A 6 dB attenuator integrated into the power splitter increases isolation by 1� dB. This reduces the uncer-tainty of the power display caused by the aforementioned effects by a factor of four. The level reduction involved in this method is fully compensated for by the unparalleled sensitivity of the R&S®FSMR.
The nominal isolation of �4 dB achieved in this way is still insuf-ficient; numeric compensation measures are therefore used to increase it further. This requires full characterization of the power splitter at a spacing of 1�.5 MHz�� knowledge of the complex reflec-tion coefficient of the R&S®FSMR�� and use of a phase-stable con-nection cable. A set of calibration data for the power splitter is cre-
Condensed data of the R&S®NRP-Z�7Frequency range DC to 18 GHzLevel range –�4 dBm to +�6 dBmConnector N male
Condensed data of the R&S®NRP-Z37Frequency range DC to �6.5 GHzLevel range –�4 dBm to +�6 dBmConnector 3.5 mm�� male
ated once during production and then used as an integral part of the power sensor. The specific reflection coefficients of each Measuring Receiver R&S®FSMR are likewise determined during production and can be updated if required. Compensation is performed by the intel-ligent power sensor itself: It corrects the effects of mismatch using the stored calibration data of the power splitter and the R&S®FSMR reflection coefficient. The measuring receiver communicates the reflection coefficient to the power sensor via USB�� and also keeps the attenuator fixed at 10 dB during the power measurement. An armored�� phase-stable microwave cable from the leading manufac-turer is used as a connection cable. It is robust and reliable�� and will even withstand your accidentally stepping on it.
The result yielded by the combination of these measures is impres-sive in every respect (FIG 3). Moreover�� the characterization of the power splitter has a positive side effect: The frequency spacing for the calibration of the power sensor as a whole could be increased to 100 MHz. This ensures cost-efficient recalibration�� even when cus-tomer-specific power calibration systems are used.
Thomas Reichel
Accuracy is what counts: What distinguishes the power sensor modules for the Measuring Receiver R&S®FSMR
FIG 3 Result of a comparison measurement between a Power Sensor Module R&S®NRP-Z37 and an R&S®NRV-Z55 terminating power sen-sor, where the latter is used as a reference. The R&S®NRV-Z55 is directly traceable to a primary standard of the PTB, Germany‘s national metrol-ogy institute, i.e. it was calibrated there. The Power Sensor Module R&S®NRP-Z37 is also traceable to primary standards of the PTB. How-ever, different standards were used in this case, and three calibration hierarchies introduced in between. The small differences obtained in the two measurements demonstrate the high quality of the Power Sensor Module R&S®NRP-Z37 and the calibration chain involved..
Frequency in GHz
0.15
0.1
0.05
0
–0.05
–0.1
–0.15
0 2 4 6 8 10 12 14 16 18 20 22 24 26Diffe
renc
e in
dis
play
ed p
ower
in d
B
Measurement uncertaintyas specified in data sheet
FIG 2 Block diagram of the Power Sensor Modules R&S®NRP-Z27 and -Z37.
(SENSOR)Inputto the R&S®FSMR
(RF INPUT)Thermo-electricpower sensor
Power splitter and attenuator
USBA
6 dB
News from Rohde&Schwarz Number 190 (�006/ II)

36
LXI – the new LAN standard for networking T&M equipment
The LXI standard is based on Ethernet,
the widely used communications stan-
dard for LANs. This is just one of the
reasons why LXI is widely supported
by leading manufacturers of T&M
equipment.
LXI – the successor of GPIB
The LAN eXtensions for Instrumentation (LXI) standard for controlling T&M equip-ment and test systems combines the advantages of rack&stack instruments�� offering GPIB interfaces and powerful firmware functions�� with the benefits of modular�� compact VXI/PXI systems (see box on next page). LXI�� which is based on the Ethernet standard�� defines a uni-form�� interoperable LAN implementation�� allowing T&M instruments to be easily integrated into modular test systems. As the LAN standard is backward compat-ible with previous versions�� it protects existing investments.
Ethernet has a long tradition: At about the same time that the GPIB interface was introduced�� Ethernet was devel-oped and also standardized (IEEE 80�.3). Unlike the GPIB interface�� whose trans-fer rate is limited due to technological reasons�� Ethernet technology could be
continuously accelerated. Initially pro-viding a meager 3 Mbit/s�� 100BaseT and Gigabit LANs are now state of the art – with further enhancements in the pipe-line.
The spreading use of the Internet further advanced Ethernet; today�� every PC is equipped with a LAN interface as stan-dard. Moreover�� the new wireless tech-nologies enhance the LAN capabilities by additional applications.
These are ample reasons for leading manufacturers of T&M equipment to support the new LXI standard. Web serv-ers are integrated in LXI devices�� allow-ing interface and instrument settings to be made simply via a web browser. The programming interfaces for the test soft-ware are IVI-C or IVI-COM drivers (IVI stands for interchangeable virtual instru-mentation). In addition�� the precision timing protocol (PTP) of the IEEE 1588 standard for synchronizing clocks in
FIG 2 The functionality of the three classes of LXI instruments.
Class ALXI hardware trigger bus
Class C• Ethernet LAN interface• Web server for interface• VXI-11 protocol• IVI instrument driver
Class BIEEE 1588 synchronizationRouter or
switch
Router or switch
Instrument with LXI interface
Instrument with LXI interface
Instrument with LXI interface
Instrument with LXI interface
Instrument with LXI interface
LXI/GPIBadapter
LXI/PXIadapter
LXI/VXIadapter
GPIBPXI VXI
FIG 1 Hybrid LXI test system incorporating instruments with interfaces complying with VXI/PXI and GPIB (RS-232-C).
News from Rohde&Schwarz Number 190 (�006/ II)
GENERAL PURPOSE Technology

37
LAN nodes as well as an eight-chan-nel hardware trigger interface are ear-marked for LXI to further expand trigger and synchronization functions. Another future capability is the configuration of hybrid test systems�� which will integrate VXI/PXI systems and conventional GPIB instruments via LXI adapters (FIG 1).
Three classes of LXI instruments
LXI-compliant instruments or modules are divided into three classes�� A�� B and C�� with the functionality of the classes hierarchically based one upon the other (FIG �). All instruments of these three classes can be integrated in a test sys-tem and combined with each other according to the requirements and appli-cation at hand.
Class CLXI instruments complying with class C are characterized by a common LAN implementation. This includes the capa-bility of automatically detecting LXI instruments in a LAN via the Discov-ery protocol in accordance with VXI-11. Other definitions and functions such as LAN configuration initialize (LCI) – which resets the LAN configuration – make it easy to integrate these LXI instruments
FIG 3 The evolution of GPIB, VXI and PXI compared with the Ethernet LAN technology.
ARPAnet3 Mbit/s
1995 200419851969
Ethernet10 Mbit/s
1980 1990
IEEE 802.3standard
Ethernet100 Mbit/s
GigabitEthernet
2000
10 Gigabit Ethernet
1980 1990 2000 20041997199419911981 1984
19851989
19821970 19771972
TRS80
IBMPC
PCIExpress
Rapid IOPCI-XPCI
World WideWebWindows
ISA EISAcPCIMCAVME
GPIB VXI PXI
LXI
GPIB – reliable for 30 years
The GPIB interface has been the standard for controlling T&M equipment in automatic test systems for more than 30 years. It has proved to be a reliable and flexible tool in a wide variety of implementations and systems. The GPIB interface was steadily improved during this time to make the integration of test systems faster and less expensive: The standard was enhanced by standardizing the programming commands (SCPI). Moreover�� based on this standardization�� a uniform driver architecture was implemented and the APIs for the instrument classes (IVI driv-ers) defined.
Today�� the GPIB interface is increasingly faced with its limitations – first�� it was never able to establish itself as a standard PC interface (and must therefore be retrofitted); second�� the transfer rate�� being limited to maximally 1 Mbyte/s for technological reasons�� is very narrow.
Widely used: VXI and PXI
Parallel to the conventional rack&stack instruments with GPIB interface�� compact systems based on card bus technology were developed�� particularly for military and aerospace test sys-tems (VME and PCI bus). This solution was continuously enhanced and established itself as standard (VXI and subsequently PXI). These modular T&M instruments and systems with plug-in cards are used in a wide range of test applications that require high data throughput and compact dimensions. However�� a drawback of the VXI and PXI systems is the module chassis required for accommodating the plug-in cards as well as the slot 0 controller for controlling the modules.
FIG 3 shows the development of the different systems and standards over the years.
in a LAN-based test system. Owing to a uniform interface�� the instruments can be configured via a web browser.
Class C instruments are programmed by means of IVI drivers (APIs)�� which were standardized by the IVI Foundation. The
architecture of these drivers and their interoperability are important prerequi-sites for system integration.
Class BClass B compliant instruments are addi-tionally equipped with synchronization
News from Rohde&Schwarz Number 190 (�006/ II)

38
mechanisms defined in the IEEE 1588 standard. Thus�� high-precision time syn-chronization of better than 10 ns can be achieved in a 100BaseT LAN. This tech-nique largely avoids the latency times typical of LAN and ensures precise tim-ing�� which is indispensable in T&M applications.
Class B is based on common timer events tied to absolute times�� which consequently allow very precise syn-chronization of test system sequences. Data that is to be transferred via LAN can be marked with the exact detec-tion time by means of time stamps. Thus�� the recorded data can also be corre-lated from different sources in distrib-uted systems. Especially the capability to exactly trigger and synchronize widely distributed systems via the precision tim-ing protocol of the IEEE 1588 standard opens up completely new applications.
Class A
In addition to the functions of the other two instrument classes�� LXI instruments in accordance with class A are equipped with an eight-channel hardware trigger interface (LVDS interface)�� whose type
of connector�� pin assignment and elec-trical characteristics are defined in the LXI standard. Via this interface�� instru-ments can be connected either in a daisy chain or star configuration (FIG 4). Trig-ger cable lengths of up to �0 m are thus feasible. The trigger channels can be configured individually as input or out-put channels; plus�� they offer a wired-or function.
Instruments of classes A and B can gen-erate and receive software triggers via LAN messages (UDP and TCP/IP mes-sages) – as currently done in test sys-tems as well. Thus�� LXI instruments can communicate with each other without involving the controller (peer to peer). The different trigger and synchronization capabilities in LXI can be configured via the controller by means of an enhanced IVI interface (LXI Sync).
The world’s first LXI-validated spectrum analyzers
The LXI Consortium has already con-firmed the compliance of the first instruments with the standard: In Feb-ruary �006�� the R&S®FSL�� R&S®FSP�� R&S®FSU and R&S®FSQ families from Rohde&Schwarz were the world‘s first spectrum analyzers to be officially certi-fied as compliant with LXI class C. They may now carry the LXI logo.
As a strategic member of the LXI Con-sortium�� Rohde&Schwarz promotes the development of the standard: In April �006�� the first Plug Fest outside the USA was held at the company‘s headquar-ters in Munich – with more than 65 rep-resentatives from instrument manu-facturers�� system integrators�� custom-ers and the press participating. During this meeting�� the R&S®SMU�00A and R&S®SMATE�00A vector signal genera-tors were also tested and certified to be LXI-compliant.
Jochen Wolle
The LXI Consortium
The LXI Consortium was founded in September �004 with the objective to define an open�� LAN-based standard for test systems. Today�� the LXI Con-sortium has more than 40 members�� including the most renowned manufac-turers of T&M equipment�� numerous system integrators and end customers. Rohde&Schwarz has been a strategic member since November �004 and is represented�� together with eight other companies�� on the Consortium‘s Board of Directors (www.lxistandard.org).
FIG 4 Class A instruments are equipped with an LXI hardware trigger interface and can be connected in a daisy chain or star configuration.
Hub
Trigger bus terminations Trigger bus terminations
Star configuration Daisy chain
News from Rohde&Schwarz Number 190 (�006/ II)
GENERAL PURPOSE Technology

39
EMI Test Receiver R&S®ESU
Maximum precision at unparalleled measurement speed
The EMI Test Receivers R&S®ESIB are
the number one choice for EMC emis-
sion measurements in accordance
with civil and military standards. Now,
they are being succeeded by the new
EMI Test Receivers R&S®ESU (FIG 1),
which focus on maximum productivity
and increased measurement accuracy.
Overview of new features
The new receivers feature an unrivaled measurement speed: A test method based on fast Fourier transformation (FFT) allows overview measurements to be performed much faster�� signifi-cantly reducing the costs per measure-ment. Further highlights include realtime IF analysis and extensive report func-tions. The CISPR16-1-1 compliant receiv-ers have been designed to meet civil and military EMC standards for all emis-sion measurements. They also perform all spectrum analysis functions and are available for the frequency ranges �0 Hz to 8 GHz�� �6.5 GHz or 40 GHz.
Extremely quick in the time-domain scan
Measurements performed in EMC labs are often time-consuming�� espe-cially when unknown DUTs are involved. Although methods such as the preview measurement with the max peak detec-tor and the final measurement with the quasi-peak detector on selected fre-quencies significantly reduce the total measurement time�� preview measure-ments alone�� as they need to be car-ried out during emission measurements between 30 MHz and 1000 MHz�� still often take several hours. The reason: To detect pulse-like interference reliably��
FIG 1 The new EMI Test Receivers R&S®ESU not only outdo their predecessors in terms of measurement speed but also feature higher dynamic range, lower inherent noise and lower
measurement uncertainty.
44499/5
News from Rohde&Schwarz Number 190 (�006/ II)
EMC/FIELD STRENGTH Test receivers

40
the observation time per frequency point must be at least as large as the recip-rocal of the pulse rate. And this takes time. Analyzing the above-mentioned fre-quency range with a resolution band-width of 9 kHz�� for example�� produces a total of �4�500 measurement values at a step size of 4 kHz. At 10 ms per measure-ment value�� this results in a total mea-surement time of 45 minutes for just one preview measurement.
How can measurement times be reduced? Performing measurements in the time domain as a possible method has long been under discussion [1]. The R&S®ESU is the first EMI test receiver to provide a rapid�� FFT-based time-domain scan for overview measurements (FIG �). In this mode�� the instrument samples successive ranges of the frequency spec-trum at the IF�� i.e. after preselection�� not with only 9 kHz as in the above example�� but with a width of up to 7 MHz. It cal-culates each subspectrum in one go with the desired resolution using FFT. Lined up next to each other�� these subspectra yield the picture normally provided by a classic receiver.
The gain in speed is astounding – at the same measurement accuracy and sen-sitivity�� it takes the R&S®ESU less than �0 seconds instead of the aforemen-tioned 45 minutes to perform measure-ments – which is 150 times faster! The algorithms used can correctly measure and analyze all signal shapes�� from CW signals to standard pulses.
On individual critical frequencies�� this quick preview measurement�� which is performed with the peak�� average or RMS detectors�� is followed by a final measurement using standard-compli-ant detectors such as quasi-peak�� CISPR-AV and CISPR-RMS for evaluating inter-ference.
Manual measurements made easy
Manual measurements continue to be an effective means of identifying sources of electromagnetic interference. For this purpose�� the R&S®ESU features a large�� easy-to-read LC TFT display on which users can see all important infor-mation at a glance. The measured values for the different detectors are displayed not only numerically but also in analog bargraphs (FIG 3). The effect of changes on the DUT can thus be seen immedi-ately. If you change the frequency on the receiver�� the bargraph will follow the signal without interruption�� exactly as you would expect from a classic test receiver�� thus facilitating the search for the highest signal level. In addition�� the highest level value and the associated frequency are registered and displayed.
Audio demodulators for AM and FM make it possible to identify signals – for example�� if ambient interferers are to be detected during open-area tests.
The realtime IF analysis (FIG 4) is the best means of frequency tuning. It is displayed parallel to the bargraph mea-surement in the lower part of the screen and gives you an impression of the sig-nal spectrum around the set frequency. With a large IF bandwidth�� the realtime IF analysis displays the spectral distribu-tion of a modulated signal in the mea-surement channel in addition to a quick overview of the spectrum occupancy outside the actual measurement chan-nel. Interference of a received useful sig-nal can also be detected quickly – no matter whether this involves CW inter-ferers appearing as unmodulated carri-ers or pulse-like interference displayed as narrow lines on the screen.
The test receiver always displays the cur-rent�� the averaged or the maximum and minimum measurement value of consec-utive test sequences. With modulated signals�� the spectrum is gradually filled in the MAX Hold display until all exist-ing spectral maxima have been achieved (FIG 5). Pulse-like signals also fill the MAX Hold display until the spectrum is completely displayed. In contrast�� pulse-like signals are suppressed by the MIN Hold display�� while sinewave signals are shown unchanged. The combination of the MAX Hold and MIN Hold displays allows you to easily identify�� for exam-ple�� CW interferers with very low levels within a TV signal.
Planned standards can already be tested
Advanced radio services such as mobile radio or current sound and TV broadcast-ing systems use digital methods for pro-cessing and transmitting messages. For analyzing effect of pulse-like interfer-ence on radio systems�� the quasi-peak detector�� which was described already 60 years ago with the emergence of sound broadcasting�� is still used [�]. However�� numerous tests have shown that this detector is not suitable for these radio services [3].
The search for a better weighting char-acteristic revealed that the combination of an RMS detector and a linear average detector including an instrument time constant is the ideal compromise [4]. This CISPR-RMS detector has been pro-posed for standardization (for details on the new detector�� see page 46).
This detector is already implemented in the R&S®ESU models as standard to allow developers and EMC testers to perform electromagnetic interfer-ence measurements (FIG 6). Like the CISPR-RMS detector�� all other detec-
News from Rohde&Schwarz Number 190 (�006/ II)
EMC/FIELD STRENGTH Test receivers

41
Receiverpreselectionand mixer
BroadbandIF filter
20.4 MHz
A/Dconverter
AD
Mainprocessor
RAM
FIG 2 Processing stages in the time-domain scan. After pre-selection and mixer, the IF is band-limited and digitally con-verted. All values are saved in the RAM. The main processor calculates the subspectra by means of FFT.
Wei
ghtin
g fa
ctor
in d
B70
60
50
40
30
20
10
0
fP in Hz
105104103102101 106
AverageRMS-AVQuasi-PeakPeak
cutoff frequency
20 dB / decade
20 dB / decade
FIG 6 The suggested weighting characteristics of the CISPR-RMS (RMS-AV) detector (blue) in comparison to the current peak, quasi-peak and average detectors for the CISPR C/D frequency band (30 MHz to 1000 MHz).
FIG 5 The IF analysis provides a convenient way of tuning the receiver to the exact signal frequency, of identifying signals and assessing their bandwidth.
FIG 3 The CISPR detectors with MAX Hold display.
FIG 4 Screen display in the IF analysis mode. Upper part of screen: Numeric display of receiver frequency and level for max. three different detec-tors with parallel and quasi-analog bargraph (RBW = 120 kHz; measurement time 100 ms). Lower part of screen: Spectrum around the receiver frequency and marker peak measurement (RBW = 10 kHz; span 500 kHz). An interfering signal can thus be analyzed in up to three different ways simultaneously: Measured by means of standard-compliant detectors, acoustically with the audio demodulator and visually by means of IF analysis.
News from Rohde&Schwarz Number 190 (�006/ II)

4�
tors such as peak�� average�� quasi-peak�� CISPR-AV and RMS have also been implemented digitally. This ensures an absolutely stable and reproducible eval-uation of the test results in the long run.
Documentation at the press of a button
Documentation of EMC measurement results must be conclusive�� complete and also easy and quick to compile. This is no problem for the powerful R&S®ESU report generator�� which provides a tool that allows you to generate com-plete test reports at the press of a but-ton without using any external software (FIGs 7 and 8).
For output to a file�� the most common formats are available:
PDF as standard for documentationRTF (rich text format) for further pro-cessing and providing additional infor-mation in word processing programs HTML for convenient viewing with a web browser
The file including the test report is saved on the built-in hard disk or on a mem-ory stick. Alternatively�� you can also save the file on a network server via the Ethernet interface.
◆
◆
◆
More than just EMC applications
The R&S®ESU also offers the tried-and-tested and effective one-box concept that combines an EMI test receiver and a full-featured spectrum analyzer – in this case�� the high-end Spectrum Ana-lyzer R&S®FSU [5]. The test receiver thus provides a range of functions that also meet the demands of development labs to a high degree�� which helps to reduce costs even further.
In addition to the spectrum analyz-er‘s standard functions�� a variety of automatic measurement functions are included:
Power measurement in the frequency and time domain (channel /adjacent channel)Amplitude probability distribution (APD)1) signal statisticsComplementary cumulative distribu-tion function (CCDF)Noise and phase noise measurementsThird-order intercept (TOI) measure-ment
Flexibility combined with the broad range of applications of a high-quality spectrum analyzer including the specific characteristics of an EMI test receiver make the R&S®ESU ideal not only for certification measurements in accor-dance with the relevant EMC standards but also for all general measurement applications in the lab�� for example�� dur-ing the development phase of a product as well as for measuring radio parame-ters in EMC labs.
◆
◆
◆
◆
◆
Summary – a real champion
As a market leader for EMC test and measurement�� Rohde&Schwarz has demonstrated expertise in the field of EMI test receivers for years. The existing high-end EMI Test Receivers R&S®ESIB have already stood their test and are internationally acknowledged refer-ence instruments. The new R&S®ESU test receivers not only outdo their prede-cessors in terms of measurement speed but also feature a higher dynamic range�� lower inherent noise and lower mea-surement uncertainty – although they are much more compact and weigh sig-nificantly less. The R&S®ESU helps to increase customer benefit by performing faster�� more accurate measurements.
Additional functions such as the time domain analysis for analyzing interfer-ence versus time�� starting a complete measurement with preview measure-ment�� data reduction and final measure-ment at the press of a button as well as the integrated report generator allow complex tests to be performed eas-ily and conveniently – ensuring a quick return on investment.
Matthias Keller; Karl-Heinz Weidner
1) This is not the measurement function defined in the CISPR 16-1-1 standard�� which�� however�� is planned for the R&S®ESU.
News from Rohde&Schwarz Number 190 (�006/ II)
EMC/FIELD STRENGTH Test receivers

43
FIG 7 Editable templates for designing reports. A separate logo is also out-put with the header. Different report templates can be configured and saved.
FIG 8 The report can be checked by means of the preview function. Different zoom stages can adapt the report size to the screen. Several measurements can be combined in a single report.
Condensed data of the R&S®ESUFrequency range �0 Hz to 8 GHz / �6.5 GHz / 40 GHz�� depending on the modelFrequency accuracy aging 1 × 10 –7/year�� optional � × 10 –8/yearSpectral purity <–1�0 dBc(1 Hz)�� typ. –1�3 dBc(1 Hz) at 10 kHzAmplitude measurement uncertainty <0.6 dB (f ≤ 3.6 GHz) <�.0 dB (3.6 GHz ≤ f ≤ 8 GHz) <3.0 dB (8 GHz ≤ f ≤ 40 GHz)1 dB compression point >+13 dBm nominal (≤3.6 GHz; without preselection)RF attenuation 0 dB to 75 dB in 5 dB stepsPulse immunity (10 µs; input �) 450 V / �0 mWsFrequency sweep In receiver mode scan table with max. 10 subranges and various settings�� optionally for time-domain scan (FFT) and frequency scan In analyzer mode span >10 Hz: �.5 ms to 16000 s zero span (0 Hz): 1 µs to 16000 sDetectors max. / min. peak�� RMS�� average�� quasi-peak�� CISPR-AV�� CISPR-RMSBandwidths 3 dB 10 Hz to 10 MHz in steps of 1/�/3/5 6 dBm (EMI) 10 Hz�� 100 Hz�� �00 Hz�� 1 kHz�� 9 kHz�� 10 kHz�� 100 kHz�� 1�0 kHz�� 1 MHzNoise display (receiver mode; average detector�� preamplifier on; 0 dB RF attenuation) 100 kHz (BW = �00 Hz) <–10 dBµV 10 MHz (BW = 9 kHz) <–18 dBµV 30 MHz (BW = 1�0 kHz) <–7 dBµV 1 GHz (BW = 1 MHz) <4 dBµV (R&S®ESU8) 3 GHz (BW = 1 MHz) <6 dBµV (R&S®ESU8)
More information and data sheet at www.rohde-schwarz.com
(search term: ESU)
REFERENCES[1] Keller�� C.�� Feser�� K.: A New Method of
Emission Measurement. In �00� IEEE International Symposium on EMC Digest�� August 19 to �3�� �00��� Minneapolis�� USA�� pp 599–604
[�] Heirman�� D.�� Stecher�� M.: A History of the Evolution of EMC Regulatory Bodies and Standards in Proc. EMC �005 Zürich
[3] Stecher�� M.: Weighting of Interfer-ence According to its Effect on Digital Communication Services�� Proc. IEEE EMC Symposium 98�� Denver�� USA
[4] CISPR 16-3 Amd. � f1 Ed. �.0: Background material on the definition of the RMS/Average weighting detector for measuring receivers
[5] Spectrum Analyzer R&S®FSU: Best RF performance – third generation of high-end analyzers. News from Rohde&Schwarz (�001) No. 171�� pp �0–�5
News from Rohde&Schwarz Number 190 (�006/ II)

44
Spectrum Analyzer R&S®FSU
Scope of functions expanded for EMI precompliance measurements
You can now use the R&S®FSU family
of spectrum analyzers (FIG 1) also
for EMI precompliance measurement
tasks: It offers EMI bandwidths, state-
of-the-art EMI detectors, increased
sweep resolution and logarithmic
frequency axes.
FIG 1 The Spectrum Analyzer R&S®FSU now also performs reproducible, reliable and fast EMI precompliance measurements.
Reducing development time
State-of-the-art products feature impres-sive innovative characteristics yet are developed and ready for market within a very short time. And on top of that�� extensive measurements are required to ensure their electromagnetic compatibil-ity. It is thus quite natural to want to use spectrum analyzers applied in the labo-ratory for EMI tasks as well.
The R&S®FSU high-end spectrum ana-lyzers [1] are just one example: Owing to their high measurement speed�� accu-racy and high dynamic range�� they are indispensable in development and pro-duction. Since their scope of functions
now includes EMI bandwidths�� state-of-the-art detectors�� increased sweep res-olution and logarithmic frequency axes�� they can be used for EMI tasks – and thus save valuable development time.
Innovations in detail
All the analyzers of the R&S®FSU family running on Windows XP and firmware version 3.91 or later include these new features. Five models with different fre-quency ranges (FIG �) are thus avai-lable for performing EMI precompliance measurements between �0 Hz and 50 GHz.
448��
News from Rohde&Schwarz Number 190 (�006/ II)
EMC/FIELD STRENGTH Spectrum analyzers

45
R&S®FSU 46
R&S®FSU 26External mixer110 GHz
R&S®FSU 8
8 GHz 26.5 GHz3.6 GHz20 Hz 50 GHz46 GHz
R&S®FSU 50
R&S®FSU 3
FIG 2 The R&S®FSU family of high-end spectrum analyzers with five models between 20 Hz
and 50 GHz is highly valued in development and production owing to its excellent RF
characteristics.
CISPR bandwidths (6 dB) for correct pulse weightingIf you want to perform EMC measure-ments during development�� e.g. local-izing interference sources by probes or near-field probes�� you often get by with a qualitative assessment of average accuracy. If the RFI voltage�� RFI power and RFI field strength have to be mea-sured on an EUT together with test set-ups and coupling devices�� however�� and if results have to be compared with emission limits�� you definitely need pre-cise�� reproducible�� quantitative weight-ing. For predefined CISPR bandwidths�� this is done using quasi-peak or average detectors appropriate for the frequency bands. For bands A to D�� measurement bandwidths are specified as 6 dB band-widths and as impulse bandwidth for band E:CISPR band A (9 kHz to 150 kHz): Bres = �00 HzCISPR band B (150 kHz to 30 MHz): Bres = 9 kHzCISPR band C (30 MHz to 300 MHz): Bres = 1�0 kHzCISPR band D (300 MHz to 1 GHz): Bres = 1�0 kHzCISPR band E (1 GHz to 18 GHz): Bres = 1 MHz
Most of the spectrum analyzers use fil-ters with several stages and define 3 dB bandwidths. Filters to be used for EMC tasks in interference measurements must adhere to the 6 dB bandwidth�� however. The R&S®FSU thus includes the FILTER TYPE function�� which offers a wide variety of options: resolution bandwidths from 10 Hz to 50 MHz (3 dB bandwidth)�� FFT filters�� channel filters�� RRC filters and also CISPR filters with 6 dB bandwidth from �00 Hz to 1 MHz for commercial EMC standards (e.g. EN standards).
New EMI measurement detector CISPR-AV (CAV)To compare the amplitudes of noise signal spectra with emission limits laid down in product family standards (EN 55011 to EN 550�5)�� CISPR mea-surement bandwidths and measurement detectors must be used. Since detectors with CISPR time constants are slower – which is due to the stipulated transient response – they are not suitable for fast preview measurements.
To perform fast preview measurements�� select a short measurement time and use peak and average detectors to determine high interference levels and their frequencies. The R&S®FSU offers a fast sweep and simultaneously displays up to three curves of different detectors (e.g. Pk+ and AV).
Critical frequencies with high signal lev-els that exceed or are close to the limit�� on the other hand�� are best determined by final tests�� which make use of detec-tors with CISPR time constants. The measurement time required for the final test is approx. one second so that single pulses or low pulse repetition frequen-cies can be weighted correctly. So far�� these measurements have been made with the quasi-peak detector for broad-band interference and with the average detector for narrowband interferers. The latest version of the basic CISPR 16-1-1 (�006-03) standard also assigns time constants to the linear average detector. Rohde&Schwarz calls this linear aver-age detector CISPR average detector (CAV) – to distinguish it from the linear average detector (Average)�� which does not take time constants into account. In contrast to simple average weight-ing�� the level increases at low pulse rep-etition frequencies when corrected by instrument time constants (depend-ing on the CISPR band). A signal with fP = 1 Hz will then be weighted 7.4 dB higher in the CISPR band A / B. In CISPR bands C / D / E�� the increase will be 11.3 dB (FIG 3). The latest version of the CISPR 16-1-1 standard thus includes more stringent weighting. The CISPR-AV detector will – after a transition period and by referencing to CISPR 16-1-1 (�005) – also be included in the product family standard.
Innovations at a glance:
6 dB bandwidths or bandwidths in line with CISPR 16-1-1 �00 Hz�� 9 kHz�� 1�0 kHz�� 1 MHzEMI measurement detectors Pk�� QP�� RMS�� AV as well as CISPR-AV and CISPR-RMSResolution during sweep 30001 test points�� logarithmic frequency axis
◆
◆
◆
News from Rohde&Schwarz Number 190 (�006/ II)

46
New EMI measurement detector CISPR-RMS (CRMS)Technology has undergone signifi-cant changes since the QP detector for weighting the interference of AM sig-nals up to 30 MHz was launched more than 60 years ago. Today�� mobile radio networks�� digital broadcasting and TV as well as multimedia equipment are state-of-the-art technology. They all use digitally modulated signals. So far�� we have lived without a reliable�� stan-dardized circuit for weighting such sig-nals and their noise spectra. The Pk�� QP and AV detectors used up to now indi-cate an over- or underweighting of pulse interference which�� depending on the relevant mobile radio standard�� may lead to different disturbing effects. To improve the reproducibility of measure-ments�� measurement sequences have been used and comparisons have been made for quite some time with a circuit for weighting such signals. This circuit is based on a combination of RMS detec-tor followed by an average detector cir-cuit (including the instrument time con-stant). The results were discussed at var-ious symposia throughout the world and finally taken into account in the form of corresponding correction curves in the CISPR-RMS detector (CRMS) (FIG 4). The new detector for weighting disturbance for its effects on digitally modulated sig-nals has been included in a Committee Draft for Vote (CDV) and submitted to national committees.
In addition to all common EMI measure-ment detectors such as Pk�� QP�� RMS�� AV�� the R&S®FSU family of spectrum analyz-ers now also includes the new CISPR-AV and CISPR-RMS detectors
FIG 3 In contrast to the
linear average detector, the CISPR
average detec-tor (CAV) includes
an instrument time constant with a
subsequent Max Hold function. Low pulse repetition fre-quency weighting is thus higher, i.e. weighting is more
stringent.
0
–20
–40
–6010 100 1000
Pulse width in ms
Rel.
leve
l in
dB
0
–20
–40
–6010 100 1000
Pulse width in ms
Rel.
leve
l in
dB
11.3 dB
7.4 dB
AV
CISPR-AV
AV
CISPR-AV
Pk
Pk
fP = 1 Hz
Band A/B:T
meter = 160 ms
fP = 1 Hz
Band C/D/E:T
meter = 100 ms
Wei
ghtin
g fa
ctor
in d
B
80
70
60
50
40
30
20
10
0
fP in Hz
100000100001000100101 1000000
RMS AV band ERMS AV band C/DRMS AV band BRMS AV band A
FIG 4 The CISPR-RMS detector (CRMS) is a standard pro-posal for weight-
ing pulse-shaped signals. The cor-
rection curves for weighting differ-
ent pulse frequen-cies differ depend-
ing on CISPR band A to E.
EMI limit lines, transducer tablesTo perform EMI precompliance measure-ments�� the R&S®FSU spectrum analyz-ers offer limit lines for product standards. These limit lines can be activated quite easily�� and potential out-of-limit condi-tions can already be displayed during the measurement (LIMIT CHECK). Other limits�� e.g. for in-house standards of the automotive industry�� can be quickly
inserted as limit line points into a new table for limit lines which are stored under an individual file name on the hard disk. The table can be selected and activated in the default menu.
If additional attenuator pads and pulse limiters are used or if cable attenua-tion�� the frequency response of an exter-nal preamplifier or antenna factors have
News from Rohde&Schwarz Number 190 (�006/ II)
EMC/FIELD STRENGTH Spectrum analyzers

47
to be taken into account�� correction val-ues are entered in transducer tables. Depending on their application and acti-vation�� the analyzer considers these cor-rection values when calculating the cur-rent results – without affecting the mea-surement speed. This increases the mea-surement accuracy and the reproducibil-ity of measurement results.
80
70
60
50
40
30
20
10
0
-10
Ref 87 dB V/m *Att 10 dB
*RBW 9 kHz VBW 100 kHz SWT 1.85 s
TDF
A
Span 29.85 MHz
LIMIT CHECK PASS
1 MHz 10 MHz
Center 2.121320344 MHz
1 PK*CLRWR
2 AV*CLRWR
EN55022Q
EN55022A
FIG 5 Measurement of conducted EMI in the 150 kHz to 30 MHz range. The R&S®FSU displays limit lines with the LIMIT CHECK func-tion, logarithmic scaling with 8001 test points and the use of 9 kHz (6 dB) bandwidth.
100
90
80
70
60
50
40
30
20
10
Ref 107 dB V/m *Att 0 dB
*RBW 120 kHz VBW 1 MHz SWT 340 ms
TDF
A
Span 970 MHz
100 MHz
Center 173.2050808 MHz
1 PK*CLRWR
2 AV*CLRWR
FIG 6 Measurement of radiated EMI in the 30 MHz to 1000 MHz range. The R&S®FSU dis-plays logarithmic scaling with 8001 test points, 120 kHz (6 dB) resolution bandwidth and the use of a transducer TDF (antenna cor-rection table).
More information and data sheet at www.rohde-schwarz.com
(search term: FSU)
REFERENCES[1] Spectrum Analyzer R&S®FSU – Best
RF performance – third generation of high-end analyzers. News from Rohde&Schwarz (�001) No. 171�� pp �0–�5
– CISPR16: �003-11: Specification for radio disturbance and immunity measuring apparatus and methods.
Sweep with up to 30001 test pointsThe number of test points defined prior to the sweep was increased. The ana-lyzer permits up to 30001 test points per trace – standard T&M equipment only offers 501 or 6�5 test points. The high resolution of the R&S®FSU makes it eas-ier for you to pinpoint critical interfering frequencies that are required for final tests.
EMC measurement results are usually displayed with logarithmic scaling ver-sus frequency. With the SWEEP LOG function�� the R&S®FSU displays the test points on a logarithmically scaled frequency axis and thus facilitates the direct comparison with graphics obtained�� for example�� with full compli-ance test receivers (FIGs 5 and 6).
Summary
The R&S®FSU can now also perform reproducible�� reliable and fast EMC pre-compliance measurements due to its new EMC functions such as CISPR band-widths�� state-of-the-art CISPR detectors�� limit lines�� consideration of correction value tables and logarithmic sweep dis-play with up to 30001 test points. These functions and the powerful hardware of the spectrum analyzer are not only very useful when performing measurements during development and EMC precom-pliance measurements but also help to solve difficult EMI measurement prob-lems in the preliminary product develop-ment stages.
Volker Janssen
News from Rohde&Schwarz Number 190 (�006/ II)

48
VHF FM broadcast transmitters for foreign missions of the German Armed Forces
The German Armed Forces ordered ten
mobile VHF FM broadcast transmitter
systems from R&S Systems GmbH for
international missions of the Psycho-
logical Operations branch (PSYOPS).
Establishing and improving con-tacts using sound broadcasting
On their international missions�� the Psy-chological Operations branch (PSYOPS) of the German Armed Forces is called upon to establish and improve contacts
with the local population in the corre-sponding language by applying a broad scope of information media and broad-cast programs. Signal processing and the transmission of sound broadcasting programs is performed by mobile VHF FM broadcast transmitter systems (FIG 1).
FIG 1 Mobile VHF FM broadcast transmitter system with setting-up unit (left), transmit antenna on the 25 m mobile antenna mast (center) and shelter (right).
News from Rohde&Schwarz Number 190 (�006/ II)
BROADCASTING Reference

49
Wanted: know-how in system integration
In April �005�� R&S Systems GmbH obtained the order to add another ten VHF FM broadcast transmitter sys-tems to the already existing ones of the German Armed Forces. A major advan-tage of the company was its many years of experience and comprehensive know-how in integrating systems for mobile applications of both military and civil customers. It was thus able to face the great challenge and tackle the difficult problem of producing systems of exactly the same design as those already exist-ing. Production documentation was practically nonexistent and systems were unavailable as a sample�� since they were in continuous use.
Owing to the close and fruitful cooper-ation between the contractor�� the sup-pliers and R&S Systems GmbH�� the project could be implemented within the specified time. At the end of �005 R&S Systems GmbH supplied ten new systems to the German Armed Forces.
Systems at a glance
The transmitter system is integrated into a shelter together with the resil-ience audio supply system (FIG �). From a sound broadcasting studio accommo-dated in a separate shelter�� the radio program is fed to the transmitter either via a direct cable connection�� a tele-communications circuit or via a relay receiver.
VHF FM Transmitter R&S®SR605E1The VHF FM Transmitter R&S®SR605E1 from Rohde&Schwarz (FIG �) is the core of the system. The transmitter includes two VHF Amplifiers R&S®VU3�0 yield-ing an output power of max. 5 kW in the frequency range 87.5 MHz to 108.0 MHz. The transmitter is operated via menus using the VHF FM Exciter R&S®SU135��
FIG 2 Shelter with power distribution (left), VHF FM transmitter (center) and resilience audio supply unit (right).
which also creates the carrier frequency and the modulation. The transmitter is cooled by a fresh-air ventilation sys-tem provided at the rear. An air-condi-tioning system cools the shelter. Under extremely hot climatic conditions�� cool air from the air conditioning system can be added to cool the amplifier output stages of the transmitter.
The transmit antenna includes four dipoles arranged on top of each other and�� mounted on a mobile antenna mast�� attains a radiation height of �7 m.
Resilience audio supply systemThe resilience audio supply system (FIG �) was supplied by Thum+Mahr GmbH. If a program cannot be transmit-ted from the sound broadcasting stu-dio�� a prerecorded radio program can be
loaded from the shelter into the trans-mitter via the resilience audio supply system. Professional audio equipment such as stereo cassette recorder�� mini-disk recorder�� CD player as well as an audio codec for transmitting audio data via ISDN is available for loading. A digi-tal / analog crossbar is used as the input matrix. It connects either the studio�� the telecommunications circuit or – in case of resilience audio supply – one of the audio devices with the FM transmitter. The audio signals�� which are available in different qualities�� can be optimized for transmission via a digital dynamic pro-cessor and a limiter.
Klemens Schwadorf
News from Rohde&Schwarz Number 190 (�006/ II)

50
Shenzhen subway equipped with DVB-T transmitter technology from Rohde&Schwarz
The continuously growing city of
Shenzhen in southern China at the
Hong Kong border is the first Chinese
city to supply passengers traveling
in the new Shenzhen subway with
TV programs via DVB-T.
Trustworthy cooperation
The Shenzhen Broadcasting Transmis-sion Center (SBTC)�� which was entrusted with the technical implementation of the DVB-T project�� opted for a solu-tion with Rohde&Schwarz transmit-ters. The favorable price of the trans-mitters�� many years of fruitful coopera-tion and the positive experience made with Rohde&Schwarz in the field of analog TV transmitters were of prime importance for the decision. Since 1998�� for example�� two �0 kW transmitters from Rohde&Schwarz cover an area of approx. 16 million inhabitants.
Free-running SFN
The baseband signal processed in the control center is taken to the headend�� which feeds the programs almost simul-taneously to the individual sections via commercial fiber-optic cables (FIG �). The SFN system is thus a free-running system which is not synchronized via GPS receivers�� as is usually the case. In each section�� a 50 W UHF Amplifier R&S®VH610A� (FIG 1) [1] feeds a 15/8" leakage cable. Since the production tol-erance of the 50 W amplifiers is very small�� a typical precorrector setting in the exciters is sufficient to correct all the
FIG 1 The 50 W Amplifier ¸VH610A2 (bottom) and the Exciter R&S®SV702 (top) form a compact unit.
439�7/1
News from Rohde&Schwarz Number 190 (�006/ II)
BROADCASTING Reference

51
CDMAGSM
Opticaldivider
Opticaldivider
Opticaldivider
Opticaldivider
Opticaldivider
Opticaldivider
Opticaldivider
Opticalreceiver
Opticalreceiver
Opticalreceiver
Opticalreceiver
Opticalreceiver
Opticalreceiver
Opticalreceiver
RF combiner RF combiner RF combiner RF combiner RF combiner RF combiner RF combiner
50 W amplifier
50 W amplifier
50 W amplifier
50 W amplifier
50 W amplifier
50 W amplifier
50 W amplifier
CDMAGSM
1264 m1075 m
CDMAGSM
CDMAGSM
671 m 679 m1859 m
CDMAGSM
CDMAGSM
CDMAGSM
944 m 1386 m1022 m 644 m1005 m1985 m1357 m1810 m1080 m
Control center
Headend
Optical transmitter
Subway station
Fiber-optic cable
Interruption in leakage cable
FIG 2 Basic setup of the DVB-T system for the Shenzhen subway.
Digitalmicrowavetransmitter
EncoderA/V ASI Digital
microwavereceiver
Switch
OpticaltransmitterEncoder
A/V ASI Opticalreceiver
RF
RF
R&S®NetCCU700
ExciterR&S®SV702
ExciterR&S®SV702
ASI
ASI
ASI
ASI
FIG 3 The headend in the Shenzhen subway feeds in programs.
More information and data sheets at www.rohde-schwarz.com
(search term: SV7002 / NetCCU700)
REFERENCES[1] UHF Transmitter Family R&S®SV700�:
DTV low-power transmitters – modular and space-saving. News from Rohde&Schwarz No. 178 (�003)�� pp 48–50
[�] Control Unit R&S®NetCCU700: Transmit-ter control and remote monitoring in one unit. News from Rohde&Schwarz No. 179 (�003)�� pp �6–�8
amplifiers in the network. An RF com-biner following to the amplifiers couples the mobile phones of the subway pas-sengers to the CDMA or GSM network.
Two Exciters R&S®SV70� [1] operating in passive standby are used in the headend (FIG 3). Remote control is via the Con-trol Unit R&S®NetCCU700 [�]. Commer-cial DVB-T receivers in the subway trains
receiving the signal from the slot anten-nas supply the passengers with the pro-grams.
The DVB-T system has been in opera-tion for more than a year and will be enhanced when the Shenzhen subway network is expanded. Rohde&Schwarz China installed and commissioned the system in close cooperation with SBTC.
This subway system is the third DVB-T application so far in public transport in China: More than 4000 busses in Beijing and several hundred busses in Guang-zhou have already been equipped with DVB-T receivers�� allowing passengers to enjoy the programs while caught in day-to-day traffic jams.
Gerhard-Karl Strauss
News from Rohde&Schwarz Number 190 (�006/ II)

5�
UHF Low-Power Transmitter Family R&S®SV8000
Power is not always a matter of sizeNow that digital broadcasting
networks have been expanded with
high-power transmitters, it is time
to optimize coverage by eliminating
areas that are not covered or where
field strengths are too low.
FIG 1 Front view of 25 W (DVB-T/-H) or 30 W (ATSC) R&S®VH6020A2 amplifier with Exciter R&S®SX800 (top).
Reliable technology combined
The low-power transmitters of the R&S®SV8000 UHF transmitter family (FIG 1) are ideal for covering small urban areas and valleys and for closing cov-erage gaps in digital broadcasting net-works. Featuring a compact design�� flex-ibility and intelligent standby systems�� they combine advanced digital technol-ogy with reliable digital amplifier tech-nology (FIG �).
The Exciter R&S®SX800 [1] was intro-duced one year ago together with the new R&S®Nx8�00 [�] medium-power transmitter generation. The fully digital and highly compact exciter of only one height unit processes signals in com-pliance with the most important digital standards from the baseband to the RF output signal.
The Amplifiers R&S®VH60xxA2 have already proven their high reliability in the previous R&S®SV700� series and are used without any modifications.
4451
4/5
News from Rohde&Schwarz Number 190 (�006/ II)
BROADCASTING TV transmitters
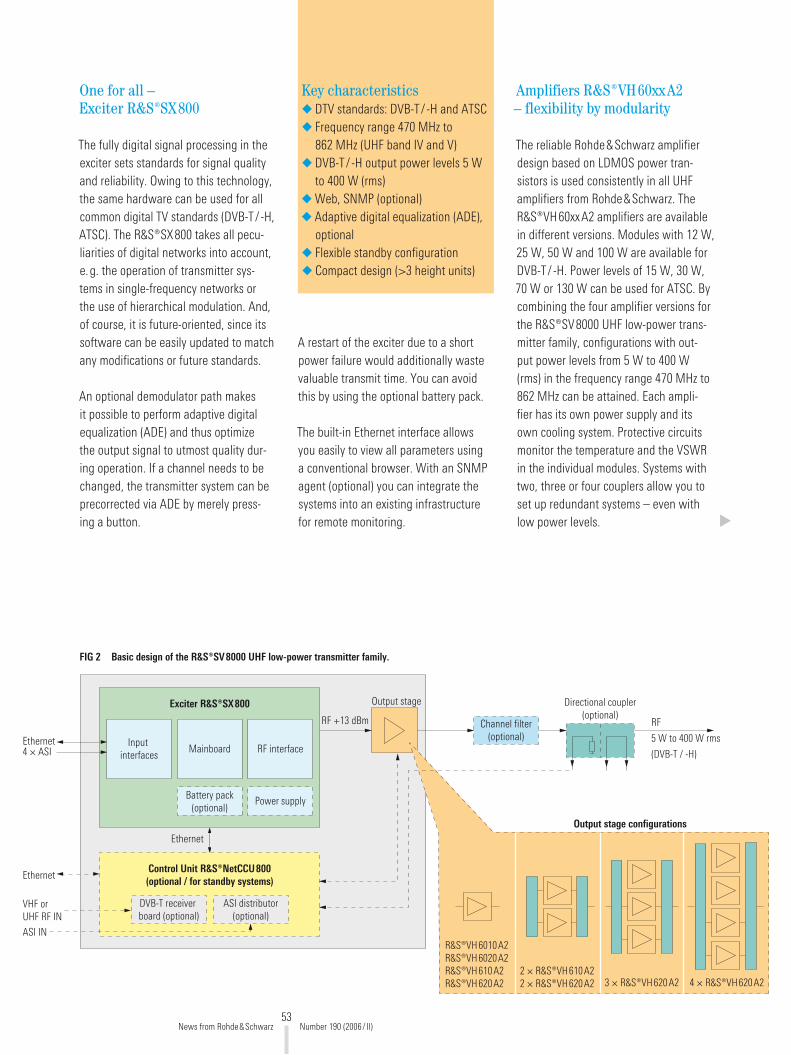
53
One for all – Exciter R&S®SX800
The fully digital signal processing in the exciter sets standards for signal quality and reliability. Owing to this technology�� the same hardware can be used for all common digital TV standards (DVB-T/ -H�� ATSC). The R&S®SX800 takes all pecu-liarities of digital networks into account�� e.g. the operation of transmitter sys-tems in single-frequency networks or the use of hierarchical modulation. And�� of course�� it is future-oriented�� since its software can be easily updated to match any modifications or future standards.
An optional demodulator path makes it possible to perform adaptive digital equalization (ADE) and thus optimize the output signal to utmost quality dur-ing operation. If a channel needs to be changed�� the transmitter system can be precorrected via ADE by merely press-ing a button.
A restart of the exciter due to a short power failure would additionally waste valuable transmit time. You can avoid this by using the optional battery pack.
The built-in Ethernet interface allows you easily to view all parameters using a conventional browser. With an SNMP agent (optional) you can integrate the systems into an existing infrastructure for remote monitoring.
FIG 2 Basic design of the R&S®SV8000 UHF low-power transmitter family.
Key characteristicsDTV standards: DVB-T/ -H and ATSCFrequency range 470 MHz to 86� MHz (UHF band IV and V)DVB-T/ -H output power levels 5 W to 400 W (rms)Web�� SNMP (optional)Adaptive digital equalization (ADE)�� optionalFlexible standby configurationCompact design (>3 height units)
◆
◆
◆
◆
◆
◆
◆
Amplifiers ¸VH60xxA2 – flexibility by modularity
The reliable Rohde&Schwarz amplifier design based on LDMOS power tran-sistors is used consistently in all UHF amplifiers from Rohde&Schwarz. The R&S®VH60xxA� amplifiers are available in different versions. Modules with 1� W�� �5 W�� 50 W and 100 W are available for DVB-T/ -H. Power levels of 15 W�� 30 W�� 70 W or 130 W can be used for ATSC. By combining the four amplifier versions for the R&S®SV8000 UHF low-power trans-mitter family�� configurations with out-put power levels from 5 W to 400 W (rms) in the frequency range 470 MHz to 86� MHz can be attained. Each ampli-fier has its own power supply and its own cooling system. Protective circuits monitor the temperature and the VSWR in the individual modules. Systems with two�� three or four couplers allow you to set up redundant systems – even with low power levels.
VHF or UHF RF IN
Directional coupler(optional)
Exciter R&S®SX800
Battery pack(optional)
Power supply
Mainboard RF interfaceInput
interfacesEthernet4 × ASI
Ethernet
Control Unit R&S®NetCCU800(optional / for standby systems)
DVB-T receiver board (optional)
ASI IN
ASI distributor(optional)
Ethernet
RF +13 dBm
Output stage
RF
5 W to 400 W rms
(DVB-T / -H)
R&S®VH6010A2R&S®VH6020A2R&S®VH610A2R&S®VH620A2
2 × R&S®VH610A22 × R&S®VH620A2 3 × R&S®VH620A2 4 × R&S®VH620A2
Output stage configurations
Channel filter(optional)
News from Rohde&Schwarz Number 190 (�006/ II)

54
Everything under control: Control Unit R&S®NetCCU800
The Control Unit R&S®NetCCU800 [3] (FIG 3)�� which can also be integrated into the R&S®SV8000 systems�� offers a number of applications. It allows the transmitter to be operated�� for example�� via a color display and a keypad. It also operates as a switchover control unit in all R&S®SV8000 standby configurations and communicates with the individ-ual transmitters via Ethernet. All param-eters of the individual systems can thus be displayed via the Control Unit R&S®NetCCU800 – locally or remotely.
Directional couplers connected to the appropriate input of the R&S®NetCCU800 are used to display the forward and reflected power (optional). An optional ASI distributor can be inte-grated to distribute the input data stream for standby configurations.
A DVB-T receiver board can be installed in the unit�� too. If the RF output signal is returned from a directional coupler to
the input of the board�� the board func-tions as a monitoring receiver and can monitor the quality of the transmitter output. Alternatively�� it can be used as a cost-effective signal feed for the trans-mitter. For this purpose�� an off-air signal is demodulated and processed�� which yields an error-corrected data stream. Due to the long signal processing time�� this retransmitter setup can only be used in multifrequency networks.
Summary
The modular and flexible concept of the transmitter family meets all the require-ments placed on digital TV networks. All units have been developed for abso-lute reliability�� and the options described allow you to expand basic transmit-ter functionality to suit your own needs. No matter if it is used as a stand-alone device or as a system including sev-eral transmitters in a rack�� the versa-tile R&S®SV8000 UHF low-power trans-mitter family can meet a wide range of requirements.
Hannes Strobel
4431
6/1
More information at www.rohde-schwarz.com
(search term: type designation)
REFERENCES[1] Exciter R&S®SX800: Multistandard
exciter for ATV and DTV. News from Rohde&Schwarz (�005) No. 186�� pp 41–43
[�] UHF TV Transmitters R&S®NH/NV8�00: Air-cooled transmitters for the medium power segment. News from Rohde&Schwarz (�005) No. 185�� pp 40–4�
[3] Control Unit R&S®NetCCU800: Common control unit for FM and TV transmit-ters. News from Rohde&Schwarz (�005) No. 188�� pp 44–45
FIG 3 The optional R&S®NetCCU800 serves as a local control unit or switching unit for standby configurations. A DVB-T receiver board for monitoring or retransmitter applications and an ASI distributor can also be integrated.
News from Rohde&Schwarz Number 190 (�006/ II)
BROADCASTING TV transmitters

55
R&S®DV-H264 transport stream library
Transport and elementary streams for the H.264 compression standard
The next innovation for digital TV
is coming: A new standard for
compressing video data. To
perform tests in this environment,
Rohde&Schwarz presents a new
signal library.
Shrinking the data volume for HDTV
H.�64 is the designation for the new video data compression standard. This method is also known as MPEG-4 /Part 10 or MPEG-4/AVC (advanced video coding). Basically�� it is a further develop-ment of MPEG-� (H.�6�). Since this new method reduces data volume by approx.
50%�� the necessary transmission capac-ity is also decreased meaning lower costs when pictures are “transported“ to viewers. Together with further progress in coding�� modulation and error correc-tion methods as offered by the DVB-S� standard for example�� H.�64 will make the transmission of high-definition TV (HDTV) more effective and thus promote it further.
The R&S®DV-H264 transport stream library contains an extensive collection of high-quality transport and elementary streams for testing TV sets, set-top boxes, displays and decoders.
News from Rohde&Schwarz Number 190 (�006/ II)
BROADCASTING Generators

56
An extensive transport stream collection …
To introduce this new technology on a broad basis�� Rohde&Schwarz pro-vides the complete T&M equipment – one component from this wide-rang-ing portfolio is the new H.�64 Stream Library R&S®DV-H�64. Using this exten-sive collection of high-quality transport and elementary streams�� you can eas-ily arrange reproducible test scenarios that allow TV studios�� network operators and producers of TV broadcasting equip-ment to test their services and prod-ucts quickly and with high test depth. The associated audio signals are AC-3 or MPEG-1 Layer II coded. The library con-tains signals with all commonly used frame frequencies and frame sizes. This also includes film formats that are still uncommon for TV:
�4 frames per second�� 1080 lines�� pro-gressive scan�3.97 frames per second�� 1080 lines�� progressive scan
as well as signals with:�5�� �9.97 and 30 frames per second�� SDTV (480 and 576 lines�� interlaced) and HDTV (1080 lines�� interlaced)
and signals with:50�� 59.94 and 60 frames per second�� HDTV (480�� 576 and 7�0 lines�� pro-gressive scan)
Also with respect to picture contents�� everything that is important is included. In addition to two live trailers that can be examined visually – i.e. simulating normal operation – the transport stream
◆
◆
◆
◆
collection also offers “real“ test pictures that can be analyzed. Apart from moni-tor geometry (4:3 / 16 : 9) and color and field/frame display�� the collection also contains signals for testing the electro-magnetic compatibility (EMC) of receiv-ers. All in all�� the library is an unparal-leled reference that supports the devel-opment and production of TV sets�� set-top boxes�� displays and decoders.
… for excellent T&M equipment
The library is available for the following instruments:
Digital Video Measurement System R&S®DVM400 [1]�� the universal trans-port stream measurement platformBroadcast Test System R&S®SFU [�]DTV Recorder Generator R&S®DVRG [3].
The library contains all elementary stream data as separate files. Used in combination with the Advanced Stream Combiner R&S®DV-ASC software option from Rohde&Schwarz [4]�� the library makes it easy to generate customized transport streams.
Summary
With this new signal library�� Rohde&Schwarz is guiding digital TV further into the next evolutionary phase�� where displays carrying the HD ready certificate will soon be able to show HDTV – truly home cinema.
Harald Weigold
◆
◆
◆
More information and data sheets at www.rohde-schwarz.com
(search term: type designation)
REFERENCES[1] Digital Video Measurement System
R&S®DVM400: Comprehensive MPEG-� analysis – also for mobile use. News from Rohde&Schwarz (�004) No. 18��� pp 46–49
[�] Broadcast Test System R&S®SFU: Universal test platform for digital TV. News from Rohde&Schwarz (�004) No. 183�� pp 39–43
[3] MPEG-� Generators R&S®DVG /R&S®DVRG: Transport stream signal library for comprehensive tests in production. News from Rohde&Schwarz (�003) No. 177�� pp 37–39
[4] Generating and analyzing transport streams for DVB-H. News from Rohde&Schwarz (�005) No. 188�� pp 4�–43
News from Rohde&Schwarz Number 190 (�006/ II)
BROADCASTING Generators
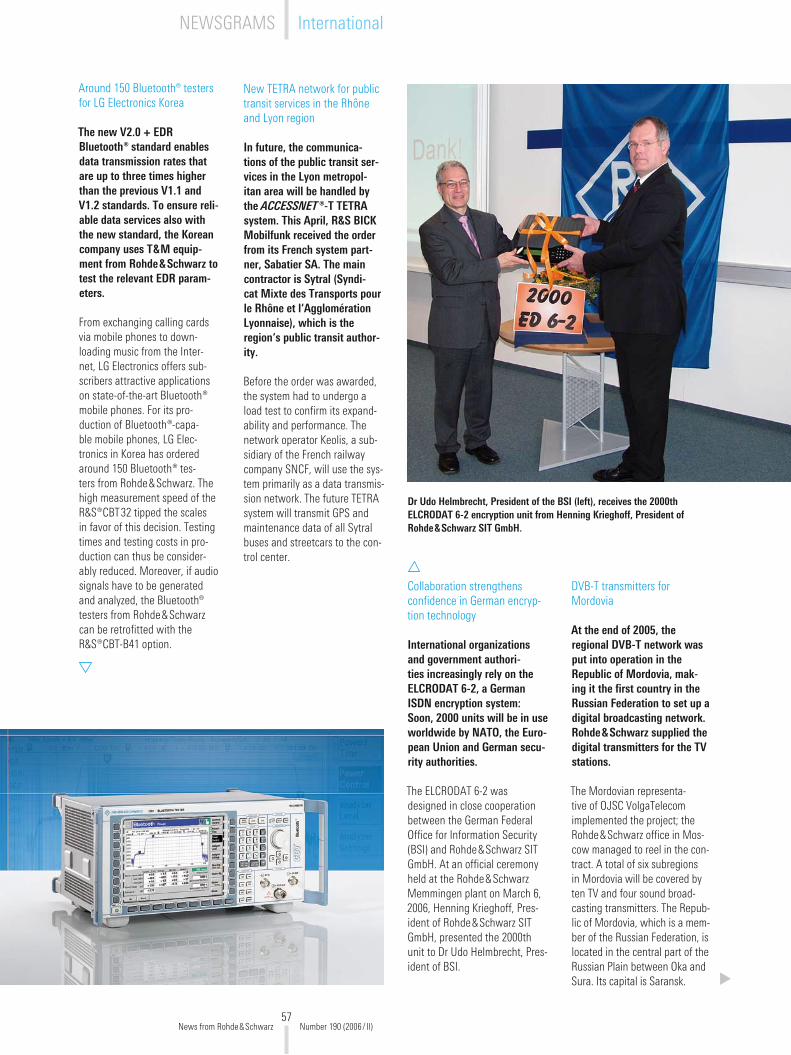
57
Collaboration strengthens confidence in German encryp-tion technology
International organizations and government authori-ties increasingly rely on the ELCRODAT 6-2, a German ISDN encryption system: Soon, 2000 units will be in use worldwide by NATO, the Euro-pean Union and German secu-rity authorities.
The ELCRODAT 6-� was designed in close cooperation between the German Federal Office for Information Security (BSI) and Rohde&Schwarz SIT GmbH. At an official ceremony held at the Rohde&Schwarz Memmingen plant on March 6�� �006�� Henning Krieghoff�� Pres-ident of Rohde&Schwarz SIT GmbH�� presented the �000th unit to Dr Udo Helmbrecht�� Pres-ident of BSI.
New TETRA network for public transit services in the Rhône and Lyon region
In future, the communica-tions of the public transit ser-vices in the Lyon metropol-itan area will be handled by the ACCESSNET ®-T TETRA system. This April, R&S BICK Mobilfunk received the order from its French system part-ner, Sabatier SA. The main contractor is Sytral (Syndi-cat Mixte des Transports pour le Rhône et l‘Agglomération Lyonnaise), which is the region‘s public transit author-ity.
Before the order was awarded�� the system had to undergo a load test to confirm its expand-ability and performance. The network operator Keolis�� a sub-sidiary of the French railway company SNCF�� will use the sys-tem primarily as a data transmis-sion network. The future TETRA system will transmit GPS and maintenance data of all Sytral buses and streetcars to the con-trol center.
DVB-T transmitters for Mordovia
At the end of 2005, the regional DVB-T network was put into operation in the Republic of Mordovia, mak-ing it the first country in the Russian Federation to set up a digital broadcasting network. Rohde&Schwarz supplied the digital transmitters for the TV stations.
The Mordovian representa-tive of OJSC VolgaTelecom implemented the project; the Rohde&Schwarz office in Mos-cow managed to reel in the con-tract. A total of six subregions in Mordovia will be covered by ten TV and four sound broad-casting transmitters. The Repub-lic of Mordovia�� which is a mem-ber of the Russian Federation�� is located in the central part of the Russian Plain between Oka and Sura. Its capital is Saransk.
Around 150 Bluetooth® testers for LG Electronics Korea
The new V2.0 + EDR Bluetooth® standard enables data transmission rates that are up to three times higher than the previous V1.1 and V1.2 standards. To ensure reli-able data services also with the new standard, the Korean company uses T&M equip-ment from Rohde&Schwarz to test the relevant EDR param-eters.
From exchanging calling cards via mobile phones to down-loading music from the Inter-net�� LG Electronics offers sub-scribers attractive applications on state-of-the-art Bluetooth® mobile phones. For its pro-duction of Bluetooth®-capa-ble mobile phones�� LG Elec-tronics in Korea has ordered around 150 Bluetooth® tes-ters from Rohde&Schwarz. The high measurement speed of the R&S®CBT3� tipped the scales in favor of this decision. Testing times and testing costs in pro-duction can thus be consider-ably reduced. Moreover�� if audio signals have to be generated and analyzed�� the Bluetooth® testers from Rohde&Schwarz can be retrofitted with the R&S®CBT-B41 option.
Dr Udo Helmbrecht, President of the BSI (left), receives the 2000th ELCRODAT 6-2 encryption unit from Henning Krieghoff, President of Rohde&Schwarz SIT GmbH.
News from Rohde&Schwarz Number 190 (�006/ II)
InternationalNEWSGRAMS
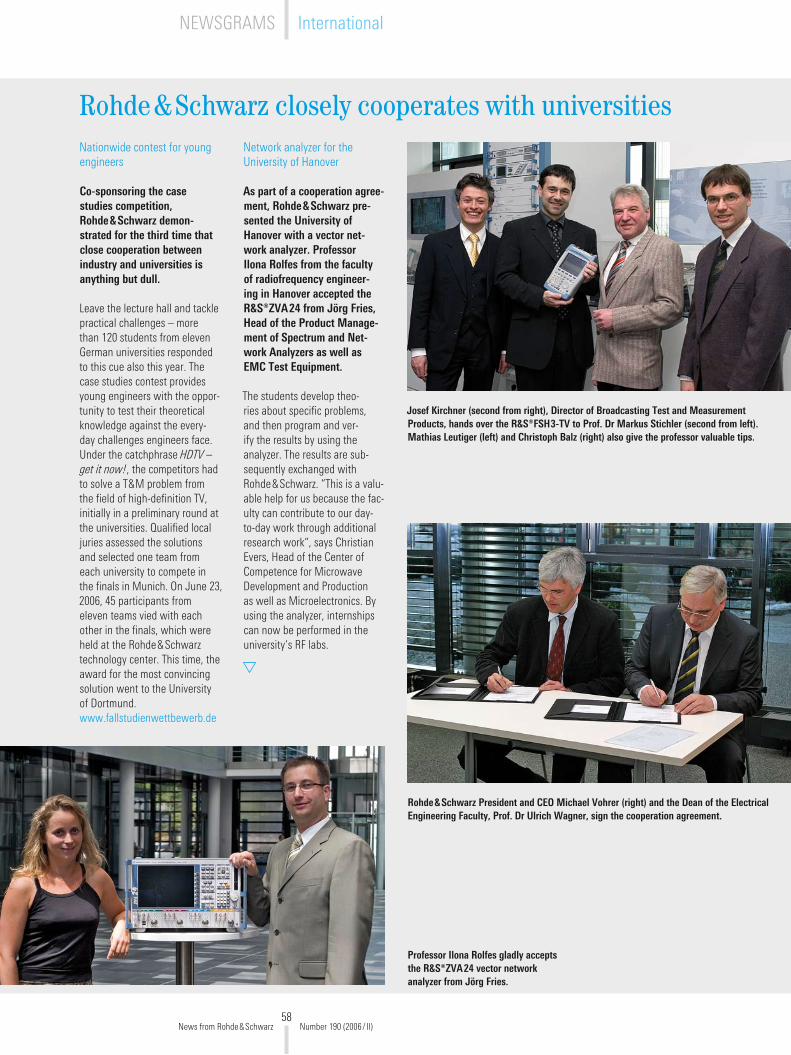
58
Nationwide contest for young engineers
Co-sponsoring the case studies competition, Rohde&Schwarz demon-strated for the third time that close cooperation between industry and universities is anything but dull.
Leave the lecture hall and tackle practical challenges – more than 1�0 students from eleven German universities responded to this cue also this year. The case studies contest provides young engineers with the oppor-tunity to test their theoretical knowledge against the every-day challenges engineers face. Under the catchphrase HDTV – get it now!�� the competitors had to solve a T&M problem from the field of high-definition TV�� initially in a preliminary round at the universities. Qualified local juries assessed the solutions and selected one team from each university to compete in the finals in Munich. On June �3�� �006�� 45 participants from eleven teams vied with each other in the finals�� which were held at the Rohde&Schwarz technology center. This time�� the award for the most convincing solution went to the University of Dortmund. www.fallstudienwettbewerb.de
Josef Kirchner (second from right), Director of Broadcasting Test and Measurement Products, hands over the R&S®FSH3-TV to Prof. Dr Markus Stichler (second from left). Mathias Leutiger (left) and Christoph Balz (right) also give the professor valuable tips.
Rohde&Schwarz President and CEO Michael Vohrer (right) and the Dean of the Electrical Engineering Faculty, Prof. Dr Ulrich Wagner, sign the cooperation agreement.
Network analyzer for the University of Hanover
As part of a cooperation agree-ment, Rohde&Schwarz pre-sented the University of Hanover with a vector net-work analyzer. Professor Ilona Rolfes from the faculty of radiofrequency engineer-ing in Hanover accepted the R&S®ZVA24 from Jörg Fries, Head of the Product Manage-ment of Spectrum and Net-work Analyzers as well as EMC Test Equipment.
The students develop theo-ries about specific problems�� and then program and ver-ify the results by using the analyzer. The results are sub-sequently exchanged with Rohde&Schwarz. “This is a valu-able help for us because the fac-ulty can contribute to our day-to-day work through additional research work“�� says Christian Evers�� Head of the Center of Competence for Microwave Development and Production as well as Microelectronics. By using the analyzer�� internships can now be performed in the university‘s RF labs.
Professor Ilona Rolfes gladly accepts the R&S®ZVA24 vector network analyzer from Jörg Fries.
Rohde&Schwarz closely cooperates with universities
News from Rohde&Schwarz Number 190 (�006/ II)
NEWSGRAMS International

59
New office in Hong Kong
ROHDE&SCHWARZ Hong Kong Ltd. office in operation since July 1, 2006.
Five employees will handle sales locally. To ensure a uniform mar-ket presence�� Rohde&Schwarz Hong Kong took over the sales rights from the previous distrib-utor�� Electronic Scientific Engi-neering Ltd. Heino Gregorek is Managing Director and Regional Manager�� Frank Wong General Manager. Gregorek – Regional Support Director for Asia/Pacific for the last five years – has been with Rohde&Schwarz for more than �5 years.
ROHDE&SCHWARZ Hong Kong Ltd. Unit 1608-1609�� Level 16�� Tower 1 Grand Century Place 193 Prince Edward Road West Mongkok�� Kowloon Hong Kong Phone: +85 ��� 6430 Fax: +85 ��� 64�699
Welcome to the club
In May�� Rohde&Schwarz China again organized a user club meeting for its custom-ers who work with civil radio-monitoring systems. The event was staged in Wuhan in the province of Hubei. Since the 1990s�� the meeting has served as a platform for users to exchange views regarding Rohde&Schwarz equipment. Rohde&Schwarz�� in turn�� can get valuable ideas for future product development as new trends are presented and dis-cussed. The meeting is held on an annual to biannual basis in different Chinese provinces.
In addition to the staff from the Beijing office�� participants from Rohde&Schwarz Munich and numerous honorary guests from industry and politics attended the meeting.
EADS Astrium trains at Rohde&Schwarz UK
To familiarize themselves with radiofrequency engineering as well as spectrum and network analysis, 24 employees from EADS Astrium attended a fun-damentals training seminar at Rohde&Schwarz UK in July.
The training offered theoreti-cal and practical contents: The participants could sample the Rohde&Schwarz product portfo-lio and perform measurements using network and spectrum analyzers�� signal generators and power meters.
Rohde&Schwarz UK offers these training seminars as an extra service to its key account cus-tomers from the military sector.
WiMAX Forum™ selects Rohde&Schwarz as a manufac-turer of RCT systems
The WiMAX Forum™ (WMF)�� an industry-led non-profit corpora-tion�� was formed to promote and certify compatibility and interop-erability of broadband wire-less products. The Certification and Technical Working Groups (CWG/TWG) of the WMF have now selected Rohde&Schwarz as one of the manufacturers of radio conformance testers (RCT) in accordance with the mobile WiMAX IEEE 80�.16e standard. The R&S®TS8970 test system�� which is based on validated test cases�� is a reference solution for the certification of WiMAX end products�� which are manu-factured in accordance with the IEEE80�.16e-�005 specification.
The Rosenheim University of Applied Sciences receives an R&S®FSH3-TV
Rohde&Schwarz collaborates even more strongly with the universities.
Rohde&Schwarz recently presented the Rosenheim University of Applied Sciences with a Handheld TV Ana-lyzer R&S®FSH3-TV. Each semester�� 40 diploma candidates and master students are trained on the instrument�� which allows them to gain their first experi-ence in analyzing TV signals. Its simple operation makes the R&S®FSH3-TV ideal for use in training. Rohde&Schwarz believes that the students‘ interest in the company will be reflected in disser-tations and internships.
Cooperation with the Technical Univer-sity of Munich finalized
Already last year, the Technical Uni-versity and the University of Applied Sciences of Munich received equip-ment and software worth a six-figure sum to equip their labs.
In signing the cooperation contract with Rohde&Schwarz�� the Technical Univer-sity of Munich has committed itself to recommending suitable trainee or work-ing students as well as students writ-ing their dissertations. Joint engineering workshops about current topics will also be performed. Plus�� Rohde&Schwarz gets the opportunity to present itself at events and in relevant university media.
Rohde&Schwarz recruits more than half of its entry-level employees from grad-uates of the Technical University and the University of Applied Sciences of Munich.
A representative office in Hong Kong: Rohde&Schwarz in Kowloon.
News from Rohde&Schwarz Number 190 (�006/ II)

New
s fro
m R
ohde
&Sc
hwar
z 190
(�00
6/II)
· PD
5�1
0.55
15.7
�
www.rohde-schwarz.com
Europe: [email protected] · North America: [email protected] · Asia: [email protected]