"The Checklist" - 2 Quest for Invariance - Volatility Clustering

Chapman University Chapman University
Chapman University Digital Commons Chapman University Digital Commons
ESI Working Papers Economic Science Institute
12-2019
News-driven Expectations and Volatility Clustering News-driven Expectations and Volatility Clustering
Sabiou M. Inoua Chapman University, [email protected]
Follow this and additional works at: https://digitalcommons.chapman.edu/esi_working_papers
Part of the Econometrics Commons, Economic Theory Commons, and the Other Economics
Commons
Recommended Citation Recommended Citation Inoua, S. M. (2020). News-driven expectations and volatility clustering. ESI Working Paper 19-33. https://digitalcommons.chapman.edu/esi_working_papers/294/
This Article is brought to you for free and open access by the Economic Science Institute at Chapman University Digital Commons. It has been accepted for inclusion in ESI Working Papers by an authorized administrator of Chapman University Digital Commons. For more information, please contact [email protected].

News-driven Expectations and Volatility Clustering News-driven Expectations and Volatility Clustering
Comments Comments ESI Working Paper 19-33
This paper was later published as:
Inoua, S. M. (2020). News-driven expectations and volatility clustering. Journal of Risk and Financial Management, 13(1):17. https://doi.org/10.3390/jrfm13010017
and is available in Chapman University Digital Commons here.
This article is available at Chapman University Digital Commons: https://digitalcommons.chapman.edu/esi_working_papers/294
1
News-driven Expectations and Volatility Clustering
Sabiou M. Inoua
Chapman University
This version: Dec. 2019
A longer, edited version published in J. Risk Financial Manag. 2020, 13(1), 17;
https://doi.org/10.3390/jrfm13010017
Abstract
Financial volatility obeys two well-established empirical properties: it is fat-
tailed (power-law distributed) and it tends to be clustered in time. Many
interesting models have been proposed to account for these regularities,
notably agent-based computational models, which typically invoke
complicated mechanisms, however. It can be shown that trend-following
speculation generates the power law in an intrinsic way. But this model
cannot exaplain clustered volatility. This paper extends the model and
offers a simple explanation for clustered volatility: the impact of exogenous
news on traders’ expectations. Owing to the famous no-trade results,
rational expectations, the dominant model of news-driven expectations, is
hard to reconcile with the incessant high-frequency trading behind the
volatility clustering. The simplest alternative model of news-driven

2
expectations is to assume that traders have prior views about the market
(an asset’s future price change or its present value) and then modify their
views with the advent of a news. This simple news-driven random walk of
traders’ expectations explains volatility clustering in a generic way. Liquidity
plays a crucial role in this dynamics of volatility, which is emphasized in a
dicussions section.
1. The two empirical regularities
Financial volatility obeys two well-established regularities: it is fat tailed,
more precisely power-law distributed (with an exponent often close to 3),
and it tends to be clustred in time (Fama, 1963; Mandelbrot, 1963;
Gopikrishnan, Meyer, Amaral, & Stanley, 1998; Plerou, Gabaix, Stanley, &
Gopikrishnan, 2006; Cont, 2007; Bouchaud & Challet, 2016). These are
fascinating regularities that hold for various types of finanical products, on
various markets, and on various time scales. The first regularity implies that
extreme price changes are much more likely than would suggest the
standard assumption of normal distribution. The second property, volatility
clustering, holds that high-amplitude price changes tend to be followed by
high-amplitude price changes, and low-amplitude price changes, by low-
amplitude price changes. This corresponds to a nontrivial predictability of
3
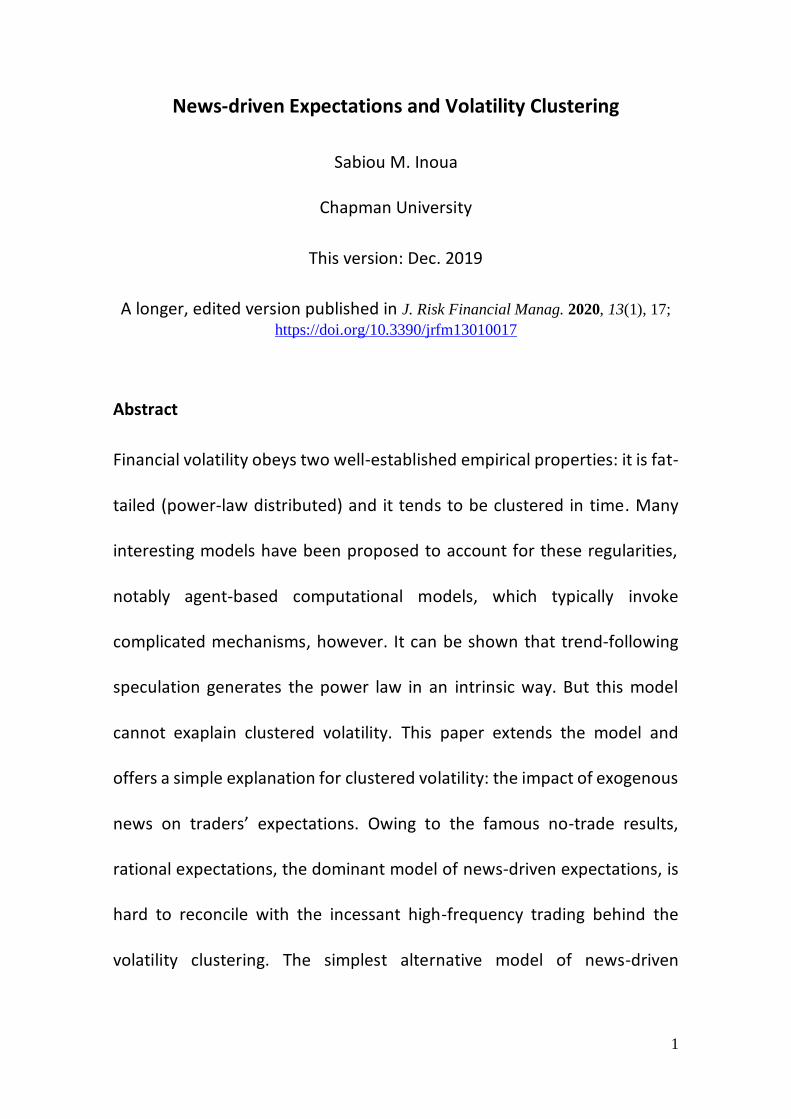
price changes: while their sign is uncorrelated, its amplitude (or volatility)
is long-range correlated.
Formally, let tP be the price of a financial asset at the closing of period ,t let
the relative price change (or return) be 1 1( ) / ,t t t tr P P P and let
volatility be measured by means of | |,tr the amplitude (absolute value) or
return. Then the two regularities hold that: (a) (| | ) ,tP r x Cx for big
values ,x where 3 and 0;C and (b) cor( , ) 0t t hr r for 0h (except
FIG. 1. NYSE composite daily index: (a) Price; (b) Return (in percent); (c) cumulative distribution of volatility in log-log scale, showing a linear fit of the tail, with a slope close to 3; (d) Autocorrelation function of return, which is almost zero at all lags, while that of volatility is nonzero over a long range of lags (a phenomenon known as volatility clustering).

4
perhaps for 1),h but cor(| |,| |) 0t t hr r over a long range of lags .h FIG.
1 illustrates these two regularities for the NYSE daily index1.
The universality of these laws suggests that there must be some basic,
general, and stable mechanisms behind them. Standard financial
economics, despite its important theoretical insights, is nonetheless silent
on these empirical regularities. In fact, there seems to be an intrinsic
difficulty in reconciling the high-frequency volatility of financial markets,
caused by incessant trading at almost all time scales, with the dominant
assumption of rational expectations, which often leads to a no-trade
equilibrium, as is well-known (Milgrom & Stokey, 1982; Tirole, 1982).
Agent-based models of financial markets, on the other hand, offers various
realistic models of price fluctuations, but these models often involve
relatively complicated mechanisms, which are handled computationally.2
This paper, while it is closer in spirit to this alternative, complex-systems
view, is nonetheless an attempt to pin down the empirical regularities to
1 The linear fit is based on a maximum-likelihood algorithm developed by Clauset, Shalizi, and Newman (2009), which is also a good reference for the statistical test of empirical power laws. For an introduction to power laws, see, for example, Newman (2005) and Gabaix (2008, 2016).
2 For a review of agent-based models of financial markets, see Samanidou, Zschischang, Stauffer, and Lux
(2007). Agent-based models are, however, only one of the trends in the complex-systems approach to financial markets, which insists on the endogenous, emergent, dynamics of markets. For an introduction to this view on financial markets, see, e.g., Bouchaud (2011).

5
simple mechanisms. It can be shown that that the first regularity, the fat tail
of volatility, derives naturally from trend-following speculative trading,
which implies that the return process follows a random-coefficient
autoregressive (RCAR) process (Inoua, 2016). Trend-following expectations,
which are a popular practice on financial markets, are a realistic alternative
to rational expectations, which are hard to reconcile with speculation
(Tirole, 1982). The power-law tail follows by an important theorem due to
Kesten (Kesten, 1973; Klüppelberg & Pergamenchtchikov, 2004;
Buraczewski, Damek, & Mikosch, 2016). While the mathematics of this
mechanism is rather involved, the underlying economics is elementary: the
fat tail emerges because of the endogenous amplifying feedback intrinsic to
speculative trend-following supply and demand. This model is not wholly
satisfactory, however, because no such process could explain volatility
clustering, as implies another theorem (Mikosch & Starica, 2000; Basrak,
Davis, & Mikosch, 2002; Mikosch & Starica, 2003; Buraczewski et al., 2016).
The basic reason for clustered volatility, this paper suggests, is the impact
of exogenous news on expectations. The RCAR model is thus extended to
include, as usual, a second class of agents, fundamental-value investors,
who attach a value to the asset and buy it when they think it is underpriced,
or sell it, otherwise; crucially, their valuations of the asset is entirely based
6
on exogenous news. Owing once again to the no-trade results, the
dominant model of news-driven expectations, rational expectations, is not
assumed in this paper. Rather, it is simply assumed that a trader holds a
prior belief about the market (on the future price change or the present
value of the asset) and then revises this prior belief additively with the
advent of news. This news-driven random walk of traders’ expectations
explains volatility clustering in a generic way. The fat-tail of volatility is
preserved in the extended model; but for simplicity of exposition, and to
avoid some technicalities inherent to a detailed study of the RCAR process,
this paper enphasizes the power law passignly, and focuses on the second
regularity. Finally, liquidity plays a crucial role in the volatility dynamics,
which is emphasized in the discussions (section 3).
2. The model
Following a traditional dichotomy of market participants, consider a
financial market populated by two types of traders: (short-term) trend-
following speculators, who buy an asset when they anticipate a price rise
(or sell, otherwise) by using standard moving averages of past price changes
to detect trends; and (long-run) fundamental-value investors (or ‘investors’
for short), who buy the asset based on its anticipated real cash flows, buying
7
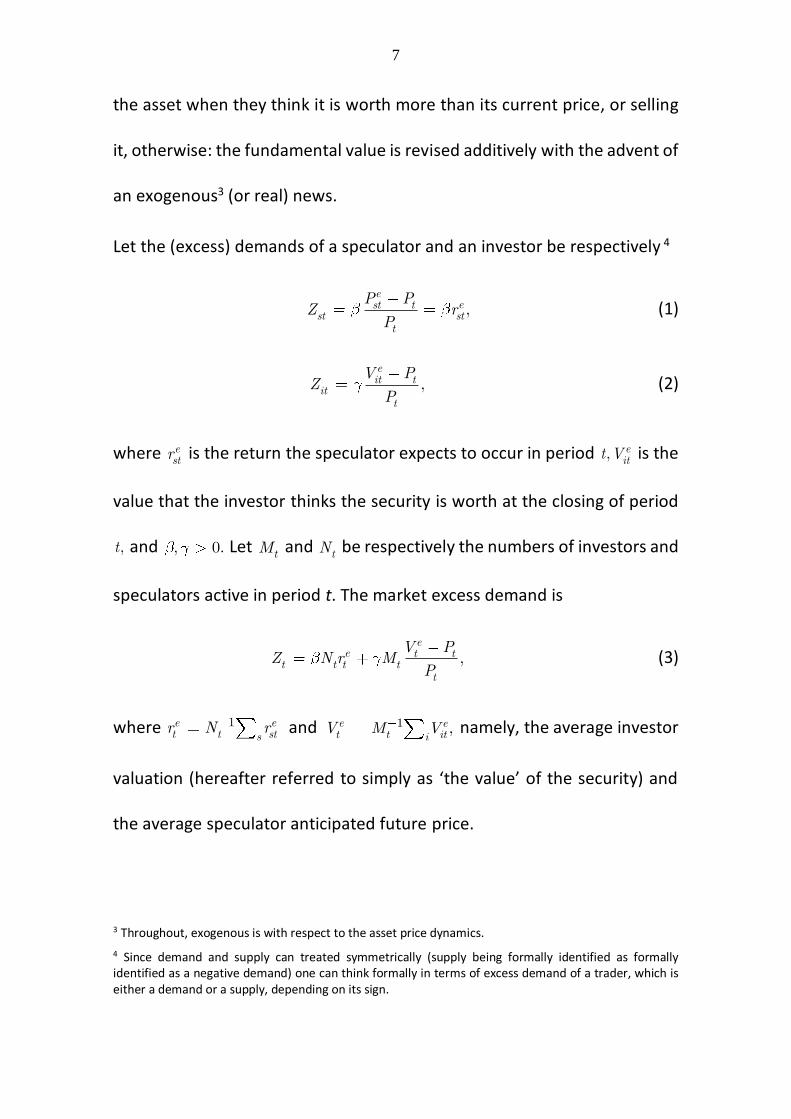
the asset when they think it is worth more than its current price, or selling
it, otherwise: the fundamental value is revised additively with the advent of
an exogenous3 (or real) news.
Let the (excess) demands of a speculator and an investor be respectively 4
,e
est tst st
t
P PZ r
P (1)
,eit t
itt
V PZ
P (2)
where estr is the return the speculator expects to occur in period ,t eitV is the
value that the investor thinks the security is worth at the closing of period
,t and , 0. Let tM and tN be respectively the numbers of investors and
speculators active in period t. The market excess demand is
,e
e t tt t t t
t
V PZ N r M
P (3)
where 1e et t stsr N r and e
tV 1 ,et itiM V namely, the average investor
valuation (hereafter referred to simply as ‘the value’ of the security) and
the average speculator anticipated future price.
3 Throughout, exogenous is with respect to the asset price dynamics.
4 Since demand and supply can treated symmetrically (supply being formally identified as formally identified as a negative demand) one can think formally in terms of excess demand of a trader, which is either a demand or a supply, depending on its sign.

8
Trend-following implies that speculators’ overall anticipated return is of the
form 1
,Het ht t khr r to which we add an additive component to capture
the impact of exogenous news on speculators’ expectations. The weights
ht can be computed explicitly from standard trend-following techniques
used by financial practitioners (Beekhuizen & Hallerbach, 2017). Let the
arrival of exogenous news relevant to investors and speculators,
respectively, be modeled as random events It and J ,t occurring with
probabilities t(I ) and (J ),t and making them revise additively their prior
views by the amounts t and ,t respectively. That is, assume etV
1 (I )et t tV 1 and e
tr 1
(J ),Hht t h t thr 1 where (I )t1 and (J )t1 are
indicator functions. The pure news-driven random walk of investors’
valuations conveys the notion that the asset’s value incorporates all the
exogenous news relevant to fundamental-value investors, in the sense that
10 ( ).te ek k ktV V I1 This makes e
tV the natural definition of the asset’s
fundamental value in this model.
Finally, assume the following price adjustment, in accordance with the
market-microstructure literature:
,ttt
Zr
L (4)

9
where tL is the overall market liquidity (or market depth).
All in all, the the asset’s price dynamics reads:
1(1 ) ,t t tP r P (5)
,e
e t tt t t t
t
V Pr n r m
P (6)
1
(J ),Het ht t h t thr r 1 (7)
1 (I ).e et t t tV V 1 (8)
where the following notations are adopted:
/ ,t t tn N L (9)
/ .t t tm M L (10)
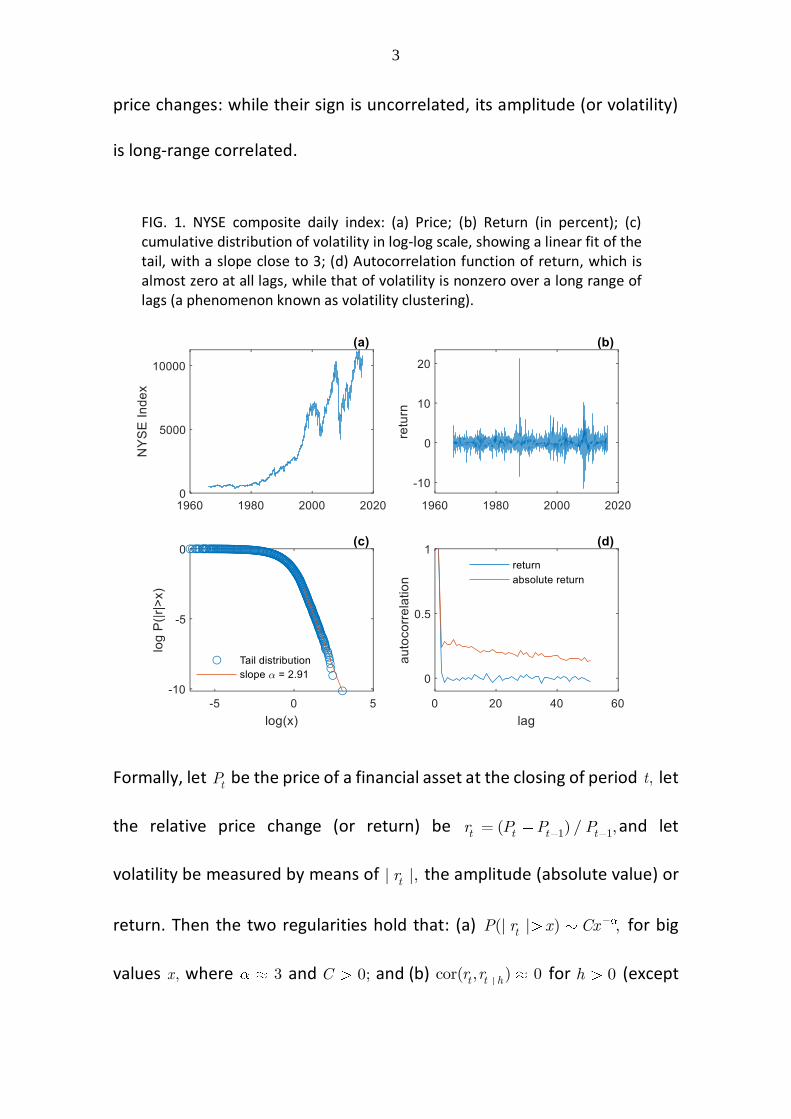
No general study of the model is attempted here, since the focus of this
paper is clustered volatility. To this end, FIG. 2 illustrates a simplified version
of the model using the following specification (where the parameters are
chosen arbitrarily, except to reflect realistic orders of magnitude):
10000T periods; 0 0 100,eP V 1r 1 0;er ,tn tm iid exponentially
distributed processes with E( ) 0.11,tn E( ) 0.1;tm ,t t iid Gaussian
processes with E( )t E( ) 0,t std( ) 5,t std( ) 0.1;t (I ) 0.1,t
(J ) 0.01;t 1,H 1 1 0.99.t

10
FIG. 2 The model.

11
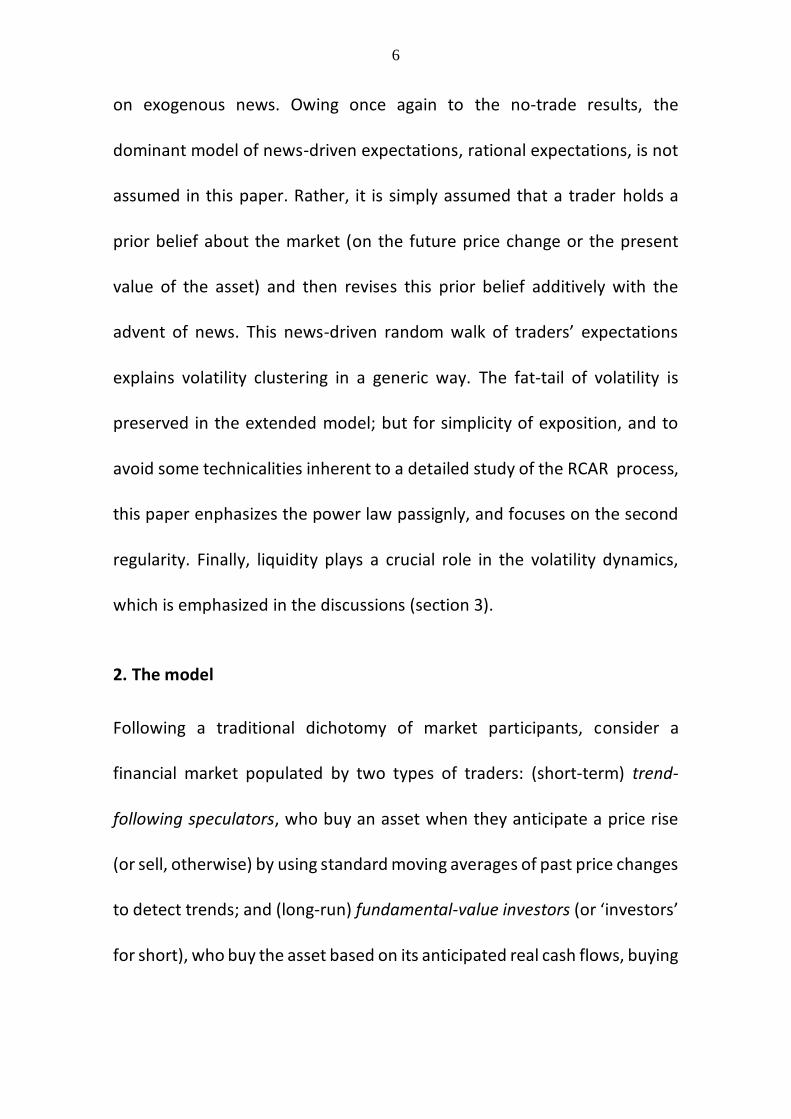
FIG. 3. For model-data comparison: General Electric’s stock price.
3. Discussions
In the simulation, trend-following has been reduced to its simplest
formulation. More generally, the key to the fat-tailed volatility is trend-
following speculation (the systematic analysis of which being the subject of
another paper): the purely speculative return process, namely the RCAR
1 (J ),Hhtht t t h t tr n r 1 genetrates a power law (| | )tr x Cx with
the exponent that depends solely on the joint distribution of { },ht the
trend-following coefficients, and the ratio of the number of speculators to
liquidity. It can be shown that the less liquid the market is on average, the

12
lower is the tail exponent , hence the more extreme is volatility5, as should
be expected. The advent of exogenous news, on the other hand, is essential
for clustered volatility, which the purely speculative model cannot explain,
as noted earlier. That is, any such autorregresive model, and for any arbitary
function ,f cov[ ( ), ( )],t t hf r f r if well-defined, decays exponentially with the
lag h (Mikosch & Starica, 2000; Basrak et al., 2002). So volatility, whether
measured as | |,tr 2,r or any other function f , cannot be clustered in this
version of the model.
In sum, this paper suggests a simple explanation for excess and clustered
volatility in financial markets. Excess volatility means that that price
fluctuations are too high given the underlying fundamentals; clustered
volatility simply reflects, in this model, the flow of exogenous news
affecting the traders’ expectations.
References
Basrak, B., Davis, R. A., & Mikosch, T. (2002). Regular variation of GARCH processes. Stochastic processes and their applications, 99(1), 95-115.
Beekhuizen, P., & Hallerbach, W. G. (2017). Uncovering Trend Rules. The Journal of Alternative Investments, 20(2), 28-38.
5 There is an inverse relationship between the extremeness of a power-law and its tail exponent alpha: a very large alpha corresponds in fact to mild exponential tail; an alpha not greater than 2 has infinite variance, and below 1, an even infinite mean.

13
Bouchaud, J.-P. (2011). The endogenous dynamics of markets: price impact, feedback loops and instabilities. Lessons from the Credit Crisis. Risk Publications.
Bouchaud, J.-P., & Challet, D. (2016). Why have asset price properties changed so little in 200 years. arXiv preprint arXiv:1605.00634.
Buraczewski, D., Damek, E., & Mikosch, T. (2016). Stochastic Models with
Power-Law Tails: Springer.
Clauset, A., Shalizi, C. R., & Newman, M. E. (2009). Power-law distributions in empirical data. SIAM review, 51(4), 661-703.
Cont, R. (2007). Volatility clustering in financial markets: empirical facts and agent-based models. In Long memory in economics (pp. 289-309):
Springer.
Fama, E. F. (1963). Mandelbrot and the stable Paretian hypothesis. Journal of business, 420-429.
Gabaix, X. (2008). Power laws in economics and finance. Retrieved from
Gabaix, X. (2016). Power laws in economics: An introduction. The Journal of Economic Perspectives, 30(1), 185-205.
Gopikrishnan, P., Meyer, M., Amaral, L. N., & Stanley, H. E. (1998). Inverse cubic law for the distribution of stock price variations. The European Physical Journal B-Condensed Matter and Complex Systems, 3(2), 139-140.
Inoua, S. M. (2016). Trend-following speculation and fiancial power law (formerly: Speculation and power law). arXiv preprint arXiv:1612.08705.
Kesten, H. (1973). Random difference equations and renewal theory for products of random matrices. Acta Mathematica, 131(1), 207-248.
Klüppelberg, C., & Pergamenchtchikov, S. (2004). The tail of the stationary distribution of a random coefficient AR (q) model. Annals of Applied Probability, 971-1005.
Mandelbrot, B. (1963). The variation of certain speculative prices. The Journal of Business, 36.

14
Mikosch, T., & Starica, C. (2000). Limit theory for the sample autocorrelations and extremes of a GARCH (1, 1) process. Annals of Statistics, 1427-1451.
Mikosch, T., & Starica, C. (2003). Long-range dependence effects and ARCH modeling. Long–Range Dependence: Theory and Applications. Birkhauser, Boston, 439-459.
Milgrom, P., & Stokey, N. (1982). Information, trade and common knowledge. Journal of Economic Theory, 26(1), 17-27.
Newman, M. E. (2005). Power laws, Pareto distributions and Zipf's law. Contemporary physics, 46(5), 323-351.
Plerou, V., Gabaix, X., Stanley, H. E., & Gopikrishnan, P. (2006). Institutional investors and stock market volatility. Quaterly journal of economics(2), 461-504.
Samanidou, E., Zschischang, E., Stauffer, D., & Lux, T. (2007). Agent-based models of financial markets. Reports on Progress in Physics, 70(3), 409.
Tirole, J. (1982). On the possibility of speculation under rational expectations. Econometrica: Journal of the Econometric Society, 1163-1181.