Newport City Council 2019/20 Revenue Budget · Newport City Council –2019/20 Revenue Budget The...
42
Newport City Council – 2019/20 Revenue Budget The information contained within this document is correct as at February 2019 76% of the Council’s net budget is funded by Welsh Government
Transcript of Newport City Council 2019/20 Revenue Budget · Newport City Council –2019/20 Revenue Budget The...

Newport City Council – 2019/20 Revenue Budget
The information contained within this document is correct as at February 2019
76% of the Council’s net budget is funded by Welsh Government

Gross budget £424m - How will this be spent:
Employees £168m
Third Party Payments £105m (i)
Supplies & Services £45m (iii)
Transfer Payments £66m (ii)
Premises £24m
Budget £424m
Capital Financing £8m
Transport £8m
(i) Third party payments – payments to third party providers of Local Authority Services, e.g. Newport Live leisure trust, out of county residential placements, Gwent coroner, South Wales Fire Authority, joint music service;
(ii) Transfer payments – Housing benefit rents, Council tax rebates(iii) Supplies & Services – direct costs to the authority for its own supplies and services, e.g. services provided by social care
Newport City Council – 2019/20 Gross Revenue Budget

PEOPLE DIRECTORATE – 2019/20 Budget
2019/20 Savings to be delivered
MTFP Savings to be delivered 2019/20
£m
Adult & Community Services 0.8
Children & Young People services 0.8
Schools * -
Education 0.4
Total 2.0
2019/20 Capital Budget
Capital Budget (as per Feb Council) 2019/20
£m
Adult & Community Services 0.2
Children & Young People services 0.9
Schools 17.7
Education -
Total 18.8
* Inherent need for schools to make savings in 2019/20 in order to manage within allocated budget.

PEOPLE DIRECTORATE – 2019/20 BudgetAdult & Community Services
Budget Analysis by Subjective Heading 2019/20
£m
Employees 14.6
Premises 0.2
Transport 0.3
Supplies & Services 4.3
Third Party Payments 53.0
Gross Budget 72.4
Income
Fees & Charges -9.8
Grants -16.2
Net Budget 46.4
FTEs by Service 2019/20
Care and Support Provision 213.1
CRT Frailty 42.6
First Contact Prevention 31.2
Home First 5.0
Integrated Mental Health 9.2
Integrated Occupational Therapy 9.4
Managed Care 30.4
Service Development & Commissioning 58.0
Total FTE 398.9
Third Party Payments £53m
Employees £15m
Gross Budget £72m
Supplies & Services £4m

PEOPLE DIRECTORATE
2019/20 Budgets by Activity Code and Theme Adult & Community Services

PEOPLE DIRECTORATE – 2019/20 BudgetChildren & Young People Services
Budget Analysis by Subjective Heading 2019/20
£m
Employees 12.8
Premises 0.1
Transport 0.2
Supplies & Services 1.8
Third Party Payments 13.0
Gross Budget 27.9
Income
Fees & Charges * -0.4
Grants -3.0
Net Budget 24.5
FTEs by Service 2019/20
Children’s Teams 42.7
Integrated Family Support Services 69.0
Operations 53.1
Resources 104.7
Safeguarding 23.5
Total FTE 293.0
Gross Budget £28m
Employees £13m
Third Party Payments £13m
Supplies & Services £2m
* Partner contributions from external bodies

PEOPLE DIRECTORATE
2019/20 Budgets by Activity Code and ThemeChildren & Young People Services

PEOPLE DIRECTORATE – 2019/20 BudgetEducation
Budget Analysis by Subjective Heading 2019/20
£m
Employees 7.3
Premises 0.4
Transport 2.3
Supplies & Services 3.7
Third Party Payments 5.9
Gross Budget 19.6
Income
Fees & Charges -2.5
Grants -2.9
Net Budget 14.2
FTEs by Service 2019/20
Engagement and Learning 73.5
Inclusion 37.0
Resources and Planning 15.7
Total FTE 126.2
Gross Budget £20m
Transport £3m
Third Party Payments £6m
Employees £7m
Supplies & Services £4m

PEOPLE DIRECTORATE – 2019/20 BudgetSchools
Budget Analysis by Subjective Heading 2019/20
£m
Employees 88.5
Premises 8.3
Transport 0.6
Supplies & Services 14.2
Third Party Payments 2.3
Gross Budget 113.9
Income
Fees & Charges -0.4
Grants -17.0
Net Budget 96.5
Net Budget Analysis by Objective Heading 2019/20
£m
Nursery 0.4
Primary 50.5
Secondary 40.7
Special 4.9
Net Budget 96.5
FTEs by Service 2019/20
Nursery 12.8
Primary 1,339.7
Secondary 948.2
Special 121.0
Total FTE 2,421.7
Gross Budget £114m
Employees £89m
Premises £8m
Supplies & Services£14m
Third Party Payments £2m
* Indicative Individual School Budgets (ISB) and FTEs as at March 2019
Transport £1m

PEOPLE DIRECTORATE2019/20 Budgets by Activity Code and Theme
Education (Inc Schools)

PLACE DIRECTORATE – 2019/20 Budget
2019/20 Savings to be delivered
MTFP Savings to be delivered 2019/20
£m
Regeneration, Investment & Housing 0.4
City Services 0.7
Total 1.1
2019/20 Capital Budget
Capital Budget (as per Feb Council) 2019/20
£m
Regeneration, Investment & Housing 14.2
City Services 13.1
Total 27.3

PLACE DIRECTORATE – 2019/20 Budget
Gross Budget £30m
Employees £13m
Premises £8m
Supplies & Services £5m
Regeneration, Investment & Housing
Budget Analysis by Subjective Heading 2019/20
£m
Employees 13.4
Premises 8.4
Transport 0.1
Supplies & Services 5.0
Third Party Payments 3.1
Capital Financing 0.3
Gross Budget 30.3
Income
Fees & Charges -5.8
Grants -14.4
Net Budget 10.0
FTEs by Service 2019/20
Community Regeneration 272.4
Development Services 38.5
Museums and Heritage 41.9
Strategic Housing 43.4
Total FTE 396.2
Third Party Payments £3m

PLACE DIRECTORATE2019/20 Budgets by Activity Code and Theme
Regeneration, Investment and Housing

PLACE DIRECTORATE – 2019/20 Budget
Employees £14m
Supplies & Services £7m
Premises £4m
City Services
Budget Analysis by Subjective Heading 2019/20
£m
Employees 14.3
Premises 4.4
Transport 4.8
Supplies & Services 7.2
Third Party Payments 6.0
Gross Budget 36.7
Income
Fees & Charges -7.4
Grants -5.6
Net Budget 23.7
FTEs by Service 2019/20
City Services Strategic Delivery 6.0
Customer Services 80.7
Environment and Leisure 75.6
Highways and Engineering 97.7
Waste and Recycling 119.8
Total FTE 379.8
Gross Budget £37m
Transport £5m
Third Party Payments £6m

PLACE DIRECTORATE2019/20 Budgets by Activity Code and Theme
City Services

CORPORATE SERVICES DIRECTORATE – 2019/20 Budget
2019/20 Savings to be delivered
MTFP Savings to be delivered 2019/20
£m
Directorate -
Finance -
People & Business Change 0.3
Law & Regulation -
Total 0.3
2019/20 Capital Budget
Capital Budget (as per Feb Council) 2019/20
£m
Directorate -
Finance -
People & Business Change 10.7
Law & Regulation -
Total 10.7
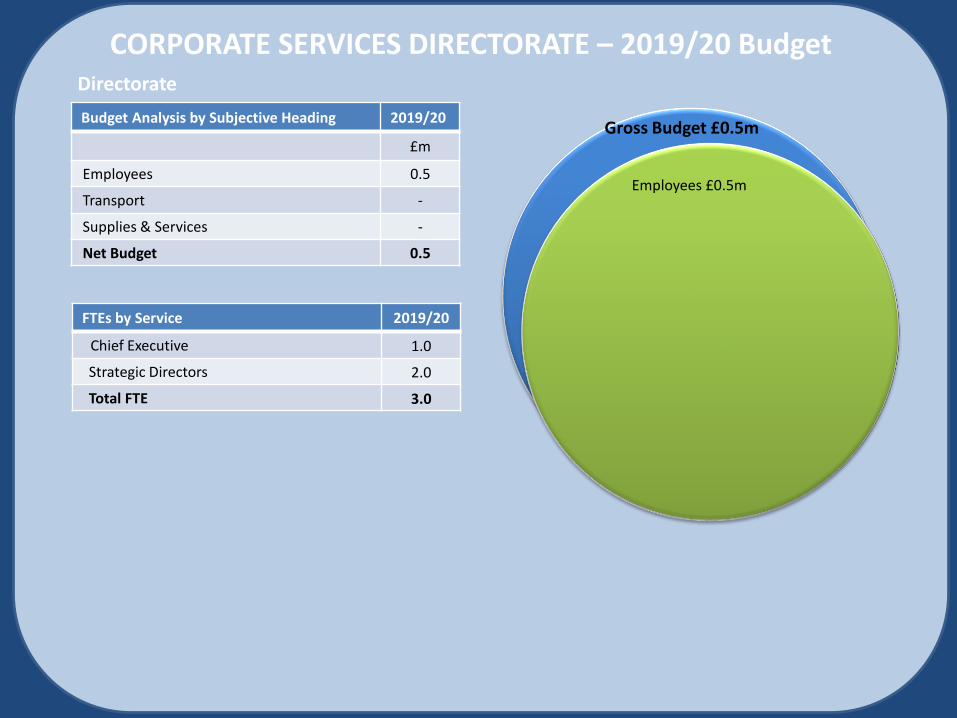
CORPORATE SERVICES DIRECTORATE – 2019/20 BudgetDirectorate
Gross Budget £0.5m
Employees £0.5m
Budget Analysis by Subjective Heading 2019/20
£m
Employees 0.5
Transport -
Supplies & Services -
Net Budget 0.5
FTEs by Service 2019/20
Chief Executive 1.0
Strategic Directors 2.0
Total FTE 3.0

CORPORATE SERVICES DIRECTORATE – 2019/20 BudgetFinance
Gross Budget £4m
Employees £3m
Supplies & Services £1m
Budget Analysis by Subjective Heading 2019/20
£m
Employees 3.2
Supplies & Services 0.8
Gross Budget 4.0
Income
Fees & Charges -0.4
Grants -0.3
Net Budget 3.3
FTEs by Service 2019/20
Accountancy 42.4
Income Collection 24.5
Internal Audit 6.0
Procurement & Payments 11.5
Total FTE 84.4

CORPORATE SERVICES DIRECTORATE – 2019/20 BudgetPeople & Business Change
Gross Budget £9mBudget Analysis by Subjective Heading 2019/20
£m
Employees 4.6
Supplies & Services 2.0
Third Party Payments 2.8
Gross Budget 9.4
Income
Fees & Charges -1.2
Grants -0.6
Net Budget 7.6
FTEs by Service 2019/20
Business Development 8.1
Corporate HR 56.3
Digital Services 17.0
Newport Intelligence Hub 10.6
Partnership Support Team 25.3
Total FTE 117.3
Employees £4m
Third Party Payments£3m
Supplies & Services £2m

CORPORATE SERVICES DIRECTORATE – 2019/20 BudgetLaw & Regulation (Includes Democratic Services and Legal Support)
Gross Budget £9m
Employees £7m
Supplies & Services £2m
Budget Analysis by Subjective Heading 2019/20
£m
Employees 6.8
Premises 0.1
Supplies & Services 2.5
Gross Budget 9.4
Income
Fees & charges -1.6
Grants -0.5
Net Budget 7.3
FTEs by Service 2019/20
Democratic Services & Communications 21.2
Electoral Registration 3.8
Legal 32.5
Public Protection 87.5
Registration Services 12.1
Total FTE 157.1

CORPORATE SERVICES DIRECTORATE
2019/20 Budgets by Activity Code and Theme
Finance
Law and Regulation

CORPORATE SERVICES DIRECTORATE
2019/20 Budgets by Activity Code and Theme
People and Business Change

NON SERVICE – 2019/20 Gross BudgetBudget Analysis by Subjective Heading 2019/20
£m
Employees * 1.6
Supplies & Services 7.5
Third Party Payments 16.8
Transfer Payments 66.3
Capital Financing 7.5
Gross Budget 99.7
Income
Grants (Housing Benefits) -53.2
Net Budget 46.5
Gross Budget £100m
Transfer Payments £66m
Third Party Payments £17m
Capital Financing£8m
Employees £2m
• £1.6m employee budgets relate to historic pension deficit contribution
Supplies & Services £7m
MTRP Savings to be Delivered 2019/20
£m
Non Service 3.0
Total 3.0
Budget Analysis by Objective Heading 2019/20
£m
Capital Financing – Minimum Revenue Provision (MRP) 7.5
Capital Financing – Interest Payable 7.1
Capital Financing – Private Finance Initiative (PFI) 8.5
Council Tax Reduction Scheme (CTRS) 12.6
Interest Receivable -0.1
Levies & Contributions 8.3
Other 2.6
Net Budget 46.5

Projected Earmarked Reserves (1)
Reserve
Balance at 31-Mar-18
£'000
Balance at 31-Mar-19
£'000
Balance at 31-Mar-20
£'000
Balance at 31-Mar-21
£'000
Balance at 31-Mar-22
£'000
Council Fund: (6,500) (6,500) (6,500) (6,500) (6,500)
Balances held by schools for future use (3,857) (1,937) (1,937) (1,937) (1,937)
Earmarked Reserves:
Insurance Reserve (1,594) (1,294) (1,294) (1,294) (1,294)
MMI Insurance Reserve (602) (602) (602) (602) (602)
Health & Safety (16) - - - -
Music Service (124) (35) (35) (35) (35)
Education Achievement Service (92) (92) (92) (92) (92)
Schools Redundancies (708) (708) - - -
Friars Walk (8,405) (7,905) (7,500) (7,500) (7,000)
European Funding I2A & CFW (173) (190) (190) (190) (190)
Metro Bus (9) (9) (9) - -
Pay Reserve (1,418) (1,418) (1,418) (1,418) (1,418)
GEMS Redundancies (78) (76) (76) (76) (76)
Sub Total - Risk Reserves (13,219) (12,328) (11,215) (11,206) (10,706)
Capital Expenditure (5,761) (5,145) (3,645) (2,145) (884)
School Works (347) (247) (247) (247) (247)
School Reserve Other (924) - - - -
Investment Reserve (966) (491) - - -
Invest to Save (9,557) (10,369) (9,889) (9,529) (9,319)
Super Connected Cities (554) (426) (306) (186) (66)
Landfill (fines reserve) (345) (345) (175) (175) (175)
Usable Capital Receipts (8,901) (5,412) (4,912) (4,412) (3,912)
City Services Manager Support (200) (148) - - -
Sub Total - Enabling Reserves (27,555) (22,583) (19,174) (16,694) (14,603)
STEP School Computers (357) - - - -
Municipal Elections (54) (91) (128) (165) (202)
Local Development Plan (599) (629) (456) (356) (256)

Projected Earmarked Reserves (2)
The reserve balances are estimated as at March 2019. These are estimated based on known or planned contributions to/from revenue.
Reserve
Balance at 31-Mar-18
£'000
Balance at 31-Mar-19
£'000
Balance at 31-Mar-20
£'000
Balance at 31-Mar-21
£'000
Balance at 31-Mar-22
£'000
Glan Usk PFI (1,605) (1,595) (1,575) (1,545) (1,505)
Southern Distributor Road PFI (44,515) (44,175) (43,697) (43,147) (42,597)
Building Control (48) (122) (122) (122) (122)
Sub Total - Smoothing Reserves (47,179) (46,613) (45,979) (45,336) (44,683)
Works of art (21) (21) (21) (21) (21)
Theatre & Arts Centre (232) (232) (232) (232) (232)
Cymorth Income (33) - - - -
Blaen Y Pant Remodelling (Formerly Pupil Referral Unit) (60) - - - -
Gypsy and Traveller Site (7) - 7 7 7
Homelessness Prevention (38) (38) - - -
Environmental Health - Improve Air Quality (49) (49) - - -
Refurbishment of a Children / Older People Homes (62) - - - -
Apprenticeship Scheme (84) (49) - - -
City Economic Development Reserve (90) (45) - - -
Welsh Language Standards (174) (114) (54) - -
YS Dilapidation Costs Information Shop (41) - - - -
Port Health (8) (13) (13) (13) (13)
Customer Relationship Management (CRM) Project (681) - - - -
Welsh Community Care Information System (WCCIS) (38) - - - -
Events (190) (60) (30) - -
MTFP Reserve (2,715) (1,515) (615) (315) (315)
Development of Leisure Masterplan (15) - - - -
Voluntary Sector Grants (66) (22) (22) (22) (22)
Bus Wifi (35) (17) - - -
Sub Total - Other Reserves (4,639) (2,175) (980) (596) (596)
Reserves Total (102,948) (92,135) (85,784) (82,268) (79,024)

Projected Earmarked Reserves (3)
Key Messages - Based on the 2019/20 estimates;
Of the £92m total reserves;
• £46m (50%) relates to PFI. This represents the future capital financing budget to paythe contractual costs of the PFI borrowing;
• £12m (13%) covers financial risks which the authority is exposed to, including thosewhich are required under prudent accounting regulations, such as insurance reserve;
• £8m (9%) represents the minimum level of general fund reserves and school reserves;
• £5m (5%) usable capital receipts which can only be used for capital expenditure andcommitted to funding Band A and B Education projects currently;
• £2m (2%) of reserves have been committed to balancing the general budget;
£73m (79%) of the councils reserves which are mainly committed and/ or reserved forspecific uses
• The balance of £19m (21%) is more general in nature and represented mainly by investto save and capital projects funding.

2018/19 – 2022/23 Capital Programme (1)

2018/19 – 2022/23 Capital Programme (2)

2018/19 – 2022/23 Capital Programme (3)

Newport City Council – Revenue Support Grant (RSG) and Council Tax since 2015/16
Planning Assumptions• Unadjusted RSG (funding received) remains cash flat over the life of the current MTFP (i.e. 20/21 to 22/23)• Council Tax to increase by 4% each year from 2020/21

Each year, Welsh Government transfer specific grants into RSG. These do not represent additional monies as they simply replacegrants awarded in previous years. The unadjusted RSG excludes these transfers and is a true reflection of the resource availablefrom which to deliver existing services.
The graphs above (left to right) represent:
a) The annual impact of transfers into RSG – the most significant transfers taking place in 2016/17 and 2018/19;b) The cumulative impact of these transfers over the same period.
Whilst the Council will receive £214m RSG in 2019/20, graph b) highlights the real (cumulative) impact of the transfers with over£7m of grants being transferred into RSG since 2015/16. Therefore, cash to the Council has decreased by £2m between 2015/16and 2019/20 (£209m reducing to £207m) before taking account of the change in prices for goods and services over this time(Retail Price Index - RPI). These factors represent the financial challenge that the Council faces.
Newport City Council – RSG Settlements since 2015/16

Newport City Council – MTFP Overview by Service Area
Service Area Inflation Pressures SavingsNet growth/
(saving)
£'000 £'000 £'000 £'000
Children and Young People 1,092 5,911 3,078- 3,925
Adult and Community Services 3,029 5,916 3,316- 5,629
Education 810 2,070 1,416- 1,464
Schools - 7,849 575- 7,274
Regeneration, Investment and Housing 816 1,315 1,432- 699
City Services 1,676 3,036 1,758- 2,954
Directorate 23 7 - 30
Finance 158 41 371- 172-
People and Business Change 517 863 753- 627
Law and Regulation 338 103 421- 20
Non Service 617 4,092 8,136- 3,427-
Total 9,076 31,203 21,256- 19,023
MTFP Overview - 2017/18 to 2019/20
• The majority of the net growth has been invested in adults and children’s social care andschools – combined investment of £16.8m over the last 3 years (including transfers into RSG)
• Corporate Services and Regeneration, Investment and Housing have more or less remainedconsistent over the period
• The increased budget over this period (£19m) has been funded mainly (two thirds) by counciltax increases. The council tax increase has come from an increase in council tax base as wellas an increase in the rate itself (see RSG and council tax levels table - ‘Newport City Council –RSG and Council Tax since 2015/16’).
Includes RSG transfers and new responsibilities
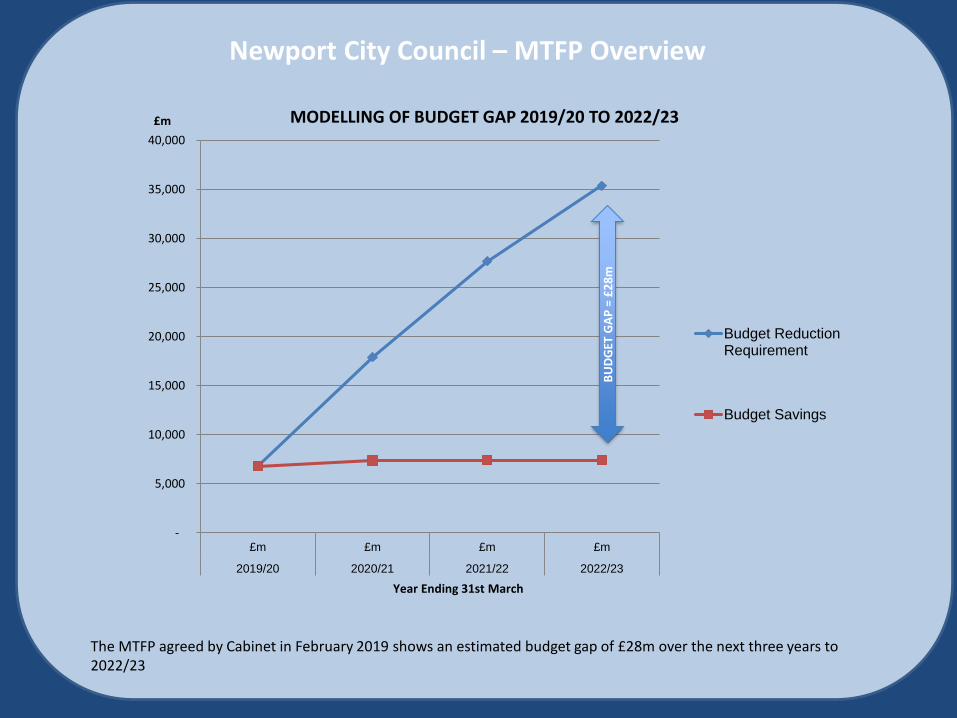
Newport City Council – MTFP Overview
The MTFP agreed by Cabinet in February 2019 shows an estimated budget gap of £28m over the next three years to 2022/23
-
5,000
10,000
15,000
20,000
25,000
30,000
35,000
40,000
£m £m £m £m
2019/20 2020/21 2021/22 2022/23
£m
Year Ending 31st March
MODELLING OF BUDGET GAP 2019/20 TO 2022/23
Budget ReductionRequirement
Budget Savings
BU
DG
ETG
AP
= £
28
m

Local Authority Comparisons

Band D Council Tax by Billing Authority 2013/14 – 2019/20
County Council excluding community councils and police precept Source: Stats Wales
Council Tax Base2015-16 2016-17 2017-18 2018-19 2019-20
Newport Council Tax Base 55,560.04 56,145.64 57,619.96 58,465.51 59,165.99
Annual increase (%) 1.08% 1.05% 2.63% 1.47% 1.20%

2019/20 Council Tax Band D Comparisons

Newport City Council Bandings 2009/10 – 2019/20
This represents the Council Tax excluding Community Councils and Police precepts.
Whilst the Council Tax levels have increased year on year, these increases are lower than the anticipated increase assumed by Welsh Government when calculating the Standard Spending Assessment (see following slides).
57% of the properties in Newport are Bands A, B and C.

Standard Spending Assessment by Authority 2018/19 – 2019/20
Local Authority 2018-19 2019-20
2019/20
Net
Budget
Variance
above/(below)
SSA
2019-20 Rank
(highest to
lowest)
Rhondda Cynon Taf 455.02 465.65 478.93 13.28 1.00
Neath Port Talbot 269.37 275.66 288.17 12.51 2.00
Bridgend 255.26 260.15 270.51 10.36 3.00
Gwynedd 234.69 239.02 247.54 8.52 4.00
Blaenau Gwent 134.63 137.45 143.87 6.42 5.00
Swansea 426.54 436.81 442.93 6.12 6.00
Merthyr Tydfil 112.37 114.98 120.20 5.22 7.00
Powys 246.91 250.78 255.06 4.28 8.00
Monmouthshire 147.47 150.53 153.87 3.34 9.00
Denbighshire 189.98 193.78 196.54 2.76 10.00
Flintshire 264.33 269.13 271.35 2.22 11.00
Ceredigion 138.27 141.47 143.39 1.92 12.00
Conwy 213.02 216.48 218.28 1.80 13.00
Torfaen 171.02 175.08 176.85 1.77 14.00
Isle of Anglesey 131.70 134.02 135.15 1.13 15.00
Carmarthenshire 346.06 353.03 350.96 -2.07 16.00
The Vale of Glamorgan 222.84 228.10 225.86 -2.24 17.00
Wrexham 238.04 242.95 236.59 -6.36 18.00
Newport 281.98 288.94 280.61 -8.33 19.00
Pembrokeshire 226.40 231.73 223.38 -8.35 20.00
Cardiff 611.41 628.82 620.44 -8.38 21.00
Caerphilly 339.57 345.58 336.53 -9.05 22.00
Source: Stats Wales

Standard Spending Assessment by Authority 2019/20

What Changes would be required in Newport to achieve Wales average Band D and SSA?
(i) Welsh Government standard Band D – figure that Welsh Government use in calculation of SSA distribution of grant - £1,246.94.Any council tax level over and above this would lead to a council spending over their SSA.
Budget Requirement - Band D and SSA
Newport
2019/20
Band D
(£)
Wales
Average
(£)
%
Uplift
SSA
(£m)
Increase
in
Band D
(£)
Uplifted
Band D
(£)
% uplift required to achieve 19/20: (i) Wales Average 1,120.04 1,319.70 18%
(ii) Newport SSA 288.94
Newport City Council net budget 280.61
Shortfall 8.33
Increase in Band D required to achieve
shortfall (2019/20 tax base)140.79
Council Tax Band D required 1,260.83
Band D increase (%) 13%

Local Authority Comparisons
Key Messages:
• Newport would need to increase council tax by 13% in order to achieve their standard spendingassessment (SSA) and by 18% to achieve the Welsh average band D level of council tax;
• If council tax was increased by 13%, this would result in additional income of c£6.9m;
• There are currently 5 councils in Wales that are spending significantly under their SSA. Thismeans that until band D council tax is at least £1,246.94 (2019/20 Welsh Government standardband D) these councils will be under SSA.

Glossary of termsRSG Revenue Support Grant
Gross Budget Total resource available in any given time period
Net Budget Resource available in any given time period net of income – i.e.cost to the Council.
The difference between gross and net is the income that is availableto the Council through fees & charges and specific grants.
MTFP Medium Term Financial Projections
FTE Full time equivalent (staff numbers)
SSA Standard Spending Assessments are notional calculations of whateach Council needs to spend to provide a standard level of service
PFI Private Finance Initiative is a way of creating “public-privatepartnerships” (PPPs) by funding infrastructure projects with privatecapital
Tax Base Number of Band D equivalent dwellings in any given year
MRP Minimum revenue provision is the means by which capital expenditure isfinanced by borrowing or credit arrangements. Local Authorities are requiredeach year to set aside some of their revenues as provision for this debt
RPI RPI is the Retail Price Index which measures change in prices of a basket of goodsand services over a period of time