Newmarket Gold Investor Presentation May Metals Investment Forum
Upload
adnet-communicationsCategory
view
1.376download
2
TSX:NMI
December 2015
Exceptional Team, Solid Production,Significant Valuation Upside
2TSX:NMI
Forward-looking StatementsCertain information set forth in this presentation contains “forward-looking statements”, and “forward-lookinginformation under applicable securities laws. Except for statements of historical fact, certain information containedherein constitutes forward-looking statements, which include the Company’s expectations about its business andoperations, and are based on the Company’s current internal expectations, estimates, projections, assumptions andbeliefs, which may prove to be incorrect. Some of the forward-looking statements may be identified by words such as“will”, “expects”, “anticipates”, “believes”, “projects”, “plans”, and similar expressions. These statements are notguarantees of future performance or outcomes and undue reliance should not be placed on them. Forward-lookingstatements are based on the opinions and estimates of management as of the date such statements are made and theyare subject to known and unknown risks, uncertainties and other factors that may cause the actual results, level ofactivity, performance or achievements of the Company to be materially different from those expressed or implied bysuch forward-looking statements or forward-looking information. Although management of the Company hasattempted to identify important factors that could cause actual results to differ materially from those contained inforward-looking statements or forward-looking information, there may be other factors that cause results not to be asanticipated, estimated or intended. There can be no assurance that such statements will prove to be accurate, as actualresults and future events could differ materially from those anticipated in such statements. Accordingly, readers shouldnot place undue reliance on forward-looking statements and forward-looking information. The Company does notundertake to update any forward-looking statements or forward-looking information that are included in thispresentation or incorporated by reference herein, except in accordance with applicable securities laws.
3TSX:NMI
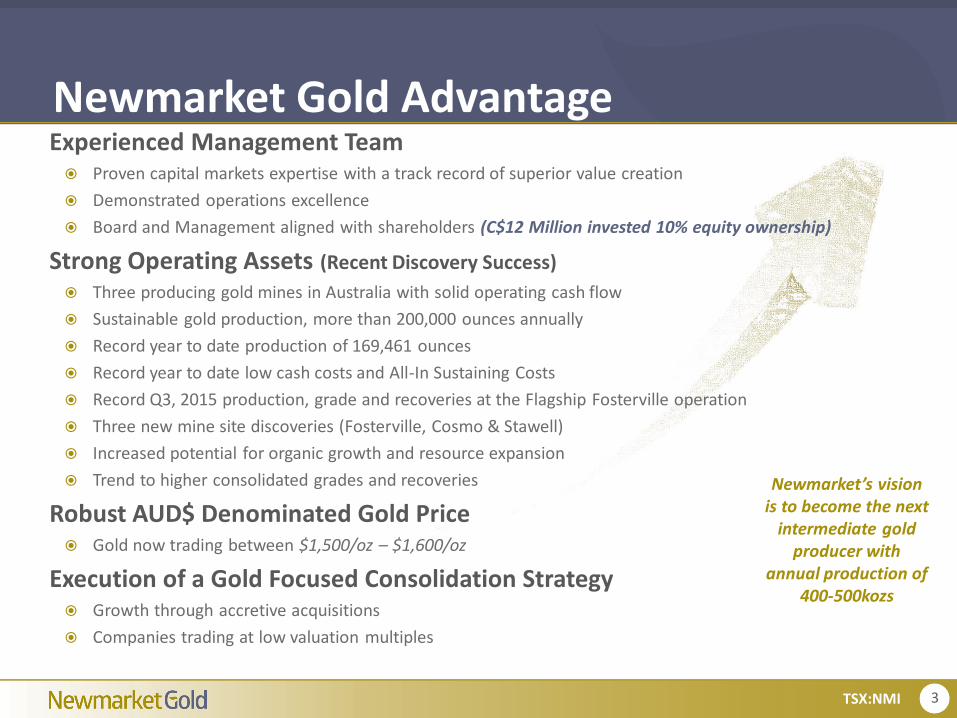
Newmarket Gold AdvantageExperienced Management Team Proven capital markets expertise with a track record of superior value creation
Demonstrated operations excellence
Board and Management aligned with shareholders (C$12 Million invested 10% equity ownership)
Strong Operating Assets (Recent Discovery Success)
Three producing gold mines in Australia with solid operating cash flow
Sustainable gold production, more than 200,000 ounces annually
Record year to date production of 169,461 ounces
Record year to date low cash costs and All-In Sustaining Costs
Record Q3, 2015 production, grade and recoveries at the Flagship Fosterville operation
Three new mine site discoveries (Fosterville, Cosmo & Stawell)
Increased potential for organic growth and resource expansion
Trend to higher consolidated grades and recoveries
Robust AUD$ Denominated Gold Price Gold now trading between $1,500/oz – $1,600/oz
Execution of a Gold Focused Consolidation Strategy Growth through accretive acquisitions
Companies trading at low valuation multiples
Newmarket’s vision is to become the next
intermediate gold producer with
annual production of 400-500kozs
4TSX:NMI
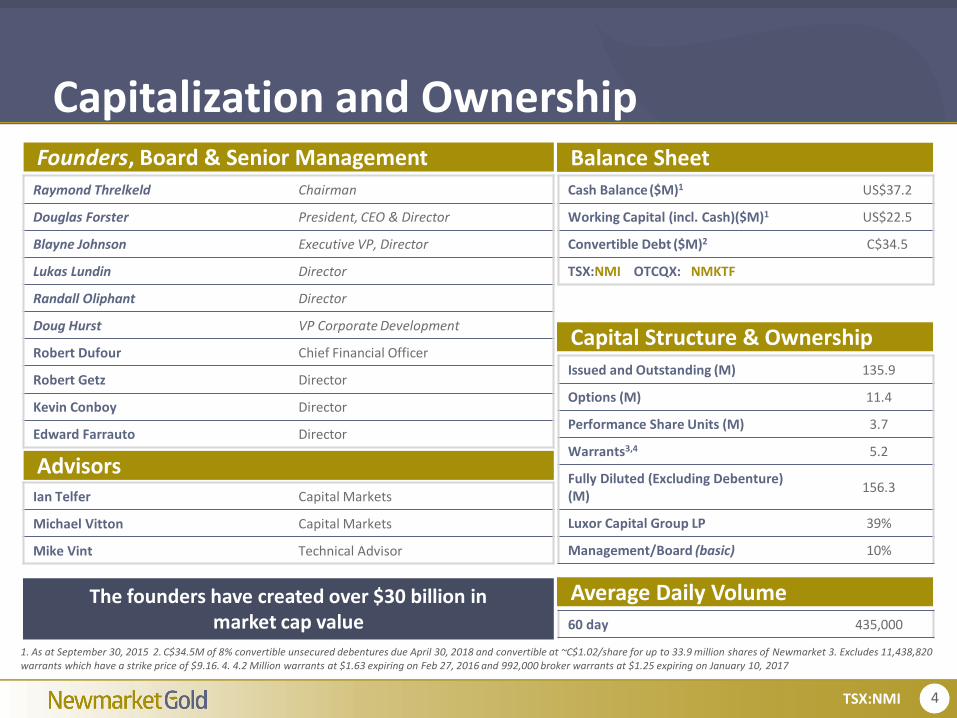
Capitalization and Ownership
Cash Balance ($M)1 US$37.2
Working Capital (incl. Cash)($M)1 US$22.5
Convertible Debt ($M)2 C$34.5
TSX:NMI OTCQX: NMKTF
1. As at September 30, 2015 2. C$34.5M of 8% convertible unsecured debentures due April 30, 2018 and convertible at ~C$1.02/share for up to 33.9 million shares of Newmarket 3. Excludes 11,438,820 warrants which have a strike price of $9.16. 4. 4.2 Million warrants at $1.63 expiring on Feb 27, 2016 and 992,000 broker warrants at $1.25 expiring on January 10, 2017
Raymond Threlkeld Chairman
Douglas Forster President, CEO & Director
Blayne Johnson Executive VP, Director
Lukas Lundin Director
Randall Oliphant Director
Doug Hurst VP Corporate Development
Robert Dufour Chief Financial Officer
Robert Getz Director
Kevin Conboy Director
Edward Farrauto Director
Balance SheetFounders, Board & Senior Management
AdvisorsIan Telfer Capital Markets
Michael Vitton Capital Markets
Mike Vint Technical Advisor
Issued and Outstanding (M) 135.9
Options (M) 11.4
Performance Share Units (M) 3.7
Warrants3,4 5.2
Fully Diluted (Excluding Debenture) (M)
156.3
Luxor Capital Group LP 39%
Management/Board (basic) 10%
Capital Structure & Ownership
The founders have created over $30 billion in market cap value
Average Daily Volume60 day 435,000
5TSX:NMI
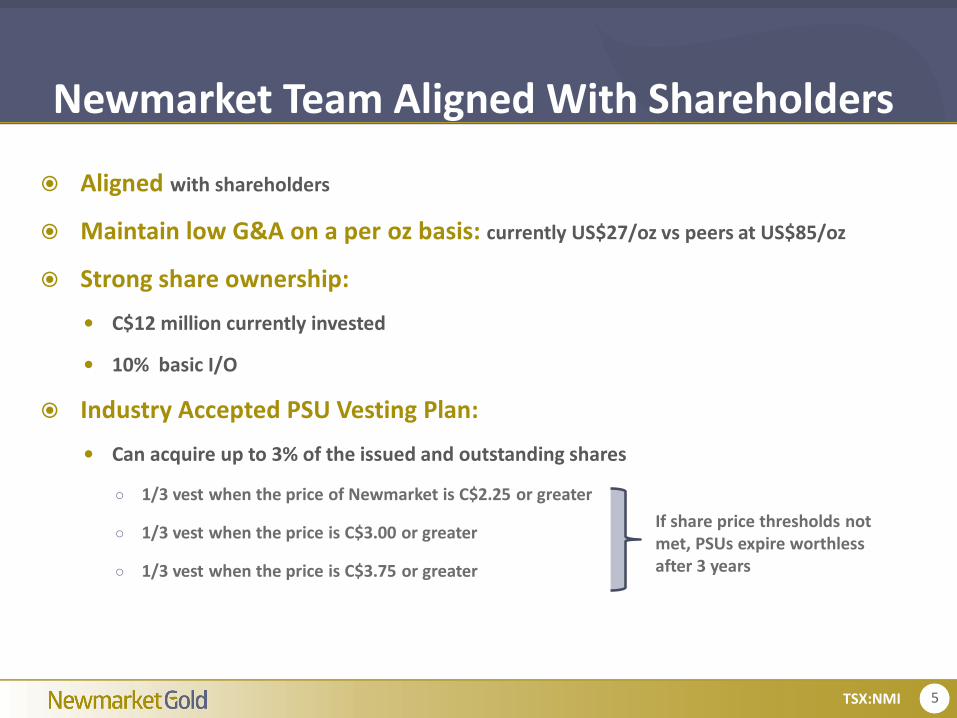
Aligned with shareholders
Maintain low G&A on a per oz basis: currently US$27/oz vs peers at US$85/oz
Strong share ownership:
C$12 million currently invested
10% basic I/O
Industry Accepted PSU Vesting Plan:
Can acquire up to 3% of the issued and outstanding shares
○ 1/3 vest when the price of Newmarket is C$2.25 or greater
○ 1/3 vest when the price is C$3.00 or greater
○ 1/3 vest when the price is C$3.75 or greater
Newmarket Team Aligned With Shareholders
If share price thresholds not met, PSUs expire worthless after 3 years
6TSX:NMI
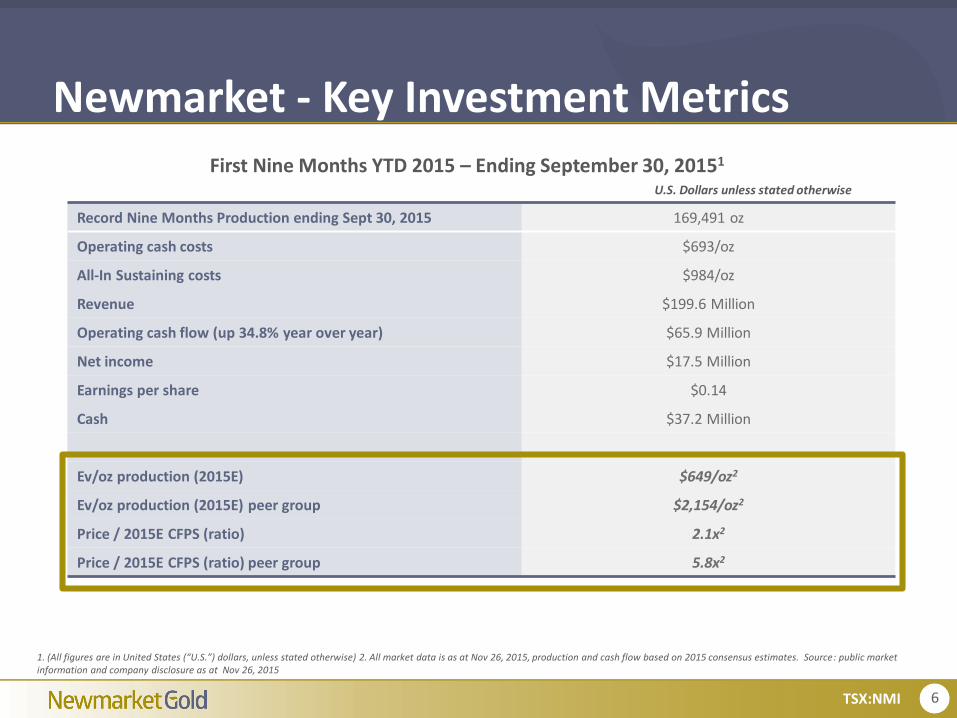
Newmarket - Key Investment Metrics
1. (All figures are in United States (“U.S.”) dollars, unless stated otherwise) 2. All market data is as at Nov 26, 2015, production and cash flow based on 2015 consensus estimates. Source: public market information and company disclosure as at Nov 26, 2015
First Nine Months YTD 2015 – Ending September 30, 20151
Record Nine Months Production ending Sept 30, 2015 169,491 oz
Operating cash costs $693/oz
All-In Sustaining costs $984/oz
Revenue $199.6 Million
Operating cash flow (up 34.8% year over year) $65.9 Million
Net income $17.5 Million
Earnings per share $0.14
Cash $37.2 Million
Ev/oz production (2015E) $649/oz2
Ev/oz production (2015E) peer group $2,154/oz2
Price / 2015E CFPS (ratio) 2.1x2
Price / 2015E CFPS (ratio) peer group 5.8x2
U.S. Dollars unless stated otherwise
7TSX:NMI
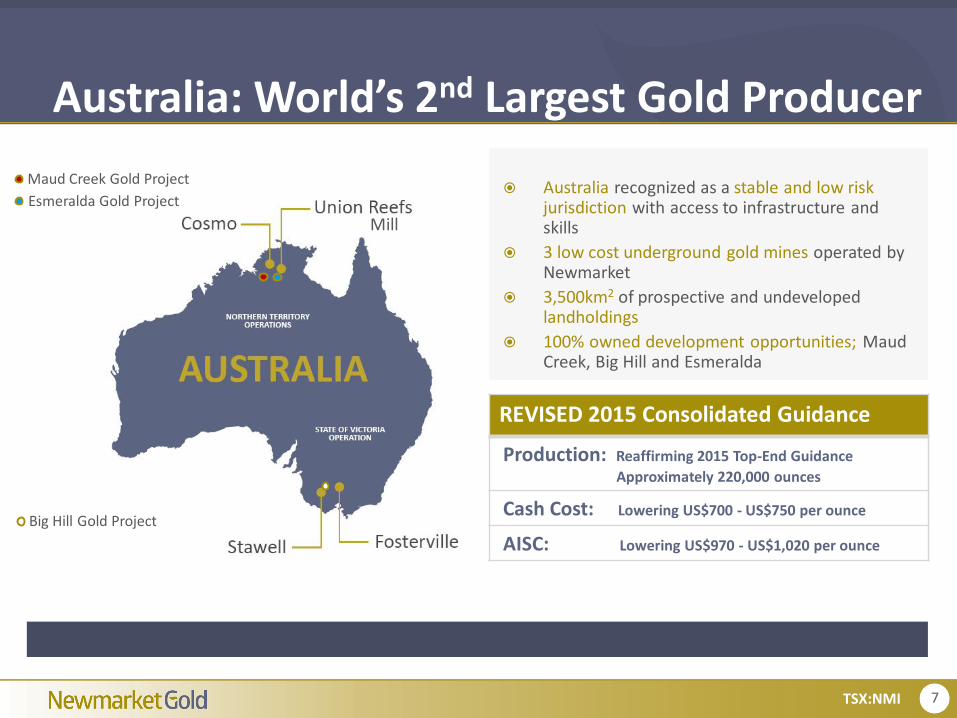
Australia: World’s 2nd Largest Gold Producer
Australia recognized as a stable and low risk jurisdiction with access to infrastructure and skills
3 low cost underground gold mines operated by Newmarket
3,500km2 of prospective and undeveloped landholdings
100% owned development opportunities; Maud Creek, Big Hill and Esmeralda
S
Mill
Maud Creek Gold Project
Esmeralda Gold Project
Big Hill Gold Project
REVISED 2015 Consolidated Guidance
Production: Reaffirming 2015 Top-End Guidance
Approximately 220,000 ounces
Cash Cost: Lowering US$700 - US$750 per ounce
AISC: Lowering US$970 - US$1,020 per ounce
8TSX:NMI
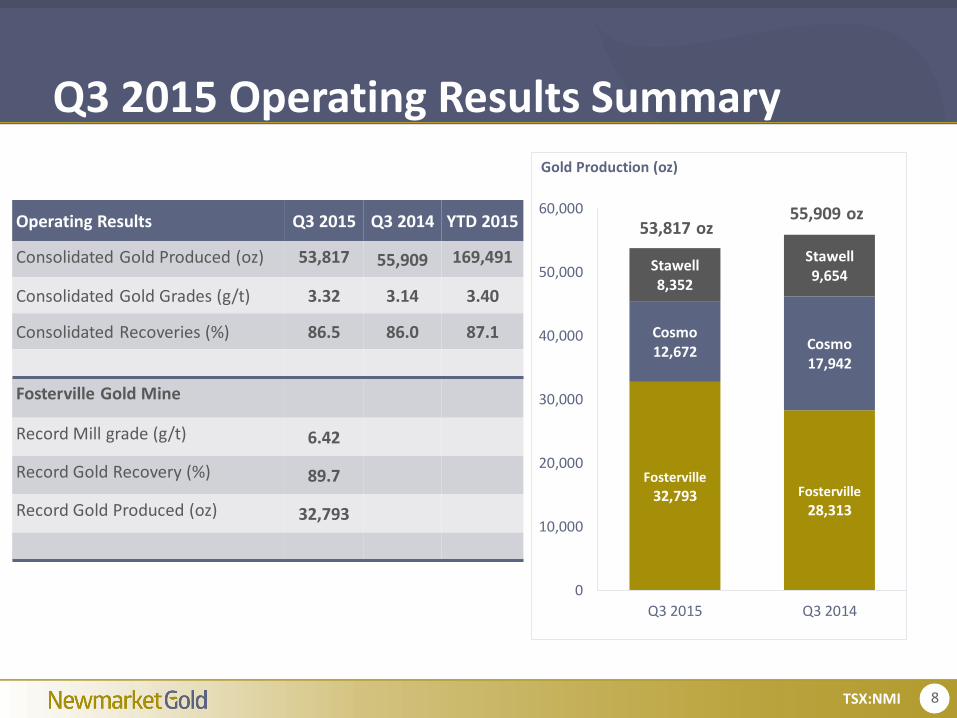
Q3 2015 Operating Results Summary
Operating Results Q3 2015 Q3 2014 YTD 2015
Consolidated Gold Produced (oz) 53,817 55,909 169,491
Consolidated Gold Grades (g/t) 3.32 3.14 3.40
Consolidated Recoveries (%) 86.5 86.0 87.1
Fosterville Gold Mine
Record Mill grade (g/t) 6.42
Record Gold Recovery (%) 89.7
Record Gold Produced (oz) 32,793
Fosterville
32,793 Fosterville
28,313
Cosmo12,672 Cosmo
17,942
Stawell8,352
Stawell9,654
0
10,000
20,000
30,000
40,000
50,000
60,000
Q3 2015 Q3 2014
53,817 oz
Gold Production (oz)
55,909 oz
9TSX:NMI
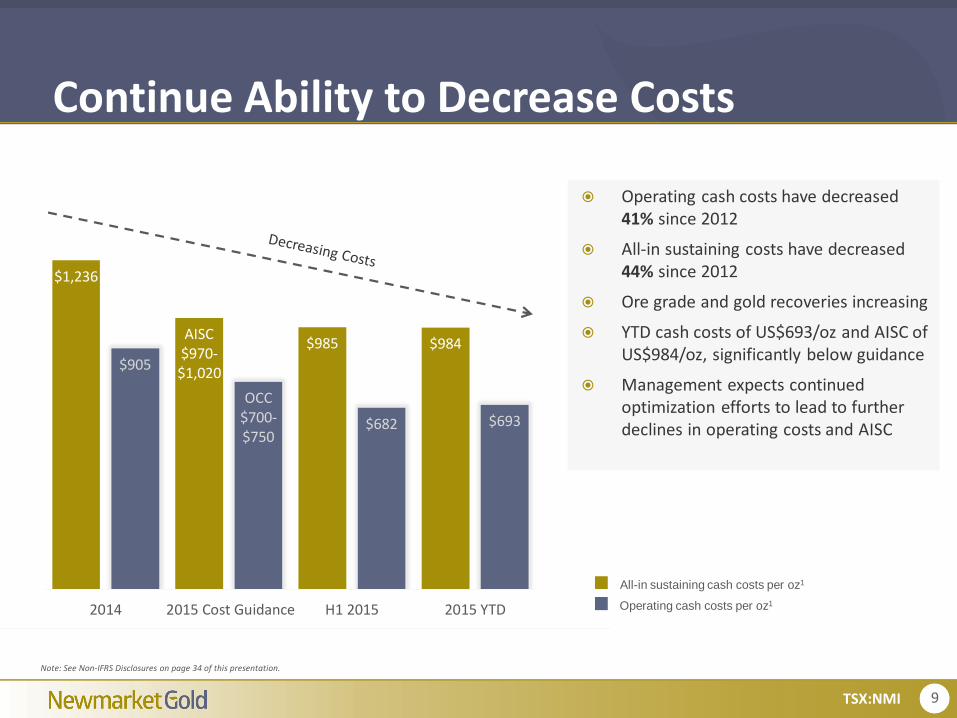
Continue Ability to Decrease Costs
Operating cash costs have decreased 41% since 2012
All-in sustaining costs have decreased 44% since 2012
Ore grade and gold recoveries increasing
YTD cash costs of US$693/oz and AISC of US$984/oz, significantly below guidance
Management expects continued optimization efforts to lead to further declines in operating costs and AISC
All-in sustaining cash costs per oz1
Operating cash costs per oz1
$1,236
AISC$970-$1,020
$985 $984
$905
OCC$700-$750
$682 $693
2014 2015 Cost Guidance H1 2015 2015 YTD
Note: See Non-IFRS Disclosures on page 34 of this presentation.
10TSX:NMI
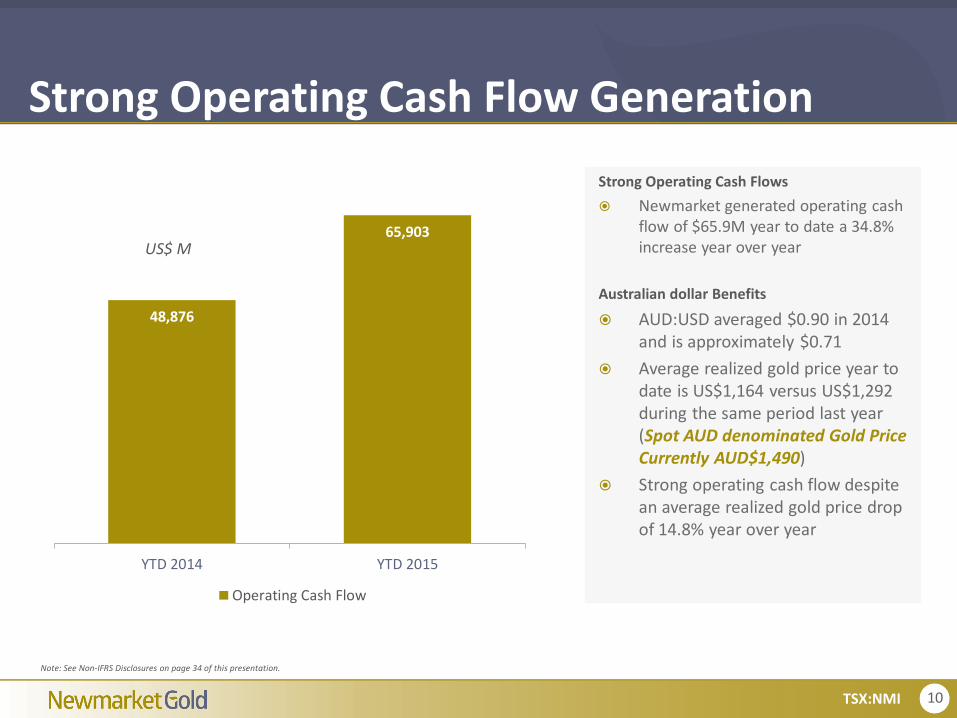
Strong Operating Cash Flows
Newmarket generated operating cash flow of $65.9M year to date a 34.8% increase year over year
Australian dollar Benefits
AUD:USD averaged $0.90 in 2014 and is approximately $0.71
Average realized gold price year to date is US$1,164 versus US$1,292 during the same period last year (Spot AUD denominated Gold Price Currently AUD$1,490)
Strong operating cash flow despite an average realized gold price drop of 14.8% year over year
Strong Operating Cash Flow Generation
US$ M
Note: See Non-IFRS Disclosures on page 34 of this presentation.
48,876
65,903
YTD 2014 YTD 2015
Operating Cash Flow
11TSX:NMI
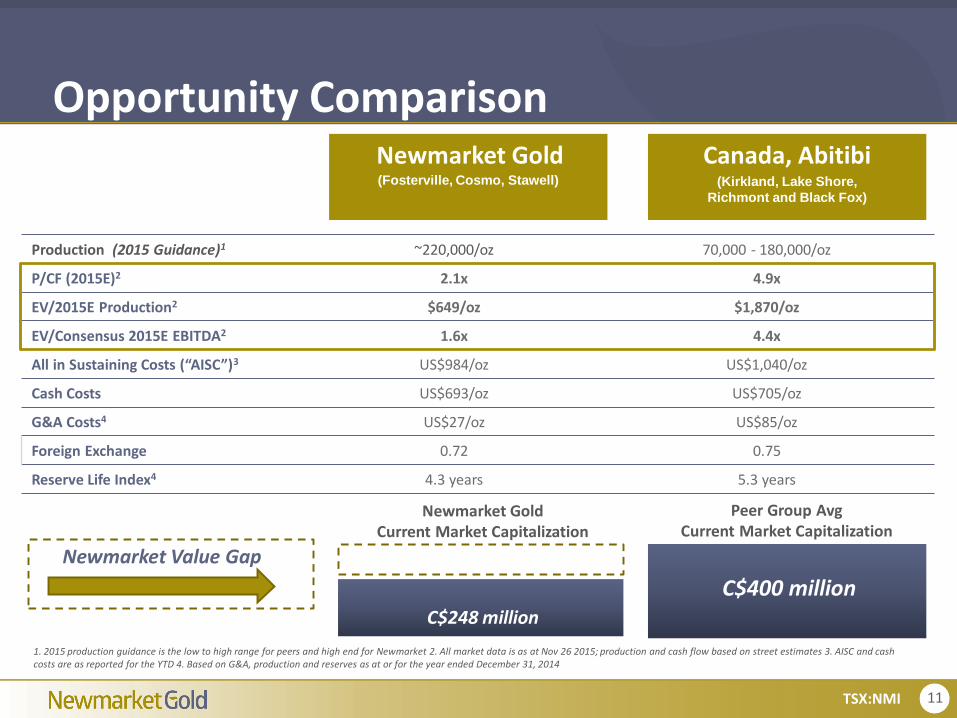
Opportunity Comparison
Production (2015 Guidance)1 ~220,000/oz 70,000 - 180,000/oz
P/CF (2015E)2 2.1x 4.9x
EV/2015E Production2 $649/oz $1,870/oz
EV/Consensus 2015E EBITDA2 1.6x 4.4x
All in Sustaining Costs (“AISC”)3 US$984/oz US$1,040/oz
Cash Costs US$693/oz US$705/oz
G&A Costs4 US$27/oz US$85/oz
Foreign Exchange 0.72 0.75
Reserve Life Index4 4.3 years 5.3 years
Newmarket Gold Canada, Abitibi(Kirkland, Lake Shore,
Richmont and Black Fox)
(Fosterville, Cosmo, Stawell)
1. 2015 production guidance is the low to high range for peers and high end for Newmarket 2. All market data is as at Nov 26 2015; production and cash flow based on street estimates 3. AISC and cash costs are as reported for the YTD 4. Based on G&A, production and reserves as at or for the year ended December 31, 2014
Newmarket GoldCurrent Market Capitalization
Peer Group AvgCurrent Market Capitalization
C$248 million
C$400 million
Newmarket Value Gap
12TSX:NMI
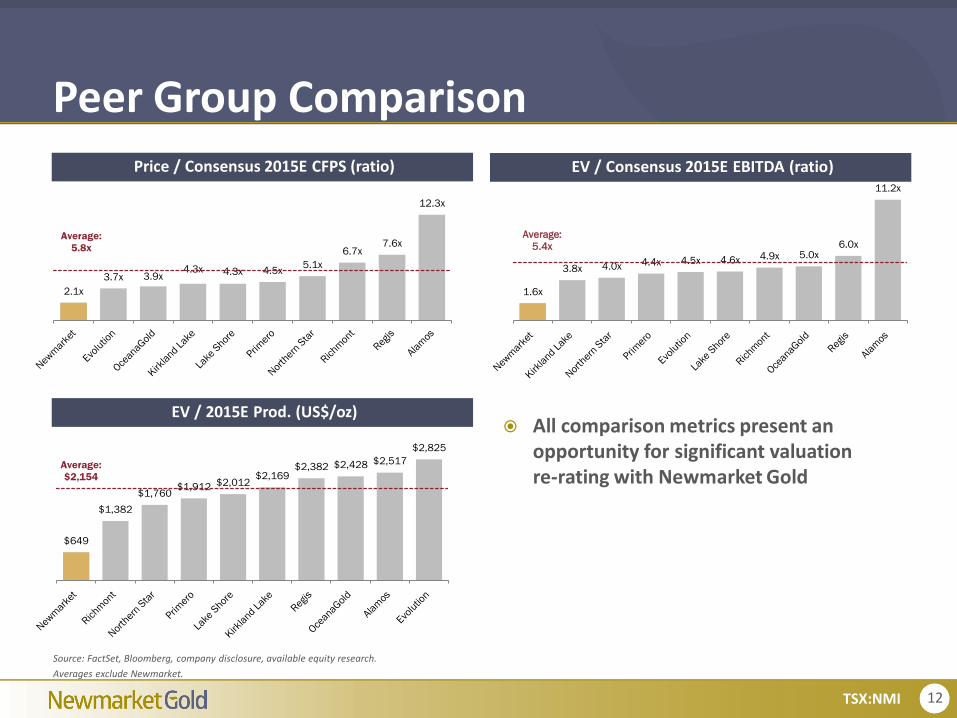
Source: FactSet, Bloomberg, company disclosure, available equity research.
Averages exclude Newmarket.
Peer Group Comparison
All comparison metrics present an opportunity for significant valuation re-rating with Newmarket Gold
$649
$1,382
$1,760 $1,912 $2,012
$2,169 $2,382 $2,428 $2,517
$2,825
Average:
$2,154
2.1x
3.7x 3.9x 4.3x 4.3x 4.5x
5.1x
6.7x 7.6x
12.3x
Average:
5.8x
1.6x
3.8x 4.0x 4.4x 4.5x 4.6x 4.9x 5.0x 6.0x
11.2x
Average:
5.4x
EV / 2015E Prod. (US$/oz)
Price / Consensus 2015E CFPS (ratio) EV / Consensus 2015E EBITDA (ratio)
13TSX:NMI
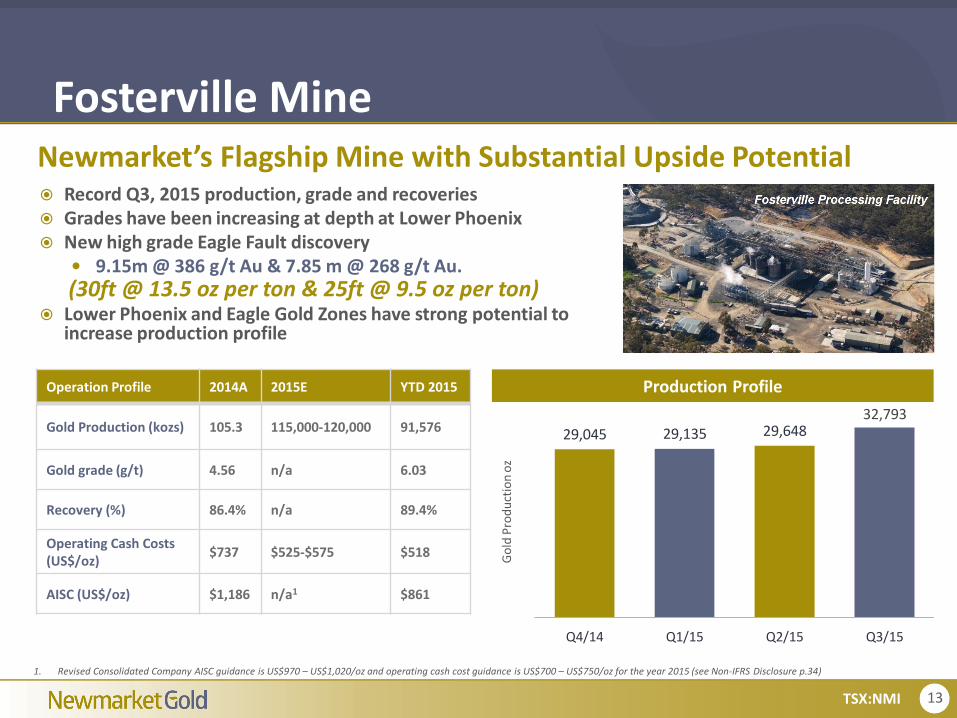
29,045 29,135 29,648
Q4/14 Q1/15 Q2/15 Q3/15
Record Q3, 2015 production, grade and recoveries Grades have been increasing at depth at Lower Phoenix New high grade Eagle Fault discovery
9.15m @ 386 g/t Au & 7.85 m @ 268 g/t Au.
Lower Phoenix and Eagle Gold Zones have strong potential to increase production profile
Newmarket’s Flagship Mine with Substantial Upside Potential
Operation Profile 2014A 2015E YTD 2015
Gold Production (kozs) 105.3 115,000-120,000 91,576
Gold grade (g/t) 4.56 n/a 6.03
Recovery (%) 86.4% n/a 89.4%
Operating Cash Costs (US$/oz)
$737 $525-$575 $518
AISC (US$/oz) $1,186 n/a1 $861
Production Profile
1. Revised Consolidated Company AISC guidance is US$970 – US$1,020/oz and operating cash cost guidance is US$700 – US$750/oz for the year 2015 (see Non-IFRS Disclosure p.34)
Fosterville Mine
Go
ld P
rod
uct
ion
oz
(30ft @ 13.5 oz per ton & 25ft @ 9.5 oz per ton)
32,793
14TSX:NMI
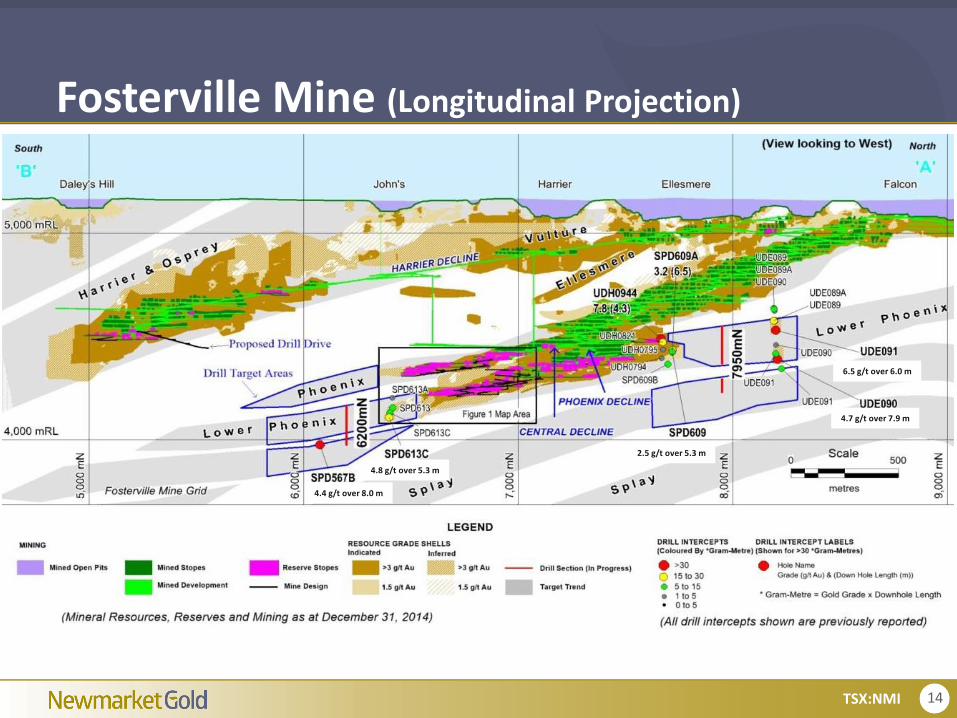
Fosterville Mine (Longitudinal Projection)
4.4 g/t over 8.0 m
4.8 g/t over 5.3 m
4.7 g/t over 7.9 m
6.5 g/t over 6.0 m
2.5 g/t over 5.3 m
15TSX:NMI
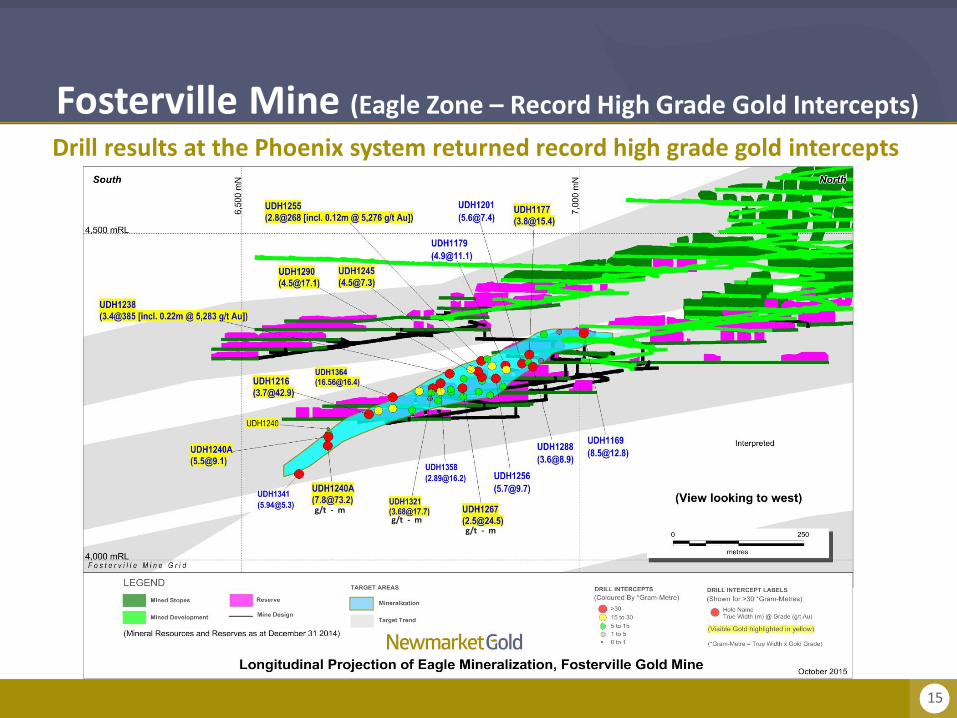
Fosterville Mine (Eagle Zone – Record High Grade Gold Intercepts)
Drill results at the Phoenix system returned record high grade gold intercepts
g/t - mg/t - m
g/t - m
16TSX:NMI
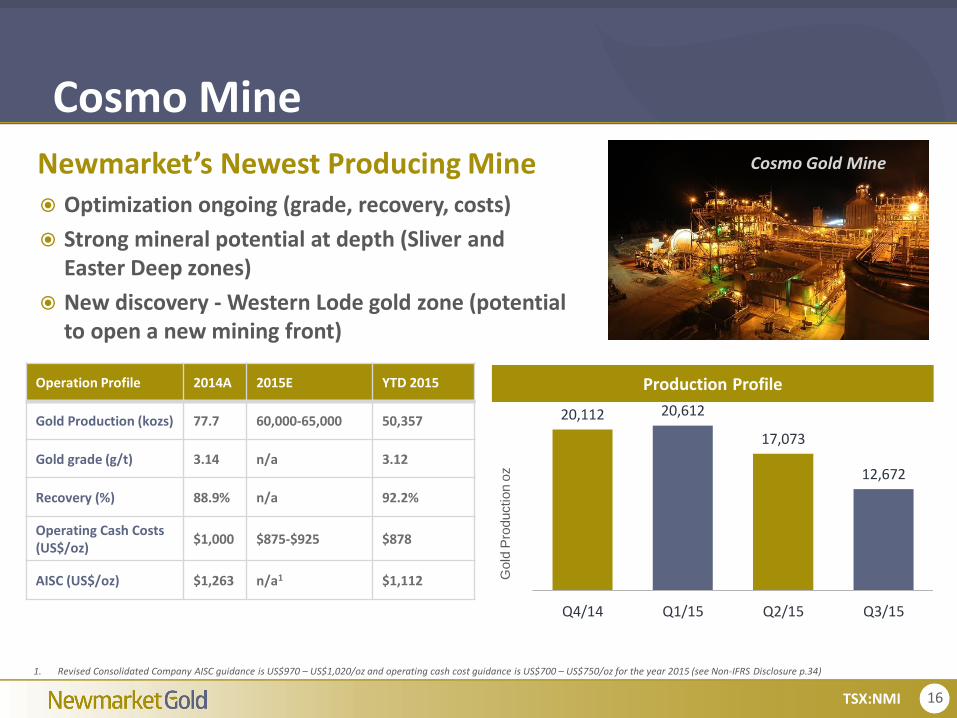
20,112 20,612
17,073
12,672
Q4/14 Q1/15 Q2/15 Q3/15
Optimization ongoing (grade, recovery, costs)
Strong mineral potential at depth (Sliver and Easter Deep zones)
New discovery - Western Lode gold zone (potential to open a new mining front)
Newmarket’s Newest Producing Mine
Operation Profile 2014A 2015E YTD 2015
Gold Production (kozs) 77.7 60,000-65,000 50,357
Gold grade (g/t) 3.14 n/a 3.12
Recovery (%) 88.9% n/a 92.2%
Operating Cash Costs (US$/oz)
$1,000 $875-$925 $878
AISC (US$/oz) $1,263 n/a1 $1,112
Cosmo MineCosmo Gold Mine
Gold
Pro
duction o
z
Production Profile
1. Revised Consolidated Company AISC guidance is US$970 – US$1,020/oz and operating cash cost guidance is US$700 – US$750/oz for the year 2015 (see Non-IFRS Disclosure p.34)
17TSX:NMI
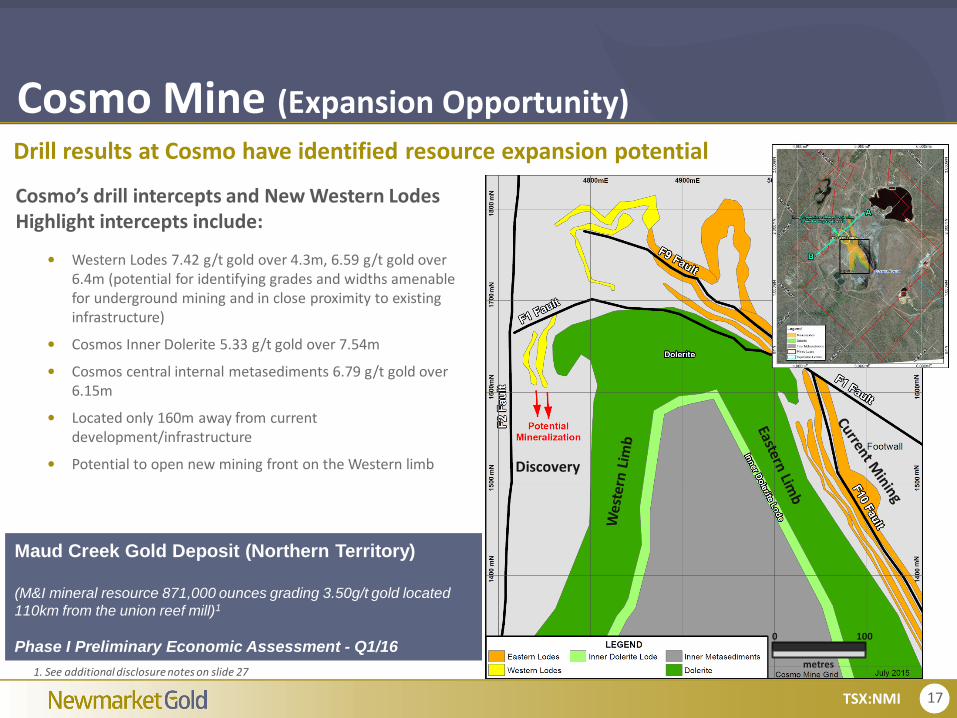
Cosmo Mine (Expansion Opportunity)
Cosmo’s drill intercepts and New Western Lodes Highlight intercepts include:
Western Lodes 7.42 g/t gold over 4.3m, 6.59 g/t gold over 6.4m (potential for identifying grades and widths amenable for underground mining and in close proximity to existing infrastructure)
Cosmos Inner Dolerite 5.33 g/t gold over 7.54m
Cosmos central internal metasediments 6.79 g/t gold over 6.15m
Located only 160m away from current development/infrastructure
Potential to open new mining front on the Western limb
Drill results at Cosmo have identified resource expansion potential
Discovery
Maud Creek Gold Deposit (Northern Territory)
(M&I mineral resource 871,000 ounces grading 3.50g/t gold located
110km from the union reef mill)1
Phase I Preliminary Economic Assessment - Q1/160 100
metres1. See additional disclosure notes on slide 27
18TSX:NMI
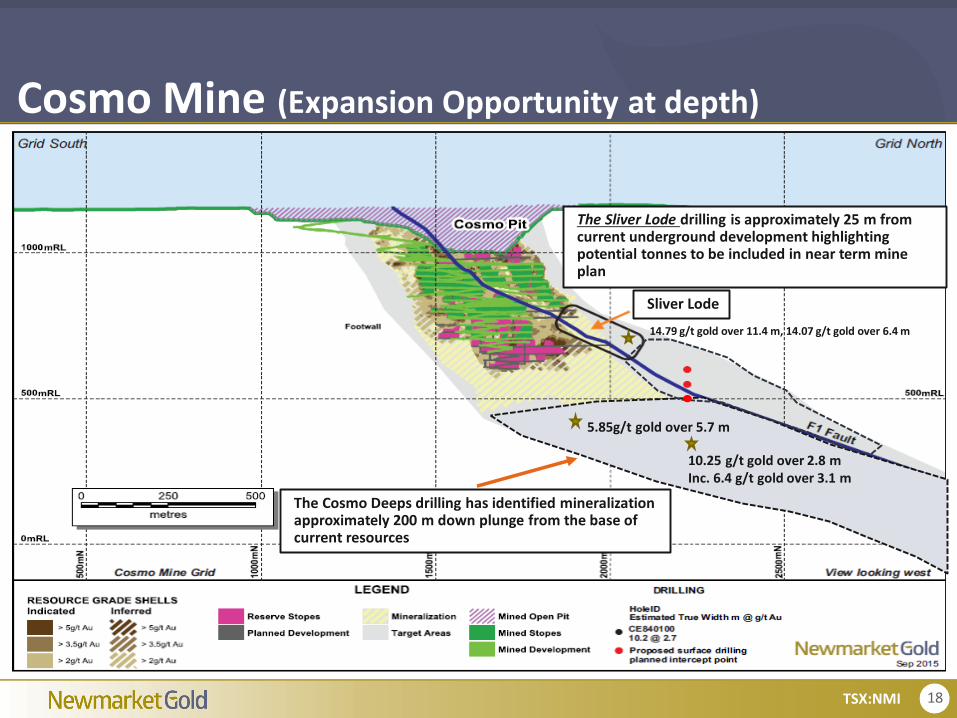
Cosmo Mine (Expansion Opportunity at depth)
The Sliver Lode drilling is approximately 25 m from current underground development highlighting potential tonnes to be included in near term mine plan
The Cosmo Deeps drilling has identified mineralization approximately 200 m down plunge from the base of current resources
5.85g/t gold over 5.7 m
10.25 g/t gold over 2.8 mInc. 6.4 g/t gold over 3.1 m
14.79 g/t gold over 11.4 m, 14.07 g/t gold over 6.4 m
Sliver Lode
19TSX:NMI
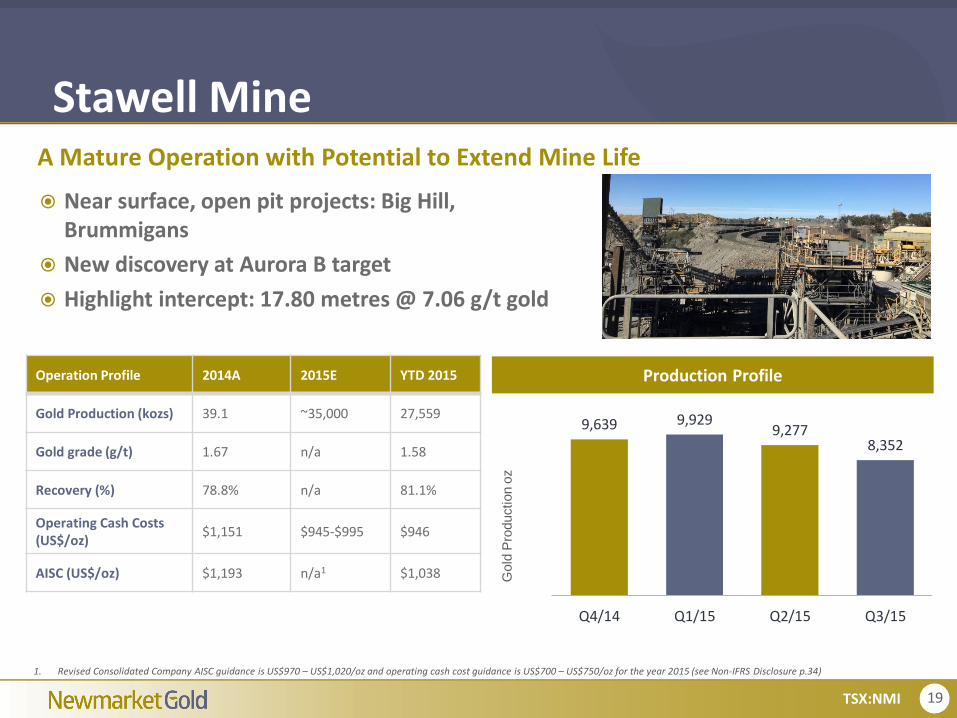
9,639 9,9299,277
8,352
Q4/14 Q1/15 Q2/15 Q3/15
Near surface, open pit projects: Big Hill, Brummigans
New discovery at Aurora B target
Highlight intercept: 17.80 metres @ 7.06 g/t gold
A Mature Operation with Potential to Extend Mine Life
Operation Profile 2014A 2015E YTD 2015
Gold Production (kozs) 39.1 ~35,000 27,559
Gold grade (g/t) 1.67 n/a 1.58
Recovery (%) 78.8% n/a 81.1%
Operating Cash Costs (US$/oz)
$1,151 $945-$995 $946
AISC (US$/oz) $1,193 n/a1 $1,038
Stawell Mine
Gold
Pro
duction o
z
Production Profile
1. Revised Consolidated Company AISC guidance is US$970 – US$1,020/oz and operating cash cost guidance is US$700 – US$750/oz for the year 2015 (see Non-IFRS Disclosure p.34)
20TSX:NMI
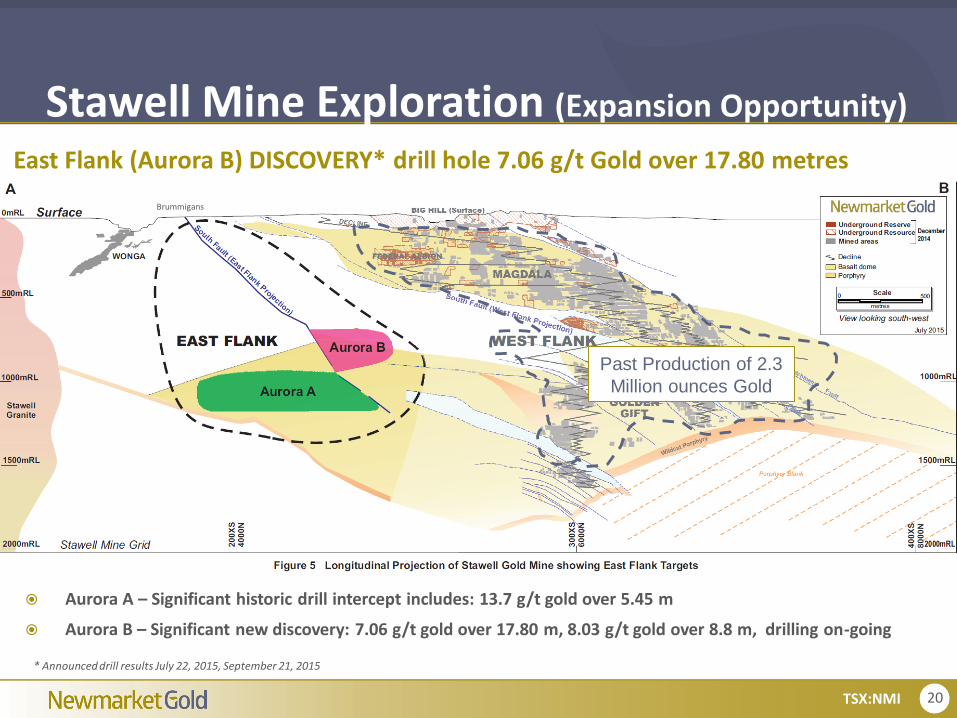
Stawell Mine Exploration (Expansion Opportunity)
Past Production of 2.3
Million ounces Gold
* Announced drill results July 22, 2015, September 21, 2015
Aurora A – Significant historic drill intercept includes: 13.7 g/t gold over 5.45 m
Aurora B – Significant new discovery: 7.06 g/t gold over 17.80 m, 8.03 g/t gold over 8.8 m, drilling on-going
East Flank (Aurora B) DISCOVERY* drill hole 7.06 g/t Gold over 17.80 metres
Brummigans
21TSX:NMI
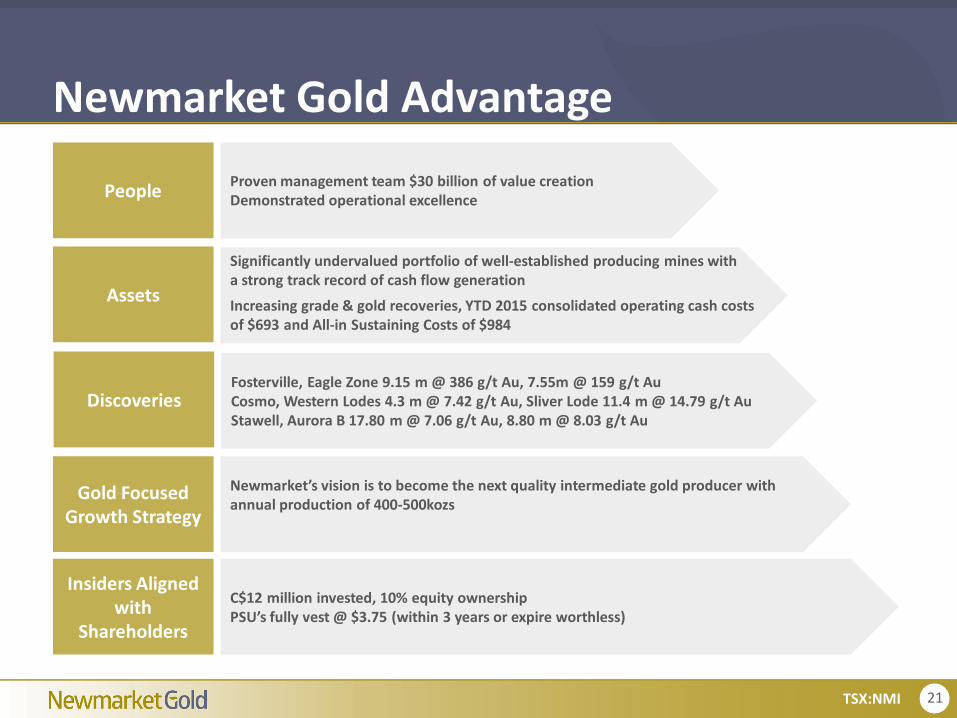
PeopleProven management team $30 billion of value creationDemonstrated operational excellence
Assets
Significantly undervalued portfolio of well-established producing mines with a strong track record of cash flow generation
Increasing grade & gold recoveries, YTD 2015 consolidated operating cash costs of $693 and All-in Sustaining Costs of $984
Gold Focused Growth Strategy
Newmarket’s vision is to become the next quality intermediate gold producer with annual production of 400-500kozs
Insiders Aligned with
Shareholders
Newmarket Gold Advantage
C$12 million invested, 10% equity ownership PSU’s fully vest @ $3.75 (within 3 years or expire worthless)
DiscoveriesFosterville, Eagle Zone 9.15 m @ 386 g/t Au, 7.55m @ 159 g/t AuCosmo, Western Lodes 4.3 m @ 7.42 g/t Au, Sliver Lode 11.4 m @ 14.79 g/t Au Stawell, Aurora B 17.80 m @ 7.06 g/t Au, 8.80 m @ 8.03 g/t Au
22TSX:NMI
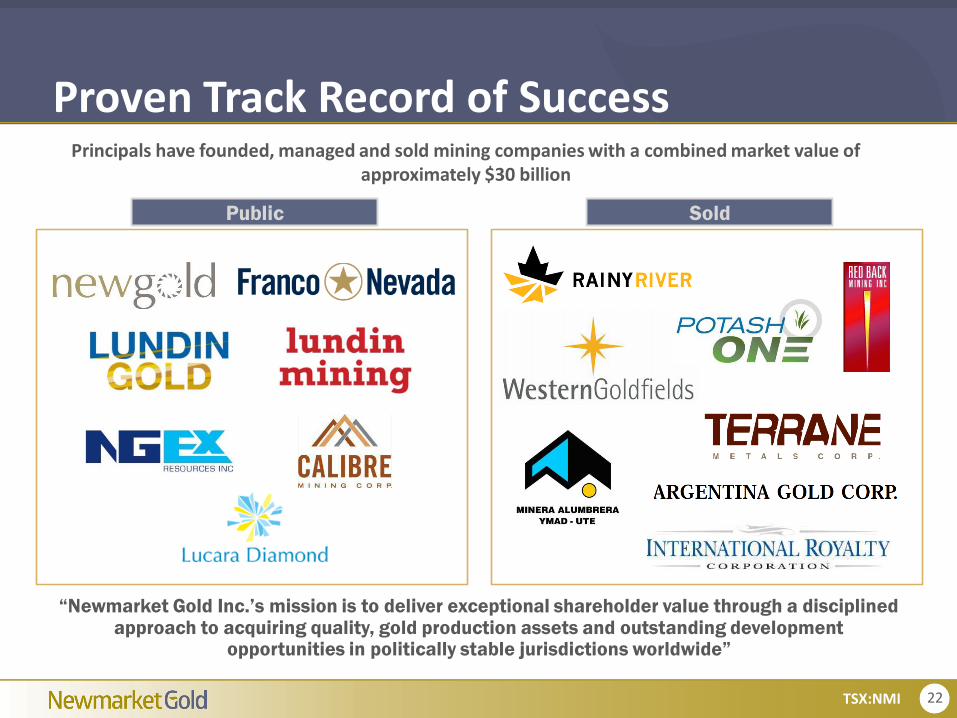
Proven Track Record of Success
“Newmarket Gold Inc.’s mission is to deliver exceptional shareholder value through a disciplined approach to acquiring quality, gold production assets and outstanding development
opportunities in politically stable jurisdictions worldwide”
Public Sold
Principals have founded, managed and sold mining companies with a combined market value of approximately $30 billion
Douglas ForsterPresident & CEO, Director
T: 604-559-8040E: [email protected]
www.newmarketgoldinc.com
Contact Us
Ryan KingVice President, Corporate Communications
T: 778-998-3700E: [email protected]
Laura LeporeDirector, Investor Relations
T: 416-728-3707E: [email protected]
TSX:NMI
24TSX:NMI
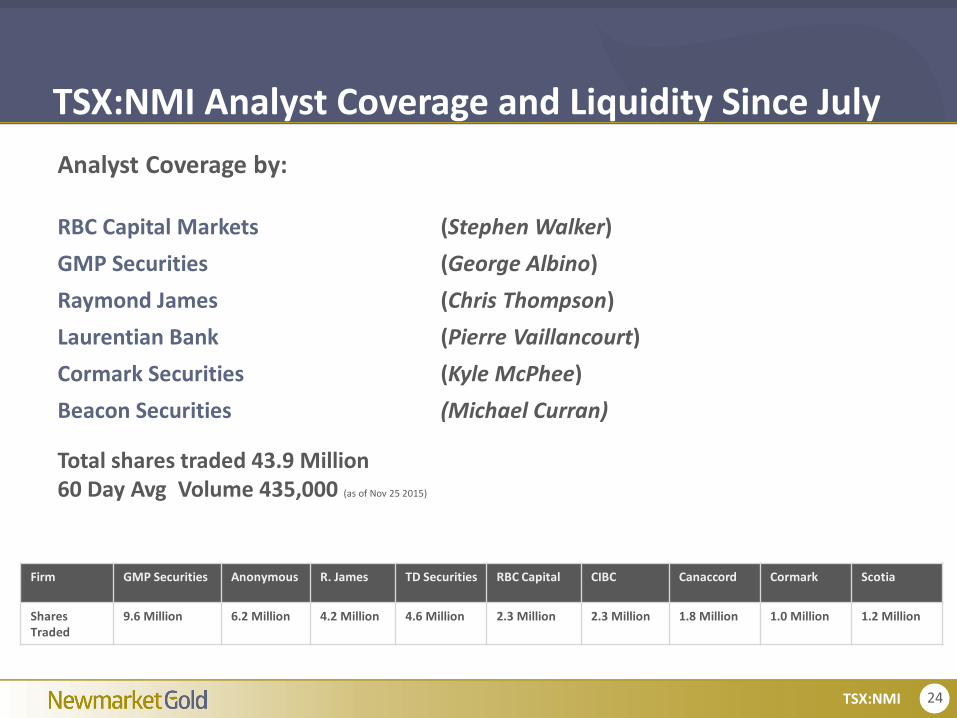
TSX:NMI Analyst Coverage and Liquidity Since July
Firm GMP Securities Anonymous R. James TD Securities RBC Capital CIBC Canaccord Cormark Scotia
Shares Traded
9.6 Million 6.2 Million 4.2 Million 4.6 Million 2.3 Million 2.3 Million 1.8 Million 1.0 Million 1.2 Million
Analyst Coverage by:
RBC Capital Markets (Stephen Walker)
GMP Securities (George Albino)
Raymond James (Chris Thompson)
Laurentian Bank (Pierre Vaillancourt)
Cormark Securities (Kyle McPhee)
Beacon Securities (Michael Curran)
Total shares traded 43.9 Million60 Day Avg Volume 435,000 (as of Nov 25 2015)
25TSX:NMI
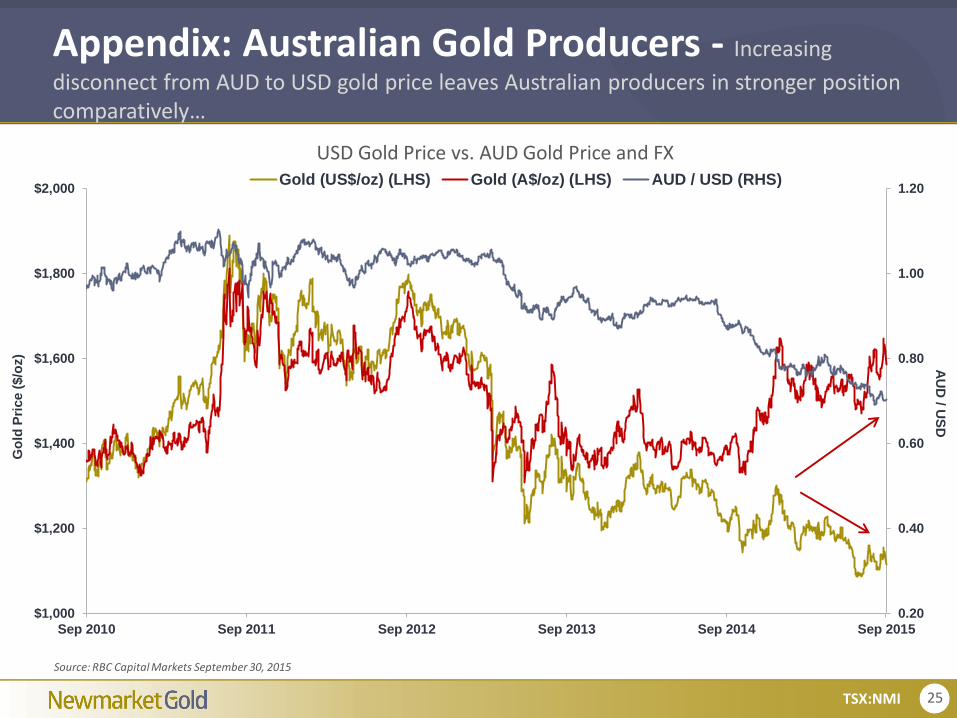
Appendix: Australian Gold Producers - Increasing
disconnect from AUD to USD gold price leaves Australian producers in stronger position comparatively…
0.20
0.40
0.60
0.80
1.00
1.20
$1,000
$1,200
$1,400
$1,600
$1,800
$2,000
Sep 2010 Sep 2011 Sep 2012 Sep 2013 Sep 2014 Sep 2015
AU
D / U
SD
Go
ld P
rice (
$/o
z)
Gold (US$/oz) (LHS) Gold (A$/oz) (LHS) AUD / USD (RHS)
Source: RBC Capital Markets September 30, 2015
USD Gold Price vs. AUD Gold Price and FX
26TSX:NMI
$400
$800
$1,200
$1,600
$2,000
2000 2001 2002 2003 2004 2005 2006 2007 2008 2009 2010 2011 2012 2013 2014 2015
Go
ld S
po
t (i
n A
UD
$)
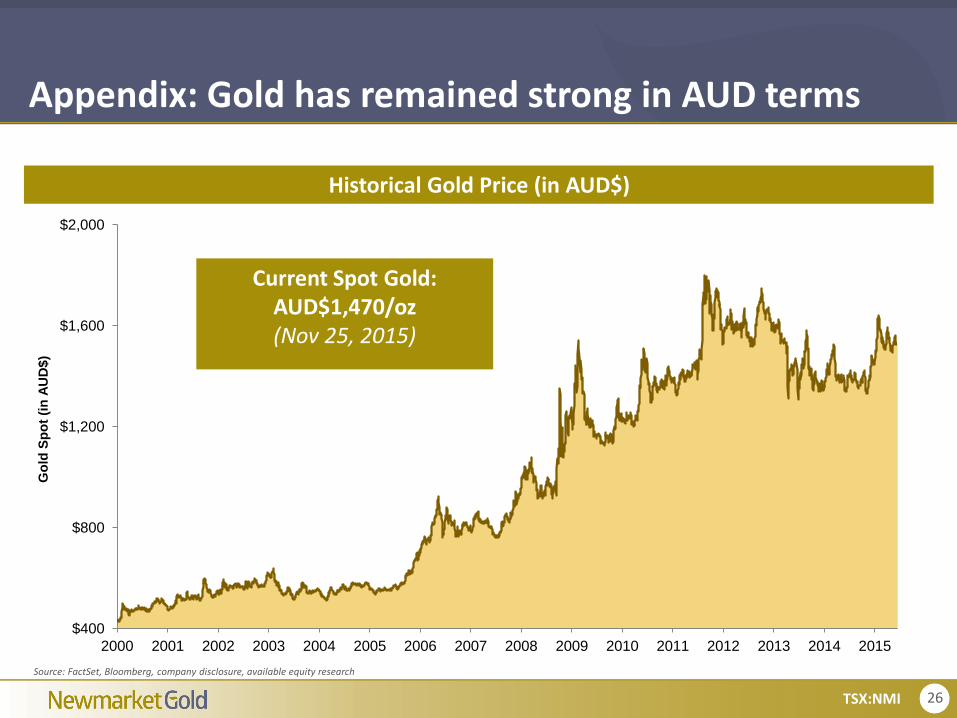
Historical Gold Price (in AUD$)
Appendix: Gold has remained strong in AUD terms
Source: FactSet, Bloomberg, company disclosure, available equity research
Current Spot Gold:AUD$1,470/oz(Nov 25, 2015)
27TSX:NMI
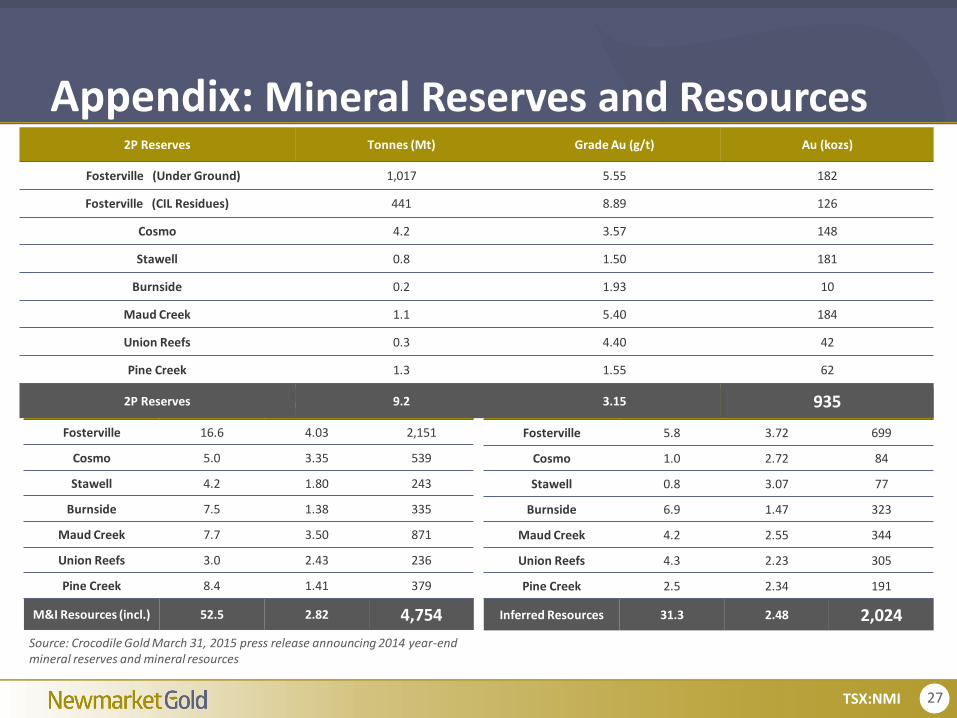
Appendix: Mineral Reserves and Resources
Inferred Resources Tonnes (Mt) Grade Au (g/t) Au (kozs)
Fosterville 5.8 3.72 699
Cosmo 1.0 2.72 84
Stawell 0.8 3.07 77
Burnside 6.9 1.47 323
Maud Creek 4.2 2.55 344
Union Reefs 4.3 2.23 305
Pine Creek 2.5 2.34 191
Inferred Resources 31.3 2.48 2,024
M&I Resources (incl.) Tonnes (Mt) Grade Au (g/t) Au (kozs)
Fosterville 16.6 4.03 2,151
Cosmo 5.0 3.35 539
Stawell 4.2 1.80 243
Burnside 7.5 1.38 335
Maud Creek 7.7 3.50 871
Union Reefs 3.0 2.43 236
Pine Creek 8.4 1.41 379
M&I Resources (incl.) 52.5 2.82 4,754
Source: Crocodile Gold March 31, 2015 press release announcing 2014 year-end mineral reserves and mineral resources
2P Reserves Tonnes (Mt) Grade Au (g/t) Au (kozs)
Fosterville (Under Ground) 1,017 5.55 182
Fosterville (CIL Residues) 441 8.89 126
Cosmo 4.2 3.57 148
Stawell 0.8 1.50 181
Burnside 0.2 1.93 10
Maud Creek 1.1 5.40 184
Union Reefs 0.3 4.40 42
Pine Creek 1.3 1.55 62
2P Reserves 9.2 3.15 935
28TSX:NMI
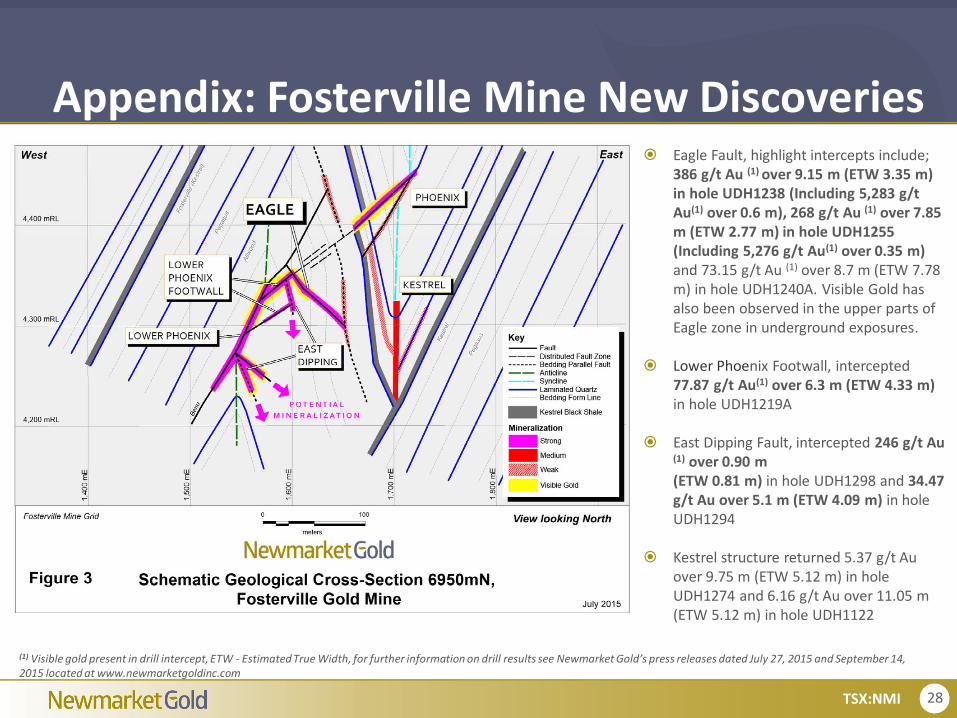
Appendix: Fosterville Mine New Discoveries Eagle Fault, highlight intercepts include;
386 g/t Au (1) over 9.15 m (ETW 3.35 m) in hole UDH1238 (Including 5,283 g/t Au(1) over 0.6 m), 268 g/t Au (1) over 7.85 m (ETW 2.77 m) in hole UDH1255 (Including 5,276 g/t Au(1) over 0.35 m)and 73.15 g/t Au (1) over 8.7 m (ETW 7.78 m) in hole UDH1240A. Visible Gold has also been observed in the upper parts of Eagle zone in underground exposures.
Lower Phoenix Footwall, intercepted 77.87 g/t Au(1) over 6.3 m (ETW 4.33 m)in hole UDH1219A
East Dipping Fault, intercepted 246 g/t Au (1) over 0.90 m (ETW 0.81 m) in hole UDH1298 and 34.47 g/t Au over 5.1 m (ETW 4.09 m) in hole UDH1294
Kestrel structure returned 5.37 g/t Au over 9.75 m (ETW 5.12 m) in hole UDH1274 and 6.16 g/t Au over 11.05 m (ETW 5.12 m) in hole UDH1122
(1) Visible gold present in drill intercept, ETW - Estimated True Width, for further information on drill results see Newmarket Gold’s press releases dated July 27, 2015 and September 14, 2015 located at www.newmarketgoldinc.com
29TSX:NMI
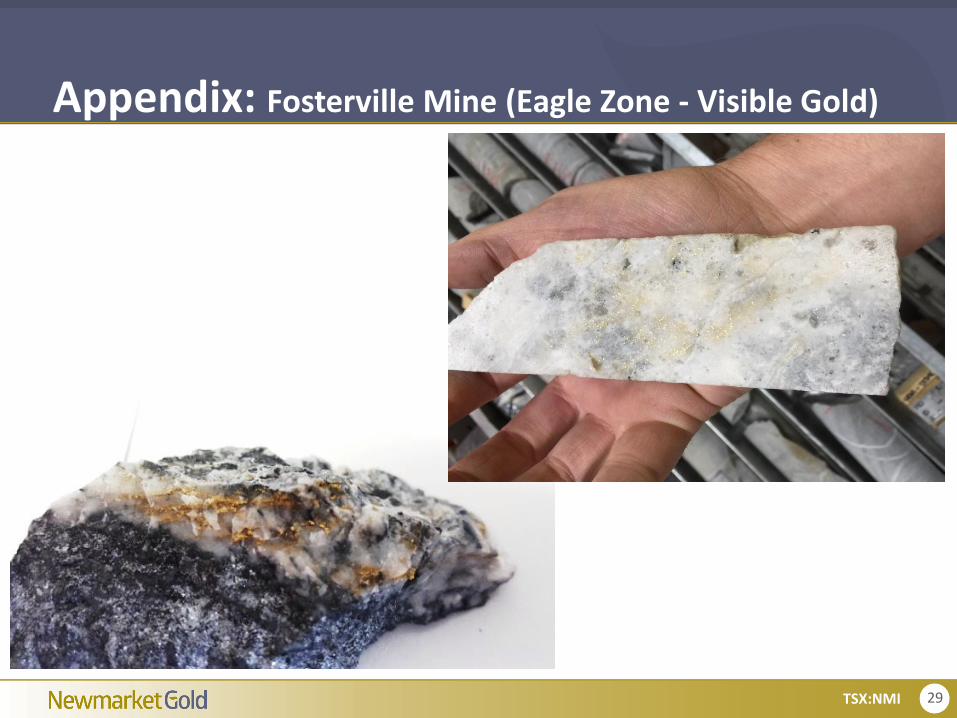
Appendix: Fosterville Mine (Eagle Zone - Visible Gold)

30TSX:NMI
Appendix: Cosmo Mine Western Lodes
A number of drill holes have now penetrated the Western Lodes Target.
Drill results for the Cosmo Western Lodes which are outside of the current mine plan include 7.42 g/t gold over 4.3 m (estimated true width 2.85 m) and 6.59 g/t gold over 6.4 m (estimate true width 1.65 m).
Work continues to fully define the potential of the Western Lodes
Target is located only 160 m from current development and has the potential to increase resources at Cosmo and expand the current mine plan to alternative mining areas.
Note: For further information on drill results see Newmarket Gold’s press release dated July 22, 2015 located at www.newmarketgoldinc.com
31TSX:NMI
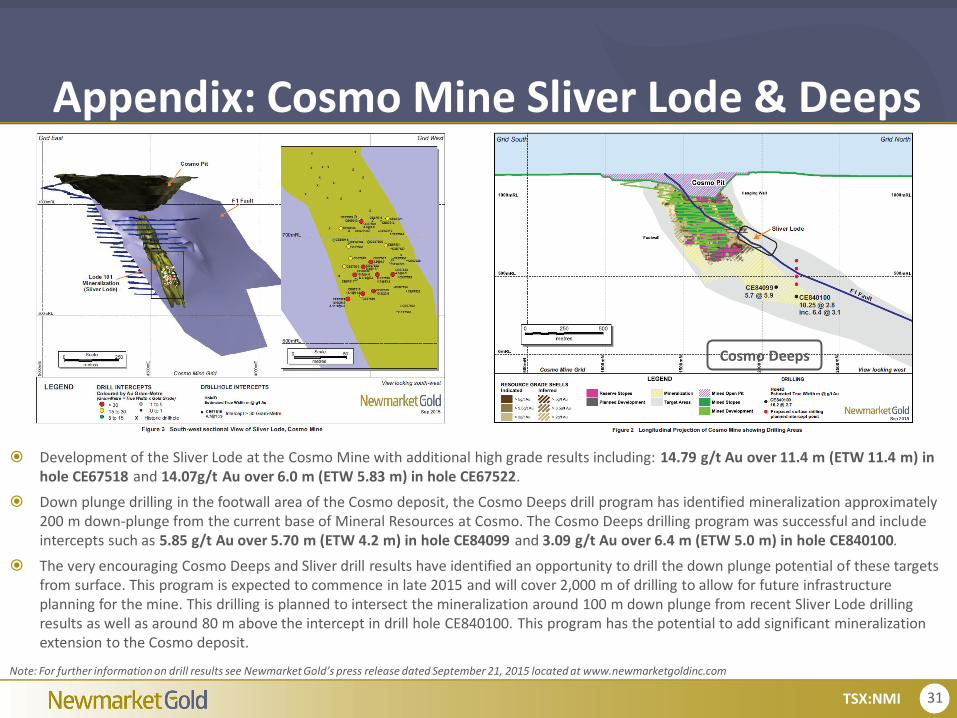
Appendix: Cosmo Mine Sliver Lode & Deeps
Development of the Sliver Lode at the Cosmo Mine with additional high grade results including: 14.79 g/t Au over 11.4 m (ETW 11.4 m) in hole CE67518 and 14.07g/t Au over 6.0 m (ETW 5.83 m) in hole CE67522.
Down plunge drilling in the footwall area of the Cosmo deposit, the Cosmo Deeps drill program has identified mineralization approximately 200 m down-plunge from the current base of Mineral Resources at Cosmo. The Cosmo Deeps drilling program was successful and include intercepts such as 5.85 g/t Au over 5.70 m (ETW 4.2 m) in hole CE84099 and 3.09 g/t Au over 6.4 m (ETW 5.0 m) in hole CE840100.
The very encouraging Cosmo Deeps and Sliver drill results have identified an opportunity to drill the down plunge potential of these targets from surface. This program is expected to commence in late 2015 and will cover 2,000 m of drilling to allow for future infrastructure planning for the mine. This drilling is planned to intersect the mineralization around 100 m down plunge from recent Sliver Lode drilling results as well as around 80 m above the intercept in drill hole CE840100. This program has the potential to add significant mineralization extension to the Cosmo deposit.
Note: For further information on drill results see Newmarket Gold’s press release dated September 21, 2015 located at www.newmarketgoldinc.com
Cosmo Deeps
32TSX:NMI
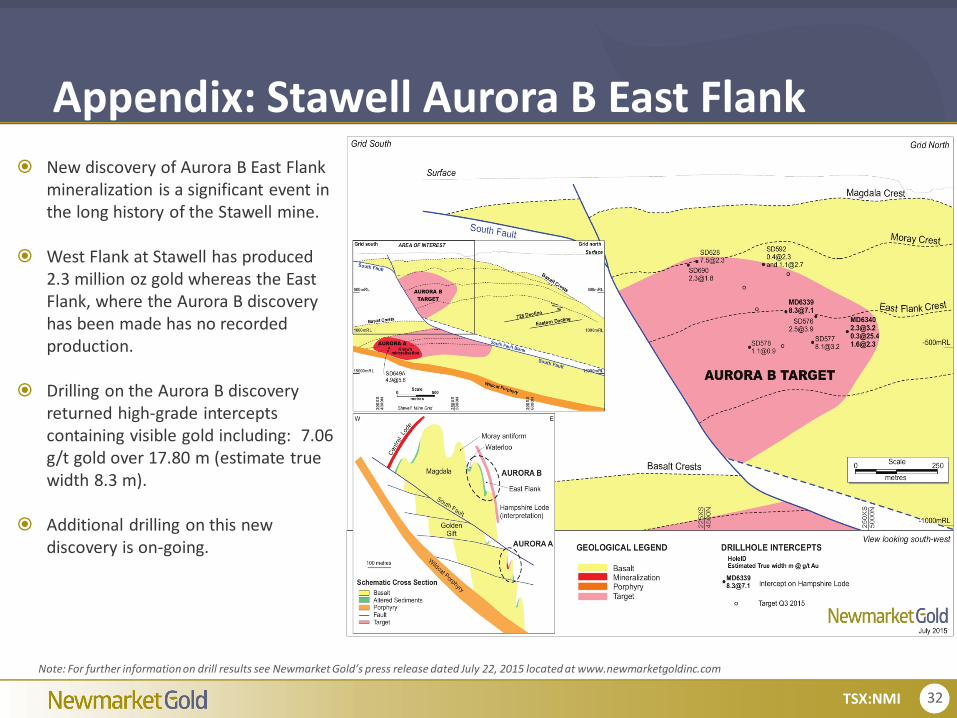
Appendix: Stawell Aurora B East Flank
New discovery of Aurora B East Flank mineralization is a significant event in the long history of the Stawell mine.
West Flank at Stawell has produced 2.3 million oz gold whereas the East Flank, where the Aurora B discovery has been made has no recorded production.
Drilling on the Aurora B discovery returned high-grade intercepts containing visible gold including: 7.06 g/t gold over 17.80 m (estimate true width 8.3 m).
Additional drilling on this new discovery is on-going.
Note: For further information on drill results see Newmarket Gold’s press release dated July 22, 2015 located at www.newmarketgoldinc.com
33TSX:NMI
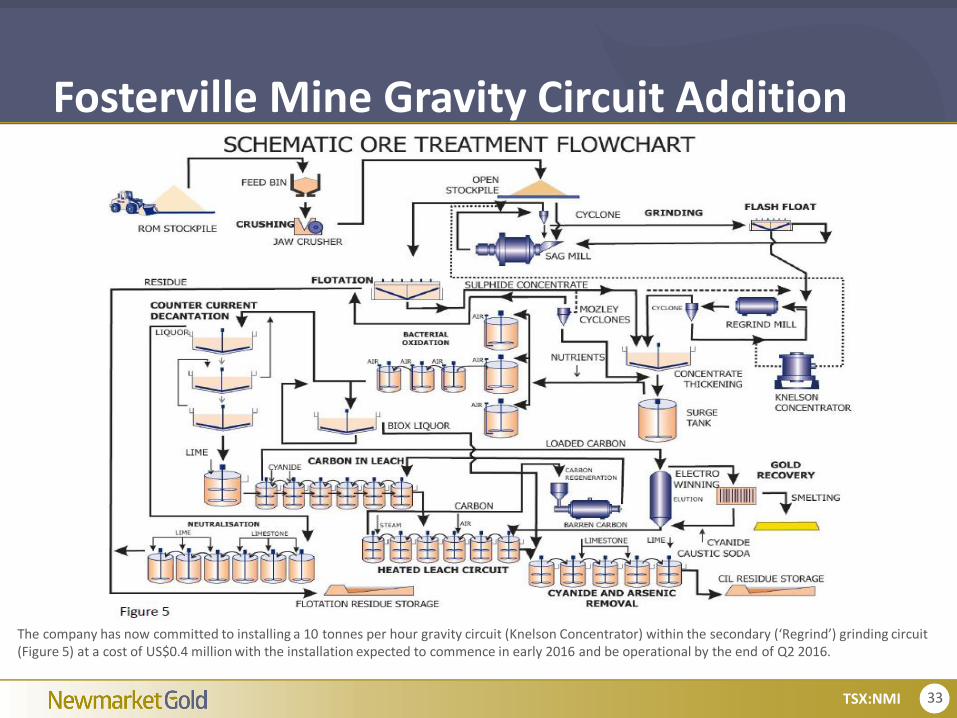
Fosterville Mine Gravity Circuit Addition
The company has now committed to installing a 10 tonnes per hour gravity circuit (Knelson Concentrator) within the secondary (‘Regrind’) grinding circuit (Figure 5) at a cost of US$0.4 million with the installation expected to commence in early 2016 and be operational by the end of Q2 2016.
34TSX:NMI
Appendix: Non-IFRS and Additional InformationNon-IFRS MeasuresNewmarket Gold believes that investors use certain indicators to assess gold mining companies. The indicators are intended to provide additional information and should not beconsidered in isolation or as a substitute for measures of performance in accordance with the International Financial Reporting Standards.“OperationalCash Costs perOunce” is a non-IFRS performance measure which could provide an indication of the mining and processing efficiency at the operations.The Company calculates operating cash costs per ounce by deducting silver sales revenue as a by-product from operating expenses per the consolidated statement ofoperations, then dividing by the gold ounces sold during the applicable period. Operating expenses include mine site operating costs such as mining, processing andadministration as well as royalties, however excludes depletion and depreciation, share-based payments and rehabilitation costs. There are variations in the method ofcomputation of “operational cash costs per ounce” as determined by the Company compared with other mining companies. For more detail on the operational cash costs perounce determination for Crocodile Gold, please visit www.sedar.com or www.newmarketgoldinc.com and review the latest Annual Financial Statements issued on March 19,2014.
“All-In Sustaining Costs per Ounce of Gold (“AISC”) Effective December 31, 2013, the Company has adopted an all-in sustaining cost (“AISC”) performance measure that reflectsall of the expenditures that are required to produce an ounce of gold from current operations. While there is no standardized meaning of the measure across the industry, theCompany’s definition conforms to the AISC definition as set out by the World Gold Council in its guidance dated June 27, 2013. The World Gold Council is a non-regulatory, non-profit organization established in 1987 whose members include global senior mining companies. The Company believes that this measure will be useful to external users inassessing operating performance and the ability to generate free cash flow from current operations. The Company defines AISC as the sum of operating cash costs (per above),sustaining capital (capital required to maintain current operations at existing levels), capital lease repayments, corporate general and administrative expenses, mine explorationwithin the known resources and rehabilitation accretion and amortization related to current operations. AISC excludes capital expenditures for significant improvements atexisting operations deemed to be expansionary in nature, exploration and evaluation related to growth projects, rehabilitation accretion and amortization not related to currentoperations, financing costs, debt repayments, share-based compensation not related to operations, and taxes.
Additional InformationNotes for Page 27: For information regarding mineral resource and reserve estimates, including parameters used to generate the estimates and depletion, please see thetechnical reports titled: NI43-101 TECHNICAL REPORT FOSTERVILLE GOLD MINE, VICTORIA, AUSTRALIA PREPARED FOR CROCODILE GOLD CORP dated March 31, 2015 and;NI43-101 TECHNICAL REPORT – BIG HILL ENHANCED DEVELOPMENT PROJECT AT STAWELL GOLD MINE MINERAL RESOURCES & RESERVES PREPARED FOR CROCODILE GOLDCORP dated June 6, 2014. For the Northern Territory Mineral Reserve Estimates please refer to the technical reports titled: REPORT ON THE MINERAL RESOURCES & MINERALRESERVES OF THE COSMO DEEPS GOLD PROJECT dated March 31, 2015; NI 43-101 TECHNICAL REPORT STAWELL GOLD MINE, VICTORIA, AUSTRALIA PREPARED FOR CROCODILEGOLD CORP dated March 31, 2015; REPORT ON THE MINERAL RESOURCES & MINERAL RESERVES OF THE UNION REEFS GOLD PROJECT dated December 31, 2012; REPORT ONTHE MINERAL RESOURCES & MINERAL RESERVES OF THE PINE CREEK GOLD PROJECT dated December 31, 2012; REPORT ON THE MINERAL RESOURCES & MINERAL RESERVES OFTHE MAUD CREEK GOLD PROJECT dated December 31, 2012 and; REPORT ON THE MINERAL RESOURCES & MINERAL RESERVES OF THE BURNSIDE GOLD AND BASE METALPROJECT dated December 12, 2013.Mineral resources that are not mineral reserves do not have demonstrated economic viability.
Qualified PersonMark Edwards, MAusIMM (CP), MAIG, General Manager, Exploration, Newmarket Gold, is a "qualified person" as such term is defined in National Instrument 43-101 and hasreviewed and approved the technical information and data included in this presentation.