Newhall single family homes January 2015
20
Dec-2014 465,000 Dec-2012 572,000 % -19 Change -107,000 Dec-2012 vs Dec-2014: The median sold price is down -19% Median Sold Price by Month RE/MAX's Paris911 Team Dec-2012 vs. Dec-2014 Connor and Paris MacIVOR Clarus MarketMetrics® 01/02/2015 Information not guaranteed. © 2015 - 2016 Terradatum and its suppliers and licensors (www.terradatum.com/about/partners). 1/2 MLS: CRMLS Bedrooms: All All Construction Type: All 2 Year Monthly SqFt: Bathrooms: Lot Size: All All Square Footage Period: All Cities: Property Types: : Residential Newhall Price:
-
Upload
connor-t-macivor -
Category
Real Estate
-
view
228 -
download
2
Transcript of Newhall single family homes January 2015
Dec-2014465,000
Dec-2012572,000
%-19
Change-107,000
Dec-2012 vs Dec-2014: The median sold price is down -19%Median Sold Price by Month
RE/MAX's Paris911 Team
Dec-2012 vs. Dec-2014
Connor and Paris MacIVOR
Clarus MarketMetrics® 01/02/2015Information not guaranteed. © 2015 - 2016 Terradatum and its suppliers and licensors (www.terradatum.com/about/partners).
1/2
MLS: CRMLS Bedrooms:AllAll
Construction Type:All2 Year Monthly SqFt:
Bathrooms: Lot Size:All All Square FootagePeriod:All
Cities:Property Types: : Residential
NewhallPrice:

Median Sold Price by MonthDec-2012 vs Dec-2014: The median sold price is down -19%
RE/MAX's Paris911 TeamConnor and Paris MacIVOR
Sold Median Price Units Avg DOMTime Period
Dec-14 465,000 1 60
Nov-14 467,000 15 102
Oct-14 485,000 19 69
Sep-14 437,495 10 56
Aug-14 483,000 19 92
Jul-14 435,000 13 58
Jun-14 425,000 12 80
May-14 486,000 20 70
Apr-14 445,000 15 84
Mar-14 440,000 12 77
Feb-14 426,250 12 100
Jan-14 417,000 11 66
Dec-13 436,500 12 75
Nov-13 429,900 11 65
Oct-13 400,500 12 56
Sep-13 425,000 13 71
Aug-13 475,000 15 75
Jul-13 437,000 21 47
Jun-13 540,000 13 78
May-13 450,000 22 88
Apr-13 475,000 21 67
Mar-13 465,000 8 64
Feb-13 341,000 13 84
Jan-13 374,000 18 101
Dec-12 572,000 8 127
Clarus MarketMetrics® 01/02/2015Information not guaranteed. © 2015 - 2016 Terradatum and its suppliers and licensors (www.terradatum.com/about/partners).
22/

Dec-2012 vs Dec-2014: The median price of for sale properties is up 13% and the median price of sold properties is down -19%
RE/MAX's Paris911 Team
Dec-2012 vs. Dec-2014
485,000 13
Connor and Paris MacIVOR
550,000Dec-2014
Median For Sale vs Median Sold
ChangeDec-2012 %65,000
Dec-2012 Dec-2014 %572,000 -19
Dec-2012 vs. Dec-2014
465,000Change-107,000
Clarus MarketMetrics® 01/02/2015Information not guaranteed. © 2015 - 2016 Terradatum and its suppliers and licensors (www.terradatum.com/about/partners).
1/2
MLS: CRMLS Bedrooms:AllAll
Construction Type:All2 Year Monthly SqFt:
Bathrooms: Lot Size:All All Square FootagePeriod:All
Cities:Property Types: : Residential
NewhallPrice:

Median For Sale vs Median SoldDec-2012 vs Dec-2014: The median price of for sale properties is up 13% and the median price of sold properties is down -19%
RE/MAX's Paris911 TeamConnor and Paris MacIVOR
For SaleMedian SoldMedianFor Sale # Properties # PropertiesSold Price Difference
Time Period
Dec-14 35 1550,000 465,000 -85,000Nov-14 54 15529,950 467,000 -62,950Oct-14 67 19500,000 485,000 -15,000Sep-14 82 10511,625 437,495 -74,130Aug-14 81 19520,000 483,000 -37,000Jul-14 83 13499,999 435,000 -64,999Jun-14 74 12494,450 425,000 -69,450May-14 69 20509,750 486,000 -23,750Apr-14 69 15470,000 445,000 -25,000Mar-14 65 12499,999 440,000 -59,999Feb-14 61 12472,000 426,250 -45,750Jan-14 57 11465,000 417,000 -48,000Dec-13 57 12450,000 436,500 -13,500Nov-13 61 11449,900 429,900 -20,000Oct-13 63 12459,995 400,500 -59,495Sep-13 57 13450,000 425,000 -25,000Aug-13 57 15435,000 475,000 40,000Jul-13 67 21439,000 437,000 -2,000Jun-13 58 13449,950 540,000 90,050May-13 66 22449,950 450,000 50Apr-13 45 21449,999 475,000 25,001Mar-13 63 8475,000 465,000 -10,000Feb-13 56 13482,000 341,000 -141,000Jan-13 49 18479,000 374,000 -105,000Dec-12 51 8485,000 572,000 87,000
Clarus MarketMetrics®Information not guaranteed. © 2015 - 2016 Terradatum and its suppliers and licensors (www.terradatum.com/about/partners).
01/02/201522/

Dec-20141
Dec-20128
%-87
Change-7
Dec-2012 vs Dec-2014: The number of Sold properties is down -87%Sold Properties by Month
RE/MAX's Paris911 Team
Dec-2012 vs. Dec-2014
Connor and Paris MacIVOR
Clarus MarketMetrics® 01/02/2015Information not guaranteed. © 2015 - 2016 Terradatum and its suppliers and licensors (www.terradatum.com/about/partners).
1/2
MLS: CRMLS Bedrooms:AllAll
Construction Type:All2 Year Monthly SqFt:
Bathrooms: Lot Size:All All Square FootagePeriod:All
Cities:Property Types: : Residential
NewhallPrice:

Sold Properties by MonthDec-2012 vs Dec-2014: The number of Sold properties is down -87%
RE/MAX's Paris911 TeamConnor and Paris MacIVOR
Time Period
Full Market
Units Median Price Avg DOM
Bank Properties
Units % Bank Median Price
Non-Bank Properties
Units % Non-Bank Median Price
Dec-14 465,0001 60 0 0.0 1 100.0 465,000
Nov-14 467,00015 102 2 13.3 420,000 13 86.7 467,000
Oct-14 485,00019 69 0 0.0 19 100.0 485,000
Sep-14 437,49510 56 2 20.0 420,000 8 80.0 457,495
Aug-14 483,00019 92 1 5.3 298,000 18 94.7 486,500
Jul-14 435,00013 58 0 0.0 13 100.0 435,000
Jun-14 425,00012 80 0 0.0 12 100.0 425,000
May-14 486,00020 70 3 15.0 407,000 17 85.0 516,000
Apr-14 445,00015 84 2 13.3 412,500 13 86.7 447,500
Mar-14 440,00012 77 2 16.7 372,500 10 83.3 471,000
Feb-14 426,25012 100 2 16.7 360,000 10 83.3 437,500
Jan-14 417,00011 66 0 0.0 11 100.0 417,000
Dec-13 436,50012 75 2 16.7 422,500 10 83.3 455,000
Nov-13 429,90011 65 1 9.1 360,000 10 90.9 434,950
Oct-13 400,50012 56 3 25.0 380,000 9 75.0 401,000
Sep-13 425,00013 71 1 7.7 425,000 12 92.3 429,500
Aug-13 475,00015 75 3 20.0 477,000 12 80.0 455,000
Jul-13 437,00021 47 4 19.0 408,500 17 81.0 438,500
Jun-13 540,00013 78 3 23.1 540,000 10 76.9 535,000
May-13 450,00022 88 5 22.7 364,500 17 77.3 469,999
Apr-13 475,00021 67 4 19.0 302,500 17 81.0 477,000
Mar-13 465,0008 64 1 12.5 375,000 7 87.5 500,000
Feb-13 341,00013 84 8 61.5 325,500 5 38.5 440,000
Jan-13 374,00018 101 8 44.4 317,000 10 55.6 450,000
Dec-12 572,0008 127 4 50.0 570,000 4 50.0 592,000
Clarus MarketMetrics® 01/02/2015Information not guaranteed. © 2015 - 2016 Terradatum and its suppliers and licensors (www.terradatum.com/about/partners).
22/

Dec-20141
Dec-201215
%-93
Change-14
Dec-2012 vs Dec-2014: The number of Under Contract properties is down -93%Under Contract Properties by Month
RE/MAX's Paris911 Team
Dec-2012 vs. Dec-2014
Connor and Paris MacIVOR
Clarus MarketMetrics® 01/02/2015Information not guaranteed. © 2015 - 2016 Terradatum and its suppliers and licensors (www.terradatum.com/about/partners).
1/2
AllBathrooms: SqFt:All
: Residential
All Square FootageConstruction Type: Lot Size:CRMLS
Newhall
Period: 2 Year MonthlyPrice:MLS:
All AllAll
Property Types:
Bedrooms:
Cities:

Under Contract Properties by MonthDec-2012 vs Dec-2014: The number of Under Contract properties is down -93%
RE/MAX's Paris911 TeamConnor and Paris MacIVOR
Median Price UnitsUnits Median Price% Non-Bank
Full Market
% BankAvg DOMMedian Price
Bank Properties
Units
Non-Bank Properties
Time PeriodDec-14 415,0001 57 0.00415,000100.01Nov-14 454,50010 42 492,00060.06437,50040.04Oct-14 467,00018 82 467,000100.0180.00Sep-14 475,00015 68 467,00066.710499,00033.35Aug-14 499,99915 60 499,99986.713532,50013.32Jul-14 460,00020 92 460,000100.0200.00Jun-14 435,00013 68 441,25092.312400,0007.71May-14 499,99913 95 499,999100.0130.00Apr-14 449,50019 46 470,00089.517402,00010.52Mar-14 459,99517 70 482,45082.414425,00017.63Feb-14 411,95012 86 428,95083.310360,00016.72Jan-14 475,00011 106 497,00090.910399,9009.11Dec-13 419,90011 49 409,85090.910419,9009.11Nov-13 439,00013 103 445,00084.611411,10015.42Oct-13 499,99911 72 497,49990.910550,0009.11Sep-13 409,9007 35 409,900100.070.00Aug-13 412,00016 56 412,00087.514312,50012.52Jul-13 472,00020 72 475,00075.015400,00025.05Jun-13 449,75016 46 450,00093.815350,0006.21May-13 475,00017 60 497,00082.414350,00017.63Apr-13 425,90012 58 427,95066.78422,45033.34Mar-13 527,50022 96 550,00086.419294,90013.63Feb-13 449,47514 69 479,00064.39343,66435.75Jan-13 441,75010 98 523,75060.06342,45040.04Dec-12 409,00015 96 454,47566.710320,00033.35
Clarus MarketMetrics® 01/02/2015Information not guaranteed. © 2015 - 2016 Terradatum and its suppliers and licensors (www.terradatum.com/about/partners).
22/
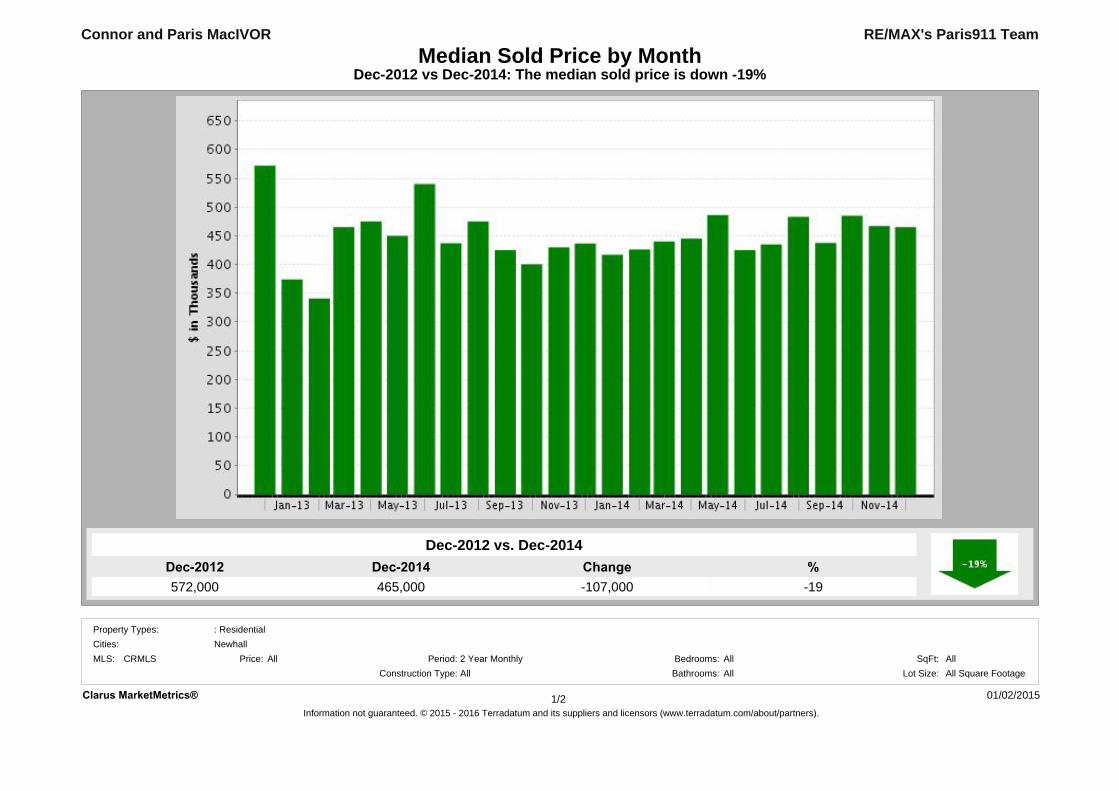
Dec-20140
Dec-20127
%-100
Change-7
Dec-2012 vs Dec-2014: The number of New properties is down -100%New Properties by Month
RE/MAX's Paris911 Team
Dec-2012 vs. Dec-2014
Connor and Paris MacIVOR
Clarus MarketMetrics® 01/02/2015Information not guaranteed. © 2015 - 2016 Terradatum and its suppliers and licensors (www.terradatum.com/about/partners).
1/2
MLS: CRMLS Bedrooms:AllAll
Construction Type:All2 Year Monthly SqFt:
Bathrooms: Lot Size:All All Square FootagePeriod:All
Cities:Property Types: : Residential
NewhallPrice:
New Properties by MonthDec-2012 vs Dec-2014: The number of New properties is down -100%
RE/MAX's Paris911 TeamConnor and Paris MacIVOR
Median Price UnitsUnits Median Price% Non-Bank
Full Market
% BankMedian Price
Bank Properties
Units
Non-Bank Properties
Time PeriodDec-14 0 0 0Nov-14 515,00013 1 7.7 425,000 12 92.3 517,450Oct-14 454,50016 3 18.8 450,000 13 81.2 465,000Sep-14 482,00024 5 20.8 500,000 19 79.2 475,000Aug-14 509,45024 2 8.3 437,500 22 91.7 534,950Jul-14 494,74528 4 14.3 534,500 24 85.7 487,250Jun-14 474,47522 2 9.1 419,475 20 90.9 474,475May-14 529,62524 0 0.0 24 100.0 529,625Apr-14 445,00025 1 4.0 400,000 24 96.0 447,000Mar-14 506,95020 4 20.0 410,500 16 80.0 537,475Feb-14 474,70020 2 10.0 394,250 18 90.0 507,350Jan-14 467,00016 1 6.2 525,000 15 93.8 459,000Dec-13 434,50012 2 16.7 409,900 10 83.3 439,500Nov-13 427,49514 3 21.4 425,000 11 78.6 429,990Oct-13 447,50016 1 6.2 550,000 15 93.8 445,000Sep-13 449,90019 0 0.0 19 100.0 449,900Aug-13 432,49916 4 25.0 370,000 12 75.0 514,499Jul-13 432,45030 5 16.7 390,000 25 83.3 435,000Jun-13 449,45012 2 16.7 475,000 10 83.3 449,450May-13 449,00035 6 17.1 337,500 29 82.9 450,000Apr-13 475,00011 1 9.1 424,900 10 90.9 487,000Mar-13 449,90021 6 28.6 373,950 15 71.4 459,900Feb-13 455,00019 5 26.3 300,000 14 73.7 557,000Jan-13 429,00017 5 29.4 314,900 12 70.6 439,000Dec-12 519,9507 2 28.6 574,950 5 71.4 480,000
Clarus MarketMetrics® 01/02/2015Information not guaranteed. © 2015 - 2016 Terradatum and its suppliers and licensors (www.terradatum.com/about/partners).
22/

Dec-201435
Dec-201251
%-31
Change-16
Dec-2012 vs Dec-2014: The number of For Sale properties is down -31%For Sale Properties by Month
RE/MAX's Paris911 Team
Dec-2012 vs. Dec-2014
Connor and Paris MacIVOR
Clarus MarketMetrics® 01/02/2015Information not guaranteed. © 2015 - 2016 Terradatum and its suppliers and licensors (www.terradatum.com/about/partners).
1/2
MLS: CRMLS Bedrooms:AllAll
Construction Type:All2 Year Monthly SqFt:
Bathrooms: Lot Size:All All Square FootagePeriod:All
Cities:Property Types: : Residential
NewhallPrice:

For Sale Properties by MonthDec-2012 vs Dec-2014: The number of For Sale properties is down -31%
RE/MAX's Paris911 TeamConnor and Paris MacIVOR
Median Price UnitsUnits Median Price% Non-Bank
Full Market
% BankAvg DOMMedian Price
Bank Properties
Units
Non-Bank Properties
Time Period
Dec-14 550,00035 130 5 14.3 500,000 30 85.7 582,000Nov-14 529,95054 88 9 16.7 450,000 45 83.3 549,900Oct-14 500,00067 83 8 11.9 454,500 59 88.1 520,000Sep-14 511,62582 74 12 14.6 499,500 70 85.4 517,000Aug-14 520,00081 72 10 12.3 477,000 71 87.7 534,900Jul-14 499,99983 72 8 9.6 509,000 75 90.4 499,999Jun-14 494,45074 77 6 8.1 428,500 68 91.9 511,875May-14 509,75069 78 5 7.2 435,000 64 92.8 517,450Apr-14 470,00069 74 8 11.6 404,500 61 88.4 499,000Mar-14 499,99965 77 10 15.4 418,500 55 84.6 549,950Feb-14 472,00061 79 10 16.4 410,000 51 83.6 514,800Jan-14 465,00057 98 9 15.8 399,900 48 84.2 494,499Dec-13 450,00057 99 10 17.5 397,450 47 82.5 479,000Nov-13 449,90061 88 10 16.4 392,500 51 83.6 472,000Oct-13 459,99563 83 9 14.3 383,200 54 85.7 484,000Sep-13 450,00057 85 11 19.3 350,000 46 80.7 497,000Aug-13 435,00057 79 14 24.6 357,500 43 75.4 452,000Jul-13 439,00067 76 16 23.9 374,100 51 76.1 455,000Jun-13 449,95058 83 13 22.4 350,000 45 77.6 480,000May-13 449,95066 65 14 21.2 350,000 52 78.8 489,500Apr-13 449,99945 81 12 26.7 400,000 33 73.3 489,000Mar-13 475,00063 97 17 27.0 382,900 46 73.0 517,000Feb-13 482,00056 106 16 28.6 347,200 40 71.4 557,000Jan-13 479,00049 128 15 30.6 370,000 34 69.4 554,900Dec-12 485,00051 130 17 33.3 370,000 34 66.7 574,900
Clarus MarketMetrics® 01/02/2015Information not guaranteed. © 2015 - 2016 Terradatum and its suppliers and licensors (www.terradatum.com/about/partners).
22/

Dec-20140
Dec-20124
%-100
Change-4
Dec-2012 vs Dec-2014: The number of Expired properties is down -100%Expired Properties by Month
RE/MAX's Paris911 Team
Dec-2012 vs. Dec-2014
Connor and Paris MacIVOR
01/02/2015Clarus MarketMetrics® 1/2
MLS: CRMLS Bedrooms:AllAll
Construction Type:All2 Year Monthly SqFt:
Bathrooms: Lot Size:All All Square FootagePeriod:All
Cities:Property Types: : Residential
NewhallPrice:

Expired Properties by MonthDec-2012 vs Dec-2014: The number of Expired properties is down -100%
RE/MAX's Paris911 TeamConnor and Paris MacIVOR
Median Price Units% BankAvg DOMUnits Median Price
Bank Properties
Units
Non-Bank Properties
% Non-Bank Median Price
Full Market
Dec-14 0 0 0Nov-14 489,9009 78 0 0.0 9 100.0 489,900Oct-14 559,5008 62 0 0.0 8 100.0 559,500Sep-14 564,50016 66 2 12.5 429,475 14 87.5 617,500Aug-14 558,9508 126 1 12.5 455,000 7 87.5 569,900Jul-14 452,0006 76 0 0.0 6 100.0 452,000Jun-14 478,4506 118 1 16.7 457,000 5 83.3 484,900May-14 432,0004 39 1 25.0 435,000 3 75.0 429,000Apr-14 395,0005 91 1 20.0 300,000 4 80.0 410,000Mar-14 664,5004 36 0 0.0 4 100.0 664,500Feb-14 482,5004 106 2 50.0 370,000 2 50.0 632,500Jan-14 429,0005 88 0 0.0 5 100.0 429,000Dec-13 499,0005 75 1 20.0 325,000 4 80.0 549,000Nov-13 499,0003 56 0 0.0 3 100.0 499,000Oct-13 450,0005 50 1 20.0 365,000 4 80.0 499,750Sep-13 340,0003 131 3 100.0 340,000 0 0.0Aug-13 419,0003 47 1 33.3 390,000 2 66.7 617,000Jul-13 452,4506 70 1 16.7 400,000 5 83.3 455,000Jun-13 449,0005 86 1 20.0 350,000 4 80.0 509,400May-13 439,9003 66 0 0.0 3 100.0 439,900Apr-13 1,024,4502 42 0 0.0 2 100.0 1,024,450Mar-13 485,0007 201 3 42.9 399,000 4 57.1 494,000Feb-13 0 0 0Jan-13 584,9992 141 0 0.0 2 100.0 584,999Dec-12 512,0004 76 2 50.0 347,500 2 50.0 719,000
Clarus MarketMetrics® 01/02/2015Information not guaranteed. © 2015 - 2016 Terradatum and its suppliers and licensors (www.terradatum.com/about/partners).
22/

Dec-2012 vs Dec-2014: The number of for sale properties is down -31% and the number of sold properties is down -87%
RE/MAX's Paris911 Team
Dec-2012 vs. Dec-2014
51 -31
Connor and Paris MacIVOR
35Dec-2014
Supply & Demand by Month
ChangeDec-2012 %-16
Dec-2012 Dec-2014 %8 -87
Dec-2012 vs. Dec-2014
1Change
-7
Clarus MarketMetrics® 01/02/2015Information not guaranteed. © 2015 - 2016 Terradatum and its suppliers and licensors (www.terradatum.com/about/partners).
1/2
MLS: CRMLS Bedrooms:AllAll
Construction Type:All2 Year Monthly SqFt:
Bathrooms: Lot Size:All All Square FootagePeriod:All
Cities:Property Types: : Residential
NewhallPrice:

Supply & Demand by MonthDec-2012 vs Dec-2014: The number of for sale properties is down -31% and the number of sold properties is down -87%
Connor and Paris MacIVOR RE/MAX's Paris911 Team
For Sale Sold# Properties
Avg DOM Avg DOM# Properties
Time Period
Dec-14 130 6035 1Nov-14 88 10254 15Oct-14 83 6967 19Sep-14 74 5682 10Aug-14 72 9281 19Jul-14 72 5883 13Jun-14 77 8074 12May-14 78 7069 20Apr-14 74 8469 15Mar-14 77 7765 12Feb-14 79 10061 12Jan-14 98 6657 11Dec-13 99 7557 12Nov-13 88 6561 11Oct-13 83 5663 12Sep-13 85 7157 13Aug-13 79 7557 15Jul-13 76 4767 21Jun-13 83 7858 13May-13 65 8866 22Apr-13 81 6745 21Mar-13 97 6463 8Feb-13 106 8456 13Jan-13 128 10149 18Dec-12 130 12751 8
Clarus MarketMetrics® 01/02/2015Information not guaranteed. © 2015 - 2016 Terradatum and its suppliers and licensors (www.terradatum.com/about/partners).
22/
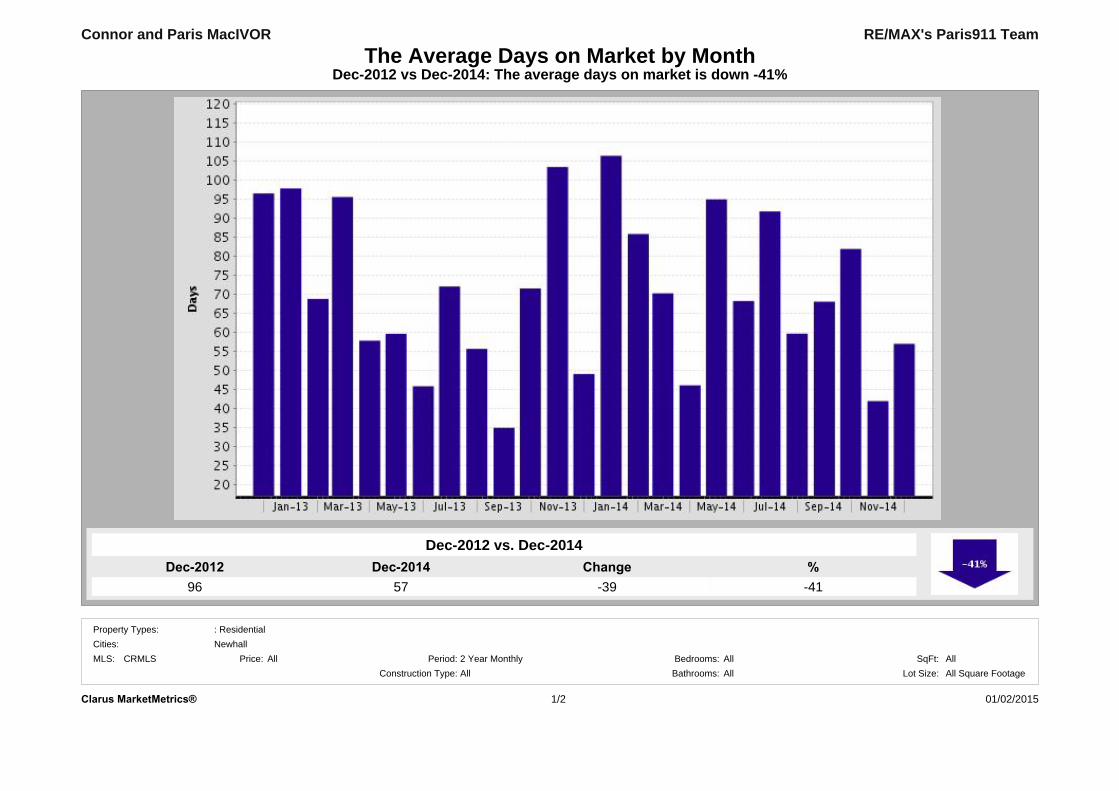
Dec-201457
Dec-201296
%-41
Change-39
Dec-2012 vs Dec-2014: The average days on market is down -41%The Average Days on Market by Month
RE/MAX's Paris911 Team
Dec-2012 vs. Dec-2014
Connor and Paris MacIVOR
NewhallAll 2 Year Monthly
Cities:Period:Price:
Property Types: : Residential
01/02/20151/2Clarus MarketMetrics®
All Square FootageBedrooms: All AllSqFt:
All Lot Size:Bathrooms:AllConstruction Type:MLS: CRMLS

The Average Days on Market by MonthDec-2012 vs Dec-2014: The average days on market is down -41%
RE/MAX's Paris911 TeamConnor and Paris MacIVOR
# UC UnitsAvg DOMTime PeriodDec-14 157Nov-14 1042Oct-14 1882Sep-14 1568Aug-14 1560Jul-14 2092Jun-14 1368May-14 1395Apr-14 1946Mar-14 1770Feb-14 1286Jan-14 11106Dec-13 1149Nov-13 13103Oct-13 1172Sep-13 735Aug-13 1656Jul-13 2072Jun-13 1646May-13 1760Apr-13 1258Mar-13 2296Feb-13 1469Jan-13 1098Dec-12 1596
Clarus MarketMetrics® 2/2 01/02/2015Information not guaranteed. © 2015 - 2016 Terradatum and its suppliers and licensors (www.terradatum.com/about/partners).

Dec-2012 vs Dec-2014: The average months supply of inventory is up 1494.0%
RE/MAX's Paris911 Team
Dec-2012 vs. Dec-2014
2.1 1494.0
Connor and Paris MacIVOR
34.0Dec-2014
Months Supply of Inventory
ChangeDec-2012 %31.9
Clarus MarketMetrics® 01/02/2015Information not guaranteed. © 2015 - 2016 Terradatum and its suppliers and licensors (www.terradatum.com/about/partners).
1/2
MLS: CRMLS Bedrooms:AllAll
Construction Type:All2 Year Monthly SqFt:
Bathrooms: Lot Size:All All Square FootagePeriod:All
Cities:Property Types: : Residential
NewhallPrice:

Months Supply of InventoryDec-2012 vs Dec-2014: The average months supply of inventory is up 1494.0%
Connor and Paris MacIVOR RE/MAX's Paris911 Team
During MonthLast Day of Month MSI# Units For Sale # UC Units
UC Avg DOMTime Period
Dec-14 1 5734 34.0Nov-14 10 4235 3.5Oct-14 18 8241 2.3Sep-14 15 6851 3.4Aug-14 15 6058 3.9Jul-14 20 9257 2.8Jun-14 13 6855 4.2May-14 13 9552 4.0Apr-14 19 4645 2.4Mar-14 17 7044 2.6Feb-14 12 8645 3.8Jan-14 11 10641 3.7Dec-13 11 4941 3.7Nov-13 13 10345 3.5Oct-13 11 7247 4.3Sep-13 7 3547 6.7Aug-13 16 5638 2.4Jul-13 20 7241 2.0Jun-13 16 4637 2.3May-13 17 6046 2.7Apr-13 12 5831 2.6Mar-13 22 9634 1.5Feb-13 14 6942 3.0Jan-13 10 9837 3.7Dec-12 15 9632 2.1
Clarus MarketMetrics® 01/02/2015Information not guaranteed. © 2015 - 2016 Terradatum and its suppliers and licensors (www.terradatum.com/about/partners).
22/