Newfoundland and Labrador Provincial Tourism … · Department of Tourism, Culture, Industry and...
35
Department of Tourism, Culture, Industry and Innovation Newfoundland and Labrador Provincial Tourism Performance 2016 Highlights In 2016, the Department of Tourism, Culture, Industry and Innovation (TCII) conducted its Non-resident Visitor Exit Survey. The results of this survey are critical inputs to estimate non- resident visitor numbers as well as non-resident visitor spending. As TCII is still processing the results of the survey, some estimates are not available at the time of writing. These estimates include: non-resident air visitation as well as non-resident air and auto spending. This also affects the availability of total visitation and spending estimates. Non-resident automobile visitation to the province reached an estimated 101,000 visitors in 2016, an increase of 4.8% compared to 2015 levels. A review of detailed itinerary information provided by the Cruise Association of Newfoundland and Labrador (CANL) indicates that the province received approximately 23,545 unique cruise visitors during the 2016 cruise season, an increase of 9.2% compared to the previous season. 2015 – 2016 Non-resident Visitors by Mode of Transportation 2015 2016 Year-over-Year Change Non-resident visitors – air 385,068 n/a n/a Non-resident visitors – auto 96,383 101,004 4.8% Sub-total (air and auto) 481,451 n/a n/a Non-resident visitors - cruise 21,563 23,545 9.2% Grand Total 503,014 n/a n/a 2015 2016 Year-over-Year Change Non-resident expenditures – air $399.9 n/a n/a Non-resident expenditures – auto $91.0 n/a n/a Sub-total (air and auto) $490.9 n/a n/a Non-resident expenditures - cruise $1.9 $2.1 10.5% Grand Total $492.8 n/a n/a
Transcript of Newfoundland and Labrador Provincial Tourism … · Department of Tourism, Culture, Industry and...
Department of Tourism, Culture, Industry and Innovation
Newfoundland and Labrador Provincial Tourism Performance 2016
Highlights
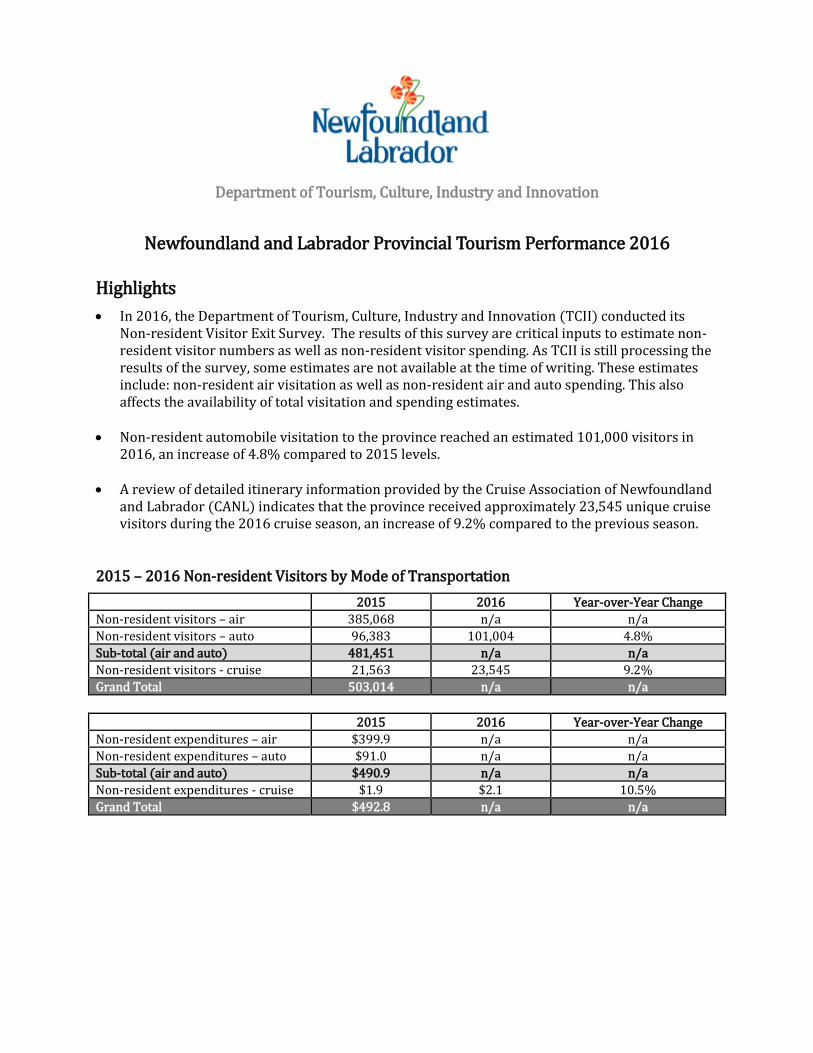
In 2016, the Department of Tourism, Culture, Industry and Innovation (TCII) conducted its Non-resident Visitor Exit Survey. The results of this survey are critical inputs to estimate non-resident visitor numbers as well as non-resident visitor spending. As TCII is still processing the results of the survey, some estimates are not available at the time of writing. These estimates include: non-resident air visitation as well as non-resident air and auto spending. This also affects the availability of total visitation and spending estimates.
Non-resident automobile visitation to the province reached an estimated 101,000 visitors in 2016, an increase of 4.8% compared to 2015 levels.
A review of detailed itinerary information provided by the Cruise Association of Newfoundland and Labrador (CANL) indicates that the province received approximately 23,545 unique cruise visitors during the 2016 cruise season, an increase of 9.2% compared to the previous season.
2015 – 2016 Non-resident Visitors by Mode of Transportation
2015 2016 Year-over-Year Change
Non-resident visitors – air 385,068 n/a n/a
Non-resident visitors – auto 96,383 101,004 4.8%
Sub-total (air and auto) 481,451 n/a n/a
Non-resident visitors - cruise 21,563 23,545 9.2%
Grand Total 503,014 n/a n/a
2015 2016 Year-over-Year Change
Non-resident expenditures – air $399.9 n/a n/a
Non-resident expenditures – auto $91.0 n/a n/a
Sub-total (air and auto) $490.9 n/a n/a
Non-resident expenditures - cruise $1.9 $2.1 10.5%
Grand Total $492.8 n/a n/a
2
Provincial Tourism Performance Indicators Provincial Airports
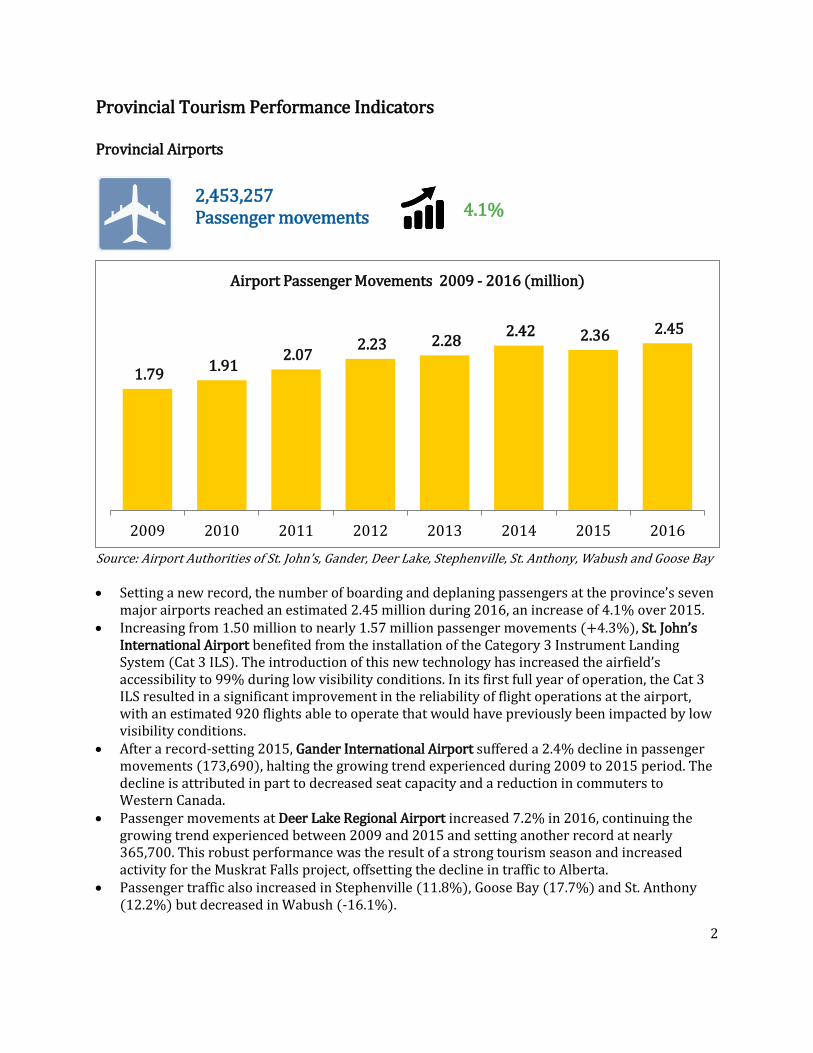
Source: Airport Authorities of St. John’s, Gander, Deer Lake, Stephenville, St. Anthony, Wabush and Goose Bay Setting a new record, the number of boarding and deplaning passengers at the province’s seven
major airports reached an estimated 2.45 million during 2016, an increase of 4.1% over 2015. Increasing from 1.50 million to nearly 1.57 million passenger movements (+4.3%), St. John’s
International Airport benefited from the installation of the Category 3 Instrument Landing System (Cat 3 ILS). The introduction of this new technology has increased the airfield’s accessibility to 99% during low visibility conditions. In its first full year of operation, the Cat 3 ILS resulted in a significant improvement in the reliability of flight operations at the airport, with an estimated 920 flights able to operate that would have previously been impacted by low visibility conditions.
After a record-setting 2015, Gander International Airport suffered a 2.4% decline in passenger movements (173,690), halting the growing trend experienced during 2009 to 2015 period. The decline is attributed in part to decreased seat capacity and a reduction in commuters to Western Canada.
Passenger movements at Deer Lake Regional Airport increased 7.2% in 2016, continuing the growing trend experienced between 2009 and 2015 and setting another record at nearly 365,700. This robust performance was the result of a strong tourism season and increased activity for the Muskrat Falls project, offsetting the decline in traffic to Alberta.
Passenger traffic also increased in Stephenville (11.8%), Goose Bay (17.7%) and St. Anthony (12.2%) but decreased in Wabush (-16.1%).
1.79 1.91
2.07 2.23 2.28
2.42 2.36 2.45
2009 2010 2011 2012 2013 2014 2015 2016
Airport Passenger Movements 2009 - 2016 (million)
2,453,257 Passenger movements 4.1%
3
Marine Atlantic Ferry Service
Source: Marine Atlantic traffic reports
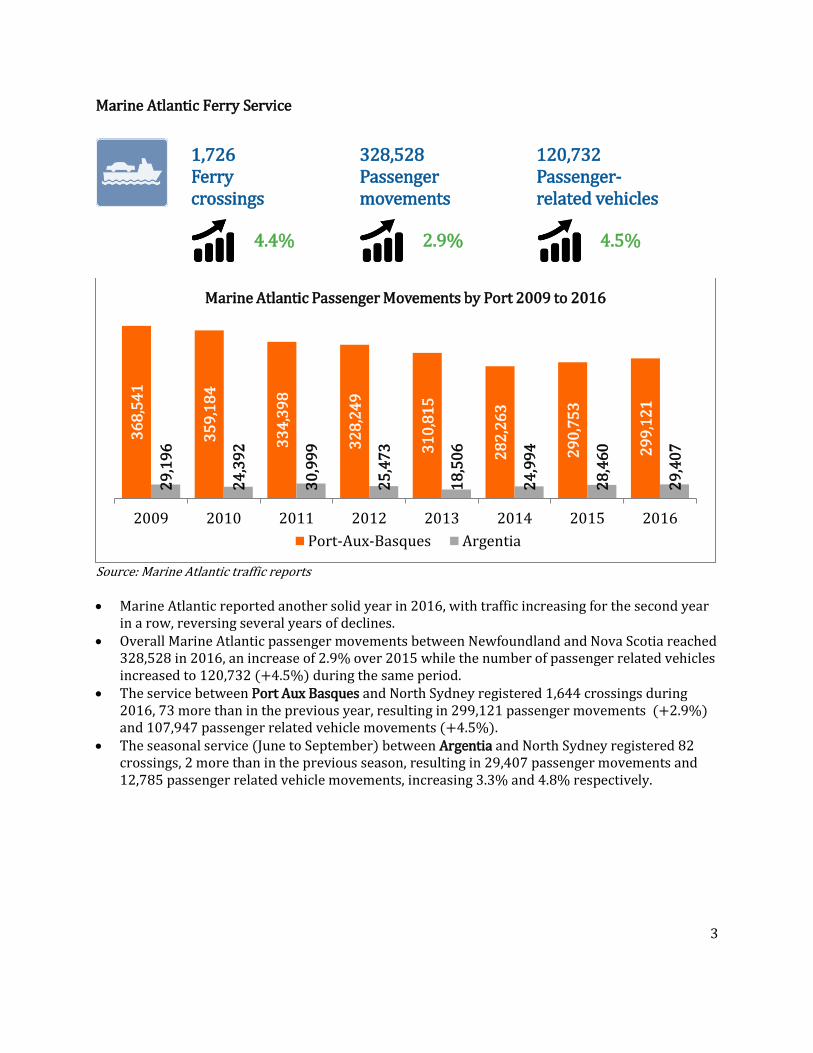
Marine Atlantic reported another solid year in 2016, with traffic increasing for the second year
in a row, reversing several years of declines. Overall Marine Atlantic passenger movements between Newfoundland and Nova Scotia reached
328,528 in 2016, an increase of 2.9% over 2015 while the number of passenger related vehicles increased to 120,732 (+4.5%) during the same period.
The service between Port Aux Basques and North Sydney registered 1,644 crossings during 2016, 73 more than in the previous year, resulting in 299,121 passenger movements (+2.9%) and 107,947 passenger related vehicle movements (+4.5%).
The seasonal service (June to September) between Argentia and North Sydney registered 82 crossings, 2 more than in the previous season, resulting in 29,407 passenger movements and 12,785 passenger related vehicle movements, increasing 3.3% and 4.8% respectively.
36
8,5
41
35
9,1
84
33
4,3
98
32
8,2
49
31
0,8
15
28
2,2
63
29
0,7
53
29
9,1
21
29
,19
6
24
,39
2
30
,99
9
25
,47
3
18
,50
6
24
,99
4
28
,46
0
29
,40
7
2009 2010 2011 2012 2013 2014 2015 2016
Marine Atlantic Passenger Movements by Port 2009 to 2016
Port-Aux-Basques Argentia
1,726 Ferry crossings
328,528 Passenger movements
120,732 Passenger-related vehicles
4.5% 2.9% 4.4%
4
Cruise activity
Source: Cruise Association of Newfoundland and Labrador
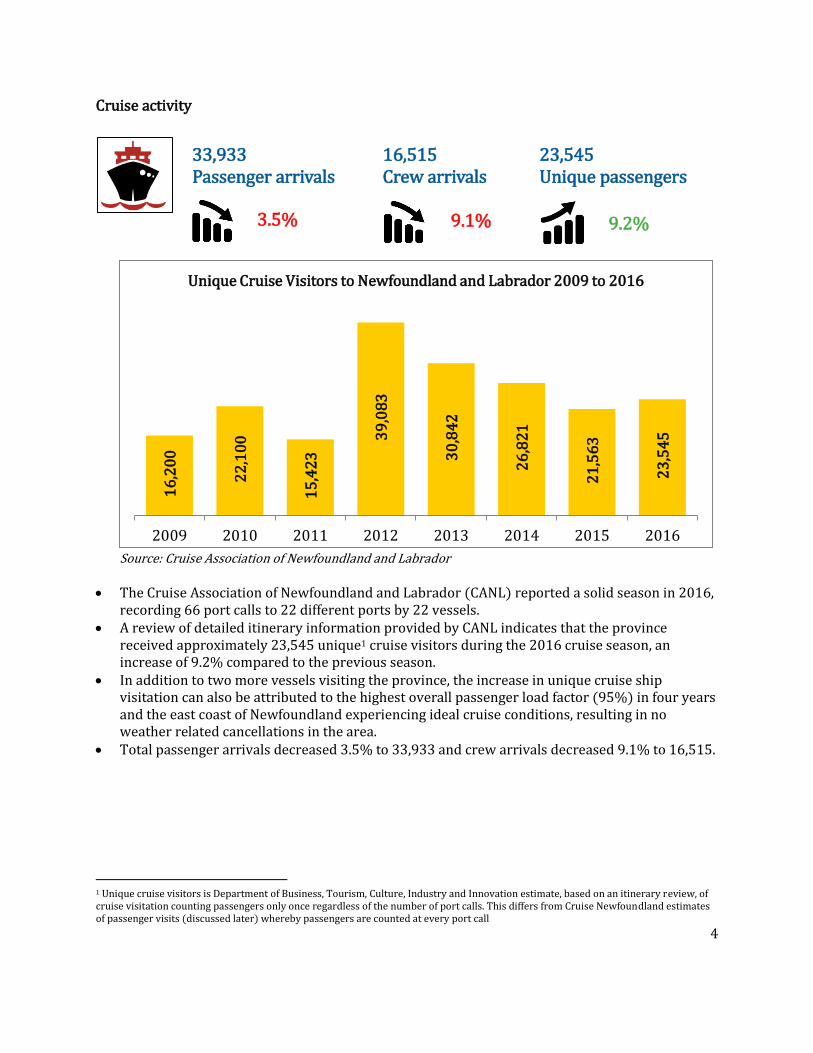
The Cruise Association of Newfoundland and Labrador (CANL) reported a solid season in 2016, recording 66 port calls to 22 different ports by 22 vessels.
A review of detailed itinerary information provided by CANL indicates that the province received approximately 23,545 unique1 cruise visitors during the 2016 cruise season, an increase of 9.2% compared to the previous season.
In addition to two more vessels visiting the province, the increase in unique cruise ship visitation can also be attributed to the highest overall passenger load factor (95%) in four years and the east coast of Newfoundland experiencing ideal cruise conditions, resulting in no weather related cancellations in the area.
Total passenger arrivals decreased 3.5% to 33,933 and crew arrivals decreased 9.1% to 16,515.
1 Unique cruise visitors is Department of Business, Tourism, Culture, Industry and Innovation estimate, based on an itinerary review, of cruise visitation counting passengers only once regardless of the number of port calls. This differs from Cruise Newfoundland estimates of passenger visits (discussed later) whereby passengers are counted at every port call
16
,20
0
22
,10
0
15
,42
3 3
9,0
83
30
,84
2
26
,82
1
21
,56
3
23
,54
5
2009 2010 2011 2012 2013 2014 2015 2016
Unique Cruise Visitors to Newfoundland and Labrador 2009 to 2016
33,933 Passenger arrivals
16,515 Crew arrivals
23,545 Unique passengers
3.5% 9.1% 9.2%
5
Roofed Accommodations - Occupancy
Source: Department of Tourism, Culture, Industry and Innovation
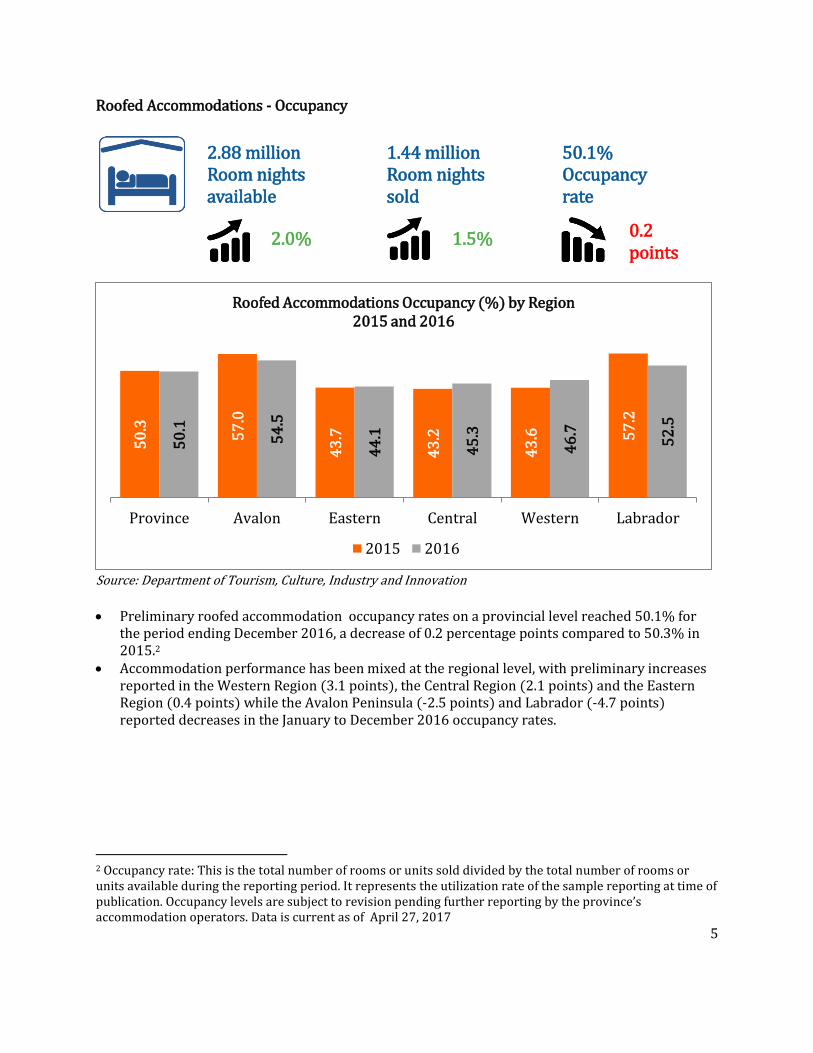
Preliminary roofed accommodation occupancy rates on a provincial level reached 50.1% for
the period ending December 2016, a decrease of 0.2 percentage points compared to 50.3% in 2015.2
Accommodation performance has been mixed at the regional level, with preliminary increases reported in the Western Region (3.1 points), the Central Region (2.1 points) and the Eastern Region (0.4 points) while the Avalon Peninsula (-2.5 points) and Labrador (-4.7 points) reported decreases in the January to December 2016 occupancy rates.
2 Occupancy rate: This is the total number of rooms or units sold divided by the total number of rooms or units available during the reporting period. It represents the utilization rate of the sample reporting at time of publication. Occupancy levels are subject to revision pending further reporting by the province’s accommodation operators. Data is current as of April 27, 2017
50
.3
57
.0
43
.7
43
.2
43
.6
57
.2
50
.1
54
.5
44
.1
45
.3
46
.7
52
.5
Province Avalon Eastern Central Western Labrador
Roofed Accommodations Occupancy (%) by Region 2015 and 2016
2015 2016
1.44 million Room nights sold
50.1% Occupancy rate
1.5% 0.2 points
2.88 million Room nights available
2.0%
6
Roofed Accommodations - Average Daily Rates
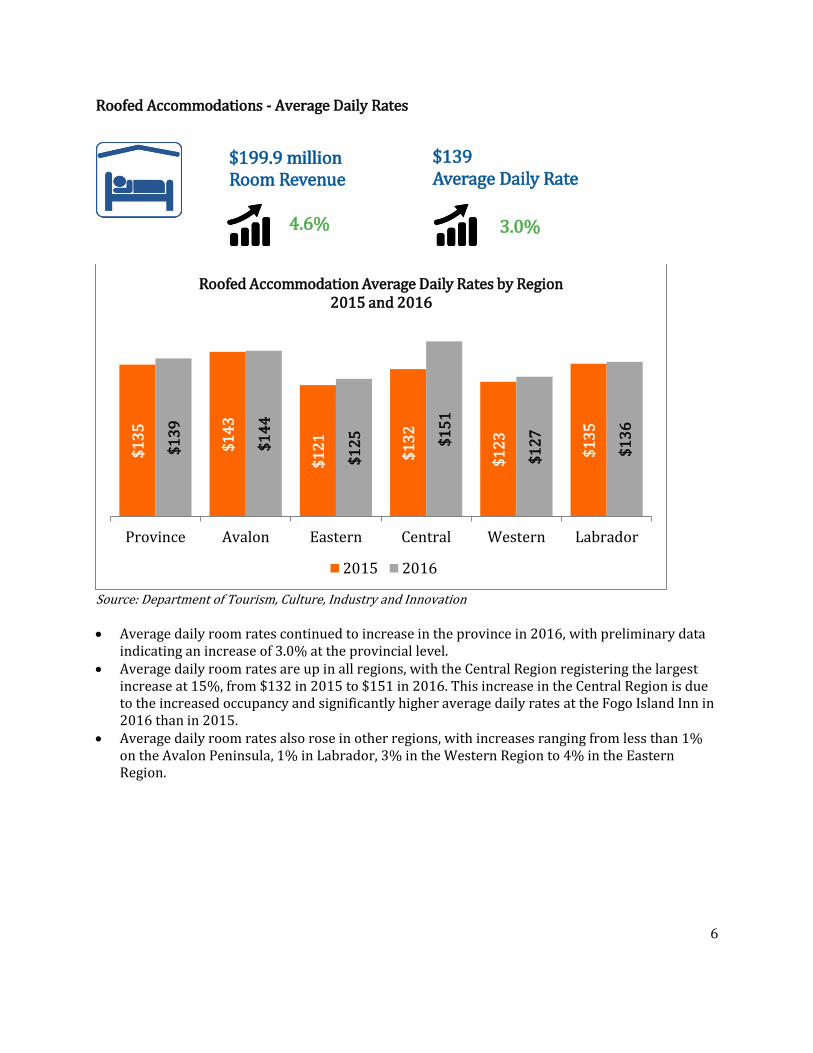
Source: Department of Tourism, Culture, Industry and Innovation Average daily room rates continued to increase in the province in 2016, with preliminary data
indicating an increase of 3.0% at the provincial level. Average daily room rates are up in all regions, with the Central Region registering the largest
increase at 15%, from $132 in 2015 to $151 in 2016. This increase in the Central Region is due to the increased occupancy and significantly higher average daily rates at the Fogo Island Inn in 2016 than in 2015.
Average daily room rates also rose in other regions, with increases ranging from less than 1% on the Avalon Peninsula, 1% in Labrador, 3% in the Western Region to 4% in the Eastern Region.
$1
35
$1
43
$1
21
$1
32
$1
23
$1
35
$1
39
$1
44
$1
25
$1
51
$1
27
$1
36
Province Avalon Eastern Central Western Labrador
Roofed Accommodation Average Daily Rates by Region 2015 and 2016
2015 2016
$199.9 million Room Revenue
4.6%
$139 Average Daily Rate
3.0%
7
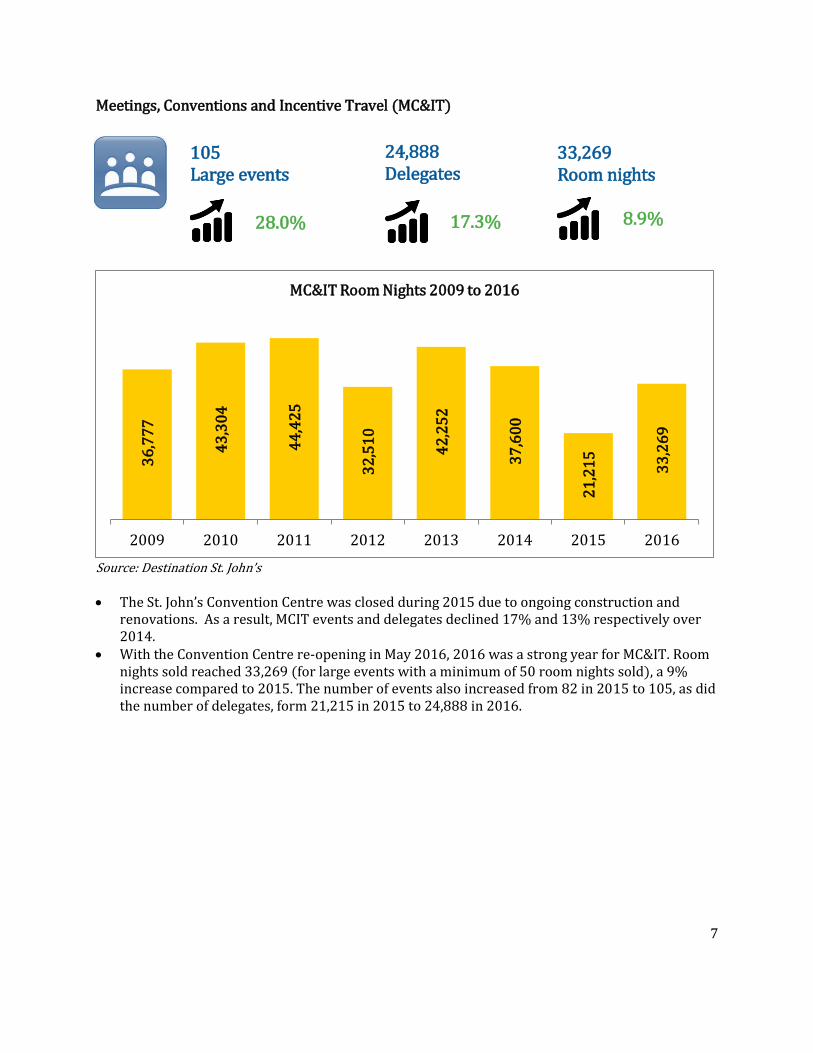
Meetings, Conventions and Incentive Travel (MC&IT)
Source: Destination St. John’s The St. John’s Convention Centre was closed during 2015 due to ongoing construction and
renovations. As a result, MCIT events and delegates declined 17% and 13% respectively over 2014.
With the Convention Centre re-opening in May 2016, 2016 was a strong year for MC&IT. Room nights sold reached 33,269 (for large events with a minimum of 50 room nights sold), a 9% increase compared to 2015. The number of events also increased from 82 in 2015 to 105, as did the number of delegates, form 21,215 in 2015 to 24,888 in 2016.
36
,77
7
43
,30
4
44
,42
5
32
,51
0
42
,25
2
37
,60
0
21
,21
5
33
,26
9
2009 2010 2011 2012 2013 2014 2015 2016
MC&IT Room Nights 2009 to 2016
105 Large events
24,888 Delegates
33,269 Room nights
17.3% 28.0% 8.9%
8
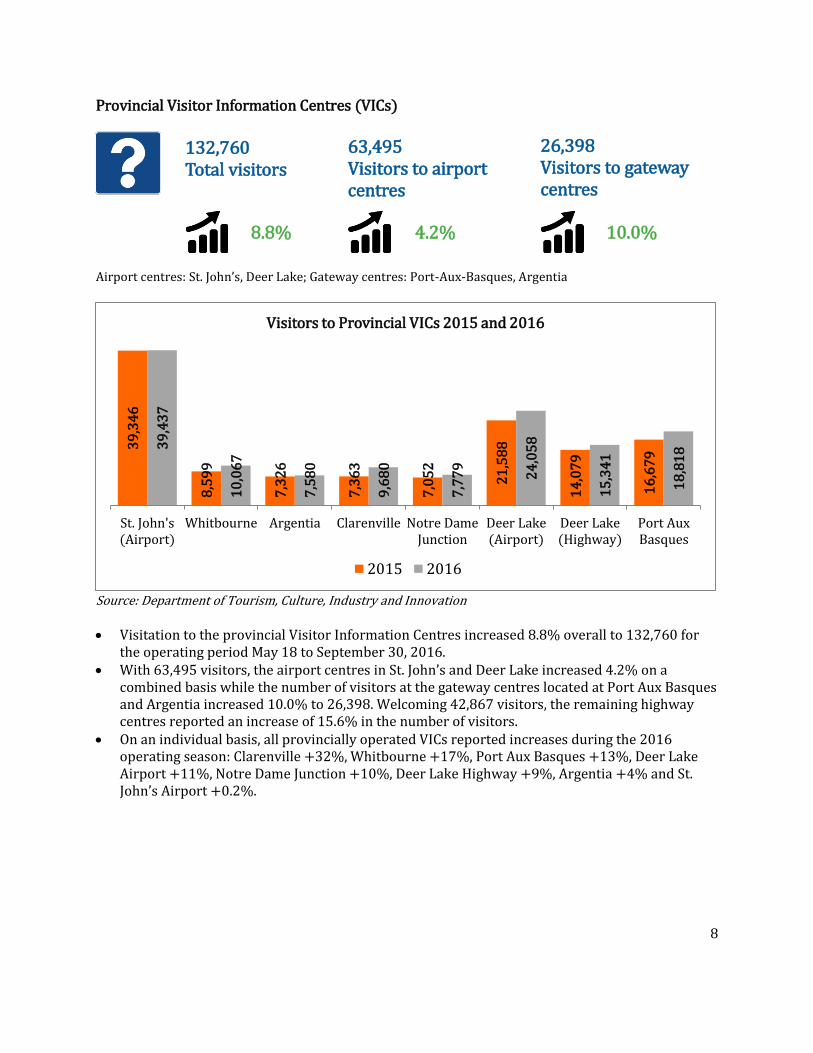
Provincial Visitor Information Centres (VICs) Airport centres: St. John’s, Deer Lake; Gateway centres: Port-Aux-Basques, Argentia
Source: Department of Tourism, Culture, Industry and Innovation Visitation to the provincial Visitor Information Centres increased 8.8% overall to 132,760 for
the operating period May 18 to September 30, 2016. With 63,495 visitors, the airport centres in St. John’s and Deer Lake increased 4.2% on a
combined basis while the number of visitors at the gateway centres located at Port Aux Basques and Argentia increased 10.0% to 26,398. Welcoming 42,867 visitors, the remaining highway centres reported an increase of 15.6% in the number of visitors.
On an individual basis, all provincially operated VICs reported increases during the 2016 operating season: Clarenville +32%, Whitbourne +17%, Port Aux Basques +13%, Deer Lake Airport +11%, Notre Dame Junction +10%, Deer Lake Highway +9%, Argentia +4% and St. John’s Airport +0.2%.
39
,34
6
8,5
99
7,3
26
7,3
63
7,0
52
21
,58
8
14
,07
9
16
,67
9 3
9,4
37
10
,06
7
7,5
80
9,6
80
7,7
79
24
,05
8
15
,34
1
18
,81
8
St. John's(Airport)
Whitbourne Argentia Clarenville Notre DameJunction
Deer Lake(Airport)
Deer Lake(Highway)
Port AuxBasques
Visitors to Provincial VICs 2015 and 2016
2015 2016
132,760 Total visitors
63,495 Visitors to airport centres
26,398 Visitors to gateway centres
10.0% 4.2% 8.8%

9
Provincial Historic Sites
Source: Department of Tourism, Culture, Industry and Innovation Visitation to Provincial Historic Sites reached 99,445 during the 2016 operating season, an
increase of 16.3% over the 2015 season. At over 28,000 visitors, the Cape Bonavista Lighthouse registered the highest number of
visitors (+15% over 2015) while the Boyd’s Cove Beothuk Interpretation Centre welcomed over 13,000 visitors (+7%).
All other sites also registered increased visitation in 2016: Heart’s Content Cable Station +49%, Hiscock House +26%, Lester Garland Premises +29%, Trinity Interpretation Centre +22%, Mockbeggar Property +16%, Point Amour Lighthouse +12%, Cupid’s Plantation +8%, Commissariat House +6% and Newman’s Wine Vault +4%.
The significant growth in visitation has been attributed to a number of factors including local and community partnerships, enhanced programming, better local/regional promotion, a longer operating season at some sites, the high number of icebergs in 2016 in the vicinity of some sites and more group/motor coach visits.
o The significant increase at Heart’s Content Cable Station is attributed to the celebration surrounding the 150th anniversary of the landing of the first successful transatlantic cable.
o Christmas events at Commissariat House held in late November and early December were very successful, attracting 1,519 visitors over the five day period, up from 1,434 visitors recorded during 2015. Attendance of the Christmas events at Commissariat House has been increasing year over year since 2008.
5,5
98
6,4
00
3,4
41
5,9
00
3,7
70
3,9
16
7,6
84
24
,42
2
6,2
19
12
,19
8
5,9
40
5,9
40
6,6
72
3,6
99
8,8
05
4,7
67
5,0
97
9,3
42
28
,18
1
7,2
21
13
,06
4
6,6
57
CommissariatHouse
Newman'sWine Vault
Cupid'sPlantation
Heart'sContent
Cable Station
Hiscock House Lester GarlandPremises
TrinityInterpretation
Centre
BonavistaLighthouse
MockbeggarProperty
Boyd's Cove Point AmourLighthouse
Visitors to Provincial Historic Sites 2015 and 2016
2015 2016
99,445 Total visitors
16.3%
10
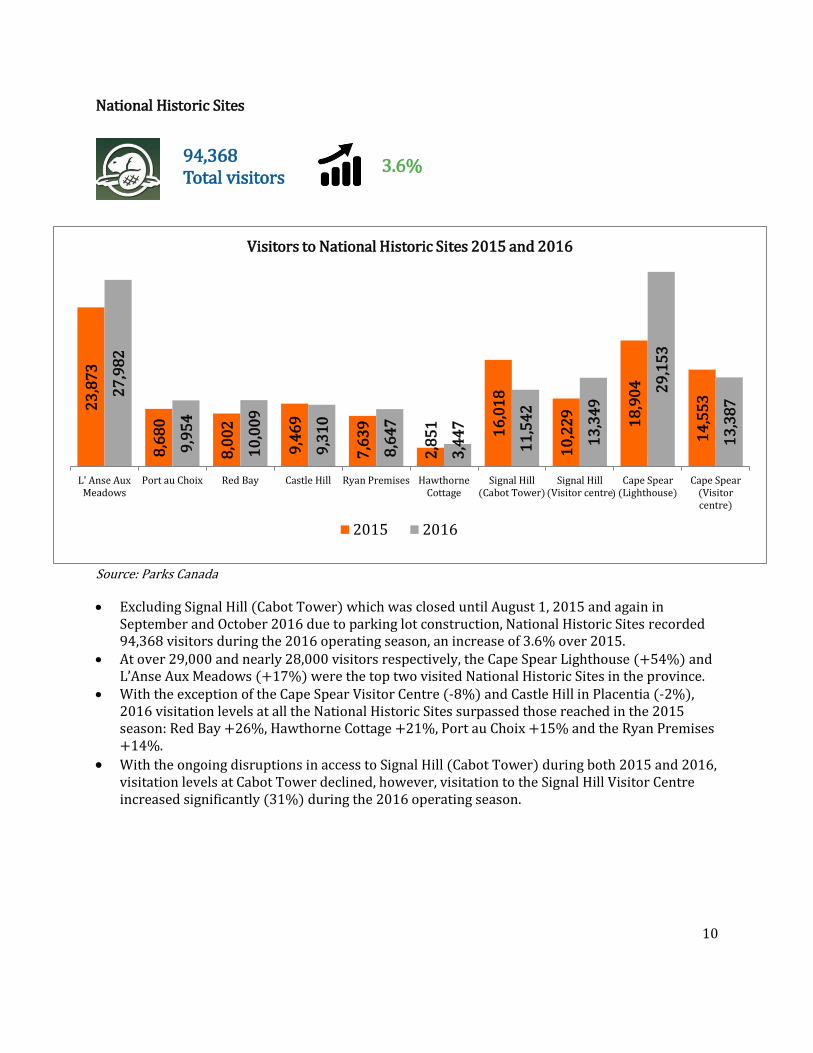
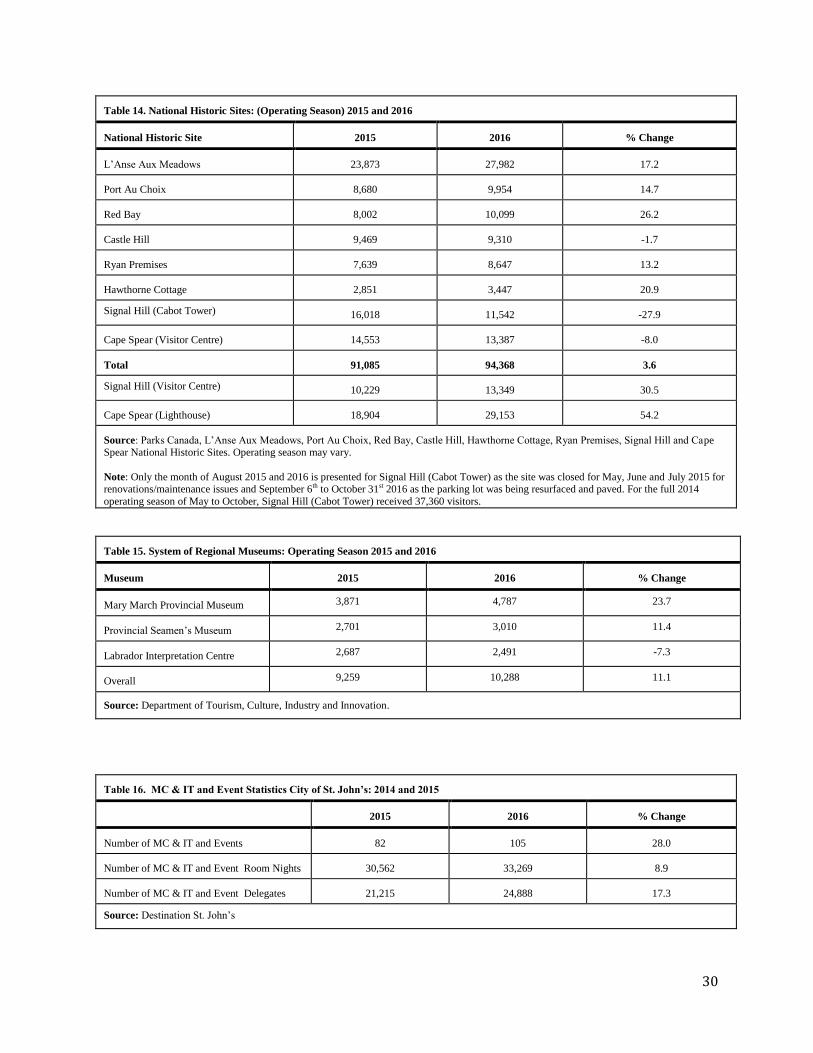
National Historic Sites
Source: Parks Canada
Excluding Signal Hill (Cabot Tower) which was closed until August 1, 2015 and again in September and October 2016 due to parking lot construction, National Historic Sites recorded 94,368 visitors during the 2016 operating season, an increase of 3.6% over 2015.
At over 29,000 and nearly 28,000 visitors respectively, the Cape Spear Lighthouse (+54%) and L’Anse Aux Meadows (+17%) were the top two visited National Historic Sites in the province.
With the exception of the Cape Spear Visitor Centre (-8%) and Castle Hill in Placentia (-2%), 2016 visitation levels at all the National Historic Sites surpassed those reached in the 2015 season: Red Bay +26%, Hawthorne Cottage +21%, Port au Choix +15% and the Ryan Premises +14%.
With the ongoing disruptions in access to Signal Hill (Cabot Tower) during both 2015 and 2016, visitation levels at Cabot Tower declined, however, visitation to the Signal Hill Visitor Centre increased significantly (31%) during the 2016 operating season.
23
,87
3
8,6
80
8,0
02
9,4
69
7,6
39
2,8
51
16
,01
8
10
,22
9
18
,90
4
14
,55
3 27
,98
2
9,9
54
10
,00
9
9,3
10
8,6
47
3,4
47
11
,54
2
13
,34
9 2
9,1
53
13
,38
7
L' Anse AuxMeadows
Port au Choix Red Bay Castle Hill Ryan Premises HawthorneCottage
Signal Hill(Cabot Tower)
Signal Hill(Visitor centre
Cape Spear(Lighthouse)
Cape Spear(Visitorcentre)
Visitors to National Historic Sites 2015 and 2016
2015 2016
94,368 Total visitors
3.6%
)
11
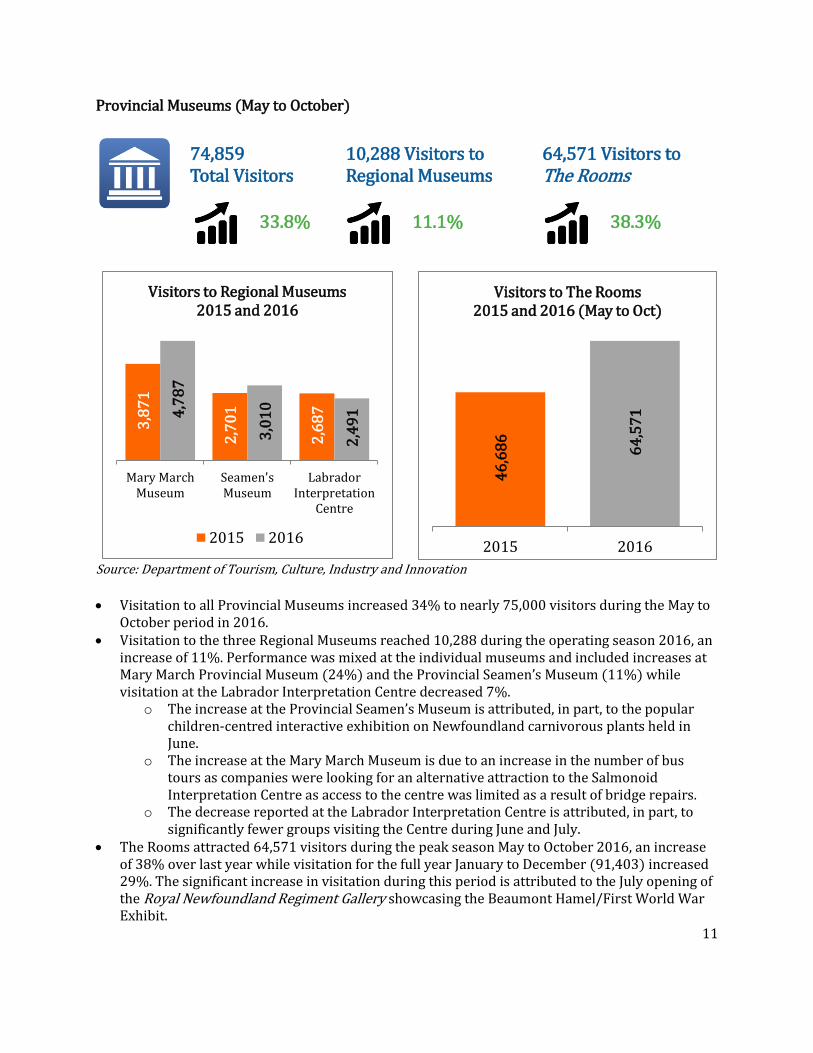
Provincial Museums (May to October)
Source: Department of Tourism, Culture, Industry and Innovation
Visitation to all Provincial Museums increased 34% to nearly 75,000 visitors during the May to
October period in 2016. Visitation to the three Regional Museums reached 10,288 during the operating season 2016, an
increase of 11%. Performance was mixed at the individual museums and included increases at Mary March Provincial Museum (24%) and the Provincial Seamen’s Museum (11%) while visitation at the Labrador Interpretation Centre decreased 7%.
o The increase at the Provincial Seamen’s Museum is attributed, in part, to the popular children-centred interactive exhibition on Newfoundland carnivorous plants held in June.
o The increase at the Mary March Museum is due to an increase in the number of bus tours as companies were looking for an alternative attraction to the Salmonoid Interpretation Centre as access to the centre was limited as a result of bridge repairs.
o The decrease reported at the Labrador Interpretation Centre is attributed, in part, to significantly fewer groups visiting the Centre during June and July.
The Rooms attracted 64,571 visitors during the peak season May to October 2016, an increase of 38% over last year while visitation for the full year January to December (91,403) increased 29%. The significant increase in visitation during this period is attributed to the July opening of the Royal Newfoundland Regiment Gallery showcasing the Beaumont Hamel/First World War Exhibit.
3,8
71
2,7
01
2,6
87
4,7
87
3,0
10
2,4
91
Mary MarchMuseum
Seamen'sMuseum
LabradorInterpretation
Centre
Visitors to Regional Museums 2015 and 2016
2015 2016
10,288 Visitors to Regional Museums
64,571 Visitors to The Rooms
11.1% 38.3%
46
,68
6
64
,57
1
2015 2016
Visitors to The Rooms 2015 and 2016 (May to Oct)
74,859 Total Visitors
33.8%
12
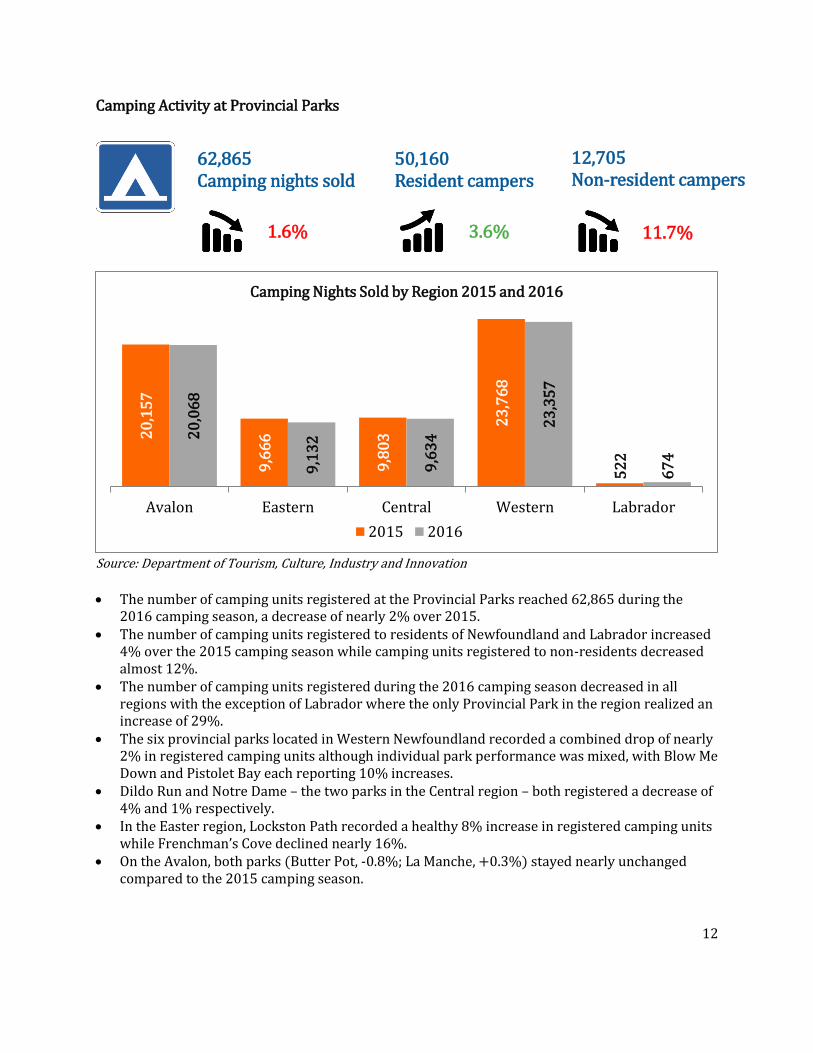
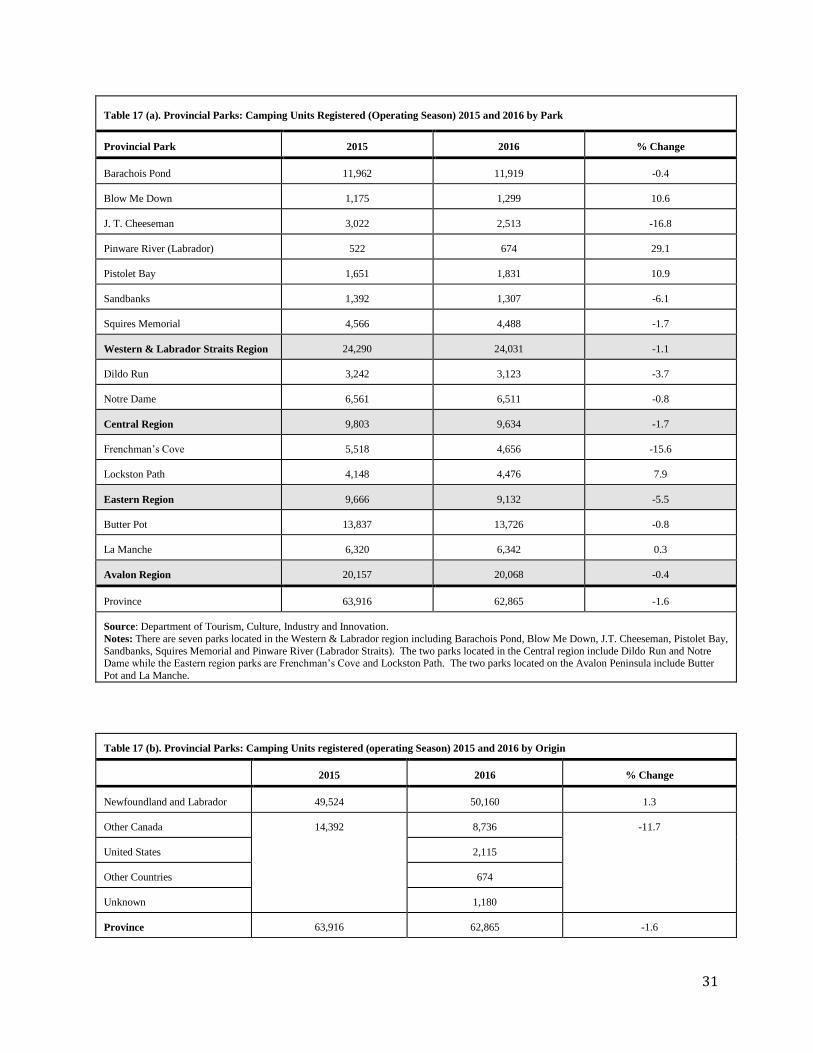
Camping Activity at Provincial Parks
Source: Department of Tourism, Culture, Industry and Innovation
The number of camping units registered at the Provincial Parks reached 62,865 during the
2016 camping season, a decrease of nearly 2% over 2015. The number of camping units registered to residents of Newfoundland and Labrador increased
4% over the 2015 camping season while camping units registered to non-residents decreased almost 12%.
The number of camping units registered during the 2016 camping season decreased in all regions with the exception of Labrador where the only Provincial Park in the region realized an increase of 29%.
The six provincial parks located in Western Newfoundland recorded a combined drop of nearly 2% in registered camping units although individual park performance was mixed, with Blow Me Down and Pistolet Bay each reporting 10% increases.
Dildo Run and Notre Dame – the two parks in the Central region – both registered a decrease of 4% and 1% respectively.
In the Easter region, Lockston Path recorded a healthy 8% increase in registered camping units while Frenchman’s Cove declined nearly 16%.
On the Avalon, both parks (Butter Pot, -0.8%; La Manche, +0.3%) stayed nearly unchanged compared to the 2015 camping season.
20
,15
7
9,6
66
9,8
03
23
,76
8
52
2
20
,06
8
9,1
32
9,6
34
23
,35
7
67
4
Avalon Eastern Central Western Labrador
Camping Nights Sold by Region 2015 and 2016
2015 2016
62,865 Camping nights sold
1.6%
50,160 Resident campers
12,705 Non-resident campers
11.7% 3.6%
13
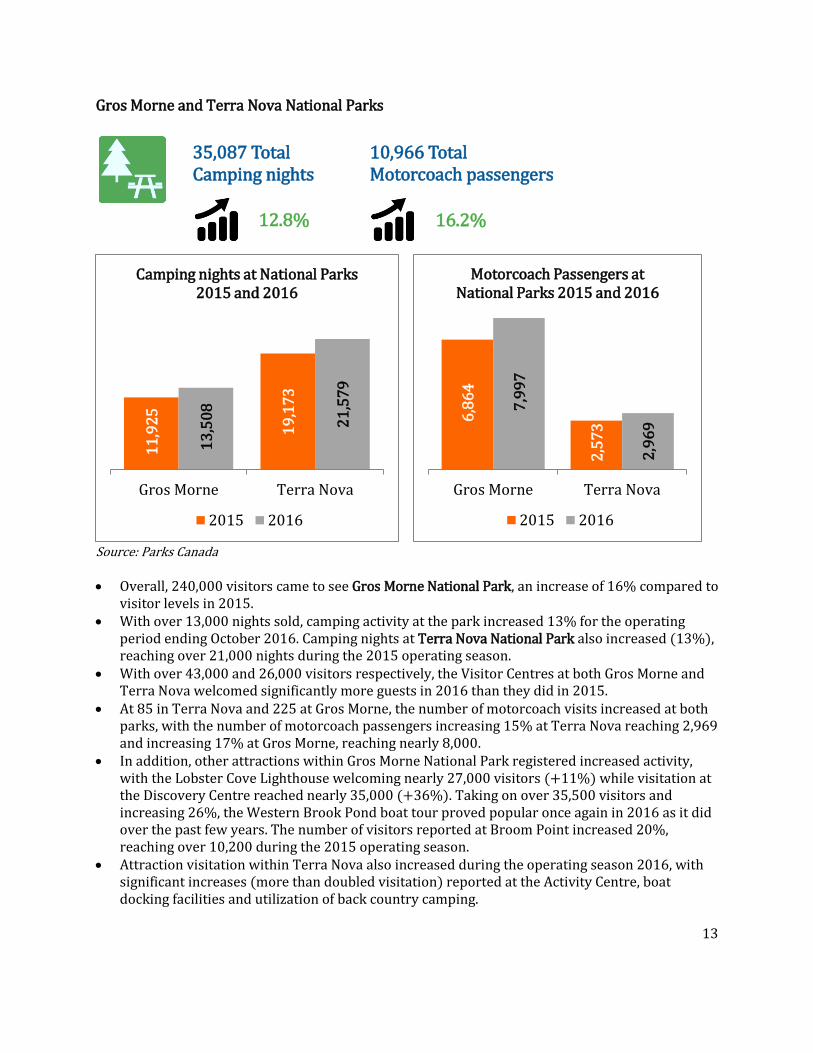
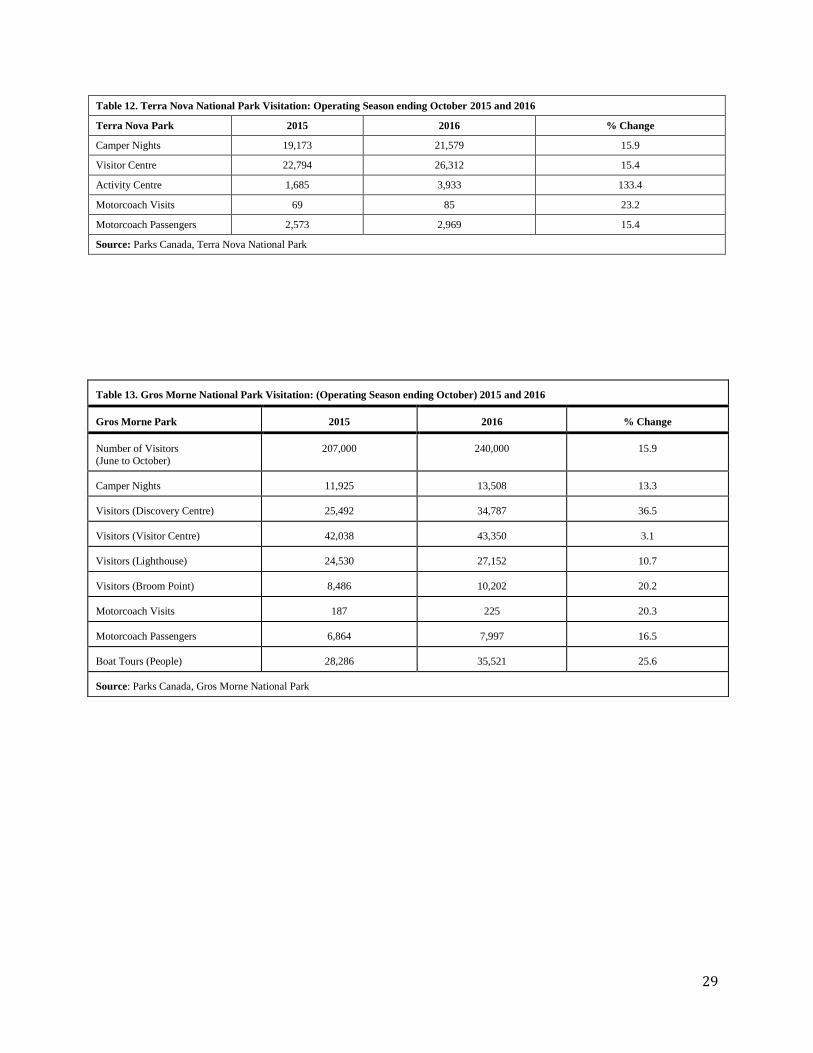
Gros Morne and Terra Nova National Parks
Source: Parks Canada Overall, 240,000 visitors came to see Gros Morne National Park, an increase of 16% compared to
visitor levels in 2015. With over 13,000 nights sold, camping activity at the park increased 13% for the operating
period ending October 2016. Camping nights at Terra Nova National Park also increased (13%), reaching over 21,000 nights during the 2015 operating season.
With over 43,000 and 26,000 visitors respectively, the Visitor Centres at both Gros Morne and Terra Nova welcomed significantly more guests in 2016 than they did in 2015.
At 85 in Terra Nova and 225 at Gros Morne, the number of motorcoach visits increased at both parks, with the number of motorcoach passengers increasing 15% at Terra Nova reaching 2,969 and increasing 17% at Gros Morne, reaching nearly 8,000.
In addition, other attractions within Gros Morne National Park registered increased activity, with the Lobster Cove Lighthouse welcoming nearly 27,000 visitors (+11%) while visitation at the Discovery Centre reached nearly 35,000 (+36%). Taking on over 35,500 visitors and increasing 26%, the Western Brook Pond boat tour proved popular once again in 2016 as it did over the past few years. The number of visitors reported at Broom Point increased 20%, reaching over 10,200 during the 2015 operating season.
Attraction visitation within Terra Nova also increased during the operating season 2016, with significant increases (more than doubled visitation) reported at the Activity Centre, boat docking facilities and utilization of back country camping.
11
,92
5
19
,17
3
13
,50
8
21
,57
9
Gros Morne Terra Nova
Camping nights at National Parks 2015 and 2016
2015 2016
35,087 Total Camping nights
10,966 Total Motorcoach passengers
16.2% 12.8%
6,8
64
2,5
73
7,9
97
2,9
69
Gros Morne Terra Nova
Motorcoach Passengers at National Parks 2015 and 2016
2015 2016
14
Other Indicators (as available) Attractions Increased visitation statistics to the vast majority of provincial attractions – located across all areas and regions of the province – during 2016, in combination with anecdotal evidence from individual tourism operators commenting about the busy season they experienced, show that tourism continues to be an economic driver in Newfoundland and Labrador, with visitors taking advantage of the many and varied experiences our destination has to offer. Thanks to all for sharing their data and insights. Railway Coastal Museum
The number of visitors at the Railway Coastal Museum (9,502) decreased 8% between May and October 2016. Officials noted that only a small in-house advertising budget was available and attributed the decline to changes to the programming approach and partnership arrangements with less than the usual exposure on social media.
Johnson Geo centre The number of visitors at the Johnson Geo Centre increased 6% to 37,832 between May and October 2016. Visitation for the full 12 months of the year indicates a decline of 1% to 50,327 visitors.
Quidi Vidi Plantation The Quidi Vidi Plantation received 20,433 visitors between June and September 2016, representing an increase of 15%. Visits have been steadily increasing for the period 2013 to 2016.
#2 Mine Tour The number of visitors reported at the #2 Mine Tour on Bell Island increased 7% to 12,731 between June and September 2016. Officials note that 2016 visitation levels were strong, building on the success of the 2015 Come Home Year celebrations when the site attracted a record number of visitors.
Manuals River Interpretation Centre The number of visitors at the Manuals River Interpretation Centre increased 3% to 3,551 between May and October 2016. Officials attributed the increase to enhanced programming at the centre including trivia nights, paint and pinot (wine) nights, coffee and canvas nights, dinner/lunch with a movie as well as an open house, a young scientist program and the popular bobber race fundraiser.
Cupid’s Legacy Centre At 8,313, the number of visitors at the Cupids Legacy Centre declined slightly (0.4%) during the 2016 season compared to 2015. Prior to the 2016 operating season, visits had been steadily increasing for the period 2011 to 2015.
Wooden Boat Museum The number of visitors at the Wooden Boat Museum reached 2,645 during the 2016 season, an increase of 20% compared to 2015 levels. Visits have been steadily increasing for the period

15
2013 to 2016. Officials are expecting a banner year in 2017 as the Museum celebrates its 20th anniversary.
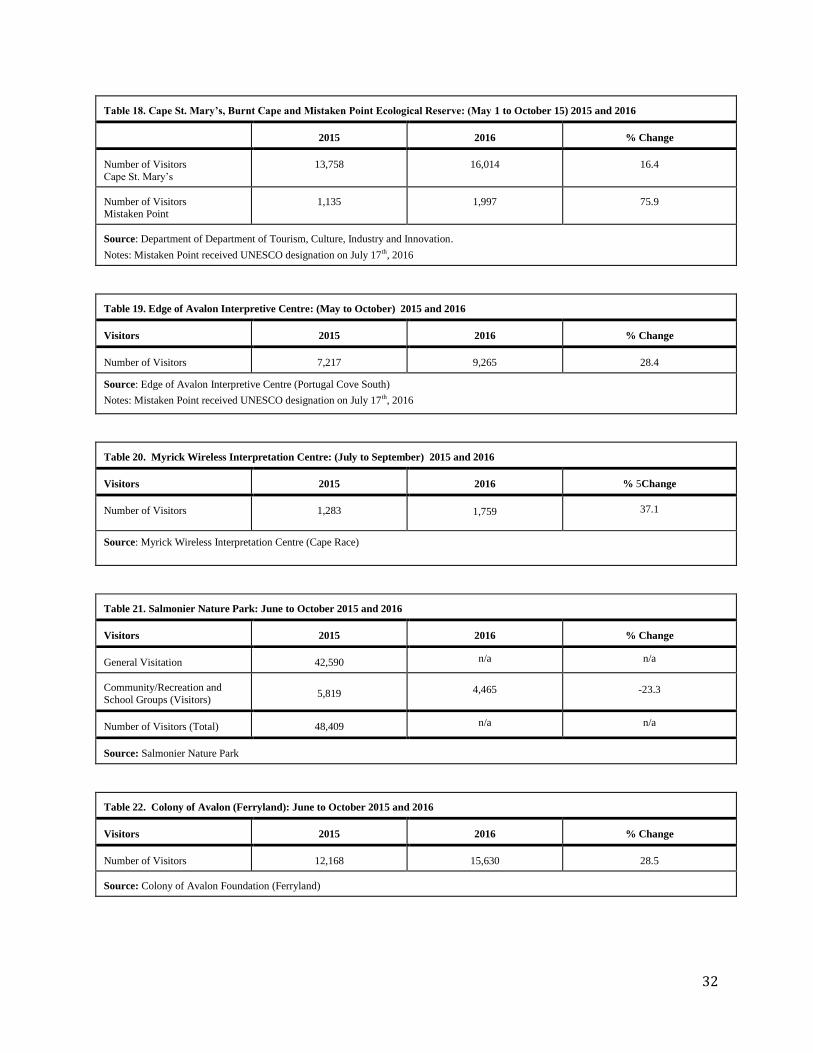
Salmonier Nature Park Group visitation at the Salmonier Nature Park decreased 23% between June and October 2016 to 4,465 visitors. Officials note that weather played a role in the decline in group visitors, particularly in the early part of the season. Transportation and budget issues were also noted as the reason for cancelling regular group visits by the MUN Biology Department.
Colony of Avalon Compared to 2015, the number of visitors reported at the Colony of Avalon (Ferryland) increased 28% to 15,518 for the June to October 2016 period, returning the site to more normal visitation levels after an extremely poor season in 2015 which was affected by poor weather and flight cancellations at St. John’s International Airport due to runway construction.
Mistaken Point Ecological Reserve The number of visitors at the Mistaken Point Ecological Reserve almost doubled to 2,003 from 1,135 visitors in the previous season. Officials have attributed the increase, in part, to the UNESCO designation of Mistake Point Ecological Reserve on July 17, 2016.
Myrick Wireless interpretation Centre Visitation to the Myrick Wireless Interpretation Centre (Cape Race) increased 37% to 1,759 between July and September 2016 while the Edge of Avalon Interpretive Centre welcomed 9,265 visitors (+12%) for the period May to October 2016. Officials attributed the increase, in part, to the UNESCO designation of Mistake Point Ecological Reserve in July 2016.
Matthew Legacy Site Compared to 2015, the number of visitors reported at the Matthew Legacy Site increased 12% to 8,770 between June and September 2016, continuing the growing trend of the past four seasons. Officials note more local and regional advertising for attractions and sites on the Bonavista Peninsula has had a positive impact on visitation.
Sealer’s Interpretation Centre The number of (paid) visitors at the Sealer’s Interpretation Centre (Home from the Sea) reached 5,404 during the 2016 operating season, an increase of 2% compared to 2015. The number of paying visitors to view the exhibits has been steadily growing since 2014. In 2016 (first year of tracking), there were an additional 1,607 unpaid entries into the building to visit the gift boutique, receive directions, use the washrooms and other services available at the centre.
Durrell Museum The number of visitors at the Durrell Museum reached 4,260 during the 2016 season, an increase of 17% compared to 2015. This increase is due, in part, to a longer season compared to 2015 and halts the declines experienced for the period 2013 to 2015.
16
North Atlantic Aviation Museum The number of visitors at the North Atlantic Aviation Museum increased 26% to 9,828 between May and October 2016, continuing the growing trend of the past three seasons. The growth in the number of visitors during 2016 is attributed to increased awareness and advertising through publications such as Motorcoach Canada, Harvest Hosts-RV and Downhome Explore as well as through familiarization tours.
Salmonoid Interpretation Centre The number of visitors at the Salmonoid Interpretation Centre decreased 19% to 17,147 for the June to September 2016 period. Officials attributed the decline to ongoing bridge repairs which caused limited / no access to the site by larger vehicles, particularly bus tours and large RVs.
Newfoundland Insectarium The number of visitors at the Newfoundland Insectarium reached 25,002 during the 2016 season, an increase of 0.3% compared to 2015 levels. Visits have been steadily increasing for the period 2014 to 2016.
Burgeo Museum The number of visitors at the Burgeo Museum decreased 50% to 356 during 2016. Seasonal visits were traditionally in the order of 600-700, however, officials note the poor condition of Route 480 and the negative publicity on social media affected visitation.
Rose Blanche Lighthouse The number of visitors at the Rose Blanche Lighthouse reached 5,090 during the 2016 season, an increase of 5% compared to 2015 levels. Visits have been steadily increasing for the period 2014 to 2016.
Norstead Viking Village The Norstead Viking Village reported 10,805 visitors during the 2016 season, an increase of 24% compared to 2015. Visits have been steadily increasing for the period 2013 to 2016.
Battle Harbour Historic Properties The number of visitors (overnight and same day) to the Battle Harbour Historic Properties reached 675 during the 2016 season, an increase of 3% compared to 2015 levels. Visits have been steadily increasing for the period 2014 to 2016.
Ferry Services Labrador Straits Ferry
Traffic on the Labrador Straits ferry increased during May to October 2016, with the number of passengers and passenger related vehicles (both directions) increasing 6% and 5% respectively over 2015 levels.
17
Commercial/private campgrounds Preliminary occupancy rates reported by commercial/private campgrounds reached 59% for
the May to October 2016 period, a decrease of 0.4 percentage points over 2015 levels. Traveller Engagements Advanced technologies continue to impact visitors’ travel planning, communication and decision making behaviours. The department continues to maintain its lead role in the province by utilizing these new means in attracting, converting and informing current and potential visitors to Newfoundland and Labrador. Newfoundland and Labrador Tourism online sites include www.newfoundlandlabrador.com ,
www.icebergfinder.com , the new itinerary planner and various campaign pages. Between January and December 2016, all of these sites combined recorded 3.1 million sessions, an increase of 17% compared to 2015.
o Sessions to the end of December on www.newfoundlandlabrador.com reached 2.3 million, an increase of 9.6% over 2015 levels
o Sessions to the end of December on www.icebergfinder.com increased 6.7% to 204,969.
In January 2016 the province unveiled the new Itinerary Planner which provides travellers with a customizable approach to building a personalized itinerary of activities, attractions and destinations. These itineraries are sharable on social media sites and can be linked to tourism businesses creating greater exposure and potentially more bookings/sales. During its first year, the itinerary planner had 90,185 visits and directed 19,332 referrals to tourism operators.
Newfoundland and Labrador Tourism’s goal is to provide leads to tourism operators by driving users from www.newfoundlandlabrador.com and campaign pages to individual tourism operators’ website/email addresses.
o To the end of 2016, overall business listings on www.newfoundlandLabrador.com were viewed approximately 1.1 million times, an increase of 13% over 2015, while direct referrals to tourism operators during the same period increased 24% to 560,826.
Newfoundland and Labrador’s social media postings were well received during 2016, with statistics indicating that exposure of the province’s tourism product through social media continues to reach a wider audience.
o Facebook continues to be the primary channel of social communications for the province. Total engagements through Facebook (likes, shares, plays and comments) increased 35% to over 2.7 million engagements overall. Facebook “Likes” specifically increased 34% compared to last year, reaching 143,363 by year’s end.
o Twitter followers increased 21%, reaching 46,665 while YouTube subscribers (7,982) and total video views (2.3 million) increased 14% and 15% respectively compared to 2015.
o Instagram, added to the social media tool box in January 2015, is quickly becoming one of the primary channels of growth for engagements with the brand, with subscribers increasing to 39,937 as of December 2016, up a significant 150% over 2015.
18
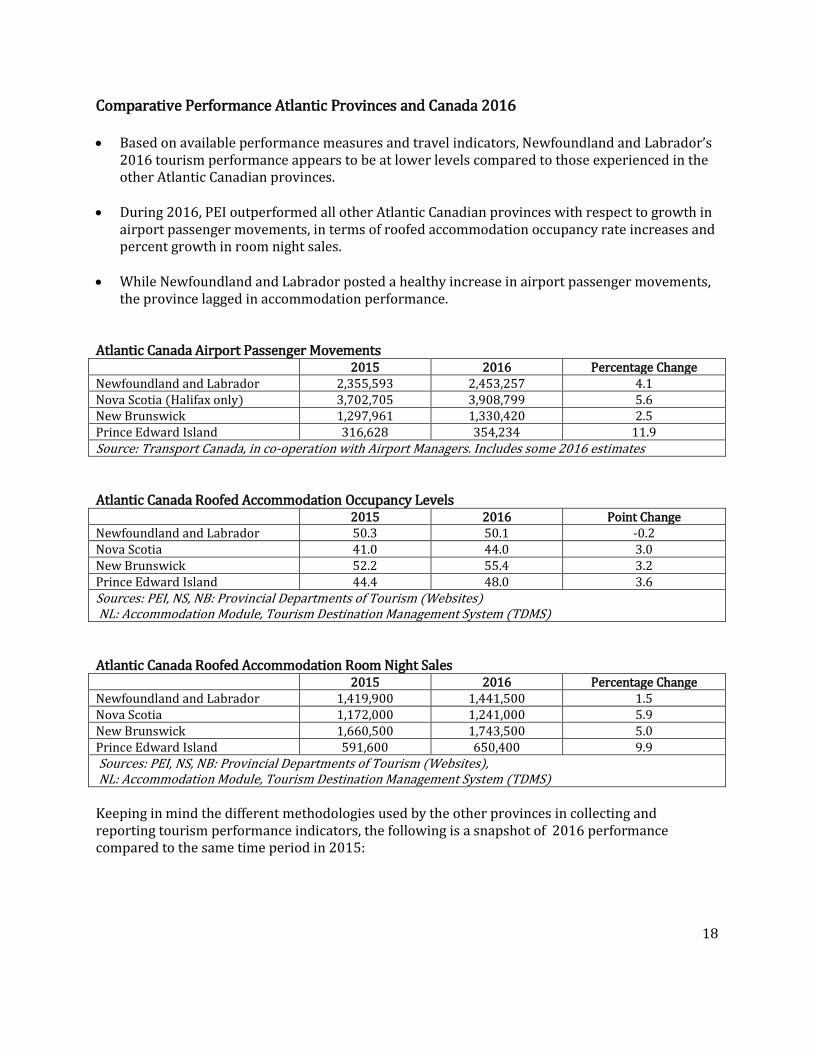
Comparative Performance Atlantic Provinces and Canada 2016 Based on available performance measures and travel indicators, Newfoundland and Labrador’s
2016 tourism performance appears to be at lower levels compared to those experienced in the other Atlantic Canadian provinces.
During 2016, PEI outperformed all other Atlantic Canadian provinces with respect to growth in airport passenger movements, in terms of roofed accommodation occupancy rate increases and percent growth in room night sales.
While Newfoundland and Labrador posted a healthy increase in airport passenger movements, the province lagged in accommodation performance.
Atlantic Canada Airport Passenger Movements 2015 2016 Percentage Change Newfoundland and Labrador 2,355,593 2,453,257 4.1 Nova Scotia (Halifax only) 3,702,705 3,908,799 5.6 New Brunswick 1,297,961 1,330,420 2.5 Prince Edward Island 316,628 354,234 11.9 Source: Transport Canada, in co-operation with Airport Managers. Includes some 2016 estimates
Atlantic Canada Roofed Accommodation Occupancy Levels 2015 2016 Point Change Newfoundland and Labrador 50.3 50.1 -0.2 Nova Scotia 41.0 44.0 3.0 New Brunswick 52.2 55.4 3.2 Prince Edward Island 44.4 48.0 3.6 Sources: PEI, NS, NB: Provincial Departments of Tourism (Websites) NL: Accommodation Module, Tourism Destination Management System (TDMS)
Atlantic Canada Roofed Accommodation Room Night Sales 2015 2016 Percentage Change Newfoundland and Labrador 1,419,900 1,441,500 1.5 Nova Scotia 1,172,000 1,241,000 5.9 New Brunswick 1,660,500 1,743,500 5.0 Prince Edward Island 591,600 650,400 9.9 Sources: PEI, NS, NB: Provincial Departments of Tourism (Websites), NL: Accommodation Module, Tourism Destination Management System (TDMS)
Keeping in mind the different methodologies used by the other provinces in collecting and reporting tourism performance indicators, the following is a snapshot of 2016 performance compared to the same time period in 2015:
19
Nova Scotia Non-resident visits in 2016 increased 8% over 2015, with automobile travel increasing 7% and
air visitation increasing 11%.
The number of boarding and deplaning passengers increased nearly 6% in 2016 compared to 2015 levels.
Roofed accommodation occupancy rates were up 3 percentage points during 2016, with room night sales increasing 6%.
Prince Edward Island Private vehicle traffic exiting PEI on the Confederation Bridge was up 10% in 2016 while the
number of vehicles exiting PEI via ferry (Wood Island) was down 14% compared to last year.
The number of boarding and deplaning passengers in 2016 increased nearly 12% compared to 2015 levels.
The roofed accommodation occupancy rate increased almost 4 percentage points during 2016, with room night sales growing approximately 10%.
New Brunswick The number of boarding and deplaning passengers in 2016 increased 2.5% compared to 2015.
The roofed accommodation occupancy rate is up 3 percentage points, with room night sales
increasing over 5% for the period ending December 2016.
The number of US residents crossing the border into the province by automobile increased 7% between January and November 2016.
Canada Overnight foreign visitation to Canada grew nearly 11% in 2016. Visits from the US increased
nearly 10%, with automobile visitation increasing 7% and air visitation up 17%. Visits from the US by other modes of travel increased 4%.
Visits from the 10 other core markets increased 16%. This increase was led by significant growth in arrivals from emerging markets such as South Korea, China, India and Mexico (more than 10% each) while growth from mature markets (Australia, UK, France and Germany) ranged from 9% to 17% compared to 2015 levels.
Impacted by a weak Canadian dollar, overnight trips by Canadians to the US decreased 7% during 2016. However, overnight trips by Canadians to other destinations continued to rise, with the total number of trips taken between January and December growing 4%.
20
Detailed 2016 Travel/Tourism Indicators
Newfoundland and Labrador
Sector Research Division (Tourism)
Department of Tourism, Culture, Industry and Innovation
April 2017
21
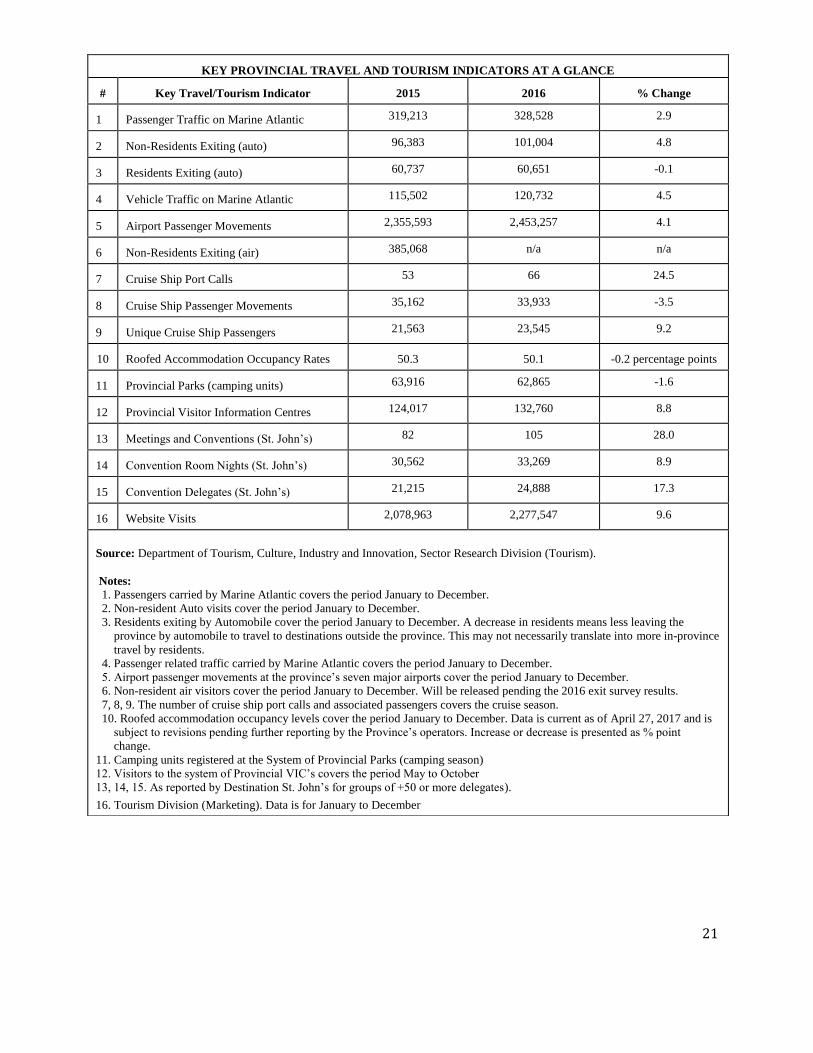
KEY PROVINCIAL TRAVEL AND TOURISM INDICATORS AT A GLANCE
#
Key Travel/Tourism Indicator
2015
2016
% Change
1
Passenger Traffic on Marine Atlantic 319,213 328,528 2.9
2
Non-Residents Exiting (auto) 96,383 101,004 4.8
3
Residents Exiting (auto) 60,737 60,651 -0.1
4
Vehicle Traffic on Marine Atlantic 115,502 120,732 4.5
5
Airport Passenger Movements 2,355,593 2,453,257 4.1
6
Non-Residents Exiting (air) 385,068 n/a n/a
7
Cruise Ship Port Calls 53 66 24.5
8
Cruise Ship Passenger Movements 35,162 33,933 -3.5
9
Unique Cruise Ship Passengers 21,563 23,545 9.2
10
Roofed Accommodation Occupancy Rates
50.3
50.1
-0.2 percentage points
11
Provincial Parks (camping units) 63,916 62,865 -1.6
12
Provincial Visitor Information Centres 124,017 132,760 8.8
13
Meetings and Conventions (St. John’s) 82 105 28.0
14
Convention Room Nights (St. John’s) 30,562 33,269 8.9
15
Convention Delegates (St. John’s) 21,215 24,888 17.3
16
Website Visits 2,078,963 2,277,547 9.6
Source: Department of Tourism, Culture, Industry and Innovation, Sector Research Division (Tourism).
Notes: 1. Passengers carried by Marine Atlantic covers the period January to December.
2. Non-resident Auto visits cover the period January to December.
3. Residents exiting by Automobile cover the period January to December. A decrease in residents means less leaving the
province by automobile to travel to destinations outside the province. This may not necessarily translate into more in-province
travel by residents.
4. Passenger related traffic carried by Marine Atlantic covers the period January to December.
5. Airport passenger movements at the province’s seven major airports cover the period January to December.
6. Non-resident air visitors cover the period January to December. Will be released pending the 2016 exit survey results.
7, 8, 9. The number of cruise ship port calls and associated passengers covers the cruise season.
10. Roofed accommodation occupancy levels cover the period January to December. Data is current as of April 27, 2017 and is
subject to revisions pending further reporting by the Province’s operators. Increase or decrease is presented as % point
change.
11. Camping units registered at the System of Provincial Parks (camping season)
12. Visitors to the system of Provincial VIC’s covers the period May to October
13, 14, 15. As reported by Destination St. John’s for groups of +50 or more delegates).
16. Tourism Division (Marketing). Data is for January to December
22
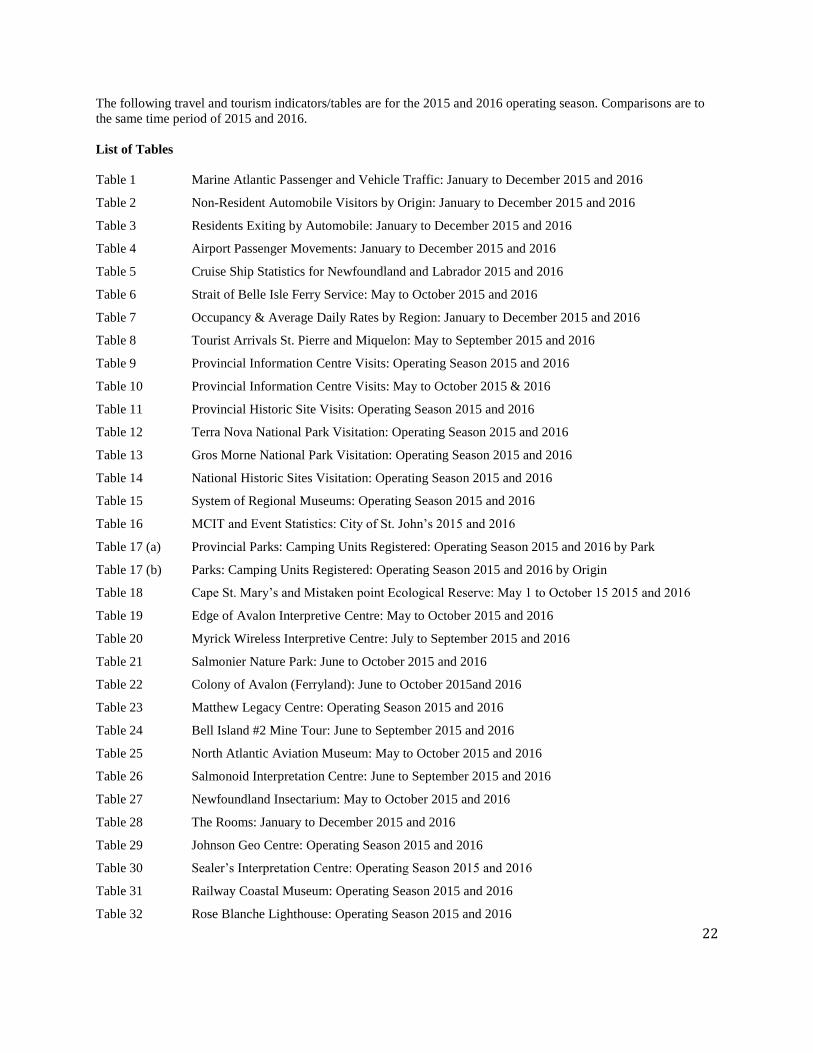
The following travel and tourism indicators/tables are for the 2015 and 2016 operating season. Comparisons are to
the same time period of 2015 and 2016.
List of Tables
Table 1 Marine Atlantic Passenger and Vehicle Traffic: January to December 2015 and 2016
Table 2 Non-Resident Automobile Visitors by Origin: January to December 2015 and 2016
Table 3 Residents Exiting by Automobile: January to December 2015 and 2016
Table 4 Airport Passenger Movements: January to December 2015 and 2016
Table 5 Cruise Ship Statistics for Newfoundland and Labrador 2015 and 2016
Table 6 Strait of Belle Isle Ferry Service: May to October 2015 and 2016
Table 7 Occupancy & Average Daily Rates by Region: January to December 2015 and 2016
Table 8 Tourist Arrivals St. Pierre and Miquelon: May to September 2015 and 2016
Table 9 Provincial Information Centre Visits: Operating Season 2015 and 2016
Table 10 Provincial Information Centre Visits: May to October 2015 & 2016
Table 11 Provincial Historic Site Visits: Operating Season 2015 and 2016
Table 12 Terra Nova National Park Visitation: Operating Season 2015 and 2016
Table 13 Gros Morne National Park Visitation: Operating Season 2015 and 2016
Table 14 National Historic Sites Visitation: Operating Season 2015 and 2016
Table 15 System of Regional Museums: Operating Season 2015 and 2016
Table 16 MCIT and Event Statistics: City of St. John’s 2015 and 2016
Table 17 (a) Provincial Parks: Camping Units Registered: Operating Season 2015 and 2016 by Park
Table 17 (b) Parks: Camping Units Registered: Operating Season 2015 and 2016 by Origin
Table 18 Cape St. Mary’s and Mistaken point Ecological Reserve: May 1 to October 15 2015 and 2016
Table 19 Edge of Avalon Interpretive Centre: May to October 2015 and 2016
Table 20 Myrick Wireless Interpretive Centre: July to September 2015 and 2016
Table 21 Salmonier Nature Park: June to October 2015 and 2016
Table 22 Colony of Avalon (Ferryland): June to October 2015and 2016
Table 23 Matthew Legacy Centre: Operating Season 2015 and 2016
Table 24 Bell Island #2 Mine Tour: June to September 2015 and 2016
Table 25 North Atlantic Aviation Museum: May to October 2015 and 2016
Table 26 Salmonoid Interpretation Centre: June to September 2015 and 2016
Table 27 Newfoundland Insectarium: May to October 2015 and 2016
Table 28 The Rooms: January to December 2015 and 2016
Table 29 Johnson Geo Centre: Operating Season 2015 and 2016
Table 30 Sealer’s Interpretation Centre: Operating Season 2015 and 2016
Table 31 Railway Coastal Museum: Operating Season 2015 and 2016
Table 32 Rose Blanche Lighthouse: Operating Season 2015 and 2016
23
Table 33 Durrell Museum: Operating Season 2015 and 2016
Table 34 Wooden Boat Museum: Operating Season 2015 and 2016
Table 35 Burgeo Museum: Operating Season 2015 and 2016
Table 36 Battle Harbour Historic Properties: Operating Season 2015 and 2016
Table 37 Cupid’s Legacy Centre: Operating Season 2015 and 2016
Table 38 Norstead Viking Village: Operating Season 2015 and 2016
Table 39 Skier Visits: Operating Season Marble Mountain 2014/2015 and 2015/2016
24
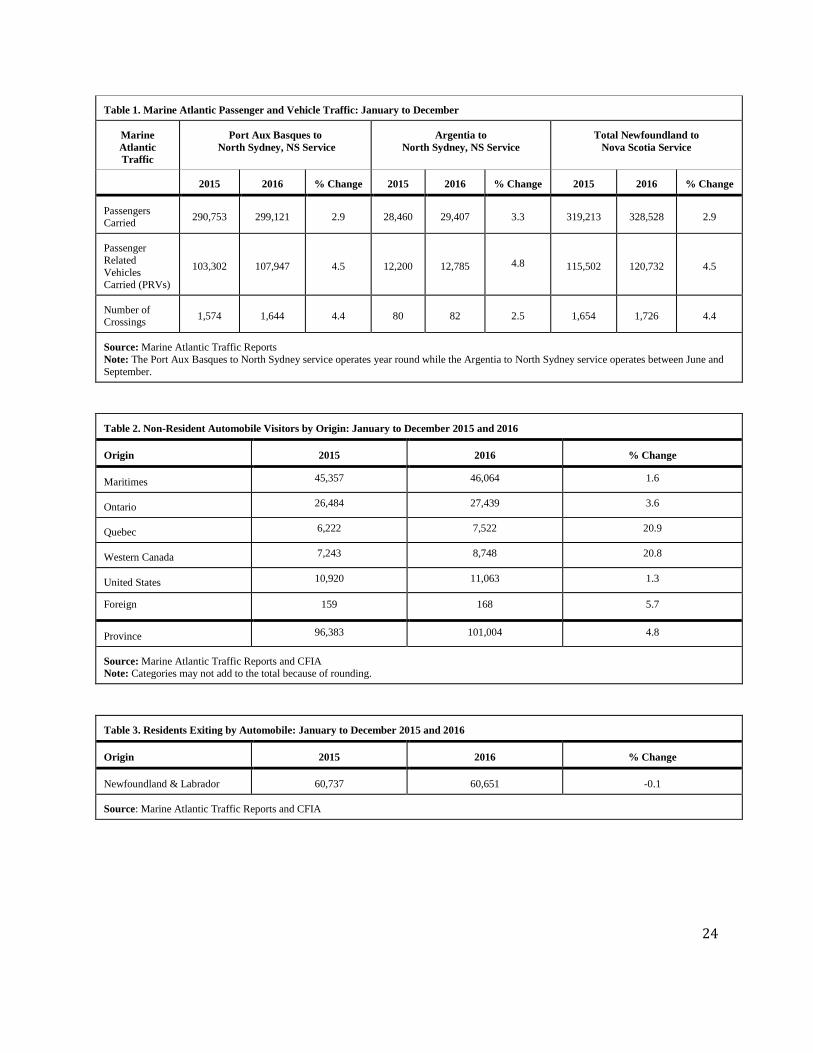
Table 1. Marine Atlantic Passenger and Vehicle Traffic: January to December
Marine
Atlantic
Traffic
Port Aux Basques to
North Sydney, NS Service
Argentia to
North Sydney, NS Service
Total Newfoundland to
Nova Scotia Service
2015
2016
% Change
2015
2016
% Change
2015
2016
% Change
Passengers Carried
290,753
299,121
2.9
28,460
29,407
3.3
319,213
328,528
2.9
Passenger
Related
Vehicles Carried (PRVs)
103,302
107,947
4.5
12,200
12,785 4.8
115,502
120,732
4.5
Number of Crossings
1,574
1,644
4.4
80
82
2.5
1,654
1,726
4.4
Source: Marine Atlantic Traffic Reports
Note: The Port Aux Basques to North Sydney service operates year round while the Argentia to North Sydney service operates between June and
September.
Table 2. Non-Resident Automobile Visitors by Origin: January to December 2015 and 2016
Origin
2015
2016
% Change
Maritimes 45,357 46,064 1.6
Ontario 26,484 27,439 3.6
Quebec 6,222 7,522 20.9
Western Canada 7,243 8,748 20.8
United States 10,920 11,063 1.3
Foreign 159 168 5.7
Province 96,383 101,004 4.8
Source: Marine Atlantic Traffic Reports and CFIA Note: Categories may not add to the total because of rounding.
Table 3. Residents Exiting by Automobile: January to December 2015 and 2016
Origin
2015
2016
% Change
Newfoundland & Labrador
60,737
60,651
-0.1
Source: Marine Atlantic Traffic Reports and CFIA
25
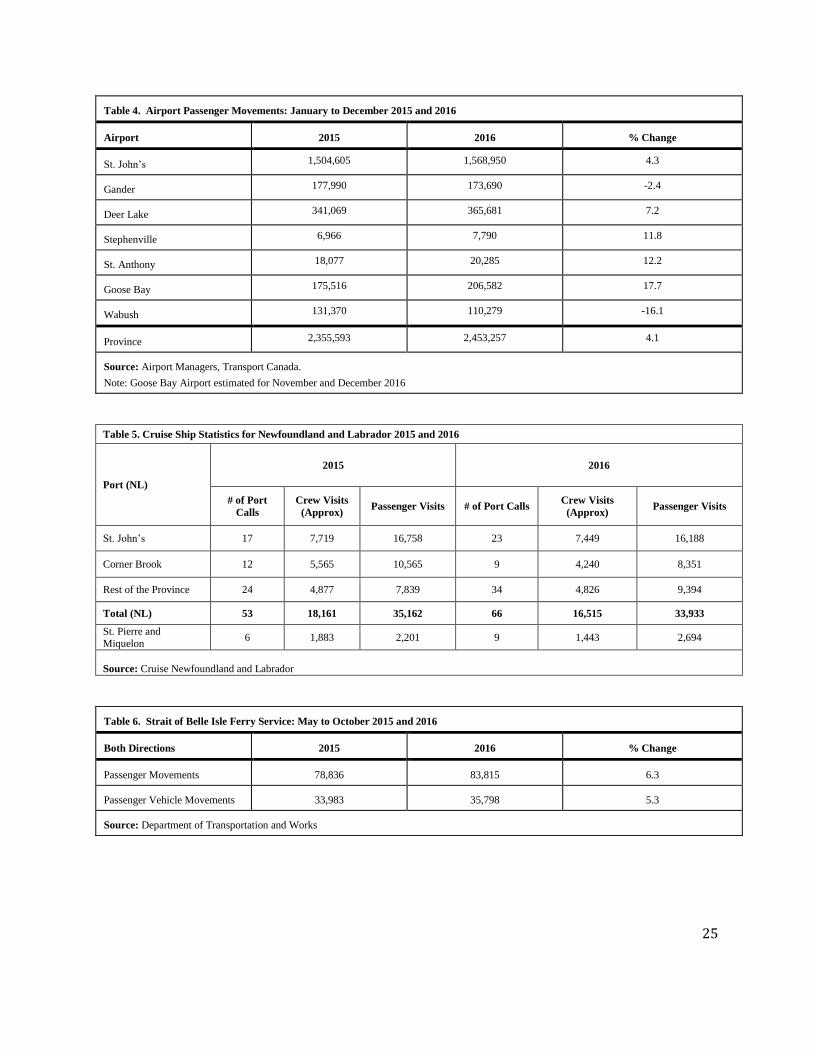
Table 4. Airport Passenger Movements: January to December 2015 and 2016
Airport
2015
2016
% Change
St. John’s 1,504,605 1,568,950 4.3
Gander 177,990 173,690 -2.4
Deer Lake 341,069 365,681 7.2
Stephenville 6,966 7,790 11.8
St. Anthony 18,077 20,285 12.2
Goose Bay 175,516 206,582 17.7
Wabush 131,370 110,279 -16.1
Province 2,355,593 2,453,257 4.1
Source: Airport Managers, Transport Canada.
Note: Goose Bay Airport estimated for November and December 2016
Table 5. Cruise Ship Statistics for Newfoundland and Labrador 2015 and 2016
Port (NL)
2015 2016
# of Port
Calls
Crew Visits
(Approx) Passenger Visits # of Port Calls
Crew Visits
(Approx) Passenger Visits
St. John’s 17 7,719 16,758 23 7,449 16,188
Corner Brook 12 5,565 10,565 9 4,240 8,351
Rest of the Province 24 4,877 7,839 34 4,826 9,394
Total (NL) 53 18,161 35,162 66 16,515 33,933
St. Pierre and Miquelon
6 1,883 2,201 9 1,443 2,694
Source: Cruise Newfoundland and Labrador
Table 6. Strait of Belle Isle Ferry Service: May to October 2015 and 2016
Both Directions
2015
2016
% Change
Passenger Movements
78,836
83,815
6.3
Passenger Vehicle Movements
33,983
35,798
5.3
Source: Department of Transportation and Works
26
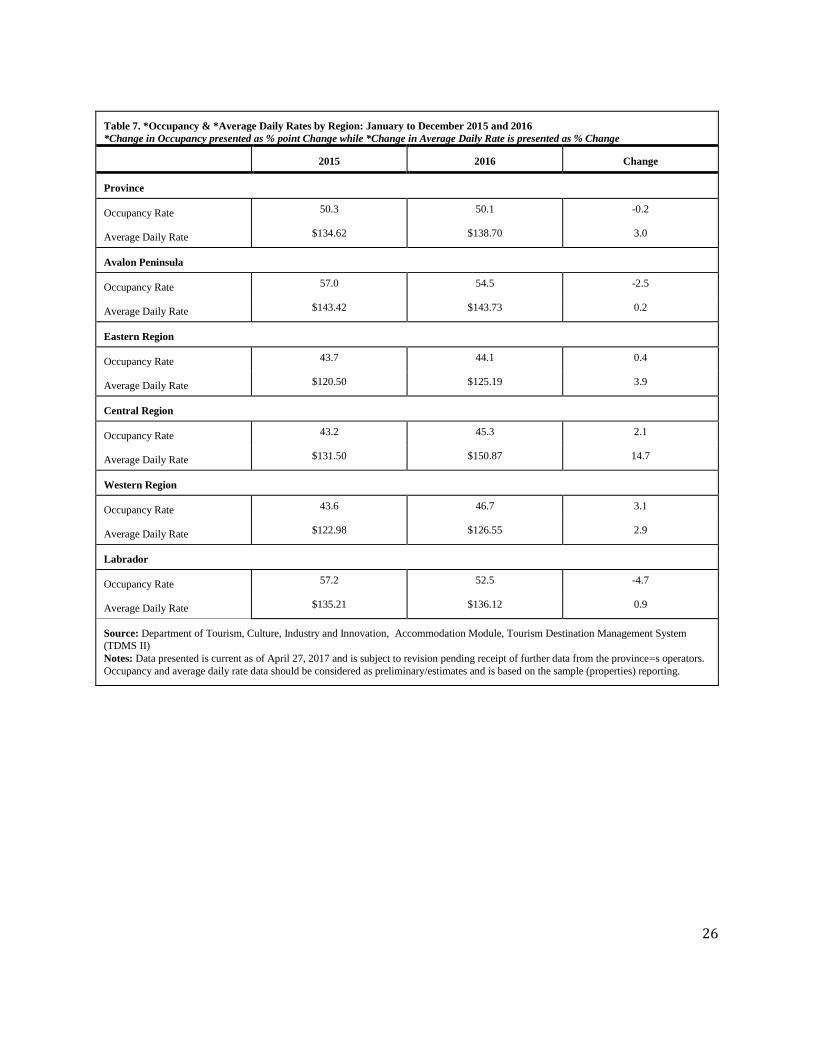
Table 7. *Occupancy & *Average Daily Rates by Region: January to December 2015 and 2016
*Change in Occupancy presented as % point Change while *Change in Average Daily Rate is presented as % Change
2015
2016
Change
Province
Occupancy Rate 50.3 50.1 -0.2
Average Daily Rate $134.62 $138.70 3.0
Avalon Peninsula
Occupancy Rate 57.0 54.5 -2.5
Average Daily Rate $143.42 $143.73 0.2
Eastern Region
Occupancy Rate 43.7 44.1 0.4
Average Daily Rate $120.50 $125.19 3.9
Central Region
Occupancy Rate 43.2 45.3 2.1
Average Daily Rate $131.50 $150.87 14.7
Western Region
Occupancy Rate 43.6 46.7 3.1
Average Daily Rate $122.98 $126.55 2.9
Labrador
Occupancy Rate 57.2 52.5 -4.7
Average Daily Rate $135.21 $136.12 0.9
Source: Department of Tourism, Culture, Industry and Innovation, Accommodation Module, Tourism Destination Management System
(TDMS II)
Notes: Data presented is current as of April 27, 2017 and is subject to revision pending receipt of further data from the province=s operators.
Occupancy and average daily rate data should be considered as preliminary/estimates and is based on the sample (properties) reporting.
27
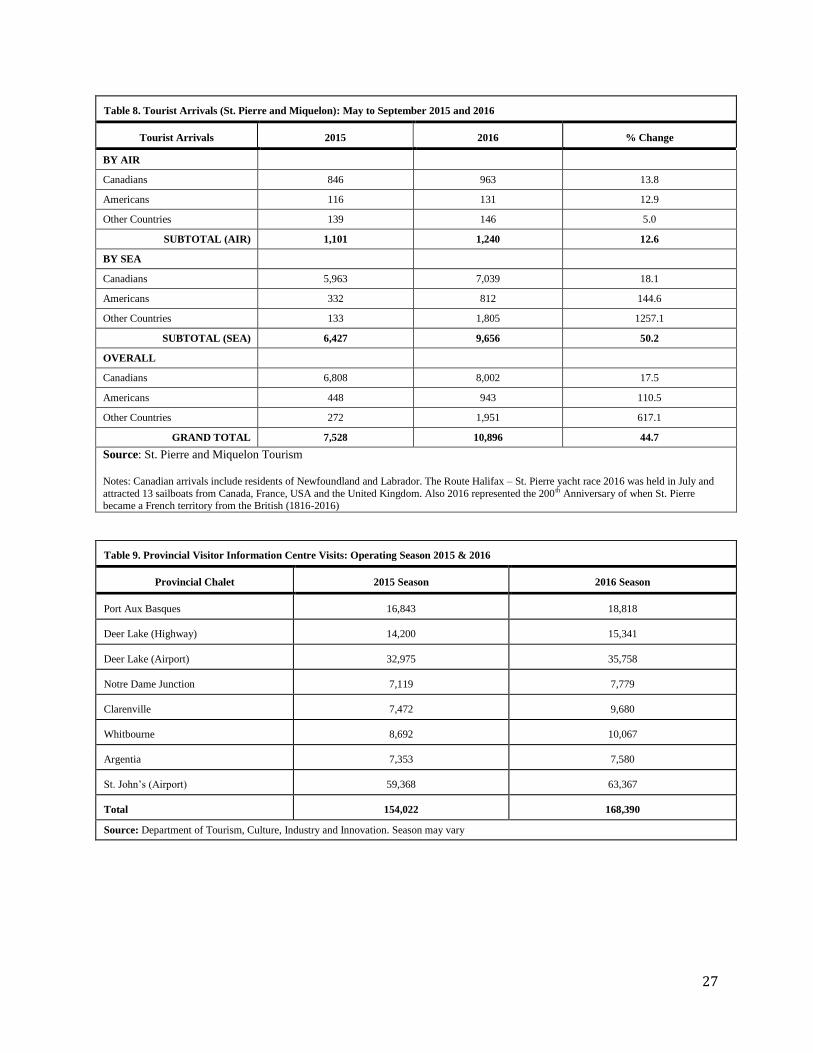
Table 8. Tourist Arrivals (St. Pierre and Miquelon): May to September 2015 and 2016
Tourist Arrivals
2015
2016
% Change
BY AIR
Canadians 846 963 13.8
Americans 116 131 12.9
Other Countries 139 146 5.0
SUBTOTAL (AIR) 1,101 1,240 12.6
BY SEA
Canadians 5,963 7,039 18.1
Americans 332 812 144.6
Other Countries 133 1,805 1257.1
SUBTOTAL (SEA) 6,427 9,656 50.2
OVERALL
Canadians 6,808 8,002 17.5
Americans 448 943 110.5
Other Countries 272 1,951 617.1
GRAND TOTAL 7,528 10,896 44.7
Source: St. Pierre and Miquelon Tourism
Notes: Canadian arrivals include residents of Newfoundland and Labrador. The Route Halifax – St. Pierre yacht race 2016 was held in July and
attracted 13 sailboats from Canada, France, USA and the United Kingdom. Also 2016 represented the 200th Anniversary of when St. Pierre became a French territory from the British (1816-2016)
Table 9. Provincial Visitor Information Centre Visits: Operating Season 2015 & 2016
Provincial Chalet
2015 Season
2016 Season
Port Aux Basques
16,843
18,818
Deer Lake (Highway)
14,200
15,341
Deer Lake (Airport)
32,975
35,758
Notre Dame Junction
7,119
7,779
Clarenville
7,472
9,680
Whitbourne
8,692
10,067
Argentia
7,353
7,580
St. John’s (Airport)
59,368
63,367
Total
154,022
168,390
Source: Department of Tourism, Culture, Industry and Innovation. Season may vary
28
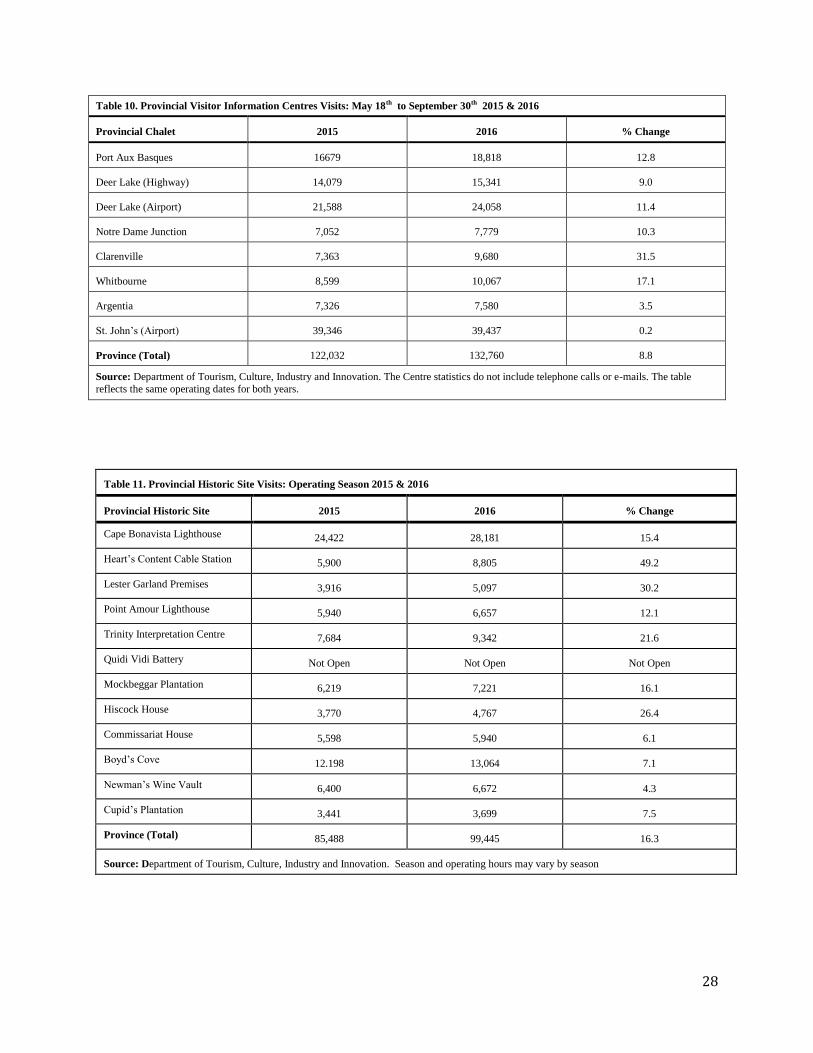
Table 10. Provincial Visitor Information Centres Visits: May 18th to September 30th 2015 & 2016
Provincial Chalet
2015
2016
% Change
Port Aux Basques
16679
18,818
12.8
Deer Lake (Highway)
14,079
15,341
9.0
Deer Lake (Airport)
21,588
24,058
11.4
Notre Dame Junction
7,052
7,779
10.3
Clarenville
7,363
9,680
31.5
Whitbourne
8,599
10,067
17.1
Argentia
7,326
7,580
3.5
St. John’s (Airport)
39,346
39,437
0.2
Province (Total)
122,032
132,760
8.8
Source: Department of Tourism, Culture, Industry and Innovation. The Centre statistics do not include telephone calls or e-mails. The table
reflects the same operating dates for both years.
Table 11. Provincial Historic Site Visits: Operating Season 2015 & 2016
Provincial Historic Site
2015
2016
% Change
Cape Bonavista Lighthouse
24,422
28,181
15.4
Heart’s Content Cable Station
5,900
8,805
49.2
Lester Garland Premises
3,916
5,097
30.2
Point Amour Lighthouse
5,940
6,657
12.1
Trinity Interpretation Centre
7,684
9,342
21.6
Quidi Vidi Battery
Not Open
Not Open
Not Open
Mockbeggar Plantation
6,219
7,221
16.1
Hiscock House
3,770
4,767
26.4
Commissariat House
5,598
5,940
6.1
Boyd’s Cove
12.198
13,064
7.1
Newman’s Wine Vault
6,400
6,672
4.3
Cupid’s Plantation
3,441
3,699
7.5
Province (Total)
85,488
99,445
16.3
Source: Department of Tourism, Culture, Industry and Innovation. Season and operating hours may vary by season
29
Table 12. Terra Nova National Park Visitation: Operating Season ending October 2015 and 2016
Terra Nova Park 2015 2016 % Change
Camper Nights 19,173 21,579 15.9
Visitor Centre 22,794 26,312 15.4
Activity Centre 1,685 3,933 133.4
Motorcoach Visits 69 85 23.2
Motorcoach Passengers 2,573 2,969 15.4
Source: Parks Canada, Terra Nova National Park
Table 13. Gros Morne National Park Visitation: (Operating Season ending October) 2015 and 2016
Gros Morne Park
2015
2016
% Change
Number of Visitors
(June to October)
207,000
240,000
15.9
Camper Nights
11,925
13,508
13.3
Visitors (Discovery Centre)
25,492
34,787
36.5
Visitors (Visitor Centre)
42,038
43,350
3.1
Visitors (Lighthouse)
24,530
27,152
10.7
Visitors (Broom Point)
8,486
10,202
20.2
Motorcoach Visits
187
225
20.3
Motorcoach Passengers
6,864
7,997
16.5
Boat Tours (People)
28,286
35,521
25.6
Source: Parks Canada, Gros Morne National Park
30
Table 14. National Historic Sites: (Operating Season) 2015 and 2016
National Historic Site
2015
2016
% Change
L’Anse Aux Meadows
23,873
27,982
17.2
Port Au Choix
8,680
9,954
14.7
Red Bay
8,002
10,099
26.2
Castle Hill
9,469
9,310
-1.7
Ryan Premises
7,639
8,647
13.2
Hawthorne Cottage
2,851
3,447
20.9
Signal Hill (Cabot Tower)
16,018
11,542
-27.9
Cape Spear (Visitor Centre)
14,553
13,387
-8.0
Total
91,085
94,368
3.6
Signal Hill (Visitor Centre)
10,229
13,349
30.5
Cape Spear (Lighthouse)
18,904
29,153
54.2
Source: Parks Canada, L’Anse Aux Meadows, Port Au Choix, Red Bay, Castle Hill, Hawthorne Cottage, Ryan Premises, Signal Hill and Cape Spear National Historic Sites. Operating season may vary.
Note: Only the month of August 2015 and 2016 is presented for Signal Hill (Cabot Tower) as the site was closed for May, June and July 2015 for renovations/maintenance issues and September 6th to October 31st 2016 as the parking lot was being resurfaced and paved. For the full 2014
operating season of May to October, Signal Hill (Cabot Tower) received 37,360 visitors.
Table 15. System of Regional Museums: Operating Season 2015 and 2016
Museum
2015
2016
% Change
Mary March Provincial Museum 3,871 4,787 23.7
Provincial Seamen’s Museum 2,701 3,010 11.4
Labrador Interpretation Centre 2,687 2,491 -7.3
Overall 9,259 10,288 11.1
Source: Department of Tourism, Culture, Industry and Innovation.
Table 16. MC & IT and Event Statistics City of St. John’s: 2014 and 2015
2015
2016
% Change
Number of MC & IT and Events
82
105
28.0
Number of MC & IT and Event Room Nights
30,562
33,269
8.9
Number of MC & IT and Event Delegates
21,215
24,888
17.3
Source: Destination St. John’s
31
Table 17 (a). Provincial Parks: Camping Units Registered (Operating Season) 2015 and 2016 by Park
Provincial Park
2015
2016
% Change
Barachois Pond
11,962
11,919
-0.4
Blow Me Down
1,175
1,299
10.6
J. T. Cheeseman
3,022
2,513
-16.8
Pinware River (Labrador)
522
674
29.1
Pistolet Bay
1,651
1,831
10.9
Sandbanks
1,392
1,307
-6.1
Squires Memorial
4,566
4,488
-1.7
Western & Labrador Straits Region
24,290
24,031
-1.1
Dildo Run
3,242
3,123
-3.7
Notre Dame
6,561
6,511
-0.8
Central Region
9,803
9,634
-1.7
Frenchman’s Cove
5,518
4,656
-15.6
Lockston Path
4,148
4,476
7.9
Eastern Region
9,666
9,132
-5.5
Butter Pot
13,837
13,726
-0.8
La Manche
6,320
6,342
0.3
Avalon Region
20,157
20,068
-0.4
Province
63,916
62,865
-1.6
Source: Department of Tourism, Culture, Industry and Innovation.
Notes: There are seven parks located in the Western & Labrador region including Barachois Pond, Blow Me Down, J.T. Cheeseman, Pistolet Bay,
Sandbanks, Squires Memorial and Pinware River (Labrador Straits). The two parks located in the Central region include Dildo Run and Notre Dame while the Eastern region parks are Frenchman’s Cove and Lockston Path. The two parks located on the Avalon Peninsula include Butter
Pot and La Manche.
Table 17 (b). Provincial Parks: Camping Units registered (operating Season) 2015 and 2016 by Origin
2015
2016
% Change
Newfoundland and Labrador
49,524
50,160
1.3
Other Canada
14,392
8,736
-11.7
United States
2,115
Other Countries
674
Unknown
1,180
Province
63,916
62,865
-1.6
32
Table 18. Cape St. Mary’s, Burnt Cape and Mistaken Point Ecological Reserve: (May 1 to October 15) 2015 and 2016
2015
2016
% Change
Number of Visitors
Cape St. Mary’s
13,758
16,014
16.4
Number of Visitors Mistaken Point
1,135
1,997
75.9
Source: Department of Department of Tourism, Culture, Industry and Innovation.
Notes: Mistaken Point received UNESCO designation on July 17th, 2016
Table 19. Edge of Avalon Interpretive Centre: (May to October) 2015 and 2016
Visitors
2015
2016
% Change
Number of Visitors
7,217
9,265
28.4
Source: Edge of Avalon Interpretive Centre (Portugal Cove South) Notes: Mistaken Point received UNESCO designation on July 17th, 2016
Table 20. Myrick Wireless Interpretation Centre: (July to September) 2015 and 2016
Visitors
2015
2016
% 5Change
Number of Visitors
1,283 1,759 37.1
Source: Myrick Wireless Interpretation Centre (Cape Race)
Table 21. Salmonier Nature Park: June to October 2015 and 2016
Visitors
2015
2016
% Change
General Visitation
42,590 n/a n/a
Community/Recreation and
School Groups (Visitors)
5,819 4,465 -23.3
Number of Visitors (Total)
48,409 n/a n/a
Source: Salmonier Nature Park
Table 22. Colony of Avalon (Ferryland): June to October 2015 and 2016
Visitors
2015
2016
% Change
Number of Visitors
12,168
15,630
28.5
Source: Colony of Avalon Foundation (Ferryland)
33
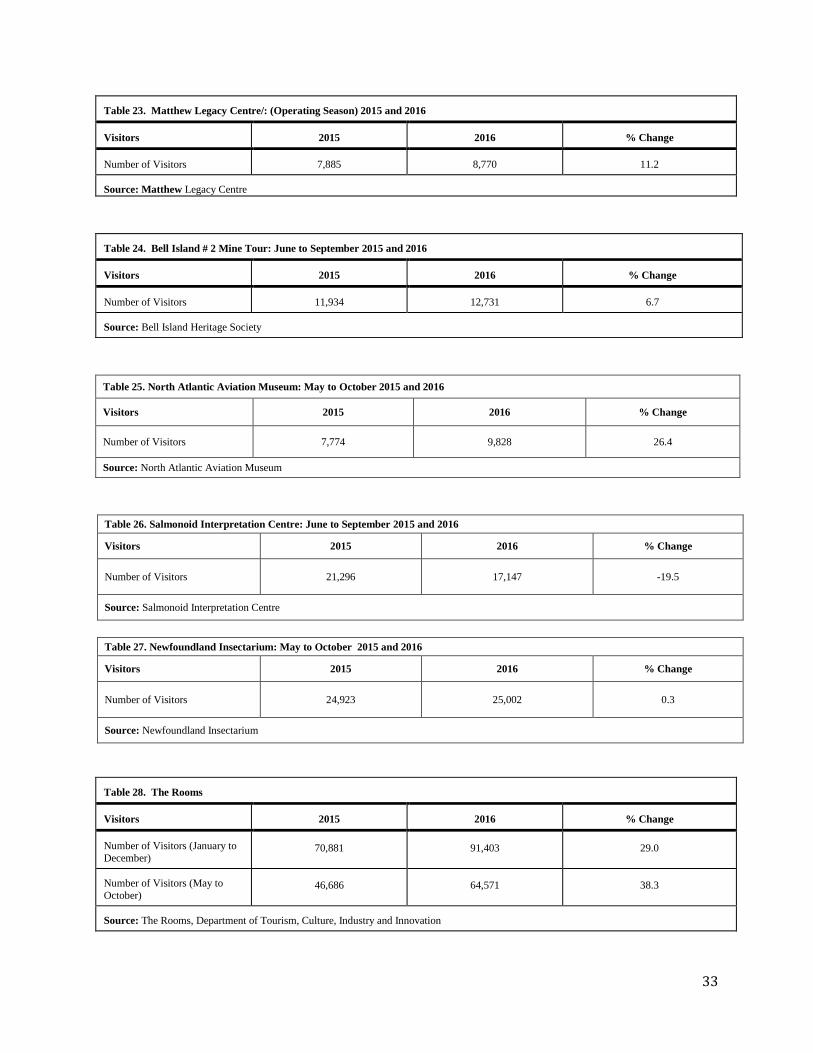
Table 23. Matthew Legacy Centre/: (Operating Season) 2015 and 2016
Visitors
2015
2016
% Change
Number of Visitors
7,885
8,770
11.2
Source: Matthew Legacy Centre
Table 24. Bell Island # 2 Mine Tour: June to September 2015 and 2016
Visitors
2015
2016
% Change
Number of Visitors
11,934
12,731
6.7
Source: Bell Island Heritage Society
Table 25. North Atlantic Aviation Museum: May to October 2015 and 2016
Visitors 2015 2016 % Change
Number of Visitors 7,774 9,828 26.4
Source: North Atlantic Aviation Museum
Table 26. Salmonoid Interpretation Centre: June to September 2015 and 2016
Visitors 2015 2016 % Change
Number of Visitors 21,296 17,147 -19.5
Source: Salmonoid Interpretation Centre
Table 27. Newfoundland Insectarium: May to October 2015 and 2016
Visitors 2015 2016 % Change
Number of Visitors 24,923 25,002 0.3
Source: Newfoundland Insectarium
Table 28. The Rooms
Visitors
2015
2016
% Change
Number of Visitors (January to
December) 70,881 91,403 29.0
Number of Visitors (May to
October) 46,686 64,571 38.3
Source: The Rooms, Department of Tourism, Culture, Industry and Innovation
34
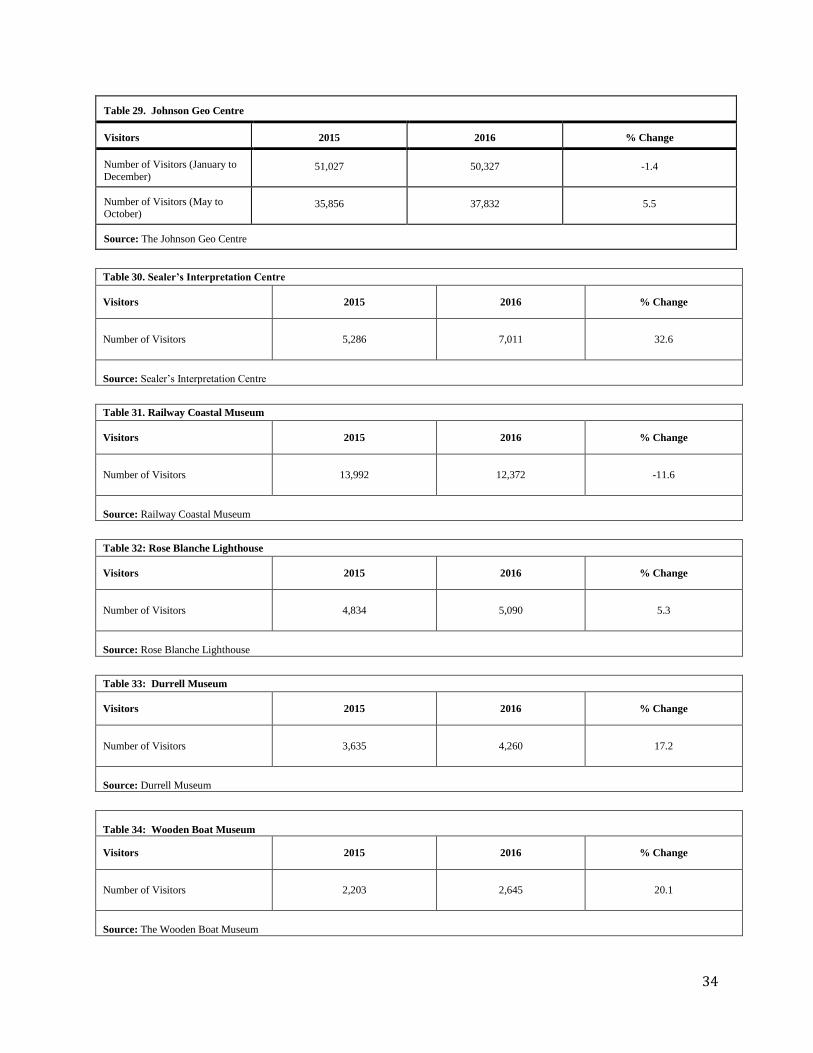
Table 29. Johnson Geo Centre
Visitors
2015
2016
% Change
Number of Visitors (January to
December) 51,027 50,327 -1.4
Number of Visitors (May to October)
35,856 37,832 5.5
Source: The Johnson Geo Centre
Table 30. Sealer’s Interpretation Centre
Visitors 2015 2016 % Change
Number of Visitors 5,286 7,011 32.6
Source: Sealer’s Interpretation Centre
Table 31. Railway Coastal Museum
Visitors 2015 2016 % Change
Number of Visitors 13,992 12,372 -11.6
Source: Railway Coastal Museum
Table 32: Rose Blanche Lighthouse
Visitors 2015 2016 % Change
Number of Visitors 4,834 5,090 5.3
Source: Rose Blanche Lighthouse
Table 33: Durrell Museum
Visitors 2015 2016 % Change
Number of Visitors 3,635 4,260 17.2
Source: Durrell Museum
Table 34: Wooden Boat Museum
Visitors 2015 2016 % Change
Number of Visitors 2,203 2,645 20.1
Source: The Wooden Boat Museum
35
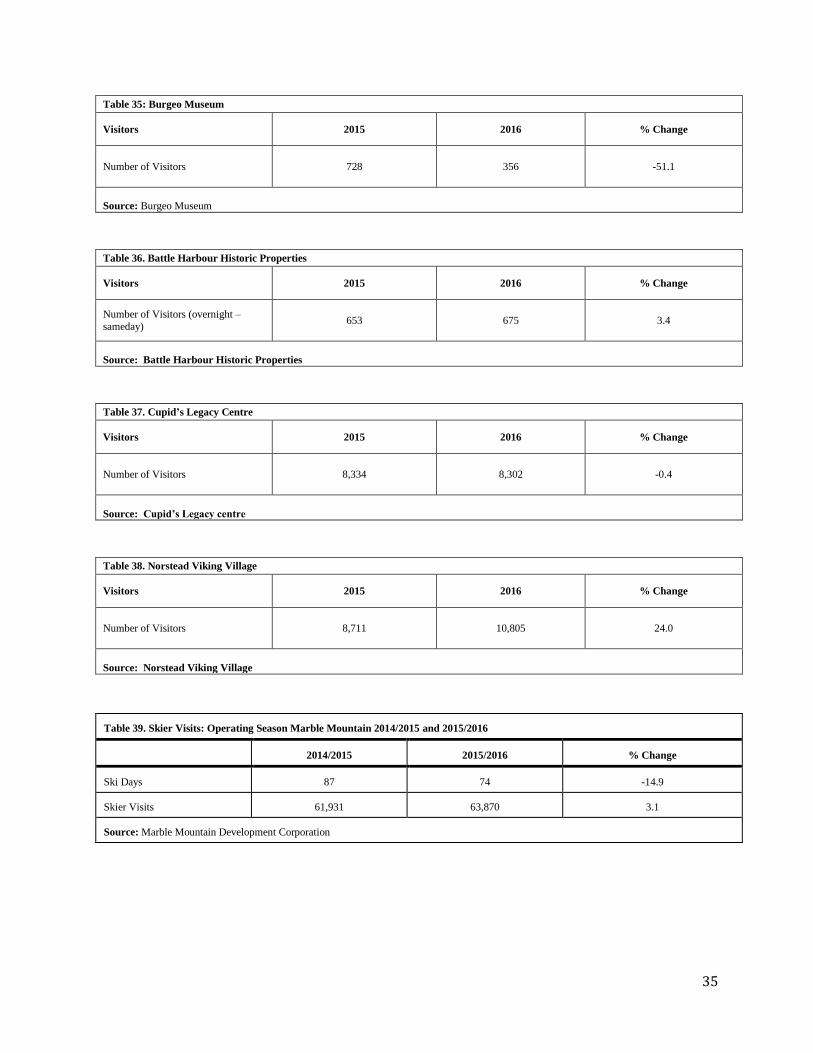
Table 35: Burgeo Museum
Visitors 2015 2016 % Change
Number of Visitors 728 356 -51.1
Source: Burgeo Museum
Table 36. Battle Harbour Historic Properties
Visitors 2015 2016 % Change
Number of Visitors (overnight –
sameday) 653 675 3.4
Source: Battle Harbour Historic Properties
Table 37. Cupid’s Legacy Centre
Visitors 2015 2016 % Change
Number of Visitors 8,334 8,302 -0.4
Source: Cupid’s Legacy centre
Table 38. Norstead Viking Village
Visitors 2015 2016 % Change
Number of Visitors 8,711 10,805 24.0
Source: Norstead Viking Village
Table 39. Skier Visits: Operating Season Marble Mountain 2014/2015 and 2015/2016
2014/2015
2015/2016
% Change
Ski Days
87
74
-14.9
Skier Visits
61,931
63,870
3.1
Source: Marble Mountain Development Corporation