NewFields Prepared Expressly For - FWS
11
NewFields Prepared Expressly For: lENT O f ^ Technical Memorandum Generation of Oyster Survival Salinity Dose-Response Curves using Nestier Tray data Shahrokh Rouhani and Jacob Oehrig September 4, 2015 - „ »"beepwater Horizpn Oil Spill • NewFields LLC, 1349 West Peachtree St NW#2000, Atlanta, GA 30309 DWH-AR0270362
Transcript of NewFields Prepared Expressly For - FWS

NewFields Prepared Expressly For:
lENT O f ^
Technical MemorandumGeneration o f Oyster Survival Salinity Dose-Response
Curves using Nestier Tray dataShahrokh Rouhani and Jacob Oehrig
September 4, 2015
- „ »"beepwater Horizpn Oil Spill •NewFields LLC, 1349 West Peachtree St NW#2000, Atlanta, GA 30309
DWH-AR0270362

TECHNICAL MEMORANDUM
SUBJECT: Generation of Oyster Survival Salinity Dose-Response Curves using Nestier Tray data
DATE: September 4, 2015
TO: Marla Steinhoff, NCAA; Mary Baker, NCAA; Henry Roman, lEc
FROM: Shahrokh Rouhani, NewFields; Jacob Oehrig, NewFields
INTRODUCTION
Following the Deepwater Horizon oil spill (DWH spill) in April 2010, the state o f Louisiana opened two water control structures in the Mississippi River in attempt to minimize the amount o f oil reaching the shore (Rose et al. 2014). These structures directed large amounts o f river water into Barataria Bay (through the Davis Pond stmcture) and Black Bay/Breton Soimd (through the Caemarvon stmcture). Figure 1 depicts the locations o f the river water diversion stmctures and their respective basins of influence. The Caemarvon diversion was opened three days after the explosion (April 23, 2010) and remained open through the first two weeks o f August with flow at or near maximum capacity (approximately 8,000 cubic feet per second (cfs)). The Davis Pond diversion remained open from May 8 through September 10, 2010, with flow ranging from 7,000 to 10,000 cfs. The 2010 opening o f these structures was atj^ical in that they remained open longer than usual and maintained high flow rates during the spring and summer seasons when they are usually closed. As shown by Figures 2 and 3, the average river water flow through Caemarvon and Davis Pond diversions during the spring and summer months o f April - September were elevated during 2010 compared to flow rates over the same time period in preceding and following years. Substantial river water releases can lead to salinity drops that may have impacts on marine fauna such as oysters, which are especially susceptible due to their limited mobility. In order to determine the level and temporal extent o f the fresh water’s deleterious effects on oyster survival, salinity dose-response curves were created using in-situ oyster surv ival data collected from Louisiana Department o f Wildlife and Fisheries (LDWF) annual Nestier Tray studies.
DWH-AR0270363

D iversion B asins
A C a e rn a rv o n OLrtfall
D av is P o n d Outfall
Hlank Hay/Hretnn Sound B csin
\/ / \ B a ra ta r ia B ay B asin
%V////A
0 5 10 20 30 40K ilo m e te rs
Figure 1- Mississippi River diversion outfall locations and their respective basins of influence.
Average Flow through Caernarvon Diversion (April - September)
5 ,0 0 0'C0}moc
4 ,0 0 0
3 ,0 0 0
<Dto 2,000fOQ> ̂1,000 T
2001 2002 2003 2004 2005 2006 2007 2008 2009 2010 2011 2012 2013 2014
Figure 2 Average flow rate through the Caemarvon diversion during the months of April - September for each year
DWH-AR0270364

Average Flow through Davis Pond Diversion {April - Septem ber)
6,000
5 ,0 0 0
uc t 4 ,0 0 0
Q£3 ,0 0 0
0>ngp 2,000 0>
1,000 ------
, 1 i . I I2003 2004 2005 200G 2007 2008 2009 2010 2011 2012 2013 2014
Figure 3 Average flow rate through the Davis Pond diversion during the months of April - September for each year
DATA SOURCES
Nestier Tray Data
During 2007 through 2012, the LDWF conducted annual oyster survival studies in multiple regions along the coast o f Louisiana. For these studies, 20 seed-sized oysters were affixed to 70 cm by 70 cm by 7.6 cm Nestier trays and deployed on the seafloor in January o f each year. Table 1 provides summary statistics of the size o f oysters used in the Nestier trays each year. Each month, LDWF examined the trays and recorded data on individual oyster status, such as whether they were “alive”, “dead”, or “missing”.' Nestier tray survival data collected from within Barataria Bay and Black Bay/Breton Sound were used in this analysis. The locations o f these trays are shown in Figure 4.
1. Live/dead status w a s ass igned by tapping each oyster's shell to s e e If it responds , and exam ining
shells for p rese n ce o f predators, fouling organisms, or identification o f an em p ty box.
DWH-AR0270365

Table 1 Summary statistics o f oyster lengths deployed in the Nestier Trays each year
YearNumber
ofOysters
Avg Length (mm)
Min Length (mm)
Max Length (mm)
Std Dev (mm)
2007 1171 69.8 40 111 9.02008 1168 73.8 48 104 8.82009 1156 71.0 43 102 9.72010 1170 68.8 43 106 8.52011 1193 71.6 48 97 7.42012 473 77.2 48 99 7.3
All Years 6331 71.5 40 111 8.9
N dstierT ray Site L ocations
■ N estier Tray Location in 2010■ N estier Tray Location in 2007-2009
□ □□
□ □
Figure 4 Locations of Nestier trays used in the analysis
Modeled Salinity DataDaily average salinities for 2006 through 2012 were estimated using a spatio-temporal kriging model fit to an extensive dataset o f water quality observations in Barataria Bay and Black Bay/Breton Sound (McDonald et a l, 2015). The model incorporated both continuous (hourly or daily) monitor data and discrete measurements of water quality to estimate daily salinities for each cell in a dense 200-meter by 200-meter grid that overlaid the respective basins. The model relied upon salinity data collected hy the Louisiana Department o f Wildlife and Fisheries (LDWF), the Louisiana Office o f Coastal Protection and Restoration (LOCPR), the Louisiana Department o f Health and Hospitals (LDHH), the Louisiana Department o f Environmental Quality (LDEQ), the United States Geological Survey (USGS), and
DWH-AR0270366

measurements recorded during DWH natural resource damage assessment (NRDA) oyster sampling. The locations o f water quality/salinity monitoring stations are shown in Figure 5.
The results o f the model were subjected to two hold-out cross-validation procedures which yielded statistically significant correlations between measured and predicted values across multiple years and basins. Therefore, the model results can be reliably used in estimating salinity conditions at locations and days where physical water quality measurements were not collected. A detailed description o f the model and its validation results can be found in McDonald et al. (2015).
Salinity S tation L ocationsType
• C ontinuous
D iscrete^ .A
U b U 20 20 40K ilo m e te rs
Figure 5 Location of salinity stations used in spatio-temporal kriging model
METHODOLOGY
Nestier tray data from the Barataria Bay and Breton Sound basins were used to develop dose-response curves relating oyster survival to fresh water exposures during the months o f April through September. April through September was used as the temporal range o f investigation as this is when the river water from the diversions would have reached the oyster study areas (Powers et a l, 2015). Using the spatial- temporal salinity model, doses were computed and measured as the maximum number o f consecutive days with salinity below 5 parts per thousand (ppt) at each Nestier tray location. When calculating the maximum number o f consecutive days, periods o f low salinity (i .e., below 5 ppt) separated by temporary salinity increases lasting three days or fewer were considered as part o f the same consecutive low salinity
DWH-AR0270367

period. Oyster survival percent was used as the response variable and was calculated for each Nestier tray by determining the number o f oysters that remained alive from April through September o f each year.
Only Nestier trays with at least 50 percent o f the originally affixed oysters remaining alive as o f April of each year were included in dose-response modeling in order to exclude trays with high mortality caused by factors unrelated to fresh water exposure. Due to the unavailability o f sundval data prior to June 2006, all 2006 Nestier tray data were excluded from subsequent analyses. Data from four Nestier trays in Barataria Bay were also excluded due to their location m marine environments, which often experience increased mortality as a result o f enhanced predation in their more saline waters (Gunter, 1955).
Nestier tray survival and location-specific salinity data covering April through September were combined across both Barataria Bay and Breton Sound basins and used to develop two inhibitory dose-response curves for the period from 2007 through 2012, excluding 2010, as well as for 2010 only, utilizing Equation 1.
„ _ „ ( T o p - B o t t o m )Equation 1: I ~ O OttOTTL ~r
Where:
Y = modeled oyster survival percentage X = number o f consecutive days with salinity below 5 pptTop = upper plateau o f the curve, which is consistent with sundval rate when 0 days o f fresh water influence occurred. For this analysis, 100% survival at the 0 consecutive days o f low salinity was assumed, so Top was set to 1.Bottom = lower plateau o f the cun'e, which is consistent with minimum sundval when exposed to fresh water. For this analysis, 0% survival was assumed after many days o f exposure to fresh water, so Bottom was set to 0.IC50 = represents the number o f consecutive fresh water days below 5 ppt that yields a 50% survival rate. This value was determined iteratively by minimizing the root mean square as described below.Flill slope = describes the steepness o f the family o f curves. A FIill slope o f -1.0 is standard and was used in all curve-fitting processes.
In the curve-fitting process, the Top, Bottom, and Hillslope variables were treated as constants o f 1, 0, and -1, respectively. Using the Root Mean Square (RMS) criterion, survival values from the Nestier tray data were compared to those modeled by the dose-response curves. To minimize the RMS, an iterative process o f machine leaniing algoritlim, in this case tire Solver dialog within Excel was used to detennine the IC50.
DWH-AR0270368

RESULTS
As shown in Figures 6 and 7, there is little difference between the two fitted dose-response curves. As a result, subsequent analyses relied on the 2010 curve. The resulting equation and parameters used for this curve are shown in Equation 2.
Equation 2:
Where:
Y =
Y = modeled oyster survival percentage X = number o f consecutive days with salinity below 5 ppt
2010 N estier Tray Dose Response Curve (Consec Days 5ppt)
-2 0 1 0 M odel ♦ O bserved Data
120%
100%
80%
> 60%
40%
20%
0%0 50 100 150
Max Num ber of Consec Days <5 ppt
Figure 6 Observed 2010 Nestier tray survival data with fitted 2010 dose-response curve
DWH-AR0270369

2010 and 2007-2012 Nestier Tray Dose Response Curves
(Consec Days 5ppt)• 2 0 0 7 -2 0 1 2 ex. 2 0 1 0 -------- 2 0 1 0 M o d e l Alt 0 7 -1 2 ex. 2 0 1 0 M o d e l
1.2
o o ©n
■5 0 .630 . 4 O----
o0.2 h[)-----------------
0 OQO^XXWOO0 100 ISO
Max Number of Consec Days < 5 ppt
Figure 7 Observed 2007-2012 (excluding 2010) Nestier tray survival data with both fitted dose-response curves
Using the 2010 dosc-rcsponsc curves and results from the salinity model, the decrease in the oyster survival rate at each 200 m~ grid cell from the salinity model due to the 2010 freshwater diversion exposures was calculated as the difference between survival rate based on the maximum number of consecutive low-salinity (below 5ppt) days in 2010 and the survival rate based on the average historical (2006-2009) maximum of consecutive low-salinity days at the same cell. Grids with higher predicted survival in 2010 than prior years were assumed to have a zero decrease in survival. All grids indicating a decrease in oyster survival were combined into a comprehensive polygon per basin (Figure 8). This polygon represents the spatial extent of areas in which oysters, if present, would be expected to show decrease in survival due to exposure to fresh water from the diversion openings in 2010.
DWH-AR0270370

L e g e n d
Area which w ould e x p e rien ce d e c re a s e in survival of o y s te rs us 'n g N estier d o se re sp o n se curve in 2010
K i l o m e t e r s
Figure 8 Areas which indicate decrease in oyster survival in 2010 compared to average conditions in 2007-2009 using the 2010 Nestier salinity-survival dose response curve. This polygon represents the spatial extent of areas in which oysters, if present, would be expected to show decrease in oyster survival due to exposure to fresh water from the diversion openings in 2010.
DWH-AR0270371
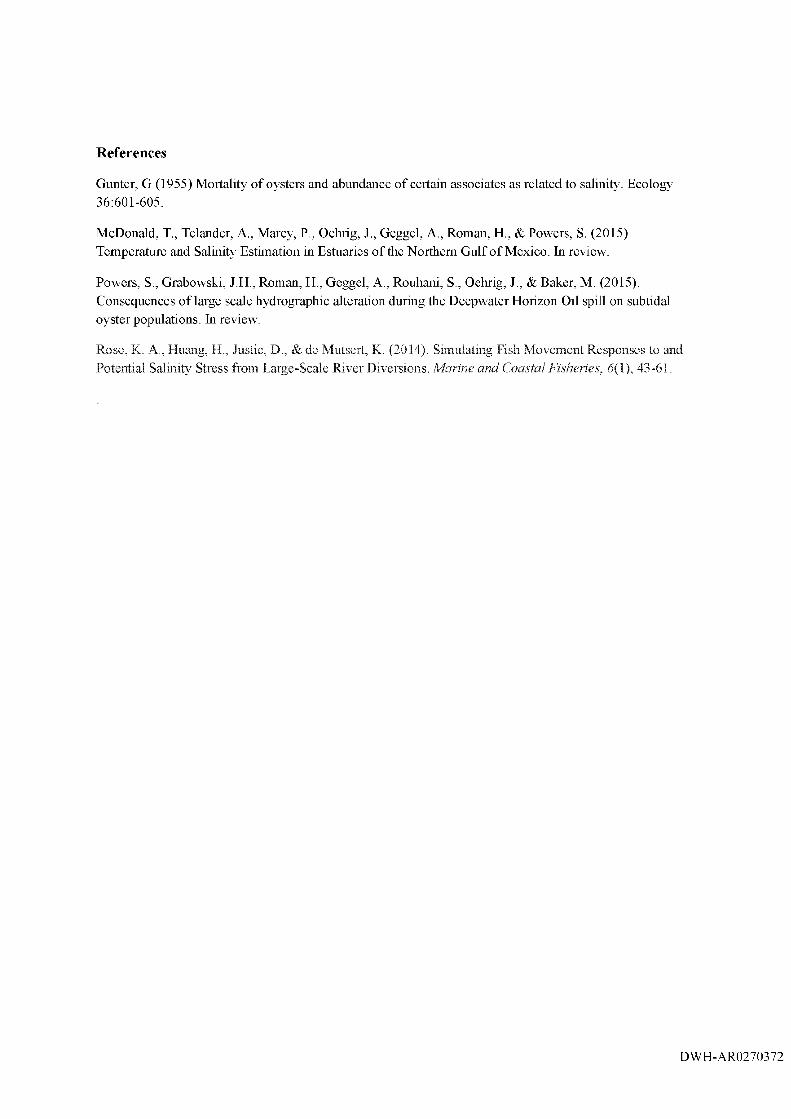
R eferences
Gunter, G (1955) Mortality o f oysters and abundance o f certain associates as related to salinity. Ecology 36:601-605.
McDonald, T., Telander, A., Marcy, P., Oehrig, J., Geggel, A., Roman, H., & Powers, S. (2015). Temperature and Salinity Estimation in Estuaries o f the Northern Gulf o f Mexico. In review.
Powers, S., Grabowski, J.H., Roman, H., Geggel, A., Rouhani, S., Oehrig, J., & Baker, M. (2015). Consequences o f large scale hydrographic alteration during the Deepwater Elorizon Oil spill on subtidal oyster populations, hr review.
Rose, K. A., Huang, H., Justic, D., & de Mutsert, K. (2014). Simulating Fish Movement Responses to and Potential Salinitj^ Stress from Large-Scale River Diversions. Marine and Coastal Fisheries, 6(1), 43-61.
DWH-AR0270372