New York State Common Core 6 Mathematics Curriculum from math-g6-m1... · New York State Common...
66
6 GRADE New York State Common Core Mathematics Curriculum GRADE 6 • MODULE 1 Topic B: Collections of Equivalent Ratios 6.RP.3a Focus Standard: 6.RP.3 Use ratio and rate reasoning to solve real-world and mathematical problems, e.g., by reasoning about tables of equivalent ratios, tape diagrams, double number line diagrams, or equations. a. Make tables of equivalent ratios relating quantities with whole-number measurements, find missing values in the tables, and plot the pairs of values on the coordinate plane. Use tables to compare ratios. Instructional Days: 7 Lesson 9: Tables of Equivalent Ratios (P) 1 Lesson 10: The Structure of Ratio Tables—Additive and Multiplicative (E) Lesson 11: Comparing Ratios Using Ratio Tables (P) Lesson 12: From Ratios Tables to Double Number Line Diagrams (P) Lesson 13: From Ratio Tables to Equations Using the Value of the Ratio (P) Lesson 14: From Ratio Tables, Equations, and Double Number Line Diagrams to Plots on the Coordinate Plane (S) Lesson 15: A Synthesis of Representations of Equivalent Ratio Collections (E) With the concept of ratio equivalence formally defined, students explore collections of equivalent ratios in real world contexts in Topic B. In Lessons 9 and 10, students build ratio tables and study and articulate their additive and multiplicative structure (6.RP.3a). In Lesson 11, students answer comparative questions about two distinct ratios using reasoning with ratio tables. Students continue to apply reasoning to solve ratio problems while they explore other representations of collections of equivalent ratios and relate those representations to their experience working with the ratio table (6.RP.3). Building on their experience with number lines, students represent collections of equivalent ratios with a double number line model in Lesson 12. In Lesson 13, they relate ratio tables to equations using the value of a ratio defined in Topic A. Finally, students expand their experience with the coordinate plane (5.G.1, 5.G.2) as they represent collections of equivalent ratios by plotting the pairs of values on the coordinate plane in 1 Lesson Structure Key: P-Problem Set Lesson, M-Modeling Cycle Lesson, E-Exploration Lesson, S-Socratic Lesson Topic B: Collections of Equivalent Ratios Date: 7/7/13 60 © 2013 Common Core, Inc. Some rights reserved. commoncore.org This work is licensed under a Creative Commons Attribution-NonCommercial-ShareAlike 3.0 Unported License.
Transcript of New York State Common Core 6 Mathematics Curriculum from math-g6-m1... · New York State Common...

6
G R A D E
New York State Common Core
Mathematics Curriculum GRADE 6 • MODULE 1
Topic B:
Collections of Equivalent Ratios
6.RP.3a
Focus Standard: 6.RP.3 Use ratio and rate reasoning to solve real-world and mathematical problems, e.g., by reasoning about tables of equivalent ratios, tape diagrams, double number line diagrams, or equations. a. Make tables of equivalent ratios relating quantities with whole-number
measurements, find missing values in the tables, and plot the pairs of values on the coordinate plane. Use tables to compare ratios.
Instructional Days: 7
Lesson 9: Tables of Equivalent Ratios (P)1
Lesson 10: The Structure of Ratio Tables—Additive and Multiplicative (E)
Lesson 11: Comparing Ratios Using Ratio Tables (P)
Lesson 12: From Ratios Tables to Double Number Line Diagrams (P)
Lesson 13: From Ratio Tables to Equations Using the Value of the Ratio (P)
Lesson 14: From Ratio Tables, Equations, and Double Number Line Diagrams to Plots on the Coordinate Plane (S)
Lesson 15: A Synthesis of Representations of Equivalent Ratio Collections (E)
With the concept of ratio equivalence formally defined, students explore collections of equivalent ratios in real world contexts in Topic B. In Lessons 9 and 10, students build ratio tables and study and articulate their additive and multiplicative structure (6.RP.3a). In Lesson 11, students answer comparative questions about two distinct ratios using reasoning with ratio tables. Students continue to apply reasoning to solve ratio problems while they explore other representations of collections of equivalent ratios and relate those representations to their experience working with the ratio table (6.RP.3).
Building on their experience with number lines, students represent collections of equivalent ratios with a double number line model in Lesson 12. In Lesson 13, they relate ratio tables to equations using the value of a ratio defined in Topic A. Finally, students expand their experience with the coordinate plane (5.G.1, 5.G.2) as they represent collections of equivalent ratios by plotting the pairs of values on the coordinate plane in
1 Lesson Structure Key: P-Problem Set Lesson, M-Modeling Cycle Lesson, E-Exploration Lesson, S-Socratic Lesson
Topic B: Collections of Equivalent Ratios Date: 7/7/13
60
© 2013 Common Core, Inc. Some rights reserved. commoncore.org This work is licensed under a Creative Commons Attribution-NonCommercial-ShareAlike 3.0 Unported License.

6•1 Topic B NYS COMMON CORE MATHEMATICS CURRICULUM
Lesson 14. In the final Lesson of this topic, students begin to synthesize their experience of the various representations by working a variety of ratio problems and choosing the representation that best represents their thinking. They continue to apply their understanding of the representations as they apply them to rate and percent problems in Topics C and D.
Topic B: Collections of Equivalent Ratios Date: 7/7/13
61
© 2013 Common Core, Inc. Some rights reserved. commoncore.org This work is licensed under a Creative Commons Attribution-NonCommercial-ShareAlike 3.0 Unported License.

Lesson 9: Tables of Equivalent Ratios Date: 7/7/13
62
© 2013 Common Core, Inc. Some rights reserved. commoncore.org This work is licensed under a Creative Commons Attribution-NonCommercial-ShareAlike 3.0 Unported License.
NYS COMMON CORE MATHEMATICS CURRICULUM 6•1 Lesson 9
PENDING FINAL EDITORIAL REVIEW
Lesson 9: Tables of Equivalent Ratios
Student Outcomes
Students understand that a ratio is often used to describe the relationship between the amount of one quantity and the amount of another quantity as in the cases of mixtures or constant rates.
Students understand that a ratio table is a table of equivalent ratios. Students use ratio tables to solve problems.
Lesson Notes The approach of this lesson and those that follow is for the teacher to model the use of tables in problem solving. There is no need to engage in an explanation of why or how they are useful; simply modeling their use in this lesson, examining their structure in the next lesson, and repeated use for problem solving in the remaining lessons of the topic should sufficiently promote tables as a tool for problem solving with collections of equivalent ratios.
Classwork
Example 1 (10 minutes)
To make Paper Mache, the art teacher mixes water and flour. For every two cups of water, she needs to mix in 3 cups of flour to make the paste.
Find equivalent ratios for the ratio relationship 2 cups of water to 3 cups of flour. Represent the equivalent ratios in the table below:
Cups of Water
Cups of Flour
2 3 2 : 3
4 6 2 : 3
6 9 2 : 3
8 12 2 : 3
10 15 2 : 3

Lesson 9: Tables of Equivalent Ratios Date: 7/7/13
63
© 2013 Common Core, Inc. Some rights reserved. commoncore.org This work is licensed under a Creative Commons Attribution-NonCommercial-ShareAlike 3.0 Unported License.
NYS COMMON CORE MATHEMATICS CURRICULUM 6•1 Lesson 9
PENDING FINAL EDITORIAL REVIEW What does this ratio mean? For every 2 cups of water, there are 3 cups of flour. Every time we have a set of
two cups of water; we need to have a set of three cups of flour.
Why is it worded, “for every 2 cups of water there are 3 cups of flour”? This suggests that we might be making that action repeatedly, adding 2 cups of water and 3 cups of flour. Why would I do it more than once?
(Create a table on the board and label the columns.) Can we list all of the possible recipes for this mixture in order in a table? Let’s start with the ratio that uses the smallest whole numbers. Is there an equivalent ratio that uses smaller whole numbers than the ratio 2 to 3?
Then let’s make 2 cups of water and 3 cups of flour be our first entry.
What would the next possibility be? I don’t want to skip over any of my options here.
Continue to guide the students to create the table shown.
What is the value of each ratio in the table?
Is that what we expected? Should the value of all of these ratios be equal to each other?
What we have created here is a ratio table, a table in which all of the values of the ratios are equivalent to one another.
What kinds of questions could we answer with the data in our table? Can anyone think of a question we might have had at the start of this problem that this table could help us answer?
Example 2
Javier has a new job designing web sites. He is paid at a rate of $700 for every 3 pages of web content. Create a ratio table to show the total money Javier has earned in ratio to the number of pages he has built.
Javier is saving up to purchase a used car that costs $4300. How many web pages will Javier need to build before he can pay for the car?
Is there an equivalent ratio to 700:3 that still uses smaller whole numbers?
No.
So we’ll start our table with the entry 3 pages built and $700 earned. Go ahead and fill in the table without skipping over any possible ratios.
Allow 5 to 10 minutes for each of the next two exercises. If students can only finish one of them, that is alright. Alternatively, if students finish both quickly, you can extend the lesson by either a) allowing a student to present their table on the board and ask students if they notice any patterns within the table or b) present a partially completed table on the board and ask students to create their own real-world situation and word problem that could go with it.
Total Pages Built
Total Money Earned
MP.7
Lesson 9: Tables of Equivalent Ratios Date: 7/7/13
64
© 2013 Common Core, Inc. Some rights reserved. commoncore.org This work is licensed under a Creative Commons Attribution-NonCommercial-ShareAlike 3.0 Unported License.
NYS COMMON CORE MATHEMATICS CURRICULUM 6•1 Lesson 9
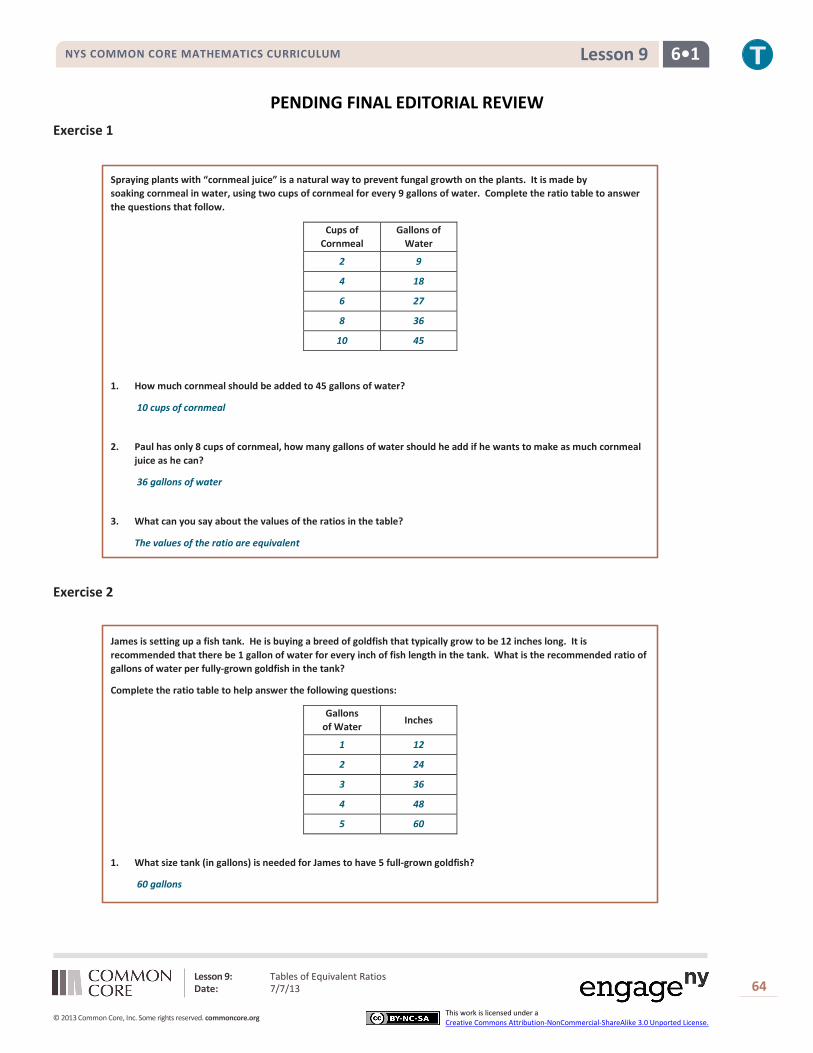
PENDING FINAL EDITORIAL REVIEW Exercise 1
Spraying plants with “cornmeal juice” is a natural way to prevent fungal growth on the plants. It is made by soaking cornmeal in water, using two cups of cornmeal for every 9 gallons of water. Complete the ratio table to answer the questions that follow.
Cups of Cornmeal
Gallons of Water
2 9
4 18
6 27
8 36
10 45
1. How much cornmeal should be added to 45 gallons of water?
10 cups of cornmeal
2. Paul has only 8 cups of cornmeal, how many gallons of water should he add if he wants to make as much cornmeal juice as he can?
36 gallons of water
3. What can you say about the values of the ratios in the table?
The values of the ratio are equivalent
Exercise 2
James is setting up a fish tank. He is buying a breed of goldfish that typically grow to be 12 inches long. It is recommended that there be 1 gallon of water for every inch of fish length in the tank. What is the recommended ratio of gallons of water per fully-grown goldfish in the tank?
Complete the ratio table to help answer the following questions:
Gallons of Water Inches
1 12
2 24
3 36
4 48
5 60
1. What size tank (in gallons) is needed for James to have 5 full-grown goldfish?
60 gallons
Lesson 9: Tables of Equivalent Ratios Date: 7/7/13
65
© 2013 Common Core, Inc. Some rights reserved. commoncore.org This work is licensed under a Creative Commons Attribution-NonCommercial-ShareAlike 3.0 Unported License.
NYS COMMON CORE MATHEMATICS CURRICULUM 6•1 Lesson 9
PENDING FINAL EDITORIAL REVIEW
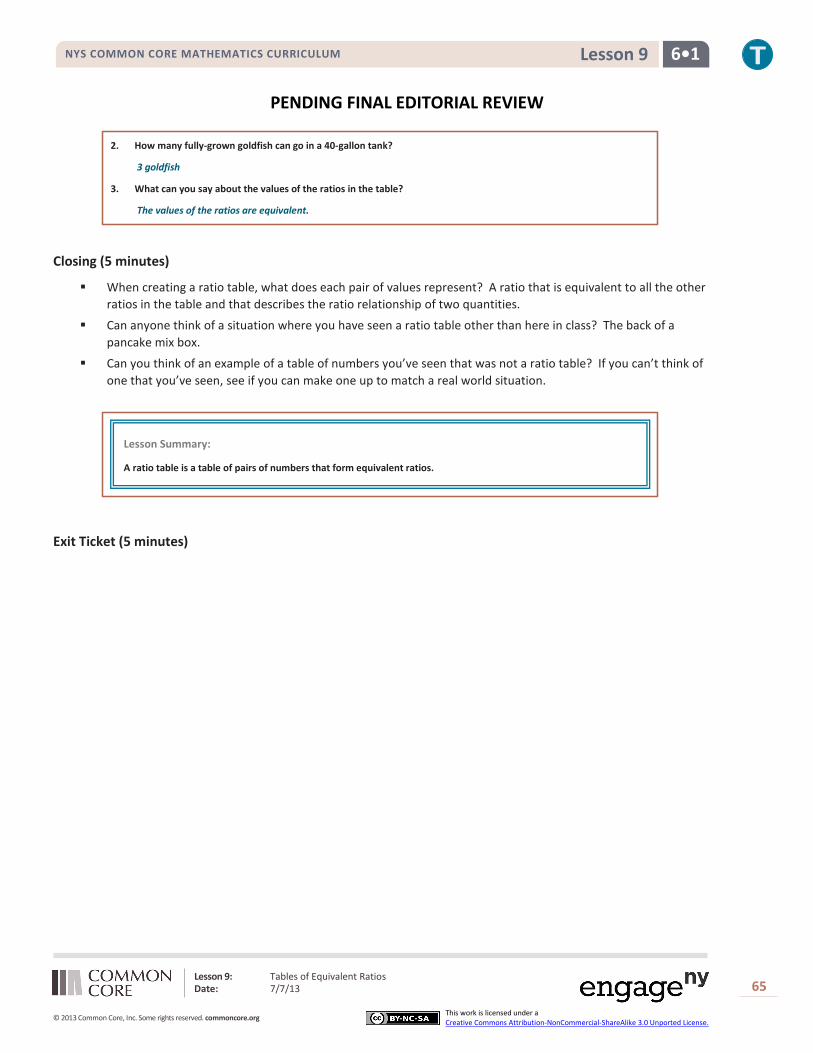
2. How many fully-grown goldfish can go in a 40-gallon tank?
3 goldfish
3. What can you say about the values of the ratios in the table?
The values of the ratios are equivalent.
Closing (5 minutes)
When creating a ratio table, what does each pair of values represent? A ratio that is equivalent to all the other ratios in the table and that describes the ratio relationship of two quantities.
Can anyone think of a situation where you have seen a ratio table other than here in class? The back of a pancake mix box.
Can you think of an example of a table of numbers you’ve seen that was not a ratio table? If you can’t think of one that you’ve seen, see if you can make one up to match a real world situation.
Exit Ticket (5 minutes)
Lesson Summary:
A ratio table is a table of pairs of numbers that form equivalent ratios.

Lesson 9: Tables of Equivalent Ratios Date: 7/7/13
66
© 2013 Common Core, Inc. Some rights reserved. commoncore.org This work is licensed under a Creative Commons Attribution-NonCommercial-ShareAlike 3.0 Unported License.
NYS COMMON CORE MATHEMATICS CURRICULUM 6•1 Lesson 9
PENDING FINAL EDITORIAL REVIEW Name ___________________________________________________ Date____________________
Lesson 9: Tables of Equivalent Ratios
Exit Ticket
A father and his young toddler are walking along the sidewalk. For every 3 steps the father takes, the son takes 5 steps just to keep up. What is the ratio of number of steps the father takes to number of steps the son takes? Add labels to the columns of the table and place the ratio into the first row of data. Add equivalent ratios to build a ratio table.
What can you say about the values of the ratios in the table?

Lesson 9: Tables of Equivalent Ratios Date: 7/7/13
67
© 2013 Common Core, Inc. Some rights reserved. commoncore.org This work is licensed under a Creative Commons Attribution-NonCommercial-ShareAlike 3.0 Unported License.
NYS COMMON CORE MATHEMATICS CURRICULUM 6•1 Lesson 9
PENDING FINAL EDITORIAL REVIEW Exit Ticket Sample Solutions
The following solutions indicate an understanding of the objectives of this lesson.
A father and his young toddler are walking along the sidewalk. For every 3 steps the father takes, the son takes 5 steps just to keep up. What is the ratio of Number of steps the father takes to number of steps the son takes? Add labels to the columns of the table and place the ratio into the first row of data. Add equivalent ratios to build a ratio table.
Number of Steps the Father Takes
Number of Steps the Son Takes
3 5
6 10
9 15
12 20
15 25
18 30
What can you say about the values of the ratios in the table?
The values of the ratios in the table should all be equal since the ratios in the table are equivalent.
Problem Set Sample Solutions The following responses indicate an understanding of the objectives of this lesson.
Context provided will vary. Table values are shown below.
Assume each of the following represents a table of equivalent ratios. Fill in the missing values. Then choose one of the tables and create a real-world context for the ratios shown in the table.
1. 2. 3.
4 11 5 7 3 17
8 22 10 14 6 34
12 33 15 21 9 51
16 44 20 28 12 68
20 55 25 35 15 85
24 66 30 42 18 102

Lesson 10: The Structure of Ratio Tables—Additive and Multiplicative Date: 7/7/13
68
© 2013 Common Core, Inc. Some rights reserved. commoncore.org This work is licensed under a Creative Commons Attribution-NonCommercial-ShareAlike 3.0 Unported License.
NYS COMMON CORE MATHEMATICS CURRICULUM 6•1 Lesson 10
PENDING FINAL EDITORIAL REVIEW
Lesson 10: The Structure of Ratio Tables—Additive and
Multiplicative
Student Outcomes
Students identify both the additive and multiplicative structure of a ratio table and use the structure to make additional entries in the table.
Students use ratio tables to solve problems.
Classwork
Exploratory Challenge (33 minutes)
Imagine that you are making a fruit salad. For every quart of blueberries you add, you would like to put in 3 quarts of strawberries. Create 3 ratio tables that show the amounts of blueberries and strawberries you would use if you needed to make fruit salad for greater numbers of people.
Table 1 should contain amounts where you have added less than 10 quarts of blueberries to the salad.
Table 2 should contain amounts of blueberries between 10 and 30 quarts.
Table 3 should contain amounts of blueberries greater than 100 quarts.
Student answers may vary. Here are possible solutions:
The answers to the questions will depend on the variation of the table that students have created.
1. Describe any patterns you see in the tables. Be specific in your descriptions.
The value in the second column is always three times as much as the values in the first column. In the first table, the first column increases by 1, the second column increases by 3. In the second table, the first column increases by 10 and the second column increased by 30. In the third table, as the first column increased by 100, the second column increased by 300.
Table 1 Quarts of Blueberries Quarts of Strawberries
1 3 2 6 3 9 4 12 5 15
Table 2 Quarts of Blueberries Quarts of Strawberries
10 30 20 60 30 90 40 120 50 150
Table 3 Quarts of Blueberries Quarts of Strawberries
100 300 200 600 300 900 400 1200 500 1500

Lesson 10: The Structure of Ratio Tables—Additive and Multiplicative Date: 7/7/13
69
© 2013 Common Core, Inc. Some rights reserved. commoncore.org This work is licensed under a Creative Commons Attribution-NonCommercial-ShareAlike 3.0 Unported License.
NYS COMMON CORE MATHEMATICS CURRICULUM 6•1 Lesson 10
PENDING FINAL EDITORIAL REVIEW
2. How are the amounts of blueberries and strawberries related to each other?
The amount of strawberries is always three times the amount of blueberries. They could also respond that the ratio of blueberries to strawberries always is equal to 1:3.
3. How are the values in the blueberries column related to each other?
Answers will vary. However, students could use the chart paper and write on the table to see the patterns. Most tables should have addition repeating throughout.
4. How are the values in the strawberries column related to each other?
Answers will vary. However, students could use the chart paper and write on the table to see the patterns. Most tables should have addition repeating throughout.
5. If we know we want to add 7 quarts of blueberries to the fruit salad, how can we use the table to help us determine how many strawberries to add?
We could extend our table until we got to seven in the blueberry column.
6. If we know we used 70 quarts of blueberries to make our salad, how can we use a ratio table to find out how many quarts of strawberries were used?
We could start with 1 and 3 that was given in the description, and then multiply by ten to get 10 and 30. These would be the first points in my table. Then I would count up by tens in the blueberry column and go up by 30s in the strawberries column.
Students create the three ratio tables on the student pages. Have index cards ready that say Table 1, Table 2, Table 3 that you can hand out to students so that students can place that table on chart paper. (15 minutes) After the charts are created, have students focus on how they created the tables and discuss the structure of the table with a partner or small group. After the students have had a chance to work, pull the class together as a whole group for a discussion about how the tables are related and the structure of the tables. Use the questions below to guide the discussion.
How are all three of the tables related?
Each table represents the same ratio of blueberries to strawberries; 1:3.
What operation(s) did you use to get the values for blueberries and strawberries?
Adding or multiplying (Have students elaborate where they used each operation.) How is the amount of strawberries related to the amount of blueberries?
The amount of strawberries is always three times the amount of blueberries or the amount of blueberries is one-third the amount of strawberries. They could also respond that the ratio of blueberries to strawberries is always equal to 1:3.
MP.7

Lesson 10: The Structure of Ratio Tables—Additive and Multiplicative Date: 7/7/13
70
© 2013 Common Core, Inc. Some rights reserved. commoncore.org This work is licensed under a Creative Commons Attribution-NonCommercial-ShareAlike 3.0 Unported License.
NYS COMMON CORE MATHEMATICS CURRICULUM 6•1 Lesson 10
PENDING FINAL EDITORIAL REVIEW Students write directly on the chart paper to check and see if this is true for every entry in each table. Extend this
question to ask them why the rows have the same ratio of blueberries to strawberries (or don’t have the same ratio if a mistake was made) or if the answer makes sense.
How are the amounts of blueberries related to each other in the table?
Answers will vary. Students should notice that there is a pattern in the blueberry column. The paper that each group or students made could be different. So how they created the pattern will vary. However, students could use the chart paper and write on the table to see the patterns. Most tables should have addition repeating throughout.
How are the amounts of strawberries related to each other in the table?
Extend this question to further ask the students how the two patterns are related to each other.
The change in blueberries compared to the change in strawberries is 10 to 30 or 1 to 3, the same ratio we started with.
If we know we want to add 7 quarts of blueberries, how can we use the table to help us get the amount of strawberries needed?
We could extend our table until we got to seven in the blueberry column.
MP.7

Lesson 10: The Structure of Ratio Tables—Additive and Multiplicative Date: 7/7/13
71
© 2013 Common Core, Inc. Some rights reserved. commoncore.org This work is licensed under a Creative Commons Attribution-NonCommercial-ShareAlike 3.0 Unported License.
NYS COMMON CORE MATHEMATICS CURRICULUM 6•1 Lesson 10
PENDING FINAL EDITORIAL REVIEW What if we were making enough fruit salad to serve a large number of people and added 70 quarts of
blueberries? How could we create a table to find the value for strawberries?
We could start with 1 and 3 that was given in the description, and then multiply by ten to get 10 and 30. These would be the first points in my table. Then I would count up by tens in the blueberry column and go up by 30s in the strawberries column.
Exercise 2
Students examine tables that were made incorrectly and make comments on what was done wrong when making the tables. Students also note the ratio that was used to create the ratio table and then create a correct table.
7. The following tables were made incorrectly. Find the mistake that was made, create the correct ratio table and state the ratio that was used to make the correct ratio table.
a.
Hours Pay in dollars
3 24
5 40
7 52
9 72
Ratio 1:8
Solution may vary
b.
Solutions may vary. Possible Answer 1:5
Hours Pay in dollars
3 24
5 40
7 56
9 72
Blue Yellow
1 5
4 8
7 13
10 16
Blue Yellow
1 5
4 20
7 35
10 50
MP.7
Lesson 10: The Structure of Ratio Tables—Additive and Multiplicative Date: 7/7/13
72
© 2013 Common Core, Inc. Some rights reserved. commoncore.org This work is licensed under a Creative Commons Attribution-NonCommercial-ShareAlike 3.0 Unported License.
NYS COMMON CORE MATHEMATICS CURRICULUM 6•1 Lesson 10
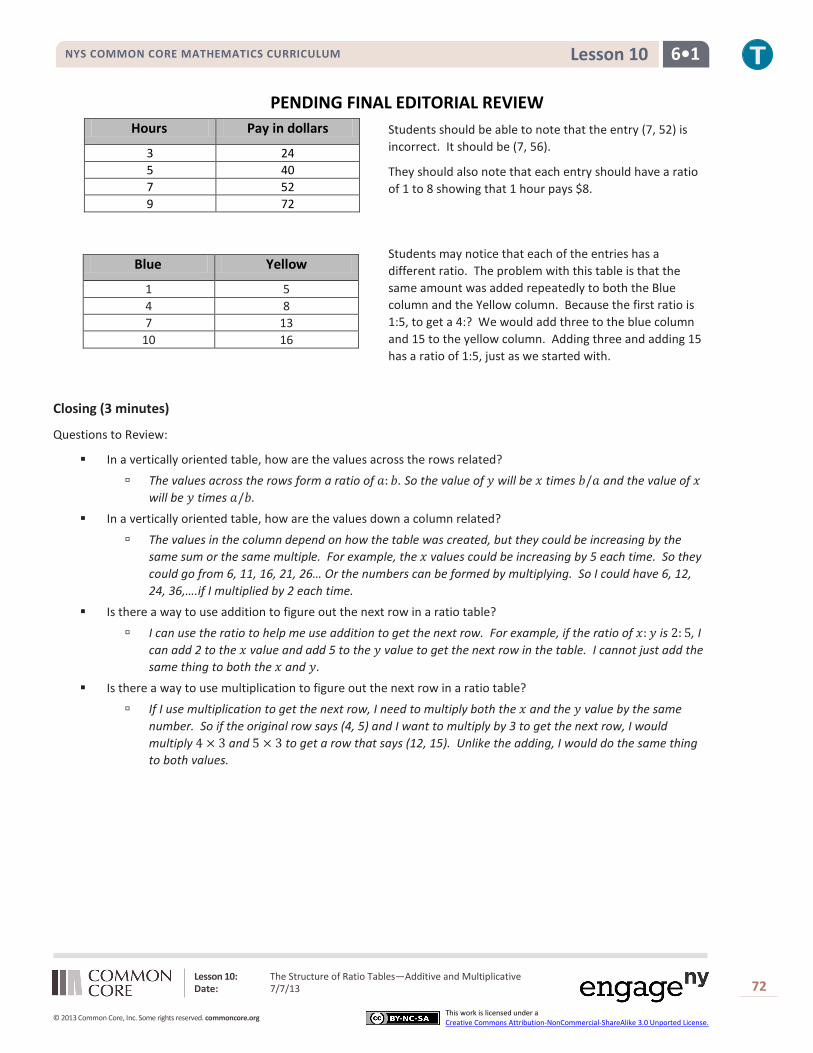
PENDING FINAL EDITORIAL REVIEW Students should be able to note that the entry (7, 52) is
incorrect. It should be (7, 56).
They should also note that each entry should have a ratio of 1 to 8 showing that 1 hour pays $8.
Students may notice that each of the entries has a different ratio. The problem with this table is that the same amount was added repeatedly to both the Blue column and the Yellow column. Because the first ratio is 1:5, to get a 4:? We would add three to the blue column and 15 to the yellow column. Adding three and adding 15 has a ratio of 1:5, just as we started with.
Closing (3 minutes)
Questions to Review:
In a vertically oriented table, how are the values across the rows related?
The values across the rows form a ratio of 𝑎: 𝑏. So the value of 𝑦 will be 𝑥 times 𝑏/𝑎 and the value of 𝑥 will be 𝑦 times 𝑎/𝑏.
In a vertically oriented table, how are the values down a column related?
The values in the column depend on how the table was created, but they could be increasing by the same sum or the same multiple. For example, the 𝑥 values could be increasing by 5 each time. So they could go from 6, 11, 16, 21, 26… Or the numbers can be formed by multiplying. So I could have 6, 12, 24, 36,….if I multiplied by 2 each time.
Is there a way to use addition to figure out the next row in a ratio table?
I can use the ratio to help me use addition to get the next row. For example, if the ratio of 𝑥: 𝑦 is 2: 5, I can add 2 to the 𝑥 value and add 5 to the 𝑦 value to get the next row in the table. I cannot just add the same thing to both the 𝑥 and 𝑦.
Is there a way to use multiplication to figure out the next row in a ratio table?
If I use multiplication to get the next row, I need to multiply both the 𝑥 and the 𝑦 value by the same number. So if the original row says (4, 5) and I want to multiply by 3 to get the next row, I would multiply 4 × 3 and 5 × 3 to get a row that says (12, 15). Unlike the adding, I would do the same thing to both values.
Hours Pay in dollars
3 24 5 40 7 52 9 72
Blue Yellow
1 5 4 8 7 13 10 16
Lesson 10: The Structure of Ratio Tables—Additive and Multiplicative Date: 7/7/13
73
© 2013 Common Core, Inc. Some rights reserved. commoncore.org This work is licensed under a Creative Commons Attribution-NonCommercial-ShareAlike 3.0 Unported License.
NYS COMMON CORE MATHEMATICS CURRICULUM 6•1 Lesson 10
PENDING FINAL EDITORIAL REVIEW
Exit Ticket (5 minutes)
Lesson Summary:
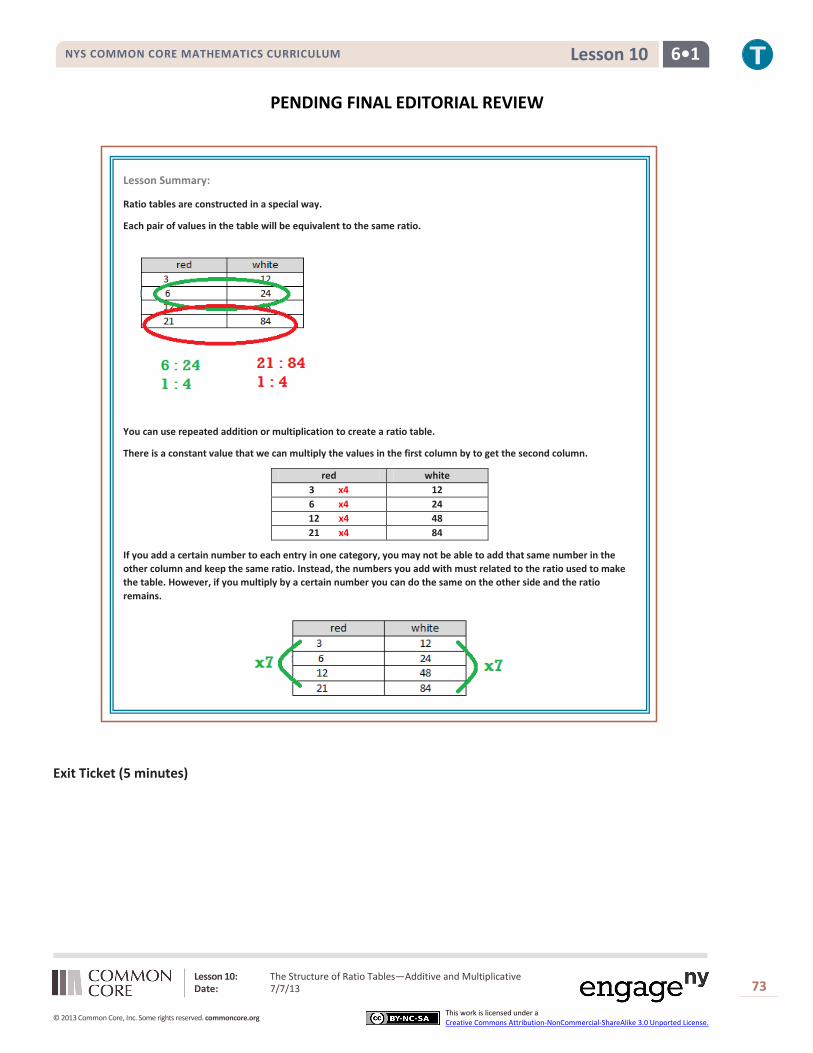
Ratio tables are constructed in a special way.
Each pair of values in the table will be equivalent to the same ratio.
You can use repeated addition or multiplication to create a ratio table.
There is a constant value that we can multiply the values in the first column by to get the second column.
red white 3 x4 12 6 x4 24 12 x4 48 21 x4 84
If you add a certain number to each entry in one category, you may not be able to add that same number in the other column and keep the same ratio. Instead, the numbers you add with must related to the ratio used to make the table. However, if you multiply by a certain number you can do the same on the other side and the ratio remains.

Lesson 10: The Structure of Ratio Tables—Additive and Multiplicative Date: 7/7/13
74
© 2013 Common Core, Inc. Some rights reserved. commoncore.org This work is licensed under a Creative Commons Attribution-NonCommercial-ShareAlike 3.0 Unported License.
NYS COMMON CORE MATHEMATICS CURRICULUM 6•1 Lesson 10
PENDING FINAL EDITORIAL REVIEW Name ___________________________________________________ Date____________________
Lesson 10: The Structure of Ratio Tables—Additive and
Multiplicative
Exit Ticket Show more than one way you could use the structure of the table to find the unknown value. Fill in the unknown values.
Lesson 10: The Structure of Ratio Tables—Additive and Multiplicative Date: 7/7/13
75
© 2013 Common Core, Inc. Some rights reserved. commoncore.org This work is licensed under a Creative Commons Attribution-NonCommercial-ShareAlike 3.0 Unported License.
NYS COMMON CORE MATHEMATICS CURRICULUM 6•1 Lesson 10
PENDING FINAL EDITORIAL REVIEW Exit Ticket Sample Solutions
The following solutions indicate an understanding of the objectives of this lesson:
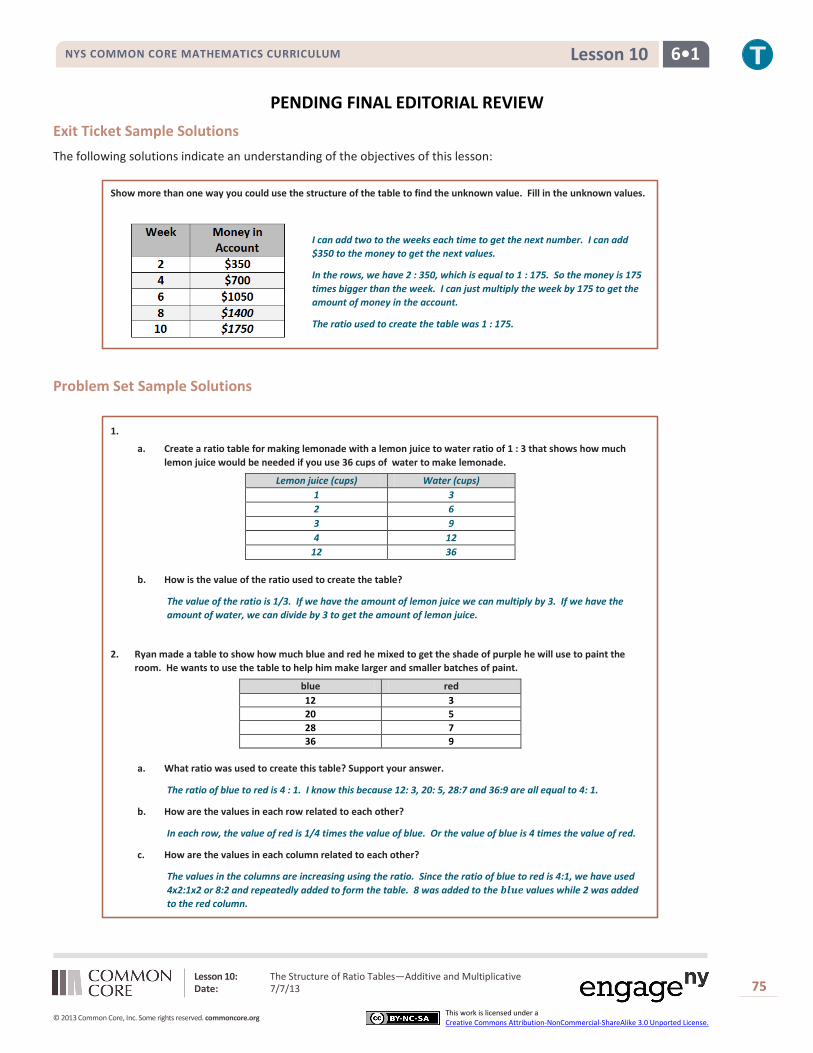
Show more than one way you could use the structure of the table to find the unknown value. Fill in the unknown values.
I can add two to the weeks each time to get the next number. I can add $350 to the money to get the next values.
In the rows, we have 2 : 350, which is equal to 1 : 175. So the money is 175 times bigger than the week. I can just multiply the week by 175 to get the amount of money in the account.
The ratio used to create the table was 1 : 175.
Problem Set Sample Solutions
1.
a. Create a ratio table for making lemonade with a lemon juice to water ratio of 1 : 3 that shows how much lemon juice would be needed if you use 36 cups of water to make lemonade.
Lemon juice (cups) Water (cups) 1 3 2 6 3 9 4 12
12 36
b. How is the value of the ratio used to create the table?
The value of the ratio is 1/3. If we have the amount of lemon juice we can multiply by 3. If we have the amount of water, we can divide by 3 to get the amount of lemon juice.
2. Ryan made a table to show how much blue and red he mixed to get the shade of purple he will use to paint the room. He wants to use the table to help him make larger and smaller batches of paint.
blue red 12 3 20 5 28 7 36 9
a. What ratio was used to create this table? Support your answer.
The ratio of blue to red is 4 : 1. I know this because 12: 3, 20: 5, 28:7 and 36:9 are all equal to 4: 1.
b. How are the values in each row related to each other?
In each row, the value of red is 1/4 times the value of blue. Or the value of blue is 4 times the value of red.
c. How are the values in each column related to each other?
The values in the columns are increasing using the ratio. Since the ratio of blue to red is 4:1, we have used 4x2:1x2 or 8:2 and repeatedly added to form the table. 8 was added to the 𝒃𝒍𝒖𝒆 values while 2 was added to the red column.

Lesson 11: Comparing Ratios Using Ratio Tables Date: 7/8/13
76
© 2013 Common Core, Inc. Some rights reserved. commoncore.org This work is licensed under a Creative Commons Attribution-NonCommercial-ShareAlike 3.0 Unported License.
6•1 Lesson 11 NYS COMMON CORE MATHEMATICS CURRICULUM
PENDING FINAL EDITORIAL REVIEW
Lesson 11: Comparing Ratios Using Ratio Tables
Student Outcomes
Students solve problems by comparing different ratios using two or more ratio tables.
Classwork
Example 1 (10 minutes)
Allow students time to complete the activity. If time permits, allow student volunteers to come to the board and explain their solutions. Students will be asked to complete two questions.
Create 4 equivalent ratios (2 by scaling up and 2 by scaling down) using the ratio 30 to 80.
There are various possible answers.
Some examples of scaling down: 3:8, 6:16, 9:24, 12:32, 15:40, 18: 48, 21:56, 24:64, 27:72
Some examples of scaling up: 60:160, 90:240, 120:320…
Write a ratio to describe the relationship shown in the table.
Hours # of Pizzas Sold 2 16 5 40 6 48
10 80
The ratio used to create the table is 1:8 which means that there are 8 pizzas being sold every hour.
Exercise 1 (10 minutes)
Students work in small groups or with partners for the activity. Show the examples of three students and their texting speeds. Tables are provided in the student handout showing different amounts of words at different times. Display these tables to have a visual representation to use during discussion. Have students discuss possible ways of figuring out who can text the fastest using the tables.
The following tables show how many words each person can text in a given amount of time. Compare the rates for each person using the ratio table.
Michaela
Minutes 3 5 7 9 Words 150 250 350 450

Lesson 11: Comparing Ratios Using Ratio Tables Date: 7/8/13
77
© 2013 Common Core, Inc. Some rights reserved. commoncore.org This work is licensed under a Creative Commons Attribution-NonCommercial-ShareAlike 3.0 Unported License.
6•1 Lesson 11 NYS COMMON CORE MATHEMATICS CURRICULUM
PENDING FINAL EDITORIAL REVIEW Jenna
Maria
While students are discussing the tables, ask:
How can we compare the rates?
Answer will vary. Students should see that comparing the girls’ texting rates using the table can be a struggle because there isn’t a common time for all three.
Even though there isn’t a time that is common to all three tables, it is still possible to use the tables to determine which girl has the greatest texting rate and which has the slowest?
Answers will vary. Sample Response: I could compare the first and third tables at 3 and 9 minutes. They can compare the second and third tables by comparing the words at 6 minutes.
If you used ratios to compare, what do the ratios mean in the context of this problem?
The ratio shows how many words each person can text in one minute. How can we use the ratios to help us compare?
We can find the value of the ratio and then put them in order to see who is faster or slower.
Why can’t I just pick the student that has the largest number of words at the end of the table?
(This question is meant to help students with a common misconception.)
The times (minutes) are not equal in all tables, so the ratio of words to minutes needs to be looked at in order to compare when not comparing the same number of minutes.
If there were a fourth person, Max, who can text 55 words per minute, how could we create a table to show his texting speed? (This question is to help prepare the class for the activity coming up and to review previous knowledge that they learned in earlier lessons.)
The minutes would go up by 1 as the words goes up by 55.
Complete the table so that it shows Max has a texting rate of 55 words per minute.
Max
Minutes 2 4 6 8 Words 90 180 270 360
Minutes 3 6 9 12 Words 120 240 360 480
Minutes 1 2 3 4
Words 55 110 165 220
Lesson 11: Comparing Ratios Using Ratio Tables Date: 7/8/13
78
© 2013 Common Core, Inc. Some rights reserved. commoncore.org This work is licensed under a Creative Commons Attribution-NonCommercial-ShareAlike 3.0 Unported License.
6•1 Lesson 11 NYS COMMON CORE MATHEMATICS CURRICULUM
PENDING FINAL EDITORIAL REVIEW Exercise 2 (10 minutes)
Students work with a partner or a small group. Students follow the set of instructions that leads them through examples and asks them questions to help them dig deeper. The questions ask students to compare the ratio of water to juice for a variety of beverages. Students can also find the value of the ratio in order to determine which juice has a higher water to juice ratio.
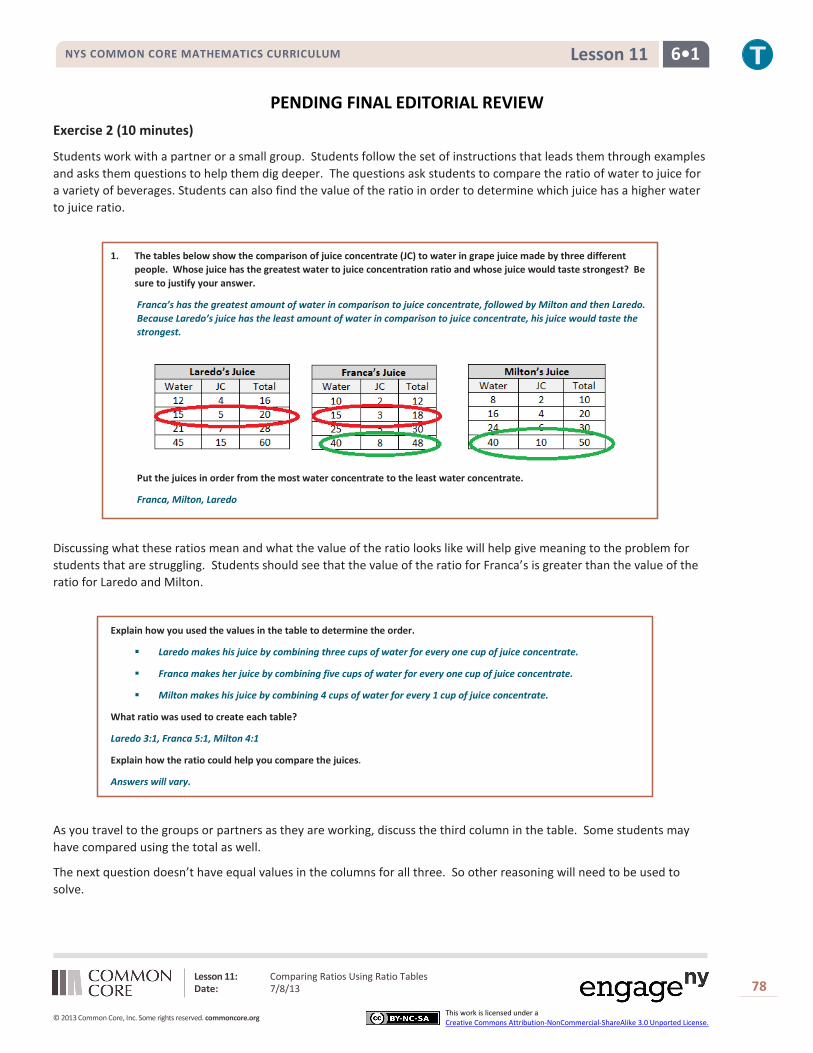
1. The tables below show the comparison of juice concentrate (JC) to water in grape juice made by three different people. Whose juice has the greatest water to juice concentration ratio and whose juice would taste strongest? Be sure to justify your answer.
Franca’s has the greatest amount of water in comparison to juice concentrate, followed by Milton and then Laredo. Because Laredo’s juice has the least amount of water in comparison to juice concentrate, his juice would taste the strongest.
Put the juices in order from the most water concentrate to the least water concentrate.
Franca, Milton, Laredo
Discussing what these ratios mean and what the value of the ratio looks like will help give meaning to the problem for students that are struggling. Students should see that the value of the ratio for Franca’s is greater than the value of the ratio for Laredo and Milton.
Explain how you used the values in the table to determine the order.
Laredo makes his juice by combining three cups of water for every one cup of juice concentrate.
Franca makes her juice by combining five cups of water for every one cup of juice concentrate.
Milton makes his juice by combining 4 cups of water for every 1 cup of juice concentrate.
What ratio was used to create each table?
Laredo 3:1, Franca 5:1, Milton 4:1
Explain how the ratio could help you compare the juices.
Answers will vary.
As you travel to the groups or partners as they are working, discuss the third column in the table. Some students may have compared using the total as well.
The next question doesn’t have equal values in the columns for all three. So other reasoning will need to be used to solve.

Lesson 11: Comparing Ratios Using Ratio Tables Date: 7/8/13
79
© 2013 Common Core, Inc. Some rights reserved. commoncore.org This work is licensed under a Creative Commons Attribution-NonCommercial-ShareAlike 3.0 Unported License.
6•1 Lesson 11 NYS COMMON CORE MATHEMATICS CURRICULUM
PENDING FINAL EDITORIAL REVIEW Laredo’s Juice Franca’s Juice Milton’s Juice
Water JC Total Water JC Total Water JC Total 12 2 14 15 6 21 16 6 22 18 3 21 20 8 28 24 9 33 30 5 35 35 14 49 40 15 55 42 7 49 50 20 70 64 24 88
Students may use the ratios to compare.
Struggling students and even average students may struggle when comparing these ratios. By finding the value of the ratio, it will be easier for students to compare the data. It should be fairly obvious that Laredo has the juice with the most water compared to juice concentrate. If students use the tables to compare Franca’s ratio of juice to water with Milton’s ratio of juice to water, they can look for numbers the columns have in common.
2. The next day, each of the three people made juice again, but this time they were making apple juice. Whose juice has the greatest water to juice concentrate ratio and whose juice would taste the strongest? Be sure to justify your answer.
Put the juices in order from the strongest apple taste to the weakest apple taste.
Laredo, Milton, Franca
Explain how you used the values in the table to determine the order.
Answers will vary.
Using the table, Milton added more water to his juice than Franca. So, the order is Laredo, Milton, Franca.
Students may use the ratios to get equal amounts of water and then compare the juice concentrate or equal amounts of juice concentrate and then compare the water.
5:2 -------- 5x8:2x8 ------- 40:16
8:3 -------- 8x5:3x5 ------- 40:15
Now we can compare and see that Franca’s has more juice concentrate compared to water.
Or students have the option of comparing the value of the ratio to see which value is greater. Then they can compare 15/6 to 16/6 and see that Milton’s value is larger than Franca’s.
MP.7

Lesson 11: Comparing Ratios Using Ratio Tables Date: 7/8/13
80
© 2013 Common Core, Inc. Some rights reserved. commoncore.org This work is licensed under a Creative Commons Attribution-NonCommercial-ShareAlike 3.0 Unported License.
6•1 Lesson 11 NYS COMMON CORE MATHEMATICS CURRICULUM
PENDING FINAL EDITORIAL REVIEW What ratio was used to create each table?
Laredo 6:1 Franca 5:2
Milton 8:3
Explain how the ratio could help you compare the juices.
Answers will vary.
How was this problem different than the grape juice questions?
Answers will vary.
3. Max and Sheila are making orange juice. Max has mixed 15 cups of water with 4 cups of juice concentrate. Sheila has made her juice with 8 cups water with 3 cups of water. Compare the ratios of juice concentrate to water using ratio tables. State which beverage has a higher juice to water ratio.
Max has a higher juice to water ratio because he mixed 12 cups of JC to only 45 cups of water. Sheila’s juice would be more watery because she would have 48 cups of water with the 12 cups of juice.
4. Victor is making recipes for smoothies. His first recipe calls for 2 cups of strawberries and 7 cups of other ingredients. His second recipe says that 3 cups of strawberries are combined with 9 cups of other ingredients. Which smoothie recipe has more strawberries compared to other ingredients? Use ratio tables to justify your answer.
Recipe #2 has more strawberries compared to other ingredients.
Recipe #2 has more strawberries compared to the other ingredients because there when comparing 6 cups of strawberries, there were less other ingredients added in recipe #2.
Struggling students can use the value of the ratio to compare. However, in 3 and 4, struggling students may need to see the comparison of part to whole or get equal amounts of water in 3 and “other” in 4 to make sense of the problem. If students use this comparison, they may want to use multiplication instead of adding to make the table. For example, in 4, they may want to see how many strawberries would be needed when 63 cups of other ingredients are added.
2:7 becomes 18 to 63
3: 9 becomes 21 to 63
This might be an easier way for students to see that there are more strawberries in recipe #2.
While students are working, circulate and ask students to share their solving strategies. It is important to also ask the students to prove their claims. If a student has simply written that Beverage A has a higher amount of water per juice than Beverage B, ask the student to prove or explain how he/she got to the answer. Students share how they have compared the values in the table.
JC 4 8 12 Water 15 30 45
strawberries 2 4 6 other 7 14 21
strawberries 3 6 9 other 9 18 27
JC 3 6 9 12 Water 8 16 24 48
Max Sheila
#1 #2
MP.7

Lesson 11: Comparing Ratios Using Ratio Tables Date: 7/8/13
81
© 2013 Common Core, Inc. Some rights reserved. commoncore.org This work is licensed under a Creative Commons Attribution-NonCommercial-ShareAlike 3.0 Unported License.
6•1 Lesson 11 NYS COMMON CORE MATHEMATICS CURRICULUM
PENDING FINAL EDITORIAL REVIEW Closing (10 minutes)
Today we used ratio tables to compare two ratios that were not equivalent and answer questions about which situation would get to a given level first. Can anyone think of another way to compare two different ratios? The value of a ratio might be useful because then we could talk about which ratio had the larger or
smaller value.
Exit Ticket (5 minutes)
Lesson Summary:
Ratio tables can be used to compare two ratios.
Look for equal amounts in a row or column to compare the second amount associated with it.
3 6 12 30 7 14 28 70
You can also extend the values of the table in order to get comparable amounts. Another method would be to compare the value of the ratios. Write the value of the ratio as a fraction and then use your knowledge of fractions to compare the ratios.
When ratios are given in words, one can create a table of equivalent ratios in order to compare the ratios.
12:35 compared to 8: 20
Quantity 1 12 24 36 48 Quantity 2 35 70 105 140
10 25 30 45 16 40 48 72
Quantity 1 8 56 Quantity 2 20 140
Lesson 11: Comparing Ratios Using Ratio Tables Date: 7/8/13
82
© 2013 Common Core, Inc. Some rights reserved. commoncore.org This work is licensed under a Creative Commons Attribution-NonCommercial-ShareAlike 3.0 Unported License.
6•1 Lesson 11 NYS COMMON CORE MATHEMATICS CURRICULUM
PENDING FINAL EDITORIAL REVIEW Name ___________________________________________________ Date____________________
Lesson 11: Comparing Ratios Using Ratio Tables
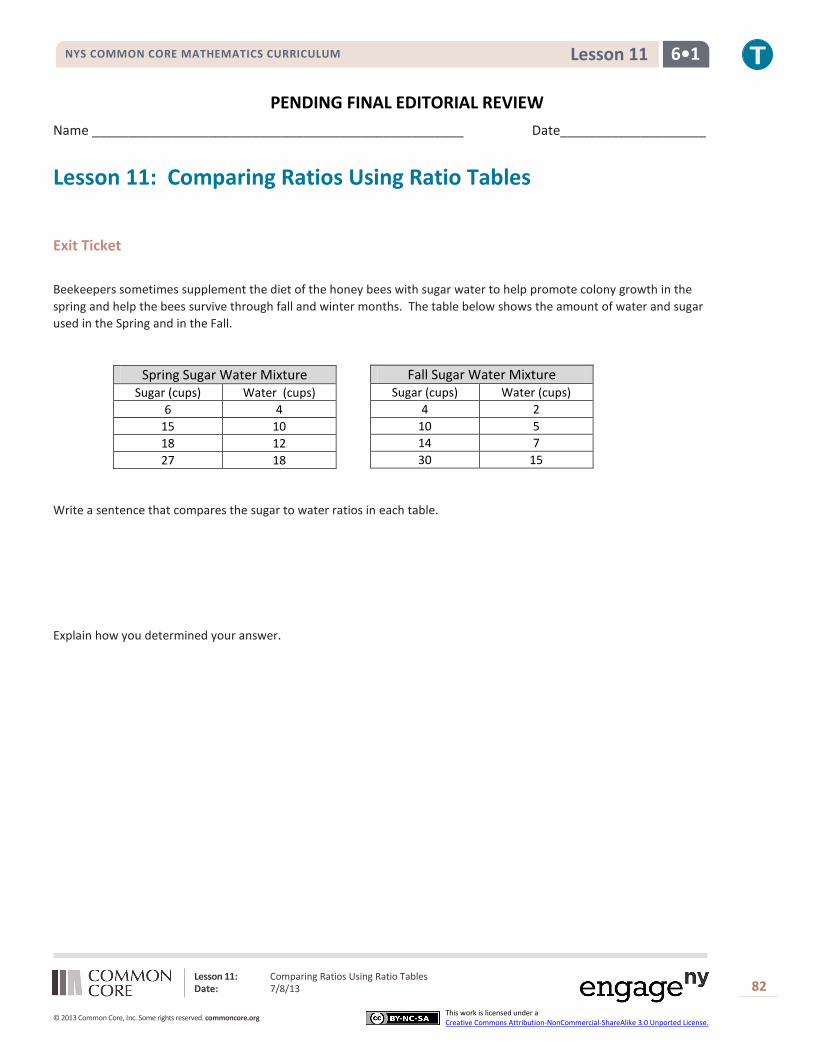
Exit Ticket Beekeepers sometimes supplement the diet of the honey bees with sugar water to help promote colony growth in the spring and help the bees survive through fall and winter months. The table below shows the amount of water and sugar used in the Spring and in the Fall.
Spring Sugar Water Mixture Sugar (cups) Water (cups)
6 4 15 10 18 12 27 18
Write a sentence that compares the sugar to water ratios in each table.
Explain how you determined your answer.
Fall Sugar Water Mixture Sugar (cups) Water (cups)
4 2 10 5 14 7 30 15

Lesson 11: Comparing Ratios Using Ratio Tables Date: 7/8/13
83
© 2013 Common Core, Inc. Some rights reserved. commoncore.org This work is licensed under a Creative Commons Attribution-NonCommercial-ShareAlike 3.0 Unported License.
6•1 Lesson 11 NYS COMMON CORE MATHEMATICS CURRICULUM
PENDING FINAL EDITORIAL REVIEW Exit Ticket Sample Solutions
The following solutions indicate an understanding of the objectives of this lesson:
Beekeepers sometimes supplement the diet of the honey bees with sugar water to help promote colony growth in the spring and help the bees survive through fall and winter months. The table below shows the amount of water and sugar used in the Spring and in the Fall.
Spring Sugar Water Mixture Sugar (cups) Water (cups)
6 4 15 10 18 12 27 18
Write a sentence that compares the sugar to water ratios in each table.
The value of the ratio for the Spring Sugar Water is 1.5/1, while the value of the ratio of the Fall Sugar Water is 2/1. Therefore, the Fall Sugar Water has more sugar mixed in for every cup of water added to the mixture.
Explain how you determined your answer.
Spring 6/4 = 3/2 = 1.5/1
Fall 4/2 = 2/1
Problem Set Sample Solutions
1. Sarah and Evan were swimming. Use the ratio tables below to determine who the faster swimmer is.
Sarah
Evan
Evan is the faster swimmer because she swims 26 meters in 1 minute, which is faster than Sarah who swims 25 meters in 1 minute.
Explain the method that you used to determine your answer.
Answers will vary.
2. A 120 lb. person would weigh about 20 lb. on the moon. A 150 lb. person would weight 28 lb. on Io, a moon of Jupiter. Use ratio tables to see which moon would make a person weigh the most.
Answers will vary. A person on Io will weigh more than a person on our moon.
Time (min) 3 5 12 17 Distance (meters) 75 125 300 425
Time (min) 2 7 10 20 Distance (meters) 52 182 260 520
Fall Sugar Water Mixture Sugar (cups) Water (cups)
4 2 10 5 14 7 30 15

Lesson 12: From Ratio Tables to Double Number Line Diagrams Date: 7/8/13
84
© 2013 Common Core, Inc. Some rights reserved. commoncore.org This work is licensed under a Creative Commons Attribution-NonCommercial-ShareAlike 3.0 Unported License.
NYS COMMON CORE MATHEMATICS CURRICULUM 6•1 Lesson 12
PENDING FINAL EDITORIAL REVIEW
Lesson 12: From Ratio Tables to Double Number Line
Diagrams
Student Outcomes
Students create equivalent ratios using a ratio table and represent these ratios on a double number line diagram.
Students extend and use a double number line diagram to solve ratio problems related to the real world.
Classwork
Exercise 1 (5 minutes)
Recall of prior knowledge—Ratio Tables (See attached ratio cards.)
Each student is given a card with a ratio on it. The students move around the room in search of other students who have ratios that are equivalent to theirs. Students with equivalent ratios will form a group and create a ratio table, which contains all of the equivalent ratios. As students present their ratio tables, the student audience will determine the correctness of the groups’ formations, as well as their table. Circulate the room as a facilitator, guiding students who are having trouble. Collect cards and direct students back to their seats once the groups are completed.
Exercise 2 (7 minutes)
A guided whole group discussion occurs as outlined below. Students are given time to think about and discuss the following questions independently and/or with their peers; and then contribute to the whole group discussion.
The amount of sugary beverages Americans consume is a leading health concern. For a given brand of cola, a 12-ounce serving of soda contains about 40 grams of sugar. Complete the ratio table, using the given ratio to find equivalent ratios.
Answers may vary; but are found by either multiplying or dividing both 12 and 40 by the same number.
Cola (ounces) 6 12 18 Sugar (grams) 20 40 60
For more support:
To provide more information on this topic to support all learners’ needs, refer to Teacher Notes - More Information on Soda and Sugar for video and news-related links.
Scaffolding:
Differentiate the activity by choosing select cards for each student. A ratio of 2:1 may be easier for a struggling learner to conceptualize, while a ratio of 3½ : 2 may be more challenging.
MP.2

Lesson 12: From Ratio Tables to Double Number Line Diagrams Date: 7/8/13
85
© 2013 Common Core, Inc. Some rights reserved. commoncore.org This work is licensed under a Creative Commons Attribution-NonCommercial-ShareAlike 3.0 Unported License.
NYS COMMON CORE MATHEMATICS CURRICULUM 6•1 Lesson 12
PENDING FINAL EDITORIAL REVIEW
Fluency Activity to Reinforce Understanding:
Students can practice skip-counting aloud for each number line, to understand the concept of scale.
Exercise 3 (7 minutes)
A 1-liter bottle of soda contains approximately 34 fluid ounces. How many grams of sugar would be in a 1-liter bottle of the cola? Explain and show how to arrive the solution.
Cola (ounces) 6 12 18 30 36
Sugar (grams) 20 40 60 100 120
Students may use different approaches. Some may decide to extend their tables, but realize that they do not “easily” arrive at 34 for the ounces of cola when finding equivalent ratios. After adequate time, students/groups present their predictions and methods to the class.
When eliciting students’ responses, ask probing questions as the opportunity arises, (i.e.: “So you are telling me that since 34 ounces is between 30 and 36 ounces, the answer will be between 100 and 120 grams of sugar? Is it closer to 100 or 120? How do you know? Will the answer be a whole number? Why or why not? Can you express your answer as a mixed number?”)
What are some of the challenges we face when using a table for this type of problem?
34 is not a multiple of 6; and we are counting by 6’s for the ounces of cola and by 20’s for grams of sugar
Example 1 (9 minutes)
Whole group instruction continues with a teacher-led illustration of using a double number line diagram to arrive at the answer for Example 1. Discussion includes the need for 2 different number lines, since we are comparing ounces and grams, which are not the same units (1 gram is not equivalent to 1 ounce). Students record the following illustration on the double number line reproducible.
What is the scale we are using on each number line? 6 for cola and 20 for sugar
0 6 12 18 24 30 34 36 cola (ounces)
0 20 40 60 80 100 ? 120 sugar (grams)
MP.3
MP.1
MP.5
Lesson 12: From Ratio Tables to Double Number Line Diagrams Date: 7/8/13
86
© 2013 Common Core, Inc. Some rights reserved. commoncore.org This work is licensed under a Creative Commons Attribution-NonCommercial-ShareAlike 3.0 Unported License.
NYS COMMON CORE MATHEMATICS CURRICULUM 6•1 Lesson 12
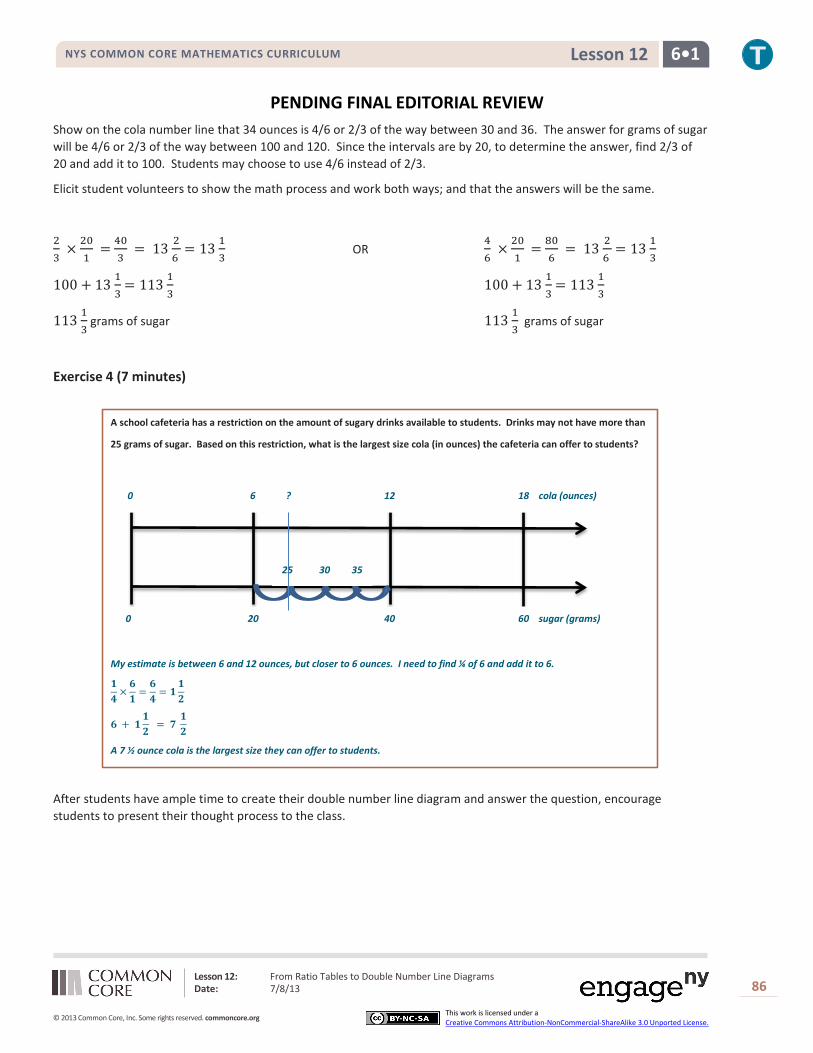
PENDING FINAL EDITORIAL REVIEW Show on the cola number line that 34 ounces is 4/6 or 2/3 of the way between 30 and 36. The answer for grams of sugar
will be 4/6 or 2/3 of the way between 100 and 120. Since the intervals are by 20, to determine the answer, find 2/3 of 20 and add it to 100. Students may choose to use 4/6 instead of 2/3.
Elicit student volunteers to show the math process and work both ways; and that the answers will be the same.
23 ×
201
= 403
= 13 26
= 13 13
OR 46 ×
201
= 806
= 13 26
= 13 13
100 + 13 13 = 113
13
100 + 13 13 = 113
13
113 13
grams of sugar 113 13
grams of sugar
Exercise 4 (7 minutes)
A school cafeteria has a restriction on the amount of sugary drinks available to students. Drinks may not have more than
25 grams of sugar. Based on this restriction, what is the largest size cola (in ounces) the cafeteria can offer to students?
My estimate is between 6 and 12 ounces, but closer to 6 ounces. I need to find ¼ of 6 and add it to 6.
𝟏𝟒
×𝟔𝟏
=𝟔𝟒
= 𝟏𝟏𝟐
𝟔 + 𝟏𝟏𝟐
= 𝟕 𝟏𝟐
A 7 ½ ounce cola is the largest size they can offer to students.
After students have ample time to create their double number line diagram and answer the question, encourage students to present their thought process to the class.
0 6 ? 12 18 cola (ounces)
0 20 40 60 sugar (grams)
25 30 35

Lesson 12: From Ratio Tables to Double Number Line Diagrams Date: 7/8/13
87
© 2013 Common Core, Inc. Some rights reserved. commoncore.org This work is licensed under a Creative Commons Attribution-NonCommercial-ShareAlike 3.0 Unported License.
NYS COMMON CORE MATHEMATICS CURRICULUM 6•1 Lesson 12
PENDING FINAL EDITORIAL REVIEW Exercise 5 (time permitting)
Shontelle solves three math problems in four minutes.
1. Use this information to complete the table below.
2. Shontelle has soccer practice on Thursday evening. She has a half hour before practice to work on her math homework and talk to her friends. She has 20 math skill-work questions for homework, and wants to complete them before talking with her friends. How many minutes will Shontelle have left after completing her math homework to talk to her friends?
Use a double number line diagram to support your answer, and show all work.
Closing (5 minutes)
Have students complete the 3-2-1 Activity. Name 3 different ways you can represent a group of equivalent ratios.
Ratio table, Tape Diagram, Double Number Line Diagrams
Share 2 things you learned about Double Number Line Diagrams.
Tell 1 thing you want to know more about from today’s lesson.
Exit Ticket (5 minutes)
Number of Questions
3 6 9 12 15 18 21 24 27 30
Number of Minutes
4 8 12 16 20 24 28 32 36 40
Step 1: 𝟐/𝟑× 𝟒 = 𝟖/𝟑 = 𝟐 𝟐𝟑
Step 2: 𝟐𝟒 + 𝟐 𝟐𝟑
= 𝟐𝟔 𝟐𝟑
Step 3: 𝟑𝟎 − 𝟐𝟔 𝟐𝟑
= 𝟑 𝟏𝟑
Shontelle can talk to her friends for 𝟑 𝟏𝟑 minutes
Lesson Summary:
Double Number Line Diagram: a tool for understanding the equivalence of two related numbers. It’s called “double” because each mark on the line has two sets of numbers matched to it. The top row of numbers describes the whole represented by the line in one way and the bottom row describes the whole in another way. Because the whole line is the same, it’s possible to see the equivalences between the rows of numbers at any point on the line.

Lesson 12: From Ratio Tables to Double Number Line Diagrams Date: 7/8/13
88
© 2013 Common Core, Inc. Some rights reserved. commoncore.org This work is licensed under a Creative Commons Attribution-NonCommercial-ShareAlike 3.0 Unported License.
NYS COMMON CORE MATHEMATICS CURRICULUM 6•1 Lesson 12
PENDING FINAL EDITORIAL REVIEW Additional Teacher Notes
More Information on Soda and Sugar:
Video: http://www.cnn.com/2013/01/14/health/coke-obesity
Video: http://www.teachertube.com/viewVideo.php?video_id=13788
http://www.sugarstacks.com/beverages.htm
http://www.cdc.gov/features/healthybeverages/

Lesson 12: From Ratio Tables to Double Number Line Diagrams Date: 7/8/13
89
© 2013 Common Core, Inc. Some rights reserved. commoncore.org This work is licensed under a Creative Commons Attribution-NonCommercial-ShareAlike 3.0 Unported License.
NYS COMMON CORE MATHEMATICS CURRICULUM 6•1 Lesson 12
PENDING FINAL EDITORIAL REVIEW Name ___________________________________________________ Date____________________
Lesson 12: From Ratio Tables to Double Number Line Diagrams
Exit Ticket Kyra is participating in a fundraiser Walk-a-Thon. She walks 2 miles in 30 minutes. If she continues to walk at the same rate, determine how many minutes it will take her to walk 7 miles. Use a double number line diagram to support your answer.
Lesson 12: From Ratio Tables to Double Number Line Diagrams Date: 7/8/13
90
© 2013 Common Core, Inc. Some rights reserved. commoncore.org This work is licensed under a Creative Commons Attribution-NonCommercial-ShareAlike 3.0 Unported License.
NYS COMMON CORE MATHEMATICS CURRICULUM 6•1 Lesson 12
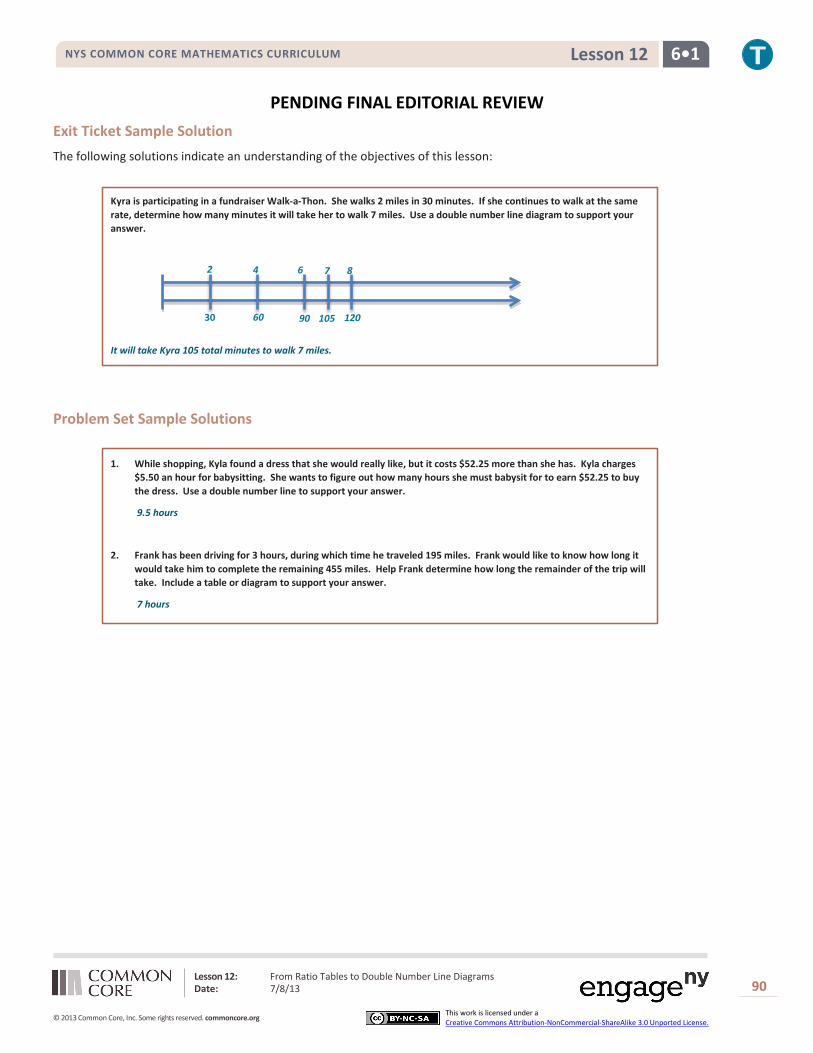
PENDING FINAL EDITORIAL REVIEW Exit Ticket Sample Solution
The following solutions indicate an understanding of the objectives of this lesson:
Kyra is participating in a fundraiser Walk-a-Thon. She walks 2 miles in 30 minutes. If she continues to walk at the same rate, determine how many minutes it will take her to walk 7 miles. Use a double number line diagram to support your answer.
It will take Kyra 105 total minutes to walk 7 miles.
Problem Set Sample Solutions
1. While shopping, Kyla found a dress that she would really like, but it costs $52.25 more than she has. Kyla charges $5.50 an hour for babysitting. She wants to figure out how many hours she must babysit for to earn $52.25 to buy the dress. Use a double number line to support your answer.
9.5 hours
2. Frank has been driving for 3 hours, during which time he traveled 195 miles. Frank would like to know how long it
would take him to complete the remaining 455 miles. Help Frank determine how long the remainder of the trip will take. Include a table or diagram to support your answer.
7 hours
2 4 6 7 8
30 60 90 105 120

Lesson 12: From Ratio Tables to Double Number Line Diagrams Date: 7/8/13
91
© 2013 Common Core, Inc. Some rights reserved. commoncore.org This work is licensed under a Creative Commons Attribution-NonCommercial-ShareAlike 3.0 Unported License.
NYS COMMON CORE MATHEMATICS CURRICULUM 6•1 Lesson 12
PENDING FINAL EDITORIAL REVIEW
7 to 4 28 : 16 3½ to 2 35 : 20
3 to 8 30 : 80 6 to 16 12 : 32
5 to 1 45 : 9 15 to 3 2½ to ½

Lesson 12: From Ratio Tables to Double Number Line Diagrams Date: 7/8/13
92
© 2013 Common Core, Inc. Some rights reserved. commoncore.org This work is licensed under a Creative Commons Attribution-NonCommercial-ShareAlike 3.0 Unported License.
NYS COMMON CORE MATHEMATICS CURRICULUM 6•1 Lesson 12
PENDING FINAL EDITORIAL REVIEW
3 to 4 9 : 16 1½ to 2 15 : 20
3 to 6 30 : 60 1 to 2 4 : 8
2 to 1 44 : 22 18 : 9 1 to ½

Lesson 12: From Ratio Tables to Double Number Line Diagrams Date: 7/8/13
93
© 2013 Common Core, Inc. Some rights reserved. commoncore.org This work is licensed under a Creative Commons Attribution-NonCommercial-ShareAlike 3.0 Unported License.
NYS COMMON CORE MATHEMATICS CURRICULUM 6•1 Lesson 12
PENDING FINAL EDITORIAL REVIEW
1 to 6 8: 48 6 to 36 5 : 30
9 to 4 36 : 16 3 to 43 18 : 8
7 to 6 42 : 36 21 to 8 3½ to 3
Lesson 12: From Ratio Tables to Double Number Line Diagrams Date: 7/8/13
94
© 2013 Common Core, Inc. Some rights reserved. commoncore.org This work is licensed under a Creative Commons Attribution-NonCommercial-ShareAlike 3.0 Unported License.
NYS COMMON CORE MATHEMATICS CURRICULUM 6•1 Lesson 12
PENDING FINAL EDITORIAL REVIEW
Double Number Line Reproducible
Lesson 13: From Ratio Tables to Equations Using the Value of a Ratio Date: 7/8/13
95
© 2013 Common Core, Inc. Some rights reserved. commoncore.org This work is licensed under a Creative Commons Attribution-NonCommercial-ShareAlike 3.0 Unported License.
NYS COMMON CORE MATHEMATICS CURRICULUM 6•1 Lesson 13
PENDING FINAL EDITORIAL REVIEW
Lesson 13: From Ratio Tables to Equations Using the Value
of a Ratio
Student Outcomes
Students restate a ratio in terms of its value; e.g. if the ratio of length 𝐴 to length 𝐵 is 3:5 (in the same units), students state that: “length 𝐴 is 3/5 of length 𝐵” and “length 𝐵 is 5/3 of length 𝐴”, and “ length 𝐴 is 3/8 of the total length” and “length 𝐵 is 5/8 of the total length”
Students use the value of the ratio to problem-solve by writing and solving equations.
Classwork (35 minutes)
Exercise 1
Each student is given a pre-made Unifix cube model consisting of 1 red and 3 yellow cubes to be used as a model for the scenario below.
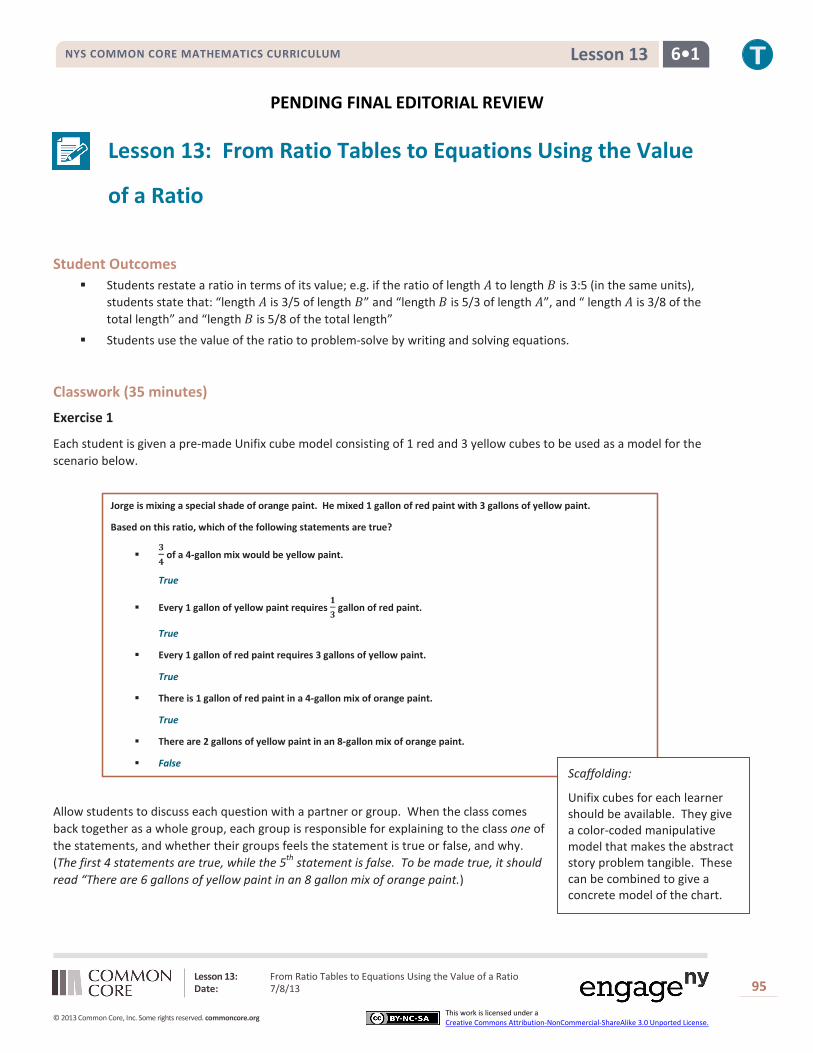
Jorge is mixing a special shade of orange paint. He mixed 1 gallon of red paint with 3 gallons of yellow paint.
Based on this ratio, which of the following statements are true?
𝟑𝟒
of a 4-gallon mix would be yellow paint.
True
Every 1 gallon of yellow paint requires 𝟏𝟑
gallon of red paint.
True
Every 1 gallon of red paint requires 3 gallons of yellow paint.
True
There is 1 gallon of red paint in a 4-gallon mix of orange paint.
True
There are 2 gallons of yellow paint in an 8-gallon mix of orange paint.
False
Allow students to discuss each question with a partner or group. When the class comes back together as a whole group, each group is responsible for explaining to the class one of the statements, and whether their groups feels the statement is true or false, and why. (The first 4 statements are true, while the 5th statement is false. To be made true, it should read “There are 6 gallons of yellow paint in an 8 gallon mix of orange paint.)
Scaffolding:
Unifix cubes for each learner should be available. They give a color-coded manipulative model that makes the abstract story problem tangible. These can be combined to give a concrete model of the chart.

Lesson 13: From Ratio Tables to Equations Using the Value of a Ratio Date: 7/8/13
96
© 2013 Common Core, Inc. Some rights reserved. commoncore.org This work is licensed under a Creative Commons Attribution-NonCommercial-ShareAlike 3.0 Unported License.
NYS COMMON CORE MATHEMATICS CURRICULUM 6•1 Lesson 13
PENDING FINAL EDITORIAL REVIEW Exercise 2
Based on the information on red and yellow paint given in the warm up, complete the table below.
Students should be encouraged to combine their Unifix cubes with those of a partner to model the ratio given in the second row of the table. Find a third partner for the third row, etc.
Facilitate and lead the discussion (if necessary) to point out that we can extend the table to show total gallons:
Red Paint (R) Yellow Paint (Y) Relationship 1 3 3 = 1 x 3 2 6 6 = 2 x 3 3 9 9 = 3 x 3 4 12 12 = 4 x 3 5 15 15 = 5 x 3
Use the table to identify the relationship between two quantities as an intermediate step in creating an equation that models that relationship.
Here is a possible conversation that could be used to help the students see the relationships:
What information is given in the table?
The number of gallons of red paint and yellow paint.
In what context would someone use this information? Anyone who had a need to paint a surface and also had to mix their own paint, such as a paint
contractor who prefers to mix custom colors for high-end clients.
We need to interpret what this table means. If I use 5 gallons of red, how many gallons of yellow would I need?
15 gallons How is the amount of yellow paint related to the amount of red paint?
Yellow paint is always 3 times as much as red paint.
Is that true for all of the entries?
Yes
Red Paint (R) Yellow Paint (Y)
1 3
2 6
3 9
4 12
5 15
MP.7

Lesson 13: From Ratio Tables to Equations Using the Value of a Ratio Date: 7/8/13
97
© 2013 Common Core, Inc. Some rights reserved. commoncore.org This work is licensed under a Creative Commons Attribution-NonCommercial-ShareAlike 3.0 Unported License.
NYS COMMON CORE MATHEMATICS CURRICULUM 6•1 Lesson 13
PENDING FINAL EDITORIAL REVIEW Now imagine that we want to make orange paint to cover an entire wing of our school and we had 100 gallons
of red paint. How could we figure out how many gallons of yellow paint to use?”
We could multiply 100 by 3.
Now we want to write this as an equation. You have told me that I can take all the values in the first column and multiply by three to get the second column. When we were given 4 gallons of red paint, we knew we would need 3 ∙ 4 gallons of yellow paint. What if we were given R gallons of red paint, how many gallons of yellow paint would we need? So Y, the number of gallons of yellow paint, would equal…?
12
How would we write this equation?
𝑌 = 3𝑅 (To get to these steps, students might need a little guidance. Help by pointing out the variables given in the table and ask them to write what 𝑅 must be multiplied by to get 𝑌.)
We were trying to find out how much yellow paint we needed given the amount of red paint. Is the formula related to the value of the ratio yellow paint to red paint?
The ratio of yellow paint to red paint is 3:1; the value of the ratio is 31
.
What if we wanted an equation to tell us how much red paint to use if we are given the amount of yellow paint? How do we change the value of yellow paint to get the amount of red paint?
Divide by three or multiply by 13
What is the ratio for red paint to yellow paint?
1:3 or 1 to 3, the value of the ratio is 13
How can I use this to get the equation?
We would take the 𝑦 value and divide by three or in other words, I am multiplying by 13
. So the equation
would be 𝑅 = 13
𝑌.
Some suggestions for discussion questions:
In this case the ratio of gallons of red paint to gallons of yellow paint was 1:3. What if the ratio were changed to 1:4? What would this mean in the context of our paint problem?
We would use one gallon of red paint for every four gallons of yellow paint.
Can we still use the equation we created earlier? What would the new equation be?
No. The new equation would be 𝑌 = 4 ∙ 𝑅
How can we use the ratio to write the equation? There will be 4 times as much yellow as there is red. The 4 tells us what to multiply the number of red
gallons by to find the number of yellow gallons.
What if the ratio were 1:7? 𝑌 = 7 ∙ 𝑅
Scaffolding:
The connection to the multiplication table should be elicited: rows 1 and 3 show the relationship in this ratio. Students might also find that equivalent fractions can be seen this way.
MP.2

Lesson 13: From Ratio Tables to Equations Using the Value of a Ratio Date: 7/8/13
98
© 2013 Common Core, Inc. Some rights reserved. commoncore.org This work is licensed under a Creative Commons Attribution-NonCommercial-ShareAlike 3.0 Unported License.
NYS COMMON CORE MATHEMATICS CURRICULUM 6•1 Lesson 13
PENDING FINAL EDITORIAL REVIEW
Scaffolding:
The connection to the multiplication table should be elicited: columns 1 and 4 show the relationship in this ratio.
Exercise 3
Students can try the first question on their own or you can discuss if you feel students need further instructions with the concept. Otherwise, students start the practice set on their own, in partners, or in small groups.
Jorge now plans to mix red paint and blue paint to create purple paint. The color of purple he has decided to make combines red paint and blue paint in the ratio 4:1. If Jorge can only purchase paint in one gallon containers, construct a ratio table for all possible combinations for red and blue paint that will give Jorge no more than 25 gallons of purple paint.
Write an equation that will let Jorge calculate the amount of red paint he will need for any given amount of blue paint.
Write an equation that will let Jorge calculate the amount of blue paint he will need for any given amount of red paint.
If Jorge has 24 quarts of red paint, how much blue paint will he have to use to create the desired color of purple?
If Jorge has 24 quarts of blue paint, how much red paint will he have to use to create the desired color of purple?
Allow students to make a table or drawing.
Remember that we sometimes use variables to represent numbers. Let’s use B and R for blue and red, respectively.
No matter how much blue I use, I need 4 times as much red. So for one gallon of blue, I need (1x4) 4 gallons of red. That is a ratio of 1:4. The value of the ratio is.
Where do we see the ratio in the equation?
The four in front of the B tells us the value of the ratio.
R = 4B
Continue to allow students time to work on the remainder of the problems. As you are working with the students be sure to remind them of the value of the ratio and how it is used to make the equation.
Blue (B) Red (R) Relationship 1 4 4 = 1 x 4 2 8 8 = 2 x 4 3 12 12 = 3 x 4 4 16 16 = 4 x 4 5 20 20 = 5 x 4
MP.5

Lesson 13: From Ratio Tables to Equations Using the Value of a Ratio Date: 7/8/13
99
© 2013 Common Core, Inc. Some rights reserved. commoncore.org This work is licensed under a Creative Commons Attribution-NonCommercial-ShareAlike 3.0 Unported License.
NYS COMMON CORE MATHEMATICS CURRICULUM 6•1 Lesson 13
PENDING FINAL EDITORIAL REVIEW
Scaffolding:
The connection to the multiplication table should be elicited: columns 1 and 6 show the relationship in this ratio.
1. Using the same relationship of red to blue from above, create a table that models the relationship of the three colors, blue, red and purple (total) paint. Let B represent the number of gallons of blue paint, let 𝑹 represent the number of gallons of red paint, and let 𝑻 represent the total number of gallons of (purple) paint. Then write an equation that also models this relationship and answer the questions.
Equation: 𝑻 = 𝟓𝑩
Value of the ratio of Total paint to Blue paint: 5/1
How is the value of the ratio related to the equation?
The value of the ratio is used to determine the total paint value by multiplying it with the blue paint value.
2. During a particular U.S. Air Force training exercise, the ratio of men to women was 6:1. Use the ratio table provided
below to create at least two equations that model the relationship between the number of men and the number of woman participating in this training exercise.
If 200 women participated in the training exercise, use one of your equations to calculate the number of men who participated.
I can substitute 200 for the value of women and multiply by the 6, the value of the ratio, to get the number of men. There would be 1200 men.
3. Malia is on a road trip. During the first five minutes of Malia’s trip she sees 18 cars and 6 trucks. Complete the ratio
table using this comparison. Let T represent the number of trucks and let C represent the number of cars.
What is the value of the ratio of cars to trucks?
3/1
What equation would model the relationship between cars and trucks?
𝑪 = 𝟑𝑻 and 𝑻 = �𝟏𝟑� 𝑪
At the end of the trip Malia had counted 1254 trucks. How many cars did she see?
𝑪 = 𝟏𝟐𝟓𝟒 ∙ 𝟑
𝑪 = 𝟑𝟕𝟔𝟐 cars
Blue (B) Red (R) Total Paint (T) 1 4 5 2 8 10 3 12 15 4 16 20 5 20 25
Women (W) Men (M)
1 6
2 12
3 18
4 24
5 30
Trucks (T) Cars (C)
1 3
3 9
6 18
12 36
20 60
Equations:
M = 6W
W = (1/6)M
M/W = 6
W/M = 1/6

Lesson 13: From Ratio Tables to Equations Using the Value of a Ratio Date: 7/8/13
100
© 2013 Common Core, Inc. Some rights reserved. commoncore.org This work is licensed under a Creative Commons Attribution-NonCommercial-ShareAlike 3.0 Unported License.
NYS COMMON CORE MATHEMATICS CURRICULUM 6•1 Lesson 13
PENDING FINAL EDITORIAL REVIEW 4. Kevin is training to run a half-marathon. His training program recommends that he follows the pattern: run for 5
minutes and walk for 1 minute. Let R represent the number of minutes running and let W represent the minutes walking.
What is the value of the ratio of walking to running?
1/5
What equation could you use to calculate the minutes spent walking if you know the minutes spent running?
𝑾 = 𝟏𝟓𝑹
Closing (5 minutes)
Have students explain the relationship between the ratio and the equation. They can include examples, tables, equations or any representation they need to in order to justify their reasoning.
Exit Ticket (5 minutes)
Minutes running (R) 5 10 20 40 50 Minutes walking (W) 1 2 4 8 10
MP.5
Lesson Summary:
The value of a ratio can be determined using a ratio table. This value can be used to write an equation that also represents the ratio.
Example:
1 4
2 8
3 12
4 16
The multiplication table can be a valuable resource to use in seeing ratios. Different rows can be used to find equivalent ratios.
Lesson 13: From Ratio Tables to Equations Using the Value of a Ratio Date: 7/8/13
101
© 2013 Common Core, Inc. Some rights reserved. commoncore.org This work is licensed under a Creative Commons Attribution-NonCommercial-ShareAlike 3.0 Unported License.
NYS COMMON CORE MATHEMATICS CURRICULUM 6•1 Lesson 13
PENDING FINAL EDITORIAL REVIEW Name ___________________________________________________ Date____________________
Lesson 13: From Ratio Tables to Equations Using the Value of a
Ratio
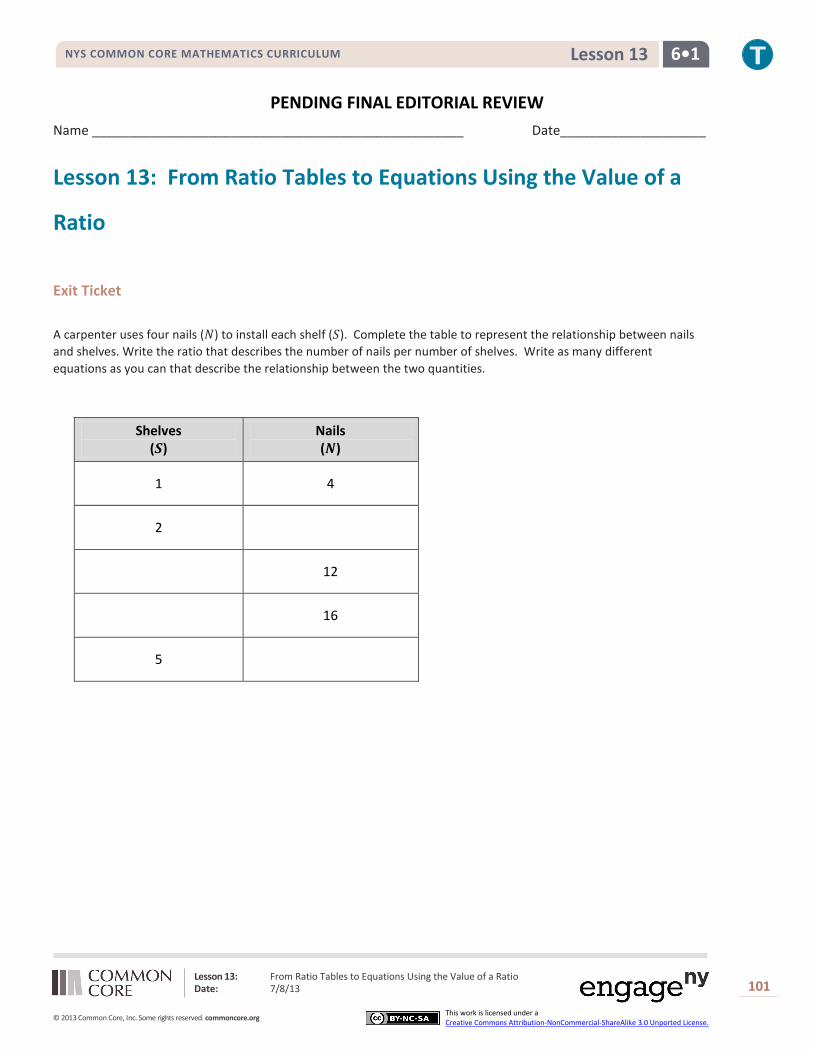
Exit Ticket A carpenter uses four nails (𝑁) to install each shelf (𝑆). Complete the table to represent the relationship between nails and shelves. Write the ratio that describes the number of nails per number of shelves. Write as many different equations as you can that describe the relationship between the two quantities.
Shelves (𝑺)
Nails (𝑵)
1 4
2
12
16
5

Lesson 13: From Ratio Tables to Equations Using the Value of a Ratio Date: 7/8/13
102
© 2013 Common Core, Inc. Some rights reserved. commoncore.org This work is licensed under a Creative Commons Attribution-NonCommercial-ShareAlike 3.0 Unported License.
NYS COMMON CORE MATHEMATICS CURRICULUM 6•1 Lesson 13
PENDING FINAL EDITORIAL REVIEW Exit Ticket Sample Solutions
The following solutions indicate an understanding of the objectives of this lesson:
A carpenter uses four nails (𝑵) to install each shelf (𝑺). Complete the table to represent the relationship between nails and shelves. Write the ratio that describes the number of nails per number of shelves. Write as many different equations as you can that describe the relationship between the two quantities.
�𝑵𝑺� = �𝟒
𝟏�
Equations:
𝑵 = 𝟒𝑺
𝑺 = �𝟏𝟒�𝑵
Problem Set Sample Solutions
1. Write the value of the ratio of white sugar to brown sugar.
1/3
Write an equation that shows the relationship of white sugar to brown sugar.
𝑩 = 𝟑𝑾
Explain how the value of the ratio can be seen in the table.
The values in the first column show the values in the ratio. Brown: White is 3:1 or 3/1
Explain how the value of the ratio can be seen in the equation.
The brown sugar is represented as B in the equation. The white sugar is represented as 𝑾. The value is represented because the brown sugar is three times as much as the white sugar, or 𝑩 = 𝟑𝑾.
2. Write the value of the ratio of total sugar to white sugar.
4/1
Write an equation that shows the relationship of total sugar to white sugar.
𝑻 = 𝟒𝑾
Shelves (𝑺)
Nails (𝑵)
1 4 2 8 3 12 4 16 5 20

Lesson 14: From Ratio Tables, Equations, and Double Number Line Diagrams to Plots on the Coordinate Plane
Date: 7/8/13
103
© 2013 Common Core, Inc. Some rights reserved. commoncore.org This work is licensed under a Creative Commons Attribution-NonCommercial-ShareAlike 3.0 Unported License.
NYS COMMON CORE MATHEMATICS CURRICULUM 6•1 Lesson 14
PENDING FINAL EDITORIAL REVIEW
Lesson 14: From Ratio Tables, Equations, and Double
Number Line Diagrams to Plots on the Coordinate Plane
Student Outcomes
Students associate with each ratio 𝐴:𝐵 the ordered pair (𝐴, 𝐵) and plot it in the 𝑥-𝑦 coordinate plane. Students represent ratios in ratio tables, equations and double number line diagrams, then represent those
ratios in the coordinate plane.
Classwork Representing Ratios: Students work together in predetermined groups to complete the table to satisfy the missing values, create a double line diagram to support the values, and develop an equation to support the values using knowledge from previous lessons in this module. Pose the following scenario:
Kelli is traveling by train with her soccer team from Yonkers, NY to Morgantown, WV for a tournament. The distance between Yonkers and Morgantown is 400 miles. The total trip will take 8 hours. The train schedule is provided below:
Leaving Yonkers, New York Destination Distance
Allentown, PA 100 miles
Carlisle, PA 200 miles
Berkeley Springs, WV
300 miles
Morgantown, WV
400 miles
Leaving Morgantown, WV Destination Distance
Berkeley Springs, WV
100 miles
Carlisle, PA 200 miles
Allentown, PA 300 miles
Yonkers, NY 400 miles

Lesson 14: From Ratio Tables, Equations, and Double Number Line Diagrams to Plots on the Coordinate Plane
Date: 7/8/13
104
© 2013 Common Core, Inc. Some rights reserved. commoncore.org This work is licensed under a Creative Commons Attribution-NonCommercial-ShareAlike 3.0 Unported License.
NYS COMMON CORE MATHEMATICS CURRICULUM 6•1 Lesson 14
PENDING FINAL EDITORIAL REVIEW Exercise 1 (10 minutes)
Create a table to show the time it will take Kelli and her team to travel from Yonkers to each town listed in the schedule assuming that the ratio of time traveled to distance traveled is the same for each city. Then, extend the table to include the cumulative time it will take to reach each destination on the ride home.
Hours Miles
2 100
4 200
6 300
8 400
10 500
12 600
14 700
16 800
Exercise 2 (5 minutes)
Create a double number line to show the time it will take Kelli and her team to travel from Yonkers to each town listed in the schedule. Then, extend the double number line to include the cumulative time it will take to reach each destination on the ride home. Represent the ratio of distance traveled on the round-trip to the amount of time taken with an equation.
Using the information from the double number line, how many miles would be traveled in one hour?
50
How do you know?
If the train is moving at a constant speed, half of 2 is 1, and half of 100 is 50.
hours
miles
100 200 300 500 400 600 700 800
2 4 6 8 10 12 14 16 0
0

Lesson 14: From Ratio Tables, Equations, and Double Number Line Diagrams to Plots on the Coordinate Plane
Date: 7/8/13
105
© 2013 Common Core, Inc. Some rights reserved. commoncore.org This work is licensed under a Creative Commons Attribution-NonCommercial-ShareAlike 3.0 Unported License.
NYS COMMON CORE MATHEMATICS CURRICULUM 6•1 Lesson 14
PENDING FINAL EDITORIAL REVIEW Example 1 (25 minutes)
Dinner service starts once the train is 250 miles away from Yonkers. What is the minimum time the team will have to wait before they can have their meal?
Discussion
Elicit prior knowledge of the coordinate plane from fifth grade, where students plotted points using order pairs of numbers identified as coordinates, identified 𝑥- and 𝑦-axes, and determined how to travel along the axes based upon the ordered pairs.
Display the completed table and coordinate plane below. Should materials be available, students can use sticky dots to aid in plotting points on large gridded chart paper.
Have students determine the following through questioning and discussion:
We use the horizontal and vertical axis to measure quantities.
In most cases, time is what is placed on the horizontal axis. How should we label this axis?
Hours, then Label
Which quantity will we measure using the vertical axis, time or distance?
Distance
How should we label this axis? Miles, then Label
Let’s create the intervals for the 𝑥-axis. The data is increasing by two each time, but there is enough room to count by 1 for each interval.
Hours Miles Ordered
Pairs
2 100 (2, 100)
4 200 (4, 200)
6 300 (6, 300)
8 400 (8, 400)
10 500 (10, 500)
12 600 (12, 600)
14 700 (14, 700)
16 800 (16, 800)
Time and Distance of Travel

Lesson 14: From Ratio Tables, Equations, and Double Number Line Diagrams to Plots on the Coordinate Plane
Date: 7/8/13
106
© 2013 Common Core, Inc. Some rights reserved. commoncore.org This work is licensed under a Creative Commons Attribution-NonCommercial-ShareAlike 3.0 Unported License.
NYS COMMON CORE MATHEMATICS CURRICULUM 6•1 Lesson 14
PENDING FINAL EDITORIAL REVIEW Create the intervals on the 𝑥-axis.
Now, let’s look at the intervals for the 𝑦-axis. The data is increasing by 100, so we will use 100 as the interval on the 𝑦-axis.
Create the intervals on the 𝑦-axis.
How can I show the relationship between hours to distance on the coordinate plane? Travel first from the origin using the 𝑥-coordinate (the hours). Next, travel from the 𝑥-coordinate up
the 𝑦-axis the value of the 𝑦-coordinate (miles).
Guide students through the following activity to ensure students understand that an ordered pair can be graphed on a plane, and that they understand how far the train traveled during a given time period, and vice versa.
Have students locate the ordered pair (4, 600) on the coordinate plane.
What does this point represent in the context of distance and time?
The train traveled 600 miles in 4 hours.
Have students locate the ordered pair (7, 500) on the coordinate plane.
How far did the train travel in 7 hours?
The train traveled 500 miles in 7 hours.
Have students locate the ordered pair (15, 750) on the coordinate plane.
How many hours does it take the train to travel 750 miles?
The train has traveled 750 miles in 15 hours.
Elicit student responses to create and then place the ordered pairs from the table on the coordinate plane. Allow students to individually model placement of ordered pairs on the coordinate plane, coming to the instructional area and explaining in detail the reasoning behind their placement of the point.
What do you notice about the arrangement of the points on the coordinate plane?
They appear to be in a line.
Model how to connect the ordered pairs to the origin with a line and arrow.
What do you think having an ordered pair of (0,0) means, since we drew the line to the origin?
Zero hours after the trip began the train has traveled zero miles. Using this graph, we can determine how many hours the team will have to wait before being served dinner.
What information do we know?
Dinner is served at mile 250.
Where can we find 250 miles on our graph?
Students take time to think, share their thoughts with a partner, and one pair shares with class, coming to the instructional area.
Model how to draw a vertical line from 100 miles to the line representing the relationship between hours and miles.
If I draw a vertical line down, at what hour will I intersect the x-axis?
2 hours
What do you notice? It takes 2 hours to travel 100 miles
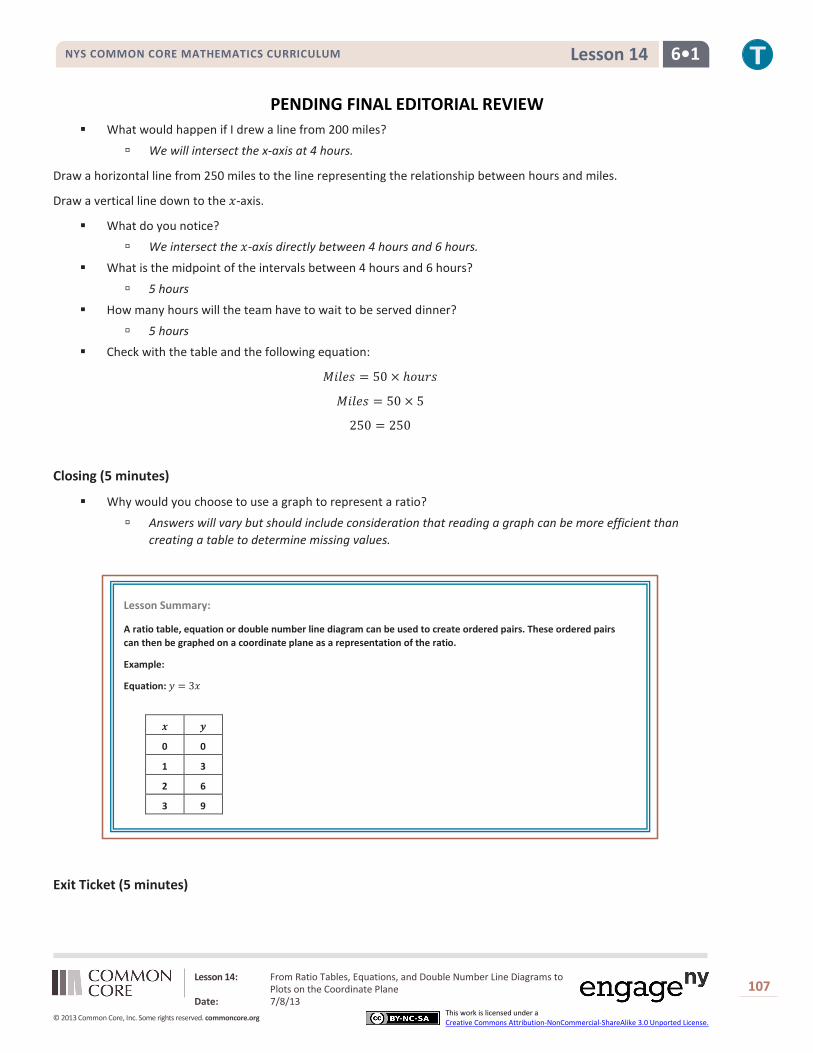
Lesson 14: From Ratio Tables, Equations, and Double Number Line Diagrams to Plots on the Coordinate Plane
Date: 7/8/13
107
© 2013 Common Core, Inc. Some rights reserved. commoncore.org This work is licensed under a Creative Commons Attribution-NonCommercial-ShareAlike 3.0 Unported License.
NYS COMMON CORE MATHEMATICS CURRICULUM 6•1 Lesson 14
PENDING FINAL EDITORIAL REVIEW
Lesson Summary:
A ratio table, equation or double number line diagram can be used to create ordered pairs. These ordered pairs can then be graphed on a coordinate plane as a representation of the ratio.
Example:
Equation: 𝑦 = 3𝑥
𝒙 𝒚
0 0
1 3
2 6
3 9
What would happen if I drew a line from 200 miles?
We will intersect the x-axis at 4 hours.
Draw a horizontal line from 250 miles to the line representing the relationship between hours and miles.
Draw a vertical line down to the 𝑥-axis.
What do you notice? We intersect the 𝑥-axis directly between 4 hours and 6 hours.
What is the midpoint of the intervals between 4 hours and 6 hours?
5 hours
How many hours will the team have to wait to be served dinner?
5 hours Check with the table and the following equation:
𝑀𝑖𝑙𝑒𝑠 = 50 × ℎ𝑜𝑢𝑟𝑠
𝑀𝑖𝑙𝑒𝑠 = 50 × 5
250 = 250
Closing (5 minutes)
Why would you choose to use a graph to represent a ratio?
Answers will vary but should include consideration that reading a graph can be more efficient than creating a table to determine missing values.
Exit Ticket (5 minutes)

Lesson 14: From Ratio Tables, Equations, and Double Number Line Diagrams to Plots on the Coordinate Plane
Date: 7/8/13
108
© 2013 Common Core, Inc. Some rights reserved. commoncore.org This work is licensed under a Creative Commons Attribution-NonCommercial-ShareAlike 3.0 Unported License.
NYS COMMON CORE MATHEMATICS CURRICULUM 6•1 Lesson 14
PENDING FINAL EDITORIAL REVIEW Name ___________________________________________________ Date____________________
Lesson 14: From Ratio Tables, Equations, and Double Number
Line Diagrams to Plots on the Coordinate Plane
Exit Ticket Dominic works on the weekends and on vacations from school mowing lawns in his neighborhood. For every lawn he mows, he charges $12.
Complete the table. Then determine ordered pairs and create a labeled graph.
1. How many lawns will Dominic need to mow in order to make $120?
2. How much money will Dominic make if he mowed 9 lawns?
Lawns Charge Ordered Pairs
2
4
6
8
10

Lesson 14: From Ratio Tables, Equations, and Double Number Line Diagrams to Plots on the Coordinate Plane
Date: 7/8/13
109
© 2013 Common Core, Inc. Some rights reserved. commoncore.org This work is licensed under a Creative Commons Attribution-NonCommercial-ShareAlike 3.0 Unported License.
NYS COMMON CORE MATHEMATICS CURRICULUM 6•1 Lesson 14
PENDING FINAL EDITORIAL REVIEW Exit Ticket Sample Solutions
The following solutions indicate an understanding of the objectives of this lesson:
Dominic works on the weekends and on vacations from school mowing lawns in his neighborhood. For every lawn he mows, he charges $12.
Complete the table. Then determine ordered pairs and create a labeled graph.
1. How many lawns will Dominic need to mow in order to make $240?
20 lawns
2. How much money will Dominic make if he mowed 9 lawns?
$108
Problem Set Sample Solutions
1. Complete the table of values to find the following:
Find the amount of cups of sugar needed if for each pie Karrie makes, she has to use 3 cups of sugar.
Use a graph to represent the relationship:
Lawns Charge Ordered Pairs
2 24 (2,24)
4 48 (4,48)
6 72 (6,72)
8 96 (8, 96)
10 120 (10, 120)
Pies Cups of sugar
1 3 2 6 3 9 4 12 5 15 6 18
Cups of Sugar in Pies
Charges for Lawns Cut

Lesson 14: From Ratio Tables, Equations, and Double Number Line Diagrams to Plots on the Coordinate Plane
Date: 7/8/13
110
© 2013 Common Core, Inc. Some rights reserved. commoncore.org This work is licensed under a Creative Commons Attribution-NonCommercial-ShareAlike 3.0 Unported License.
NYS COMMON CORE MATHEMATICS CURRICULUM 6•1 Lesson 14
PENDING FINAL EDITORIAL REVIEW
Create a double number line diagram to show the relationship:
2. Write a story context that would be represented by the ratio 1:4.
Answers will vary. Example: Kendra’s mom pays her 4 dollars for every load of laundry she washes and dries.
Complete a table of values for this equation and graph.
Loads of Laundry
Amount of Money She
Earned 1 4
2 8
3 12
4 16
5 20
Pay for Laundry

Lesson 15: A Synthesis of Representations of Equivalent Ratio Collections Date: 7/8/13
111
© 2013 Common Core, Inc. Some rights reserved. commoncore.org This work is licensed under a Creative Commons Attribution-NonCommercial-ShareAlike 3.0 Unported License.
NYS COMMON CORE MATHEMATICS CURRICULUM 6•1 Lesson 15
PENDING FINAL EDITORIAL REVIEW
Lesson 15: A Synthesis of Representations of Equivalent
Ratio Collections
Student Outcomes
Students associate with each ratio 𝐴:𝐵 the ordered pair (𝐴, 𝐵) and plot it in the 𝑥-𝑦 coordinate plane. Given a ratio table, they plot the ratios in the plane and observe that they lie on a straight line through the
origin.
Students conclude that the coordinates in the plot satisfy 𝑦 = 𝑘𝑥 where 𝑘 is the value of an associated ratio.
Classwork
Exploratory Challenge
Based on their previous knowledge from earlier lessons in this module, and with predetermined groups, students complete the tasks independently with ample time to share their collaboration with the entire class.
This morning, the local television station highlighted area pets that need to be adopted at the end of the morning news segment. The station posted a specific website across the screen for viewers to find more information on the pets shown and the adoption process. The station producer checked the website two hours after the end of the broadcast and saw that the website had 24 views. One hour after that, the website had 36 views.
Exercise 1 (3 minutes)
Create a table to determine how many views the website probably had after the first hour of airing the newscast, based on how many views it had on the second and third hour. Using this relationship, predict how many views the website will have after 4, 5 and 6 hours.
Hours Views
1 12
2 24
3 36
4 48
5 60
6 72

Lesson 15: A Synthesis of Representations of Equivalent Ratio Collections Date: 7/8/13
112
© 2013 Common Core, Inc. Some rights reserved. commoncore.org This work is licensed under a Creative Commons Attribution-NonCommercial-ShareAlike 3.0 Unported License.
NYS COMMON CORE MATHEMATICS CURRICULUM 6•1 Lesson 15
PENDING FINAL EDITORIAL REVIEW Exercise 2 (2 minutes)
What is the constant number, 𝒄, that makes these ratios equivalent?
12
Using an equation, represent the relationship between the number of views (𝒗) the website received and the number of hours (𝒉) after this morning's news broadcast.
𝒗 = 𝟏𝟏𝟏𝟏𝒉
Exercise 3 (2 minutes)
Use the table created in Exercise 1 to identify sets of ordered pairs that can be graphed.
(1,12) (2,24) (3,36) (4,48) (5,60) (6,72)
Exercise 4 (5 minutes)
Use the ordered pairs you created to depict the relationship between hours and views on a coordinate plane. Label your axes and create a title for the graph. Do the points you plotted lie on a line? If so, draw the line through the points.
Views Per Hour

Lesson 15: A Synthesis of Representations of Equivalent Ratio Collections Date: 7/8/13
113
© 2013 Common Core, Inc. Some rights reserved. commoncore.org This work is licensed under a Creative Commons Attribution-NonCommercial-ShareAlike 3.0 Unported License.
NYS COMMON CORE MATHEMATICS CURRICULUM 6•1 Lesson 15
PENDING FINAL EDITORIAL REVIEW Exercise 5 (8 minutes)
Predict how many views the website will have after twelve hours. Use at least two representations (tape diagram, table, double number line diagram) to justify your answer.
Exercise 6 (10 minutes)
Also on the news broadcast, a chef from a local Italian restaurant demonstrated how he makes fresh pasta daily for his restaurant. The recipe for his pasta is below:
3 eggs, beaten
1 teaspoon salt
2 cups all-purpose flour
2 tablespoons water
2 tablespoons vegetable oil
Determine the ratio of tablespoons of water to number of eggs.
2:3
Hours Views
1 12
2 24
3 36
4 48
5 60
6 72
7 84
8 96
9 108
10 120
11 132
12 144
views
𝟏𝟏𝟏𝟏 × 𝟏𝟏𝟏𝟏 − 𝟏𝟏𝟏𝟏𝟏𝟏
12 12 12 12 12 12 12 12 12 12 12 12
12
hours

Lesson 15: A Synthesis of Representations of Equivalent Ratio Collections Date: 7/8/13
114
© 2013 Common Core, Inc. Some rights reserved. commoncore.org This work is licensed under a Creative Commons Attribution-NonCommercial-ShareAlike 3.0 Unported License.
NYS COMMON CORE MATHEMATICS CURRICULUM 6•1 Lesson 15
PENDING FINAL EDITORIAL REVIEW
Provided the information on the table below, complete the table to determine ordered pairs. Use the ordered pairs to graph the relationship of tablespoons of water to number of eggs.
What would you have to do to the graph in order to find how many eggs would be needed if the recipe was larger and called for 16 tablespoons of water?
Extend the graph.
Demonstrate on your graph.
How many eggs would be needed if the recipe called for 16 tablespoons of water?
24
Exercise 7 (5 minutes)
Determine how many tablespoons of water will be needed if the chef is making a large batch of pasta and the recipe increases to 36 eggs. Support your reasoning using at least one diagram you find applies best to the situation and explain why that tool is the best to use.
Answers may vary, but should include reasoning for each tool. For example, extending the table/double number line because values were already given to find the pattern or using a tape diagram to determine the equivalent ratios.
Tablespoons of Water
Number of Eggs
2 3 (2, 3)
4 6 (4, 6)
6 9 (6, 9)
8 12 (8, 12)
10 15 (10, 15)
12 18 (12, 18)
Tablespoons of Water
Number of Eggs
2 3 4 6 6 9 8 12
10 15 12 18 14 21 16 24 18 27 20 30 22 33 24 36
Pasta Recipe

Lesson 15: A Synthesis of Representations of Equivalent Ratio Collections Date: 7/8/13
115
© 2013 Common Core, Inc. Some rights reserved. commoncore.org This work is licensed under a Creative Commons Attribution-NonCommercial-ShareAlike 3.0 Unported License.
NYS COMMON CORE MATHEMATICS CURRICULUM 6•1 Lesson 15
PENDING FINAL EDITORIAL REVIEW
Lesson Summary:
There are several ways that we can represent the same collection of equivalent ratios. These include ratio tables, tape diagrams, double number line diagrams, equations and graphs on coordinate planes.
Closing (5 minutes)
Finish any leftover student discussion and presentation.
Describe the advantages and disadvantages of using each of the representations of equivalent ratios: table, double number line diagram, equation and graph.
Answers will vary but should include the following: tables allow for organization and predicting of unknown values; double number lines help make visible that there are many, even infinitely many, pairs of numbers in the same ratio; an equation is an efficient way to understand the relationship between the first value and the second value and allows us to simply multiply or divide to find any equivalent ratio; a graph is a visual way to immediately see the relationship between two values.
Exit Ticket (5 minutes)
𝟏𝟏 × 𝟏𝟏𝟏𝟏 = 𝟏𝟏𝟏𝟏
eggs
12
12
36
water
𝟑𝟑 × 𝟏𝟏𝟏𝟏 = 𝟑𝟑𝟑𝟑
2 4 6 8 10 12 14 16 18 20 22 24
3 6 9 12 15 18 21 24 27 30 33 36
water
eggs

Lesson 15: A Synthesis of Representations of Equivalent Ratio Collections Date: 7/8/13
116
© 2013 Common Core, Inc. Some rights reserved. commoncore.org This work is licensed under a Creative Commons Attribution-NonCommercial-ShareAlike 3.0 Unported License.
NYS COMMON CORE MATHEMATICS CURRICULUM 6•1 Lesson 15
PENDING FINAL EDITORIAL REVIEW Name ___________________________________________________ Date____________________
Lesson 15: A Synthesis of Representations of Equivalent Ratio
Collections
Exit Ticket Jen and Nikki are making bracelets to sell at the local market. They determined that each bracelet would have eight beads and two charms.
Complete the table below to show the ratio of the number charms to the number of beads.
Charms 2 4 6 8 10
Beads 8
Create ordered pairs from the table and plot the pairs on the graph below. Label the axes of the graph and provide a title.

Lesson 15: A Synthesis of Representations of Equivalent Ratio Collections Date: 7/8/13
117
© 2013 Common Core, Inc. Some rights reserved. commoncore.org This work is licensed under a Creative Commons Attribution-NonCommercial-ShareAlike 3.0 Unported License.
NYS COMMON CORE MATHEMATICS CURRICULUM 6•1 Lesson 15
PENDING FINAL EDITORIAL REVIEW Exit Ticket Sample Solutions
The following solutions indicate an understanding of the objectives of this lesson:
Jen and Nikki are making bracelets to sell at the local market. They determined that each bracelet would have eight beads and two charms.
Complete the table below to show the ratio of the number charms to the number of beads.
Create ordered pairs from the table and plot the pairs on the graph below. Label the axes of the graph and provide a title.
Problem Set Sample Solutions
1. The producer of the news station posted an article of the high school’s football championship ceremony on a new website. The website had 500 views after four hours. Create a table to show how many views the website would have had after the first, second, and third hour after posting, if the website receives views at the same rate. How many views would the website receive after 5 hours?
2. Write an equation that represents the relationship from problem 1. Do you see any connections between the equations you wrote and the ratio of views to hours?
𝟏𝟏𝟏𝟏𝟓𝒉 = 𝒗
Charms 2 4 6 8 10
Beads 8 16 24 32 40
Hours Views
1 125
2 250
3 375
4 500
5 625
Number of Charms to Number of Beads (2,8)
(4,16)
(6,24)
(8,32)
(10,40)

Lesson 15: A Synthesis of Representations of Equivalent Ratio Collections Date: 7/8/13
118
© 2013 Common Core, Inc. Some rights reserved. commoncore.org This work is licensed under a Creative Commons Attribution-NonCommercial-ShareAlike 3.0 Unported License.
NYS COMMON CORE MATHEMATICS CURRICULUM 6•1 Lesson 15
PENDING FINAL EDITORIAL REVIEW
3. Use the table in question 1 to make a list of ordered pairs that you could plot on a coordinate plane.
(1,125), (2,250), (3,375), (4,500), (5,625)
4. Graph the ordered pairs on a coordinate plane. Label your axes and create a title for the graph. Connect the ordered pairs.
5. Use multiple tools to predict how many views the website would have after 12 hours.
Answers may vary, but could include all representations from the module. The correct answer is 1,500 views.
Website Hours and Views

Lesson 15: A Synthesis of Representations of Equivalent Ratio Collections Date: 7/8/13
119
© 2013 Common Core, Inc. Some rights reserved. commoncore.org This work is licensed under a Creative Commons Attribution-NonCommercial-ShareAlike 3.0 Unported License.
NYS COMMON CORE MATHEMATICS CURRICULUM 6•1 Lesson 15
PENDING FINAL EDITORIAL REVIEW Graph Reproducible
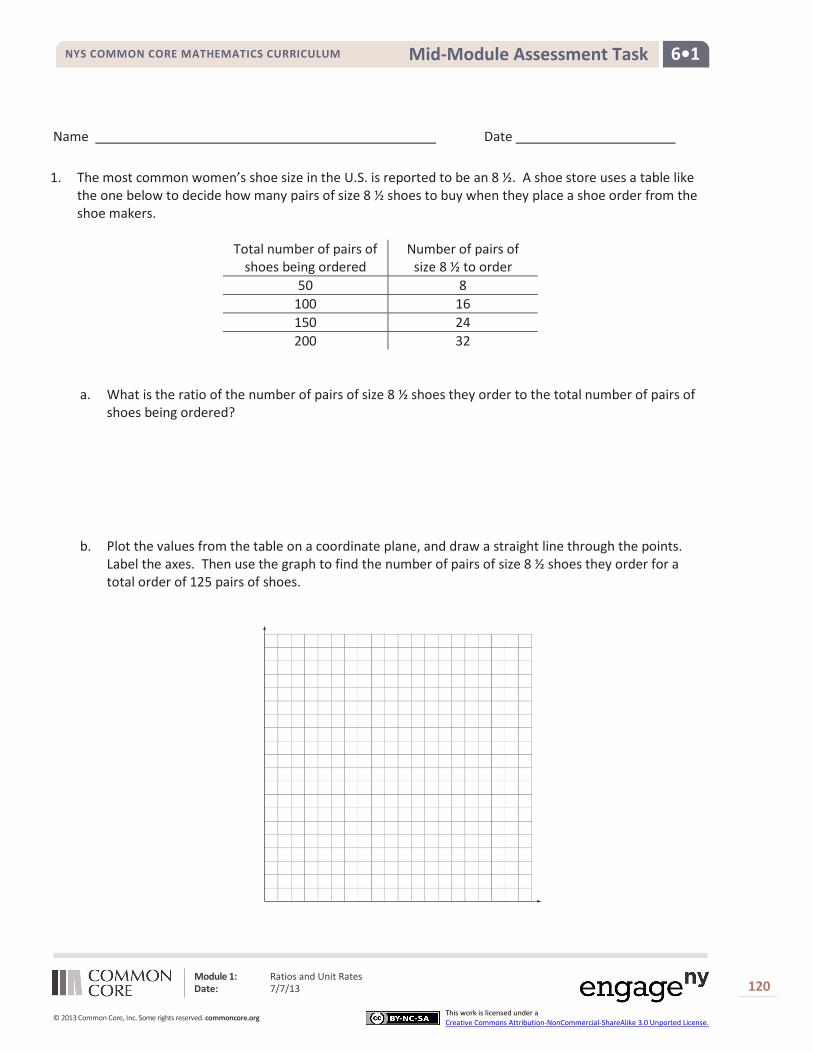
6•1 Mid-Module Assessment Task NYS COMMON CORE MATHEMATICS CURRICULUM
Name Date 1. The most common women’s shoe size in the U.S. is reported to be an 8 ½. A shoe store uses a table like
the one below to decide how many pairs of size 8 ½ shoes to buy when they place a shoe order from the shoe makers.
Total number of pairs of
shoes being ordered Number of pairs of
size 8 ½ to order 50 8
100 16 150 24 200 32
a. What is the ratio of the number of pairs of size 8 ½ shoes they order to the total number of pairs of
shoes being ordered?
b. Plot the values from the table on a coordinate plane, and draw a straight line through the points.
Label the axes. Then use the graph to find the number of pairs of size 8 ½ shoes they order for a total order of 125 pairs of shoes.
Module 1: Ratios and Unit Rates Date: 7/7/13
120
© 2013 Common Core, Inc. Some rights reserved. commoncore.org This work is licensed under a Creative Commons Attribution-NonCommercial-ShareAlike 3.0 Unported License.

6•1 Mid-Module Assessment Task NYS COMMON CORE MATHEMATICS CURRICULUM
2. Wells College in Aurora, New York was previously an all-girls college. In 2005, the college began to allow boys to enroll. By 2012, the ratio of boys to girls was 3 to 7. If there were 200 more girls than boys in 2012, how many boys were enrolled that year? Use a table, graph, or tape diagram to justify your answer.
3. Most television shows use 13 minutes of every hour for commercials, leaving the remaining 47 minutes for the actual show. One popular television show wants to change the ratio of commercial time to show time to be 3:7. Create two ratio tables, one for the normal ratio of commercials to programming and another for the proposed ratio of commercials to programming. Use the ratio tables to make a statement about which ratio would mean fewer commercials for viewers watching 2 hours of television.
Module 1: Ratios and Unit Rates Date: 7/7/13
121
© 2013 Common Core, Inc. Some rights reserved. commoncore.org This work is licensed under a Creative Commons Attribution-NonCommercial-ShareAlike 3.0 Unported License.

6•1 Mid-Module Assessment Task NYS COMMON CORE MATHEMATICS CURRICULUM
A Progression Toward Mastery
Assessment Task Item
STEP 1 Missing or incorrect answer and little evidence of reasoning or application of mathematics to solve the problem.
STEP 2 Missing or incorrect answer but evidence of some reasoning or application of mathematics to solve the problem.
STEP 3 A correct answer with some evidence of reasoning or application of mathematics to solve the problem, or an incorrect answer with substantial evidence of solid reasoning or application of mathematics to solve the problem.
STEP 4 A correct answer supported by substantial evidence of solid reasoning or application of mathematics to solve the problem.
1
a
6.RP.1 6.RP.3a
The ratio given is incorrect and does not reflect an associated ratio. The student does not display an understanding of determining ratio using a ratio table.
The ratio given is an associated ratio such as 25:4. It may or may not be expressed in the smallest unit possible. There is evidence that the student understands how to determine a ratio from a ratio table, but lacks attentiveness to the precision of which ratio is being asked for.
The ratio given is the correct ratio 4:25, but may be expressed using a larger unit, such as 8:50. The notation or wording of the ratio statement may have minor errors.
The ratio is given correctly as 4:25. The notation and/or wording of the ratio statement are correct.
b
6.RP.1 6.RP.3a
The student did not produce a graph or the graph does not accurately depict the pairs from the table. The student was unable to answer the question correctly.
The student depicted a graph but the graph contains more than one error in its depiction, such as not going through the given points, not labeling the axes, or not depicting a line through the origin. The student may or may not have answered the question correctly.
The student depicted a graph but the graph contains a minor error in its depiction, such as not accurately plotting the given points, not labeling the axes, OR depicting a line that just misses going through the origin. The student answered the question correctly or incorrectly, but the answer would be correct given their depiction of the graph.
The student depicted the graph correctly, including plotting the given points, labeling the axes, AND depicting a line that goes through the origin. The student answered the question correctly, and the answer is represented in the graph.
Module 1: Ratios and Unit Rates Date: 7/7/13
122
© 2013 Common Core, Inc. Some rights reserved. commoncore.org This work is licensed under a Creative Commons Attribution-NonCommercial-ShareAlike 3.0 Unported License.

6•1 Mid-Module Assessment Task NYS COMMON CORE MATHEMATICS CURRICULUM
2 6.RP.3 (Stem Only)
The student was unable to answer the question. They were not able to accurately depict the ratio of boys to girls, or showed no evidence of moving beyond that basic depiction.
The student depicted the ratio of boys to girls, and showed some evidence of using their depiction to solve the problem, but was unable to come to a correct answer. The answer was either incomplete or incorrect.
The student was able to choose a depiction of the ratio and to incorporate the other information given into their depiction, but made an error in arriving at the answer.
The student was able to choose a depiction of the ratio of boys to girls and incorporate into their depiction the additional information of the difference between the number of girls and the number of boys. The student was able to use their depiction to arrive at the correct answer.
3
6.RP.3a
The student was not able to complete the two tables OR was not able to fill in at least one row in each table. The student was unable to compose a reasonably accurate comparison of which option would be better for viewers.
The student constructed ratio tables with at least one entry in each table and demonstrated some reasoning in making a statement of comparison, even if the statement did not match the table entries.
The student made two ratio tables with at least two entries in each table. There were one or more errors in the entries of the table. The student was able to make a statement of comparison of which option was better for viewers based on the entries they provided in the table.
The student made two ratio tables with at least two entries in each table. The student was able to make an accurate comparison of which option was better for viewers and relate their comparison to a 2-hour show using accurate grade level language.
Module 1: Ratios and Unit Rates Date: 7/7/13
123
© 2013 Common Core, Inc. Some rights reserved. commoncore.org This work is licensed under a Creative Commons Attribution-NonCommercial-ShareAlike 3.0 Unported License.

6•1 Mid-Module Assessment Task NYS COMMON CORE MATHEMATICS CURRICULUM
Module 1: Ratios and Unit Rates Date: 7/7/13
124
© 2013 Common Core, Inc. Some rights reserved. commoncore.org This work is licensed under a Creative Commons Attribution-NonCommercial-ShareAlike 3.0 Unported License.
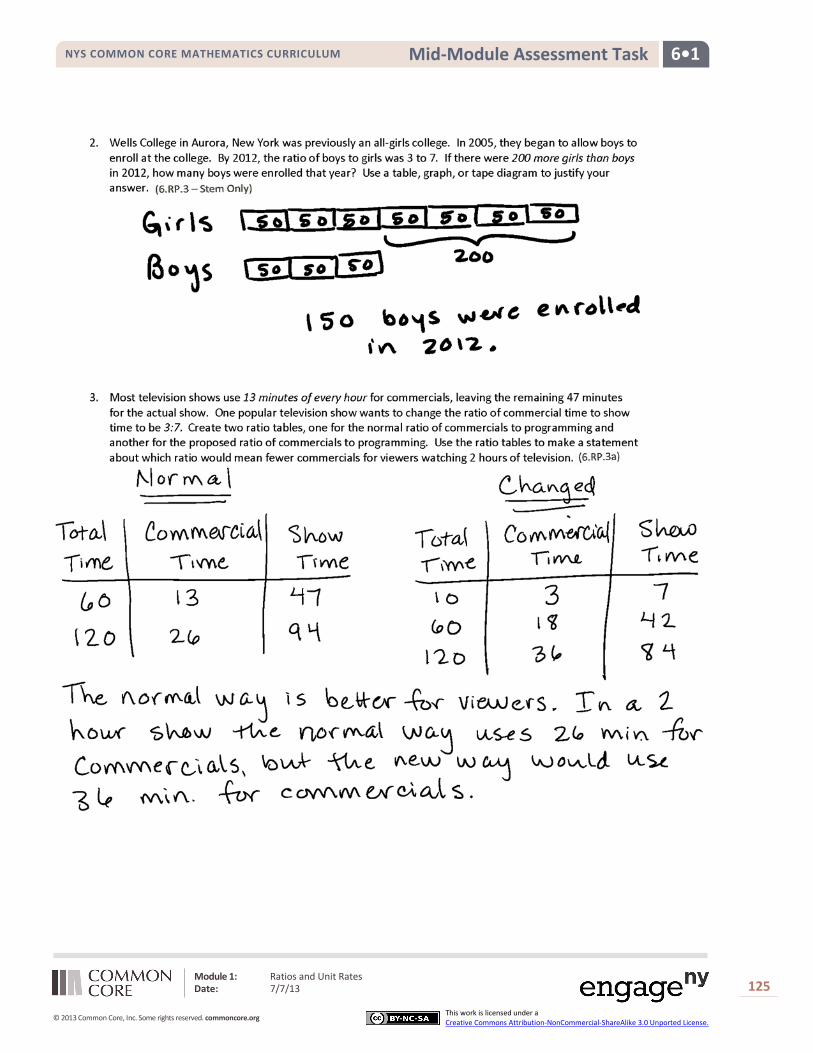
6•1 Mid-Module Assessment Task NYS COMMON CORE MATHEMATICS CURRICULUM
Module 1: Ratios and Unit Rates Date: 7/7/13
125
© 2013 Common Core, Inc. Some rights reserved. commoncore.org This work is licensed under a Creative Commons Attribution-NonCommercial-ShareAlike 3.0 Unported License.