New York State 2013 and 2014 proposed Nursing Home Quality Pool New York State Department of Health...
25
New York State 2013 and 2014 proposed Nursing Home Quality Pool New York State Department of Health November 4, 2013 1
-
Upload
garry-joseph -
Category
Documents
-
view
213 -
download
0
Transcript of New York State 2013 and 2014 proposed Nursing Home Quality Pool New York State Department of Health...
New York State 2013 and 2014 proposed Nursing
Home Quality PoolNew York State Department of HealthNovember 4, 2013
1

2013 Nursing Home Quality Pool (NHQP) Structure
• Quality Component (60 points) • Percent of Long Stay High Risk Residents With Pressure Ulcers*• Percent of Long Stay Residents Assessed and Given, Appropriately, the Pneumococcal Vaccine• Percent of Long Stay Residents Assessed and Given, Appropriately, the Seasonal Influenza Vaccine• Percent of Long Stay Residents Experiencing One or More Falls with Major Injury• Percent of Long Stay Residents Who have Depressive Symptoms• Percent of Low Risk Long Stay Residents Who Lose Control of Their Bowels or Bladder• Percent of Long Stay Residents Who Lose Too Much Weight*• Percent of Long Stay Residents Who Received an Antipsychotic Medication• Percent of Long Stay Residents Who Self-Report Moderate to Severe Pain*• Percent of Long Stay Residents Whose Need for Help with Daily Activities Has Increased• Percent of Long Stay Residents with a Urinary Tract Infection• Percent of Employees vaccinated for the Flu• CMS’ 5-Star Rating for Staffing (not NYS calculated)• Annual Percent Level of Temporary Contract /Agency Staff used
*risk adjusted by NYS
• Compliance Component (20 points)• CMS’ 5-Star Rating for Health Inspections• Timely submission of Nursing Home Cost Reports (due 8/16/2013 for calendar year filers and 9/30/2013 for
fiscal year filers)• Timely submission of Employee Flu data (due 5/1/2013)
• Potentially Avoidable Hospitalizations Component (20 points)• The number of potentially avoidable hospitalizations per 10,000 long stay episode days
2
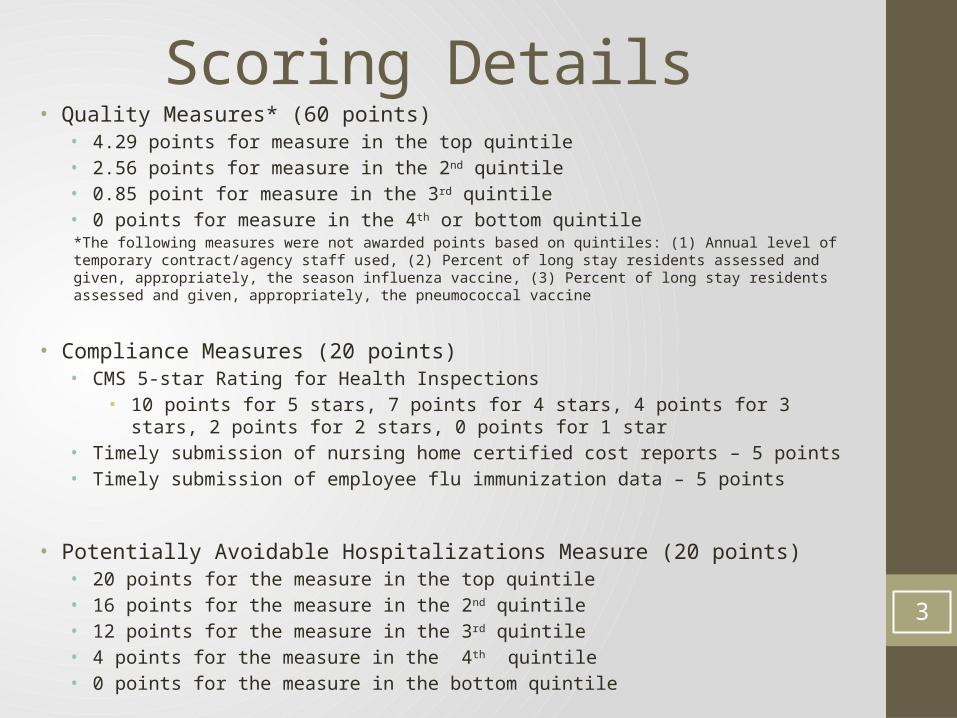
Scoring Details • Quality Measures* (60 points)
• 4.29 points for measure in the top quintile• 2.56 points for measure in the 2nd quintile• 0.85 point for measure in the 3rd quintile• 0 points for measure in the 4th or bottom quintile*The following measures were not awarded points based on quintiles: (1) Annual level of temporary contract/agency staff used, (2) Percent of long stay residents assessed and given, appropriately, the season influenza vaccine, (3) Percent of long stay residents assessed and given, appropriately, the pneumococcal vaccine
• Compliance Measures (20 points)• CMS 5-star Rating for Health Inspections
• 10 points for 5 stars, 7 points for 4 stars, 4 points for 3 stars, 2 points for 2 stars, 0 points for 1 star• Timely submission of nursing home certified cost reports – 5 points• Timely submission of employee flu immunization data – 5 points
• Potentially Avoidable Hospitalizations Measure (20 points)• 20 points for the measure in the top quintile• 16 points for the measure in the 2nd quintile• 12 points for the measure in the 3rd quintile• 4 points for the measure in the 4th quintile• 0 points for the measure in the bottom quintile
3

Scoring Details, continued
4
Three of the 14 quality measures were awarded points based on cutoff rates
Annual level of temporary contract /agency staff used • Proportion of annual contract staff hours worked over the sum of annual full-time and contract
staff hours worked• Maximum points awarded if the rate was less than 10%, and zero points if the rate was 10% or
greater• Staffing hours associated with specialty beds were included in the denominator of this measure
because the cost report schedule used for contract staff does not differentiate between residential healthcare facility beds and specialty beds
Percent of long stay residents assessed and given, appropriately, the seasonal influenza vaccine, and Percent of long stay residents assessed and given, appropriately, the pneumococcal vaccine• Maximum points awarded if the rate was 85% or greater, and zero points if the rate was less than
85%

Facilities affected by Superstorm Sandy
• 25 facilities were affected• The employee flu vaccination measures were suppressed if it
resulted in a higher overall score for the facility• Quality component – Percent of employees vaccinated for the flu
• DOH redistributed the points for this measure across the other quality measures if doing so resulted in a higher overall score
• Compliance component – Timely submission of employee flu immunization data
• If the facility failed to submit the data by the deadline, DOH redistributed compliance the points across the other compliance measures
5
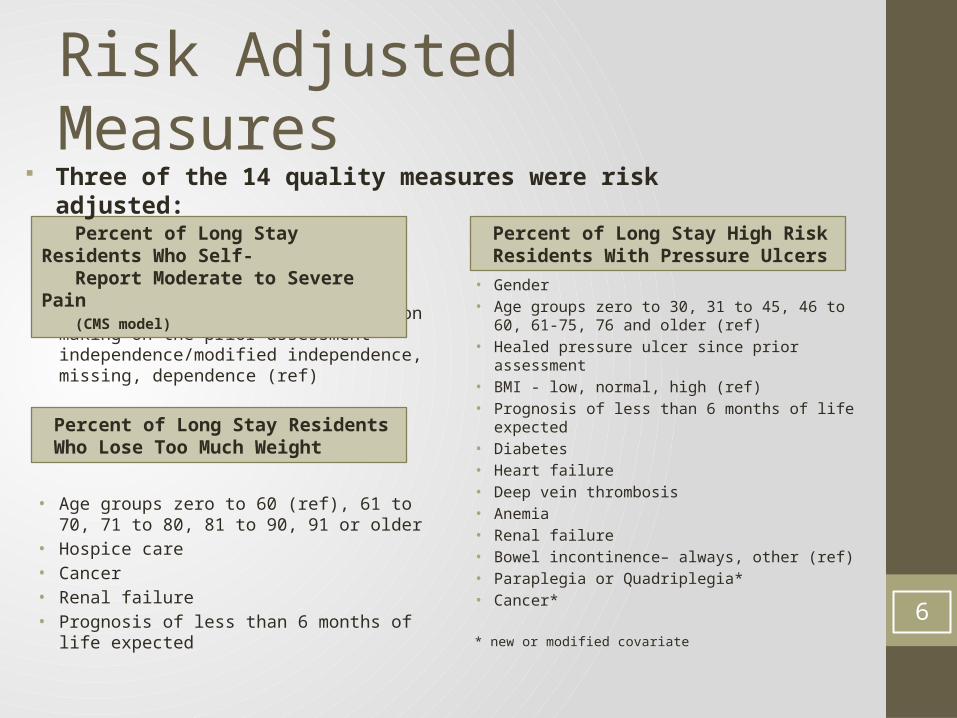
Risk Adjusted Measures
• Cognitive skills for daily decision making on the prior assessment – independence/modified independence, missing, dependence (ref)
• Age groups zero to 60 (ref), 61 to 70, 71 to 80, 81 to 90, 91 or older
• Hospice care• Cancer• Renal failure• Prognosis of less than 6 months of life expected
• Gender• Age groups zero to 30, 31 to 45, 46 to 60, 61-75,
76 and older (ref)• Healed pressure ulcer since prior assessment• BMI - low, normal, high (ref)• Prognosis of less than 6 months of life expected• Diabetes• Heart failure • Deep vein thrombosis• Anemia• Renal failure• Bowel incontinence– always, other (ref)• Paraplegia or Quadriplegia*• Cancer*
* new or modified covariate
6
Percent of Long Stay Residents Who Self- Report Moderate to Severe Pain (CMS model)
Percent of Long Stay High Risk Residents With Pressure Ulcers
Percent of Long Stay Residents Who Lose Too Much Weight
Three of the 14 quality measures were risk adjusted:
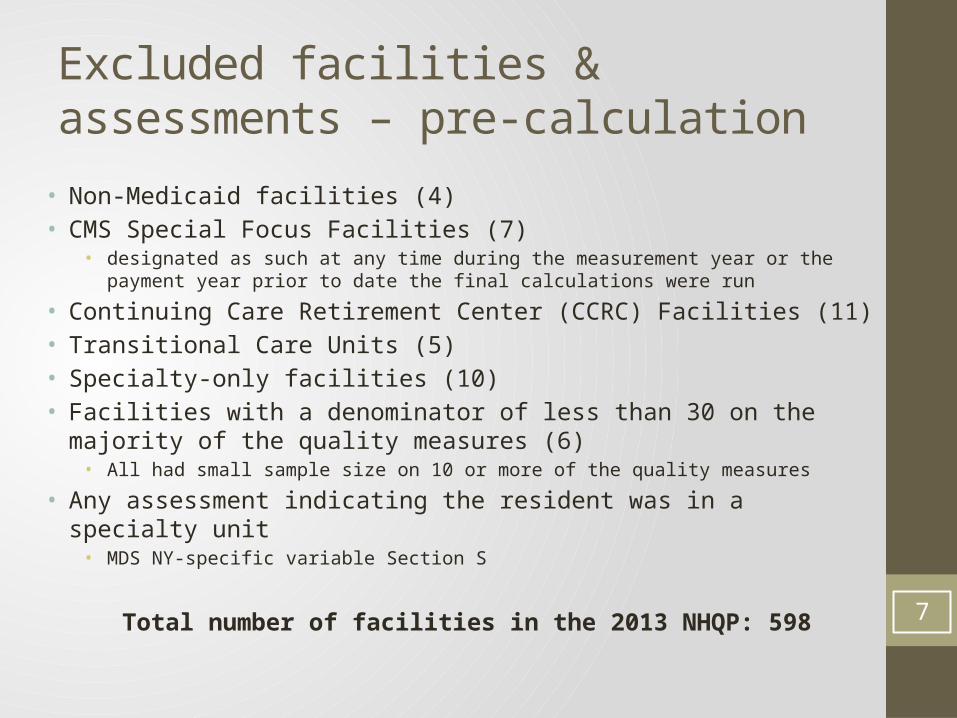
Excluded facilities & assessments – pre-calculation
• Non-Medicaid facilities (4)• CMS Special Focus Facilities (7)
• designated as such at any time during the measurement year or the payment year prior to date the final calculations were run
• Continuing Care Retirement Center (CCRC) Facilities (11)• Transitional Care Units (5)• Specialty-only facilities (10)• Facilities with a denominator of less than 30 on the majority of the quality
measures (6)• All had small sample size on 10 or more of the quality measures
• Any assessment indicating the resident was in a specialty unit • MDS NY-specific variable Section S
Total number of facilities in the 2013 NHQP: 5987

2013 NHQP results
8
MEASURE P100 P80 P60 P40 P20 P0 Mean
Percent of long stay high risk residents with pressure ulcers 3.84 6.25 7.27 8.14 9.21 15.33 8.01
Percent of long stay low risk residents who lose control of their bowel or bladder 8.03 27.19 36.82 46.05 56.92 97.62 40.02
Percent of long stay residents experiencing one or more falls with major injury 0 1.38 2.26 3.14 4.26 13.71 2.74
Percent of long stay residents who have depressive symptoms 0 1.48 4.02 8.3 18.56 89.56 12.92
Percent of long stay residents who lose too much weight 4.48 5.86 6.14 6.38 6.84 10.82 6.37
Percent of long stay residents who received an antipsychotic medication 0 12.45 16.21 20.38 26.18 51.28 18.93
Percent of long stay residents who self-report moderate to severe pain 4.73 6.57 6.99 7.37 7.87 10.14 7.26
Percent of long stay residents whose need for help with daily activities has increased 2.7 10.04 12.7 16.24 20.19 35.82 14.5
Percent of long stay residents with a urinary tract infection 0 3.64 5.27 6.76 9.3 30.43 5.94
Percent of employees vaccinated for the flu* 96.79 68.47 56.02 45.25 31.45 3.49 50.79
Number of potentially avoidable hospitalizations per 10,000 long stay days 0 2.23 3.45 4.51 6.1 17.63 4.29
Overall score 84.60 61.57 54.18 48.88 41.75 24.15 51.78
5th
quintile4th
quintile3rd
quintile2nd
quintile1st
quintile
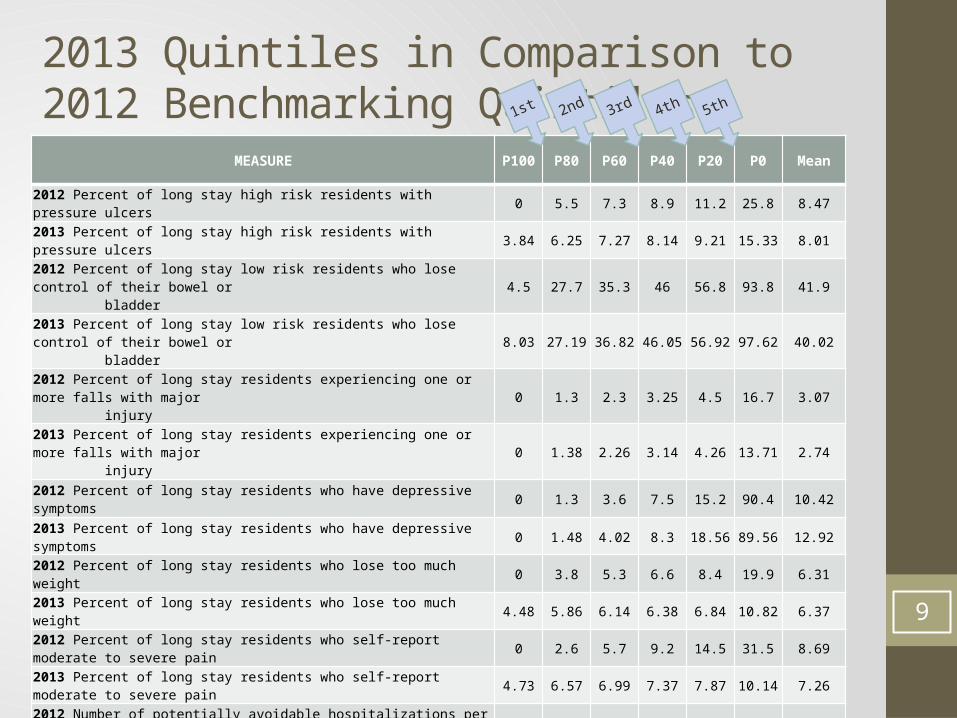
2013 Quintiles in Comparison to 2012 Benchmarking Quintiles
9
MEASURE P100 P80 P60 P40 P20 P0 Mean
2012 Percent of long stay high risk residents with pressure ulcers 0 5.5 7.3 8.9 11.2 25.8 8.47
2013 Percent of long stay high risk residents with pressure ulcers 3.84 6.25 7.27 8.14 9.21 15.33 8.01
2012 Percent of long stay low risk residents who lose control of their bowel or bladder
4.5 27.7 35.3 46 56.8 93.8 41.9
2013 Percent of long stay low risk residents who lose control of their bowel or bladder
8.03 27.19 36.82 46.05 56.92 97.62 40.02
2012 Percent of long stay residents experiencing one or more falls with major injury
0 1.3 2.3 3.25 4.5 16.7 3.07
2013 Percent of long stay residents experiencing one or more falls with major injury
0 1.38 2.26 3.14 4.26 13.71 2.74
2012 Percent of long stay residents who have depressive symptoms 0 1.3 3.6 7.5 15.2 90.4 10.42
2013 Percent of long stay residents who have depressive symptoms 0 1.48 4.02 8.3 18.56 89.56 12.92
2012 Percent of long stay residents who lose too much weight 0 3.8 5.3 6.6 8.4 19.9 6.31
2013 Percent of long stay residents who lose too much weight 4.48 5.86 6.14 6.38 6.84 10.82 6.37
2012 Percent of long stay residents who self-report moderate to severe pain 0 2.6 5.7 9.2 14.5 31.5 8.69
2013 Percent of long stay residents who self-report moderate to severe pain 4.73 6.57 6.99 7.37 7.87 10.14 7.26
2012 Number of potentially avoidable hospitalizations per 10,000 long stay days
0 3.14 4.52 5.76 7.37 20.61 5.44
2013 Number of potentially avoidable hospitalizations per 10,000 long stay days
0 2.23 3.45 4.51 6.1 17.63 4.29
5th4th3rd2nd1st
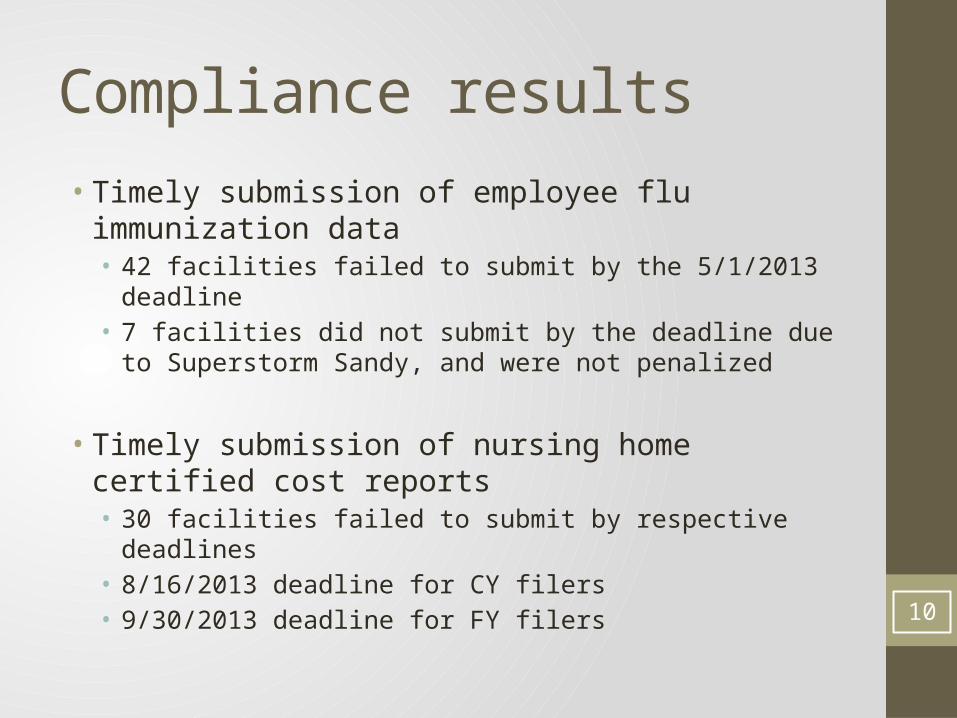
Compliance results
• Timely submission of employee flu immunization data• 42 facilities failed to submit by the 5/1/2013 deadline• 7 facilities did not submit by the deadline due to Superstorm
Sandy, and were not penalized
• Timely submission of nursing home certified cost reports• 30 facilities failed to submit by respective deadlines• 8/16/2013 deadline for CY filers• 9/30/2013 deadline for FY filers
10
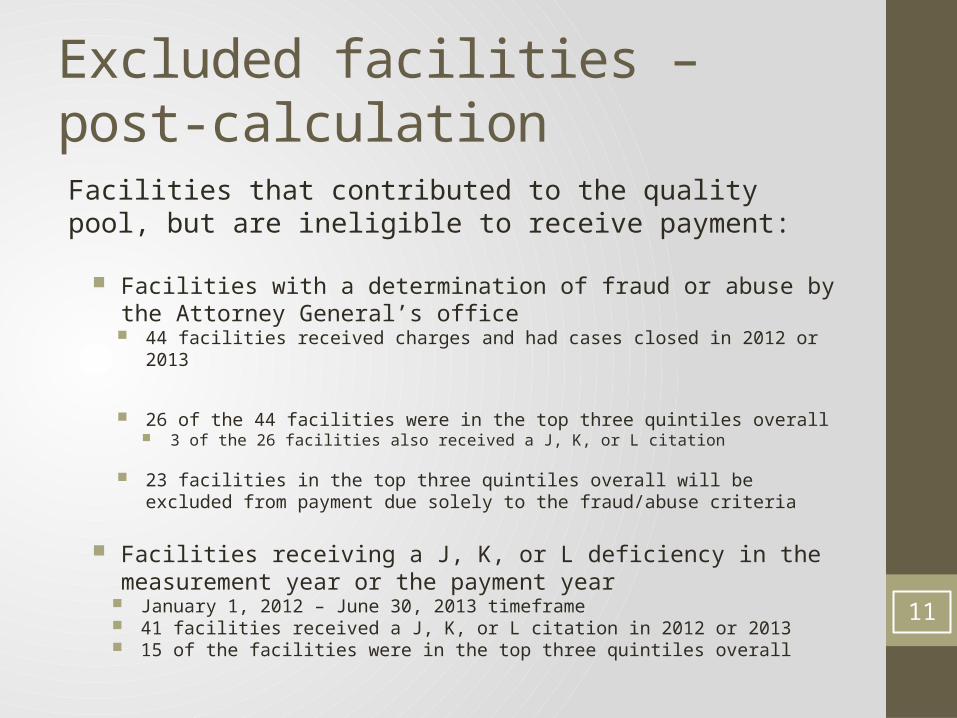
Excluded facilities – post-calculation
Facilities that contributed to the quality pool, but are ineligible to receive payment:
Facilities with a determination of fraud or abuse by the Attorney General’s office 44 facilities received charges and had cases closed in 2012 or 2013
26 of the 44 facilities were in the top three quintiles overall 3 of the 26 facilities also received a J, K, or L citation
23 facilities in the top three quintiles overall will be excluded from payment due solely to the fraud/abuse criteria
Facilities receiving a J, K, or L deficiency in the measurement year or the payment year
January 1, 2012 – June 30, 2013 timeframe 41 facilities received a J, K, or L citation in 2012 or 2013 15 of the facilities were in the top three quintiles overall
11

Distribution Formula
12
Distribution of Quality Pool Funds
Final QuintileA
Facility’s Medicaid Revenue Multiplied by Award Factor
BShare of $50 Million Quality Pool Allocated to Facility
CFacility Per Diem Quality
Payment
1st Quintile
Each facility’s 2012 Medicaid days multiplied by 2013 Medicaid Rate as of January 1, 2013 = Total Medicaid Revenue multiplied by an award factor of 3
Each facility’s column A Divided by Sum of Total Medicaid Revenue for all facilities, Multiplied by $50 million
Each facility’s column B divided by the facility’s 2012 Medicaid days
2nd Quintile
Each facility’s 2012 Medicaid days multiplied by 2013 Medicaid Rate as of January 1, 2013 = Total Medicaid Revenue multiplied by an award factor of 2
Each facility’s column A Divided by Sum of Total Medicaid Revenue for all facilities, Multiplied by $50 million
Each facility’s column B divided by the facility’s 2012 Medicaid days
3rd Quintile
Each facility’s 2012 Medicaid days multiplied by 2013 Medicaid Rate as of January 1, 2013 = Total Medicaid Revenue multiplied by an award factor of 1
Each facility’s column A Divided by Sum of Total Medicaid Revenue for all facilities, Multiplied by $50 million
Each facility’s column B divided by the facility’s 2012 Medicaid days
TotalSum of Total Medicaid Revenue for all facilities
Sum of quality pool funds: $50 million
--
Release of 2013 Results
• Facility-level results will be posted on the Health Commerce System (following the same format as the 2012 benchmarking results)
• Department press release is in progress• Press release will include an alphabetical listing of each facility in each
quintile as well as an alphabetical listing of facilities with a J/K/L deficiency and a determination of fraud and/or abuse
• METRIX/Health Data NY• DOH is currently in the process of making the comprehensive dataset
downloadable through METRIX
13

Proposed 2014 Quality Measures• Quality Component (60 points)
• Percent of Long Stay High Risk Residents With Pressure Ulcers*• Percent of Long Stay Residents Assessed and Given, Appropriately, the Pneumococcal
Vaccine • Percent of Long Stay Residents Assessed and Given, Appropriately, the Seasonal
Influenza Vaccine • Percent of Long Stay Residents Experiencing One or More Falls with Major Injury• Percent of Long Stay Residents Who have Depressive Symptoms• Percent of Low Risk Long Stay Residents Who Lose Control of Their Bowels or Bladder• Percent of Long Stay Residents Who Lose Too Much Weight*• Percent of Long Stay Residents Who Received an Antipsychotic Medication• Percent of Long Stay Residents Who Self-Report Moderate to Severe Pain*• Percent of Long Stay Residents Whose Need for Help with Daily Activities Has
Increased• Percent of Long Stay Residents with a Urinary Tract Infection• Percent of Employees vaccinated for the Flu• CMS’ 5-Star Rating for Staffing (not NYS calculated)• Annual Percent Level of Temporary Contract /Agency Staff used
*risk adjusted by NYS
14

Long stay influenza and pneumococcal vaccination quality measures• 2013 NHQP (2012 measurement year)
• 61 facilities below 85% for influenza• 18 facilities below 85% for pneumococcal
• The two-quarter average using quarters 1 and 2 of 2013 data show that rates are increasing• 21 facilities below the 85% cutoff for the influenza measure• 22 facilities below 85% in the pneumococcal measure
• Options• Eliminate the measures• Raise the cutoff points• Use the more restrictive CMS measures
• Only residents who are vaccinated are numerator-compliant• Received influenza vaccine: mean 82.4%, range 28.4% - 98.3%• Received pneumococcal vaccine: 86.6%, range 29.5% - 100%
15
Measure2012 4-quarter
statewide average2013 2-quarter
statewide average
Long stay influenza vaccination measure 94.21 97.33
Long stay pneumococcal vaccination measure 97.28 97.30
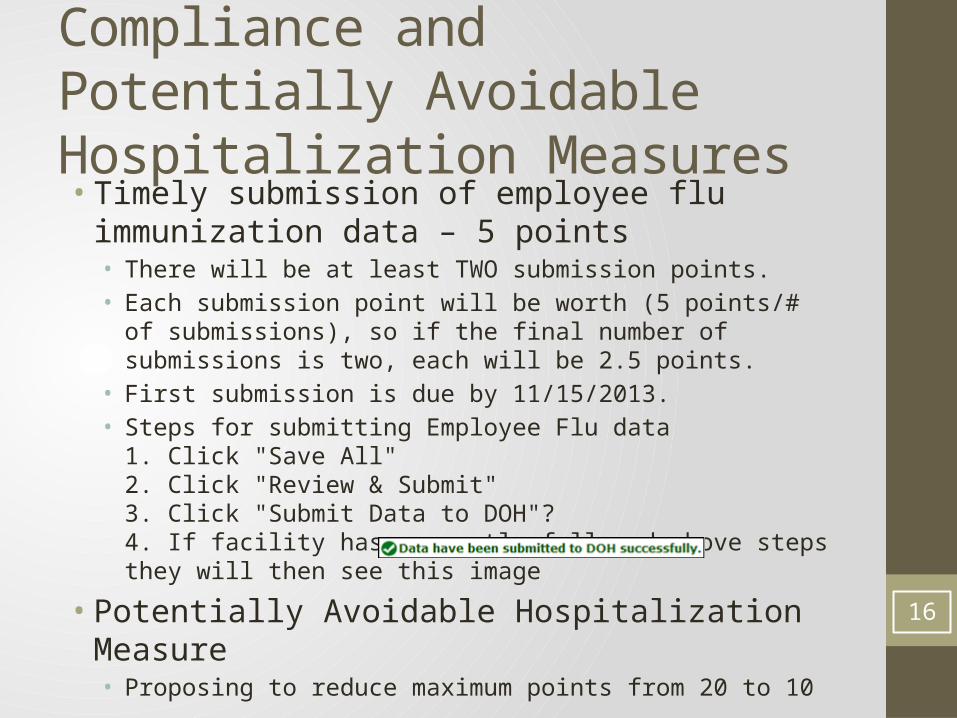
Compliance and Potentially Avoidable Hospitalization Measures• Timely submission of employee flu immunization data –
5 points• There will be at least TWO submission points.• Each submission point will be worth (5 points/# of submissions), so if the
final number of submissions is two, each will be 2.5 points.• First submission is due by 11/15/2013.• Steps for submitting Employee Flu data
1. Click "Save All"2. Click "Review & Submit"3. Click "Submit Data to DOH"?4. If facility has correctly followed above steps they will then see this image
• Potentially Avoidable Hospitalization Measure• Proposing to reduce maximum points from 20 to 10 16

Works in Progress
• Staffing Measure• Consistent Assignment• Staff Turnover• Resident Satisfaction• Dental Health Measure• Additional Efficiency Measure
• Emergency room utilization
17

CMS’ Computed Staffing Measure
• CMS 5-Star for Staffing based on 2 week snapshot of facility prior to on-site.
• Hours reported from form CMS-671 and utilizes payroll data. Hours expected computed from the distribution of RUG categories within facility at end of quarter closest to survey multiplied by the CMS 1995 and 1997 Staff Time Study – rate is per resident day
Hours (reported)Hours (expected)
=[Hours reported from CMS-671 /# of residents from CMS-672] / 14 days
[(RUG distribution of quarter closest to survey*hours from CMS time study) / # of residents from CMS-672] / 14 days 18

NYS Computed Staffing Measure
• NYS proposed method – hours reported from the cost report, utilizing hours worked field
• Hours expected is computed by counting patient days at MDS 3.0 generated RUGIII category and utilizing CMS Time study referenced above
[Hours worked reported from cost reports/# of residents from MDS 3.0] / 365 days
[(RUG distribution from MDS 3.0*hours from CMS time study)/# of residents from MDS 3.0] / 365 days
= Hours (reported)Hours (expected)
19

Consistent Assignment
• To stabilize staffing and establish strong relationships between residents and staff and among co-workers to provide continuity, consistency, and familiarity in care giving.
• Varying definitions• CMS’ Nursing Home Quality Initiative
• Collect one week per month, over the past 3 months• Advancing Excellence
• Collect over a four week period for long stay• “Consistent Assignment” refers to having the same caregivers consistently caring
for the same residents on at least 85% of their shifts. • 190 NYS NHs participate in AE
• Would require a new data collection system• Currently, NH QP utilizes MDS 3.0, SPARCS, cost report information and CMS
data.
20
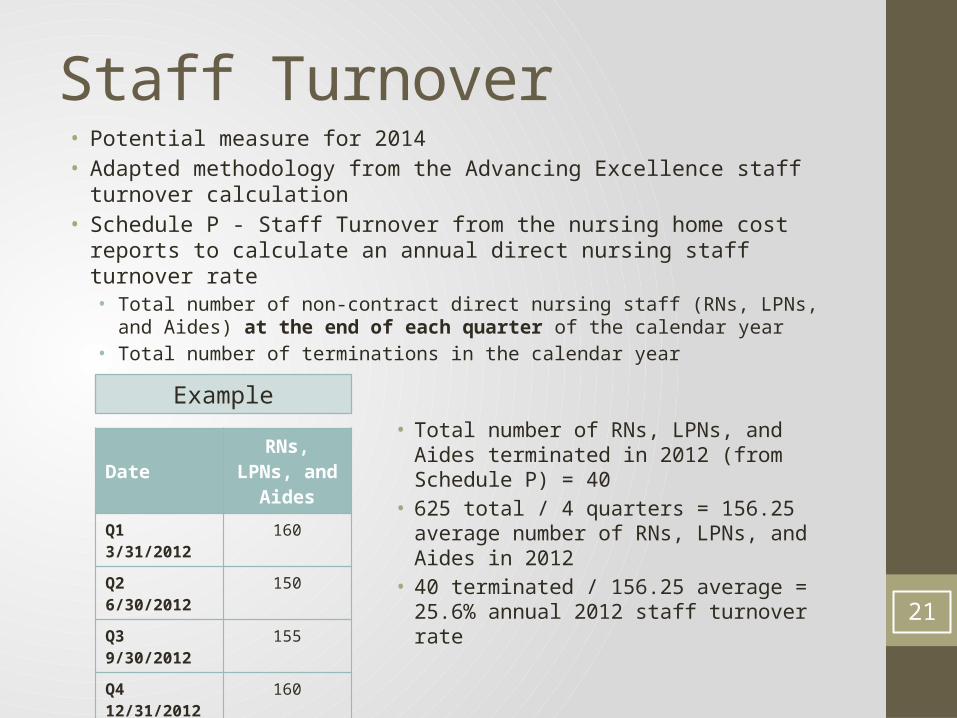
Staff Turnover• Potential measure for 2014• Adapted methodology from the Advancing Excellence staff turnover
calculation• Schedule P - Staff Turnover from the nursing home cost reports to calculate
an annual direct nursing staff turnover rate • Total number of non-contract direct nursing staff (RNs, LPNs, and Aides) at the
end of each quarter of the calendar year• Total number of terminations in the calendar year
• Total number of RNs, LPNs, and Aides terminated in 2012 (from Schedule P) = 40
• 625 total / 4 quarters = 156.25 average number of RNs, LPNs, and Aides in 2012
• 40 terminated / 156.25 average = 25.6% annual 2012 staff turnover rate
21
Date RNs, LPNs, and Aides
Q1 3/31/2012 160
Q2 6/30/2012 150
Q3 9/30/2012 155
Q4 12/31/2012 160
TOTAL 625
Example

Resident Satisfaction• Resident Satisfaction is an important component in refining quality• Challenges
• Uniform satisfaction tool (CAHPS)• Cost
• Currently, a RFA by NYS DOH • $1 million• Two year contract• Minimum of 30 NHs
• CAHPS tool• My InnerView Skilled Nursing Resident Satisfaction Interview (proprietary)
22
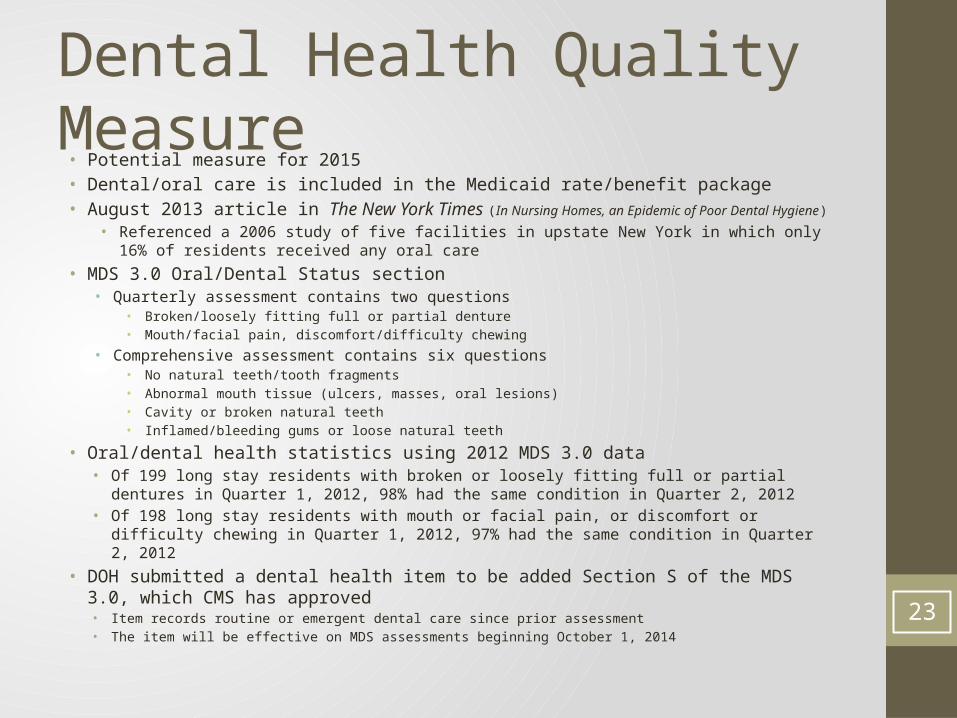
Dental Health Quality Measure• Potential measure for 2015 • Dental/oral care is included in the Medicaid rate/benefit package• August 2013 article in The New York Times (In Nursing Homes, an Epidemic of Poor Dental Hygiene)
• Referenced a 2006 study of five facilities in upstate New York in which only 16% of residents received any oral care
• MDS 3.0 Oral/Dental Status section• Quarterly assessment contains two questions
• Broken/loosely fitting full or partial denture• Mouth/facial pain, discomfort/difficulty chewing
• Comprehensive assessment contains six questions • No natural teeth/tooth fragments• Abnormal mouth tissue (ulcers, masses, oral lesions)• Cavity or broken natural teeth• Inflamed/bleeding gums or loose natural teeth
• Oral/dental health statistics using 2012 MDS 3.0 data• Of 199 long stay residents with broken or loosely fitting full or partial dentures in Quarter 1, 2012,
98% had the same condition in Quarter 2, 2012• Of 198 long stay residents with mouth or facial pain, or discomfort or difficulty chewing in Quarter 1,
2012, 97% had the same condition in Quarter 2, 2012• DOH submitted a dental health item to be added Section S of the MDS 3.0, which CMS has
approved• Item records routine or emergent dental care since prior assessment• The item will be effective on MDS assessments beginning October 1, 2014
23

Additional Efficiency Measure
• 10 points• Preventable emergency room utilization measure• Input from workgroup
24