NEW WORLD - PUKEKOHE Project No - Auckland...
51
NEW WORLD - PUKEKOHE RETAIL & LIGHT INDUSTIAL IMPACT ASSESSMENT Project No: Date: Client:
Transcript of NEW WORLD - PUKEKOHE Project No - Auckland...
NEW WORLD - PUKEKOHE
RETAIL & LIGHT INDUSTIAL
IMPACT ASSESSMENT
Project No:
Date:
Client:

2
DISCLAIMER
Code Date Information / Comments Project Leader
51632.3 May 2017 Report Tim Heath/ Phil Osborne
SCHEDULE

TABLE OF CONTENTS
3
INTRODUCTION ..................................................................... 5
1.1. KEY RESEARCH OBJECTIVES ............................................. 6
1.2. INFORMATION & DATA SOURCES ...................................... 7
CORE ECONOMIC MARKET ...................................................... 8
DEMOGRAPHIC PROFILE ....................................................... 10
POPULATION AND HOUSEHOLD FORECAST ............................. 11
SUPERMARKET RETAILING EXPENDITURE & SUSTAINABLE GFA 13
5.1. RETAIL EXPENDITURE MODEL ......................................... 13
5.2. SUSTAINABLE GFA ........................................................ 15
5.3. FOOD RETAILING EXPENDITURE & CONVENIENCE GFA ...... 15
RETAIL EXPENDITURE FLOWS ............................................... 17
6.1. DESTINATION SPENDING ............................................... 17
6.2. ORIGIN SPENDING ........................................................ 19
6.3. CORE CATCHMENT NET FOOD RETAILING EXPENDITURE
FLOWS ........................................................................ 20
EXISTING RETAIL SUPPLY ..................................................... 23
RETAIL SUPPLY AND DEMAND DIFFERENTIAL .......................... 26
LIGHT INDUSTRIAL ZONED LAND ANALYSIS ........................... 30
LIGHT INDUSTRIAL IN THE CORE CATCHMENT ........................ 33
10.1. EMPLOYMENT AND LAND FORECAST 2016-2033 ........... 34
AUCKLAND UNITARY PLAN CONSIDERATIONS ......................... 37
SUMMARY ........................................................................... 38
APPENDIX 1: PROPOSED DEVELOPMENT PLAN ............................. 40
TABLE OF CONTENTS
4
APPENDIX 2: DEMOGRAPHIC PROFILING ..................................... 41
APPENDIX 3: FOOD RETAILING – ANZSIC06 ................................ 44
APPENDIX 4: PROPERTY ECONOMICS RETAIL EXPENDITURE MODEL
......................................................................................... 46
LIST OF TABLES
TABLE 1: FOOD RETAILING EXPENDITURE AND SUSTAINABLE GFA FORECASTS ............... 16
TABLE 2: PUKEKOHE RETAIL SUPPLY BY SECTOR .......................................................... 23
TABLE 3: PUKEKOHE RETAIL AUDIT JANUARY 2017 ...................................................... 25
TABLE 4: FOOD RETAILING SUPPLY & DEMAND DIFFERENTIAL 2016 – 2033 (SQM) .......... 27
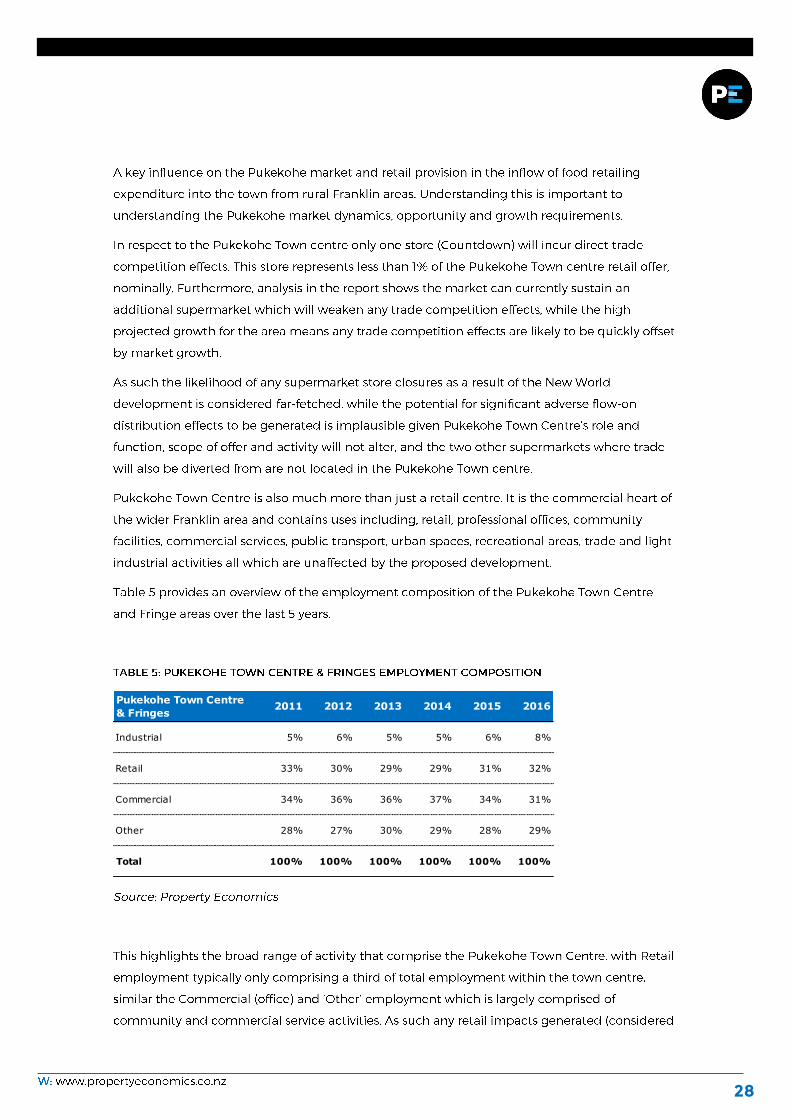
TABLE 5: PUKEKOHE TOWN CENTRE & FRINGES EMPLOYMENT COMPOSITION ................. 28
TABLE 6: CURRENT INDUSTRIAL LAND SUPPLY ACROSS WIDER AREA ............................ 30
TABLE 7: LIGHT INDUSTRIAL ACTIVITY EMPLOYMENT TRENDS (2000 – 2016 ECS) ........... 33
TABLE 8: CORE CATCHMENT LIGHT INDUSTRIAL EMPLOYMENT FORECAST 2016 – 2033 ... 35
LIST OF FIGURES
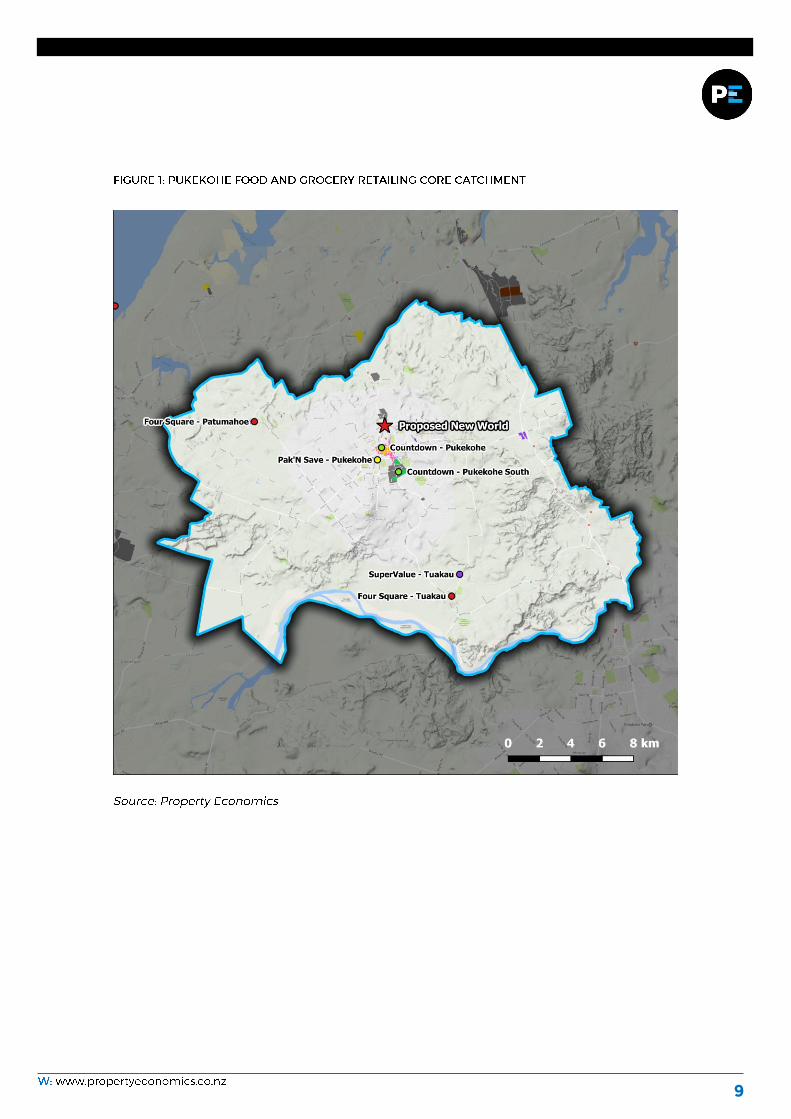
FIGURE 1: PUKEKOHE FOOD AND GROCERY RETAILING CORE CATCHMENT ....................... 9
FIGURE 2: CORE ECONOMIC MARKET POPULATION AND HOUSEHOLD PROJECTIONS ........ 11
FIGURE 3: CORE CATCHMENT DESTINATION OF FOOD RETAILING EXPENDITURE ............ 18
FIGURE 4: CORE CATCHMENT ORIGIN OF FOOD RETAILING EXPENDITURE ...................... 19
FIGURE 5: CORE CATCHMENT FOOD RETAILING NET EXPENDITURE FLOWS..................... 20
FIGURE 6: FOOD RETAILING NET POSITION BY AREA FOR THE CORE CATCHMENT ........... 21
FIGURE 7: INDUSTRIAL ZONES LAND ACROSS WIDER AREA .......................................... 31

5
INTRODUCTION

6
1.1. KEY RESEARCH OBJECTIVES

7
1.2. INFORMATION & DATA SOURCES
•
•
•
•
•
•
•
•
•
•
•

8
CORE ECONOMIC MARKET
9

10
DEMOGRAPHIC PROFILE
•
•
•
•
•
•
•

11
30,850
35,450
40,250
41,550
46,550
51,700
56,900
10,85012,500
14,550
15,10017,200
19,35021,300
0
10,000
20,000
30,000
40,000
50,000
60,000
2003 2008 2013 2018 2023 2028 2033
Pop
ulat
ion
and
Hou
seho
lds
Population Households
POPULATION AND HOUSEHOLD FORECAST

12

13
Total Retail Spending
Household Spending
Business Spending
Physical Retail Stores
Internet Spending
Visitor Spending
SUPERMARKET RETAILING EXPENDITURE & SUSTAINABLE GFA
5.1. RETAIL EXPENDITURE MODEL

14

15
5.2. SUSTAINABLE GFA
•
•
5.3. FOOD RETAILING EXPENDITURE & CONVENIENCE GFA

16
Food Retailing 2017 2018 2023 2028 2033
Retail Expenditure ($m) $155 $159 $183 $208 $232
Sustainable GFA (sqm) 19,100 19,700 22,600 25,600 28,600

17
RETAIL EXPENDITURE FLOWS
6.1. DESTINATION SPENDING

18
76%
2%
4%
4%
4%
2%
1%
7%
1%
0% 10% 20% 30% 40% 50% 60% 70% 80% 90% 100%
Catchment
Balance of Franklin District
Manukau City
Papakura District
Auckland City
Balance of Auckland Region
Waikato District
Balance of North Island
South Island

19
49%
24%
7%
5%
4%
3%
2%
5%
1%
0% 10% 20% 30% 40% 50% 60% 70% 80% 90% 100%
Catchment
Balance of Franklin District
Manukau City
Papakura District
Auckland City
Balance of Auckland Region
Waikato District
Balance of North Island
South Island
6.2. ORIGIN SPENDING

20
-2%
-4%
-4%
-4%
-2%
-1%
-7%
-1%
-24%
37%
11%
7%
6%
5%
4%
8%
1%
78%
-40% -20% 0% 20% 40% 60% 80% 100%
Balance of Franklin District
Manukau City
Papakura District
Auckland City
Balance of Auckland Region
Waikato District
Balance of North Island
South Island
Net Flows
6.3. CORE CATCHMENT NET FOOD RETAILING EXPENDITURE FLOWS

21
35%
7%
3%
2%
4%
3%
0%
0%
78%
76%
0% 10% 20% 30% 40% 50% 60% 70% 80% 90% 100%
Balance of Franklin District
Manukau City
Papakura District
Auckland City
Balance of Auckland Region
Waikato District
Balance of North Island
South Island
Net Expenditure Inflow
Core Catchment Retention

22

23
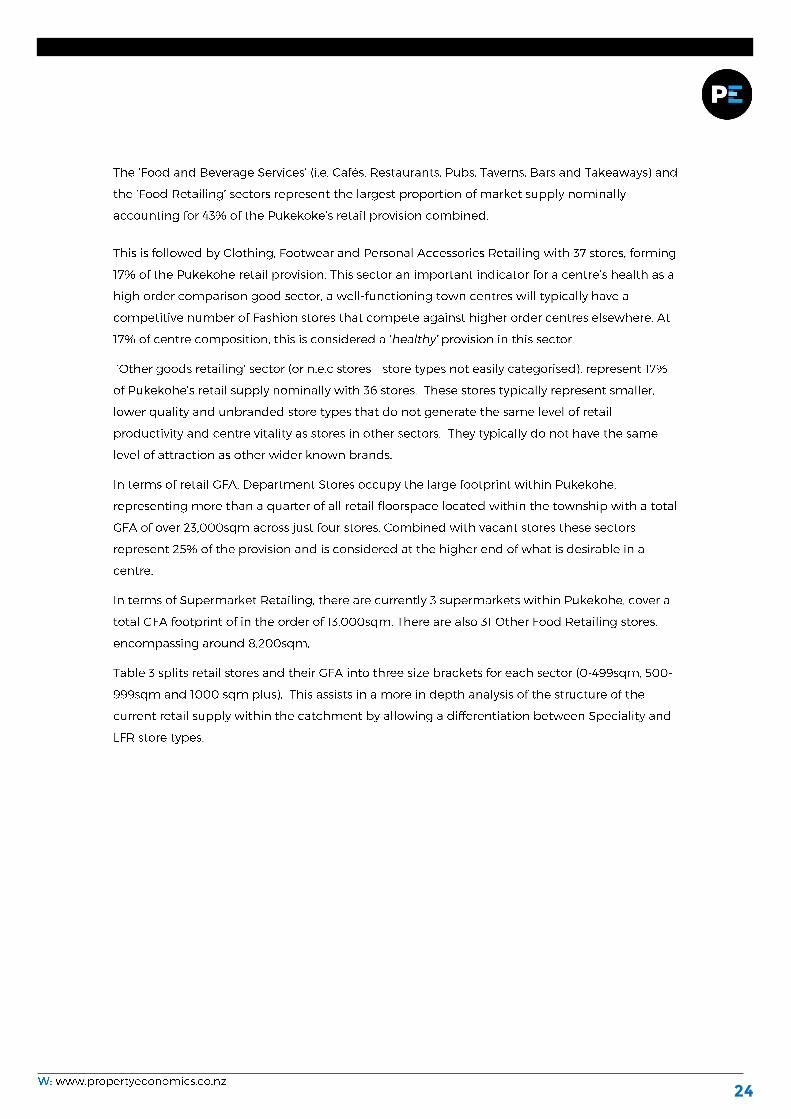
ANZSIC06 RETAIL CLASSIFICAITONS Store # Store % GFA # GFA %
Supermarket 3 1% 12,940 15%
Other Food retailing 31 14% 8,210 9%
Clothing, footwear and personal accessories retailing 37 17% 7,540 9%
Furniture, floor coverings, houseware and textile goods
retailing12 6% 7,090 8%
Electrical and electronic goods retailing 3 1% 1,980 2%
Pharmaceutical and personal care goods retailing 5 2% 880 1%
Department stores 4 2% 23,060 26%
Recreational goods retailing 7 3% 4,590 5%
Other goods retailing 36 17% 11,190 13%
Food and beverage services 59 28% 7,650 9%
Vacant 17 8% 3,190 4%
Total 214 100% 88,320 100%
EXISTING RETAIL SUPPLY
24

25
0-499 500-999 1000+ Total 0-499 500-999 1000+ Total
Supermarket 0 0 3 3 0 0 12,940 12,940
Other Food retailing 28 3 0 31 5,840 2,370 0 8,210
Clothing, footwear and personal accessories
retailing35 1 1 37 5,570 830 1,140 7,540
Furniture, floor coverings, houseware and textile
goods retailing8 3 1 12 2,070 2,100 2,910 7,090
Electrical and electronic goods retailing 2 0 1 3 640 0 1,340 1,980
Pharmaceutical and personal care goods
retailing5 0 0 5 880 0 0 880
Department stores 0 0 4 4 0 0 23,060 23,060
Recreational goods retailing 3 1 3 7 530 520 3,540 4,590
Other goods retailing 32 2 2 36 6,400 1,630 3,160 11,190
Food and beverage services 59 0 0 59 7,650 0 0 7,650
Vacant 15 2 0 17 2,050 1,140 0 3,190
Total 187 12 15 214 31,630 8,590 48,090 88,320
Total % 87% 6% 7% 100% 36% 10% 54% 100%
ANZSIC06 RETAIL CLASSIFICAITONS
Store Count GFA (sqm)

26
RETAIL SUPPLY AND DEMAND DIFFERENTIAL
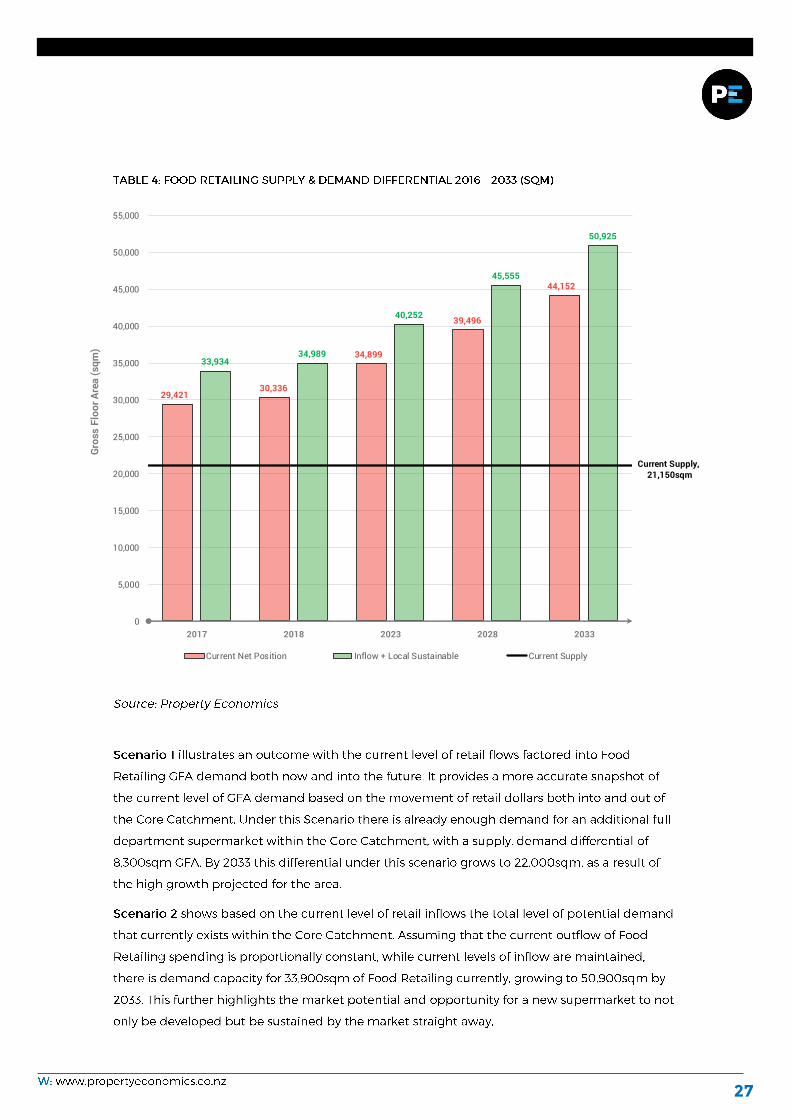
27
29,42130,336
34,899
39,496
44,152
33,93434,989
40,252
45,555
50,925
Current Supply,21,150sqm
0
5,000
10,000
15,000
20,000
25,000
30,000
35,000
40,000
45,000
50,000
55,000
2017 2018 2023 2028 2033
Gros
s Fl
oor A
rea
(sqm
)
Current Net Position Inflow + Local Sustainable Current Supply
28
Pukekohe Town Centre
& Fringes2011 2012 2013 2014 2015 2016
Industrial 5% 6% 5% 5% 6% 8%
Retail 33% 30% 29% 29% 31% 32%
Commercial 34% 36% 36% 37% 34% 31%
Other 28% 27% 30% 29% 28% 29%
Total 100% 100% 100% 100% 100% 100%

29

30
Light Industrial Zoned LandOccupied Land
Area (ha)
Vacant Land Area
(ha)
Zoned Land Area
(ha)
Paerata 14.2 14.2
Pukekohe North 25.8 2.5 28.3
Pukekohe South 37.4 5.9 43.3
Buckland 2.2 2.2
Pokeno 10.0 24.2 34.2
Total 89.5 32.7 122.1
Other Industrial Zoning
(Within Catchment)
Occupied Land
Area (ha)
Vacant Land Area
(ha)
Zoned Land Area
(ha)
Tuakau N/A N/A 121.6
Pokeno N/A N/A 52.9
Other Industrial Zoning
(Close Proximity)
Occupied Land
Area (ha)
Vacant Land Area
(ha)
Zoned Land Area
(ha)
Drury South N/A N/A 331.5
Waiuku N/A N/A 111.0
Glenbrook N/A N/A 361.2
LIGHT INDUSTRIAL ZONED LAND ANALYSIS

31

32

33
2000 2006 2012 2013 2014 2015 2016
A05 Agriculture, Forestry and Fishing Support Services 195 115 120 101 139 126 94
B10 Exploration and Other Mining Support Services 0 9 0 0 0 0 0
C16 Printing 18 27 18 18 18 18 15
C25 Furniture and Other Manufacturing 137 50 9 12 21 15 21
E30 Building Construction 127 202 166 190 234 267 325
E32 Construction Services 327 501 447 502 557 548 620
F Wholesale Trade 757 783 681 671 741 716 690
I49 Air and Space Transport 0 0 0 0 0 0 0
I51 Postal and Courier Pick-up and Delivery Services 92 25 24 21 21 21 18
I53 Warehousing and Storage Services 3 27 12 27 27 34 45
Total Light Industry 1,656 1,739 1,477 1,542 1,758 1,745 1,828
LIGHT INDUSTRIAL IN THE CORE CATCHMENT

34
10.1. EMPLOYMENT AND LAND FORECAST 2016-2033

35
Light Industrial Activity Growth 2016 - 2033 2016 2033Net Growth
(2016 - 2033)
Light Industrial Employment 1,828 2,667 839
Net Additional Land Requirement (ha) 41.3
•
•
•
•
•
TABLE 8: CORE CATCHMENT LIGHT INDUSTRIAL EMPLOYMENT FORECAST 2016 – 2033

36

37
AUCKLAND UNITARY PLAN CONSIDERATIONS

38
SUMMARY

39

40
APPENDIX 1: PROPOSED DEVELOPMENT PLAN

41
CORE CATCHMENT FRANKLIN DISTRICT AUCKLAND REGION
Population 39,000 74,850 1,614,600
Households 14,550 27,250 546,000
Person Per Dwelling Ratio 2.68 2.75 2.96
0–4 Years 8% 7% 7%
5–9 Years 8% 8% 7%
10–14 Years 8% 8% 7%
15–19 Years 7% 7% 7%
20–24 Years 6% 5% 8%
25–29 Years 5% 4% 7%
30–34 Years 5% 5% 7%
35–39 Years 7% 6% 7%
40–44 Years 8% 8% 7%
45–49 Years 7% 8% 7%
50–54 Years 7% 8% 7%
55–59 Years 6% 6% 6%
60–64 Years 5% 6% 5%
65 years and Over 13% 14% 12%
$20,000 or Less 8% 8% 10%
$20,001–$30,000 10% 10% 8%
$30,001–$50,000 16% 16% 15%
$50,001–$70,000 13% 13% 13%
$70,001–$100,000 20% 19% 18%
$100,001 or More 32% 34% 36%
$5,000 or Less 14% 14% 18%
$5,001–$10,000 5% 4% 6%
$10,001–$20,000 17% 17% 15%
$20,001–$30,000 13% 13% 12%
$30,001–$50,000 21% 21% 20%
$50,001 or More 30% 31% 29%
European Ethnic Groups 70% 74% 54%
Mäori Ethnic Group 16% 14% 10%
Pacific Peoples' Ethnic Groups 5% 4% 13%
Asian Ethnic Groups 7% 5% 21%
MELAA Ethnic Groups 0% 0% 2%
Other Ethnic Groups 1% 1% 1%
No Qualification 25% 24% 17%
Level 1 Certificate 16% 16% 11%
Level 2 Certificate 12% 12% 10%
Level 3 Certificate 7% 7% 11%
Level 4 Certificate 12% 12% 8%
Level 5 or Level 6 Diploma 9% 9% 9%
Bachelor Degree and Level 7 Qualifications 10% 10% 17%
Postgraduate and Honours Degrees 2% 2% 3%
Masters Degree 1% 1% 4%
Doctorate Degree 0% 0% 1%
Overseas Secondary School Qualification 6% 6% 11%
PER
SON
AL
INC
OM
EET
HN
ICIT
YQ
UA
LIFI
CA
TIO
N
ATT
AIN
MEN
TG
ENER
AL
AG
E P
RO
FILE
HO
USE
HO
LD
INC
OM
E
APPENDIX 2: DEMOGRAPHIC PROFILING

42
CORE CATCHMENT FRANKLIN DISTRICT AUCKLAND REGION
Employed - Full Time 51% 52% 49%
Employed - Part Time 14% 14% 13%
Unemployed 5% 4% 5%
Not in Labour Force 30% 29% 33%
Managers 20% 22% 19%
Professionals 18% 17% 26%
Technicians and Trades Workers 14% 14% 11%
Community and Personal Service Workers 8% 8% 9%
Clerical and Administrative Workers 13% 12% 13%
Sales Workers 10% 9% 10%
Machinery Operators and Drivers 7% 7% 5%
Labourers 11% 11% 7%
Full Time 8% 8% 13%
Part Time 4% 3% 4%
Full-time and Part-time Study 0% 0% 0%
Not Studying 88% 89% 83%
Wages, Salary, Commissions, Bonuses etc 70% 70% 73%
Self-employment or Business 23% 28% 24%
Interest, Dividends, Rent, Other Invest. 24% 25% 28%
Payments from a Work Accident Insurer 1% 2% 1%
NZ Superannuation or Veterans Pension 20% 21% 19%
Other Super., Pensions, Annuities 3% 4% 3%
Unemployment Benefit 4% 3% 4%
Sickness Benefit 3% 3% 4%
Domestic Purposes Benefit 5% 5% 5%
Invalids Benefit 2% 2% 2%
Student Allowance 2% 2% 5%
Other Govt Benefits, Payments or Pension 6% 6% 6%
Other Sources of Income 2% 2% 3%
No Source of Income During That Time 0% 0% 1%
Agriculture, Forestry and Fishing 9% 12% 1%
Mining 0% 0% 0%
Manufacturing 12% 12% 10%
Electricity, Gas, Water and Waste Services 1% 1% 1%
Construction 10% 10% 7%
Wholesale Trade 8% 7% 7%
Retail Trade 10% 9% 10%
Accommodation and Food Services 4% 4% 6%
Transport, Postal and Warehousing 5% 5% 5%
Information Media and Telecommunications 1% 1% 3%
Financial and Insurance Services 3% 3% 5%
Rental, Hiring and Real Estate Services 3% 3% 3%
Professional, Scientific and Technical Services 7% 7% 12%
Administrative and Support Services 3% 3% 4%
Public Administration and Safety 4% 3% 4%
Education and Training 8% 8% 8%
Health Care and Social Assistance 8% 8% 9%
Arts and Recreation Services 1% 2% 2%
Other Services 4% 4% 4%
HO
USE
HO
LD IN
CO
ME
SOU
RC
ESIN
DU
STR
Y O
F EM
PLO
YM
ENT
EMP
LOY
MEN
TEM
PLO
YM
ENT
CLA
SSIF
ICA
TIO
N
STU
DEN
T
RA
TIO

43
CORE CATCHMENT FRANKLIN DISTRICT AUCKLAND REGION
Single 19% 19% 19%
Couple 28% 31% 27%
Single Parent With Children 14% 13% 14%
Two Parent Family 35% 34% 35%
Other Multi-person 3% 3% 5%
1 Residents 19% 19% 18%
2 Residents 33% 35% 30%
3 Residents 18% 17% 18%
4 Residents 17% 17% 18%
5 Residents 8% 7% 8%
6 Residents 3% 3% 4%
7 Residents 1% 1% 2%
8 Plus Residents 1% 1% 2%
Dwelling Owned or Partly Owned 53% 55% 46%
Dwelling Not Owned and Not Held in a Family Trust 33% 29% 39%
Dwelling Held in a Family Trust 14% 15% 15%
0 Years 21% 19% 23%
1–4 Years 32% 30% 31%
5–9 Years 23% 23% 21%
10–14 Years 10% 11% 11%
15–29 Years 10% 12% 11%
30 Years or More 4% 4% 4%
One Bedroom 3% 4% 7%
Two Bedrooms 13% 12% 20%
Three Bedrooms 47% 45% 41%
Four Bedrooms 29% 30% 23%
Five Bedrooms 6% 7% 7%
Six Bedrooms 1% 1% 1%
Seven Bedrooms 0% 0% 0%
Eight or More Bedrooms 0% 0% 0%
Under $100 6% 4% 8%
$100–$149 6% 6% 5%
$150–$199 3% 5% 3%
$200–$249 6% 9% 4%
$250–$299 18% 18% 8%
$300–$349 22% 21% 13%
$350 and Over 39% 37% 59%
YEA
RS
AT
RES
IDEN
CE
NU
MB
ER O
F B
EDR
OO
MS
WEE
KLY
REN
T P
AID
HO
USE
HO
LDS
NU
MB
ER O
F R
ESID
ENTS
HO
ME
OW
NER
SHIP

44
APPENDIX 3: FOOD RETAILING – ANZSIC06
Division G – Retail Trade
Subdivision 41 – Food Retailing
•
•
•
•
•
•
•
•
•
•
•

45
•
•
•
•
•
•
•
•
•
•
•
•
•
•

46
APPENDIX 4: PROPERTY ECONOMICS RETAIL EXPENDITURE MODEL

47
•
•
•
•
•
•
•
•
•
•
•

48

49
50

51