New Techniques for Using Old Geophysical Logs in Reservoir Characterization
25
1 New Techniques for Using Old Geophysical Logs in Reservoir Characterization: Examples from Bell Canyon Sandstones, Ford Geraldine and East Ford Units, Delaware Basin, Texas Shirley P. Dutton ( shirley [email protected]; 512-471-0329) Bureau of Economic Geology The University of Texas at Austin Austin, TX 78713 George B. Asquith ( [email protected]; 806-742-3154) Department of Geosciences Texas Tech University Lubbock, TX 79409 William A. Flanders ( [email protected]; 915-686-7209) Transpetco Engineering of the Southwest, Inc. Midland, TX 79701 Jose I. Guzman ( [email protected]; 512-471-1534) Helena H. Zirczy ( [email protected]; 512-471-1534) Bureau of Economic Geology The University of Texas at Austin Austin, TX 78713 Research sponsored by the U.S. Department of Energy’s National Petroleum Technology Office, under contract number DE-FC22-95BC14936 with the Bureau of Economic Geology, The University of Texas at Austin, University Station, Box X, Austin, TX 78713-8924, telefax: 512-471-0140, [email protected]. INTRODUCTION Many mature oil fields in the United States have old, incomplete logging suites, and special techniques are required to maximize the information that can be derived from the old logs. In a study of the Ford Geraldine and East Ford units for a DOE Class III Oil Recovery Field Demonstration project, we developed a petrophysical approach that integrated traditional log- interpretation techniques with new methods in order to perform quantitative petrophysical interpretations using old logs. The ability to use the old logs was critical to characterizing the sandstone reservoir interval in these mature oil fields.
-
Upload
suta-vijaya -
Category
Documents
-
view
238 -
download
5
Transcript of New Techniques for Using Old Geophysical Logs in Reservoir Characterization

1
New Techniques for Using Old Geophysical Logs in ReservoirCharacterization: Examples from Bell Canyon Sandstones,Ford Geraldine and East Ford Units, Delaware Basin, Texas
Shirley P. Dutton ([email protected]; 512-471-0329)Bureau of Economic Geology
The University of Texas at AustinAustin, TX 78713
George B. Asquith ([email protected]; 806-742-3154)Department of Geosciences
Texas Tech UniversityLubbock, TX 79409
William A. Flanders ([email protected]; 915-686-7209)Transpetco Engineering of the Southwest, Inc.
Midland, TX 79701
Jose I. Guzman ([email protected]; 512-471-1534)Helena H. Zirczy ([email protected]; 512-471-1534)
Bureau of Economic GeologyThe University of Texas at Austin
Austin, TX 78713
Research sponsored by the U.S. Department of Energy’s National Petroleum Technology Office,under contract number DE-FC22-95BC14936 with the Bureau of Economic Geology, TheUniversity of Texas at Austin, University Station, Box X, Austin, TX 78713-8924,telefax: 512-471-0140, [email protected].
INTRODUCTION
Many mature oil fields in the United States have old, incomplete logging suites, and special
techniques are required to maximize the information that can be derived from the old logs. In a
study of the Ford Geraldine and East Ford units for a DOE Class III Oil Recovery Field
Demonstration project, we developed a petrophysical approach that integrated traditional log-
interpretation techniques with new methods in order to perform quantitative petrophysical
interpretations using old logs. The ability to use the old logs was critical to characterizing the
sandstone reservoir interval in these mature oil fields.
Suta Vijaya
Typewritten Text
http://www.netl.doe.gov/kmd/cds/disk32/ng2b-5.pdf
Suta Vijaya
Typewritten Text
Suta Vijaya
Typewritten Text
Suta Vijaya
Typewritten Text
Suta Vijaya
Typewritten Text
Suta Vijaya
Typewritten Text
Suta Vijaya
Typewritten Text
Suta Vijaya
Typewritten Text

2
The Ford Geraldine and East Ford units produce from deep-water turbidite deposits of the
Permian Delaware Mountain Group in Reeves and Culberson Counties, Texas (fig. 1). The main
reservoir in both units is the Ramsey sandstone in the upper Bell Canyon Formation. The goal of
the study is to demonstrate that reservoir characterization can optimize enhanced oil recovery
(CO2 flood) projects in slope and basin clastic reservoirs of the Delaware Mountain Group. The
objective is to increase production and prevent premature abandonment of reservoirs in mature
fields in the Delaware Basin of West Texas and New Mexico. Current production from Delaware
Mountain Group reservoirs is only 14 percent of an original 1.8 Bbbl of oil in place, which
provides a clear opportunity for improved recovery.
A key task of reservoir characterization was to quantify and map reservoir properties such
as porosity, permeability, water saturation, and net pay in the two units. To accomplish this, we
used traditional petrophysical methods combined with new techniques we developed in the Ford
Geraldine unit. This petrophysical approach was then used to characterize the East Ford unit,
providing an excellent opportunity to test the transferability of the log-interpretation methods to
another field in the Delaware sandstone play.
OBJECTIVE
Primary recovery efficiency is low in Delaware Mountain Group reservoirs because of
serious producibility problems, particularly low reservoir energy and high water production.
Unless methodologies and technologies to overcome these producibility problems are applied,
much of the remaining oil in Delaware sandstone fields will not be recovered. Our objective in
conducting reservoir-characterization studies of the Ford Geraldine and East Ford units was to
provide insights that are applicable to all slope and basin clastic fields in the Delaware Basin.
The technologies used for reservoir characterization included subsurface log, core-analysis,
and petrophysical study. Petrophysical analysis was complicated by the incomplete nature of the
logging suites in both units. In the Ford Geraldine unit, 118 wells have no porosity logs, and of
the remaining 187 wells, 84 of them have only old neutron logs. Only 38 wells have both

3
Fig
ure
1. L
ocat
ion
of E
ast
For
d an
d G
eral
dine
For
d fie
lds
in R
eeve
s an
d C
ulbe
rson
Cou
ntie
s, T
exas
. P
rodu
ctio
n fr
om t
hese
and
oth
erup
per
Bel
l Can
yon
field
s in
the
Del
awar
e B
asin
occ
urs
from
the
dist
al (
sout
hwes
t) e
nds
of e
ast-
dipp
ing,
nor
thea
st-o
rient
ed li
near
tren
dsof
thic
k R
amse
y sa
ndst
one
depo
sits
. Mod
ified
from
Rug
gier
o (1
985)
, afte
r H
iss
(197
5) a
nd W
illia
mso
n (1
978)
.
QA
a651
5(a)
c
CULBERSON COREEVES CO
LOVING COWINKLER CO
NE
W M
EX
ICO
NE
W M
EX
ICO
NE
W M
EX
ICO
TE
XA
S
EDDY COLEA CO
GU
AD
ALU
PE
MO
UN
TAIN
SG
UA
DA
LUP
E M
OU
NTA
INS
GU
AD
ALU
PE
MO
UN
TAIN
S
Gua
dalu
peR
idg
e
Eas
tE
ast
Eas
tF
ord
For
dF
ord
Ger
aldi
ne F
ord
Ger
aldi
ne F
ord
Ger
aldi
ne F
ord
-1000-1000-1000
-2000-2000-2000
-3000-3000-3000
-4000-4000-4000
-5000-5000-5000
PPPEEE
CCCOOO
SSS
RRR III VVV EEE RRR
0 030
km30
mi
Pro
duct
ion
from
Ram
sey
sand
ston
eR
amse
y sa
ndst
one
> 2
0 ft
Str
uctu
re c
onto
ur o
n to
p of
Ram
sey
sand
ston
e
N-3000-3000-3000
Afte
r R
uggi
ero
(198
5), W
. L. H
iss
(197
5), a
nd C
. R. W
illia
mso
n (1
978)
Out
crop
Out
crop
Out
crop
stud
yst
udy
stud
yar
eaar
eaar
ea
DA
TU
M: G
roun
d el
evat
ion
DA
TU
M: G
roun
d el
evat
ion
DA
TU
M: G
roun
d el
evat
ion
She
lf m
argi
n

4
porosity and resistivity logs. In the East Ford unit, only 26 of the 45 wells have porosity logs,
and only 17 wells have both porosity and resistivity logs. The old gamma-ray and neutron logs
were run by many different companies at different scales and sensitivities. Because of these
problems, not all of the methods of a modern petrophysical analysis (Asquith and Gibson, 1982)
could be used. Thus, the objective of the petrophysical characterization of the Ford Geraldine
and East Ford units was to develop a method of log interpretation that would combine traditional
techniques with some new methods and allow quantitative petrophysics to be accomplished with
the old logs.
APPROACH
Our approach to quantitative petrophysical analysis using old log suites was developed in
the Ford Geraldine unit because of the abundant core and core-analysis data available. We started
from traditional methods of log interpretation (Asquith and Gibson, 1982) and integrated them
with new methods for (1) determining true formation resistivity (Rt) from Deep Laterologs
(LLD) and (2) calculating saturation exponent (n) using core porosity and water-saturation
values from relative permeability curves. Much of the approach, but not all, was transferred
successfully to the East Ford unit, where the technique was modified to calculate water
saturation. In fields like those of the Delaware Mountain Group with poor, incomplete data, there
is probably no unique solution to log interpretation that will always be successful. Instead, it is
necessary to try a variety of techniques and to test their validity using all available information
about the field.
PROJECT DESCRIPTION
Ford Geraldine Unit
Petrophysical characterization of the Ford Geraldine unit was accomplished by integrating
core and log data and quantifying petrophysical properties from wireline logs (fig. 2); the goal

5
Figure 2. Flow chart of petrophysical analysis of the Ford Geraldine unit.
Normalize gamma-ray logs
ave
Map average bulk-volume
water (BVW ) in wells
with resistivity logs
QAb7683c
Map net pay using these cutoffs:
Sw < 60 percent
Vcl ≤ 15 percent
φ ≥ 15 and 20 percent
Map φ - ft, k-ft,
So × φ × h,
residual oil saturation,
mobile oil saturation
Determine true formationresistivity (Rt) from deeplaterolog - Rt transform
Formation water resistivity(Rw) from salinity map
Archie parameters m and nfrom core and log data
Calculate water saturation(SW) from modified Archie
equation in wells with resistivity logsUse reduced-major axis
equations to calculateporosity in wells with sonic
or neutron logs
Plot core porosity vs. intervaltransit time
Plot core porosity vs. corrected neutron plorosity
Correct neutron porosity for Vcl
Determine volume of clay(Vcl)
Normalize neutron logs toneutron porosity
Calculate Sw from BVWave
in wells without
resistivity logs
Sw = BVW/porosity
6
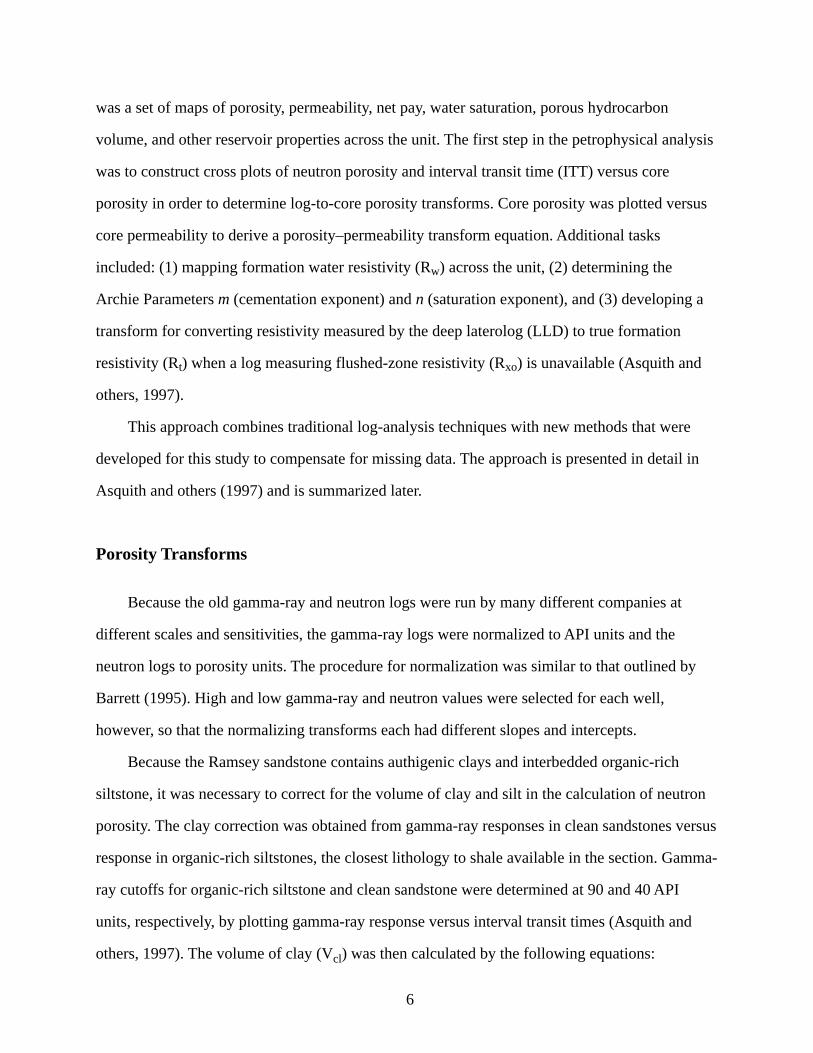
was a set of maps of porosity, permeability, net pay, water saturation, porous hydrocarbon
volume, and other reservoir properties across the unit. The first step in the petrophysical analysis
was to construct cross plots of neutron porosity and interval transit time (ITT) versus core
porosity in order to determine log-to-core porosity transforms. Core porosity was plotted versus
core permeability to derive a porosity–permeability transform equation. Additional tasks
included: (1) mapping formation water resistivity (Rw) across the unit, (2) determining the
Archie Parameters m (cementation exponent) and n (saturation exponent), and (3) developing a
transform for converting resistivity measured by the deep laterolog (LLD) to true formation
resistivity (Rt) when a log measuring flushed-zone resistivity (Rxo) is unavailable (Asquith and
others, 1997).
This approach combines traditional log-analysis techniques with new methods that were
developed for this study to compensate for missing data. The approach is presented in detail in
Asquith and others (1997) and is summarized later.
Porosity Transforms
Because the old gamma-ray and neutron logs were run by many different companies at
different scales and sensitivities, the gamma-ray logs were normalized to API units and the
neutron logs to porosity units. The procedure for normalization was similar to that outlined by
Barrett (1995). High and low gamma-ray and neutron values were selected for each well,
however, so that the normalizing transforms each had different slopes and intercepts.
Because the Ramsey sandstone contains authigenic clays and interbedded organic-rich
siltstone, it was necessary to correct for the volume of clay and silt in the calculation of neutron
porosity. The clay correction was obtained from gamma-ray responses in clean sandstones versus
response in organic-rich siltstones, the closest lithology to shale available in the section. Gamma-
ray cutoffs for organic-rich siltstone and clean sandstone were determined at 90 and 40 API
units, respectively, by plotting gamma-ray response versus interval transit times (Asquith and
others, 1997). The volume of clay (Vcl) was then calculated by the following equations:

7
IGR=(GR – 40)/(90 – 40);
Vcl = 0.33[2(2 × IGR) – 1.0] (Atlas Wireline, 1985),
where IGR = gamma-ray index and GR = gamma-ray value from log. The Vcl was used to
correct the normalized neutron porosity by multiplying by (1.0 – Vcl) (Asquith and others, 1997).
Interval transit time (ITT) logs and normalized and clay-corrected neutron logs were then
correlated to core porosity by reduced major axis regression (Asquith and others, 1997). The
resulting equations for porosity are as follows:
Porosity (percent) = (0.59 × ITT) – 31.5
Porosity (percent) = (1.11 × clay-corrected neutron porosity) + 0.67
Calculation of Water Saturation
Resistivity logs are electric logs that are used to determine hydrocarbon-versus-water-
bearing zones (Asquith and Gibson, 1982). Resistivity logs can be used to calculate water
saturation in a formation if several parameters are known, including (1) formation water
resistivity (Rw), (2) true formation resistivity (Rt), (3) Archie’s cementation exponent (m), and
(4) Archie’s saturation exponent (n) (Archie, 1942). Rw values were calculated across the Ford
Geraldine unit from a map of prewaterflood salinity (Ruggiero, 1985; Asquith and others, 1997).
The Rw values at 75°F ranged from 0.11 to 0.18 ohm-m, with the highest values to the southwest.
True Formation Resistivity
Calculating accurate water saturations in the Ford Geraldine unit was difficult because a
deep laterolog (LLD) was commonly run without an accompanying log to measure either
flushed-zone resistivities (Microlaterolog, MLL or Microspherically Focused Log, MSFL) or
invaded-zone resistivities (Shallow Laterolog). These additional logs make it possible to correct
the resistivities of the partly invaded zone measured by the LLD to the true formation resistivity
(Rt) needed for calculation of accurate saturations. Without our applying this transform, water

8
saturations in wells with only LLD logs would be overestimated. To overcome this problem, a
linear regression transform was developed between Rt (as calculated in 12 Ford Geraldine unit
wells having both shallow-resistivity measurement tools run as well as the LLD) and the LLD
curve response (Asquith and others, 1997):
Rt = 1.3002× LLD + 0.3397.
To illustrate the importance of using this LLD–Rt transform to obtain Rt in wells having
only an LLD log, hydrocarbon pore-feet thickness was calculated in the Ramsey sandstone in a
typical well with and without the correction. When the transform is not used, original oil in place
(OOIP) is underestimated by 155,000 barrels in a 40-acre tract (Asquith and others, 1997).
Archie Parameters m and n
Special core analyses from a well in the Ford Geraldine unit (FGU-156) included four
measurements of the cementation exponent, m. The average of the measured m values was 1.88.
To verify the measured values, log data were used to back-calculate m from ITT porosity and
flushed-zone resistivity log values (Asquith and others, 1997). This method gave a value of m of
1.83, which was used in the modified Archie equation for the Ford Geraldine unit.
Special core analyses also measured saturation exponent (n), but the values were low
(average =1.32) and probably not accurate. For this reason, a new technique was developed
(Asquith and others, 1997) to calculate the value of n using core porosity and water-saturation
values from relative permeability curves by the following equation:
n = LOG(F × Rw/Rt)/LOG(Sw),
where:
n = saturation exponent,
F = 1/φ1.83 (φ is porosity),
Rw = formation water resistivity at formation temperature (0.092 ohm-m),
Rt = true formation resistivity (Rt = 1.67 × LLD – 0.67 × MLL), and
Sw = water saturation from relative permeability curves.
9
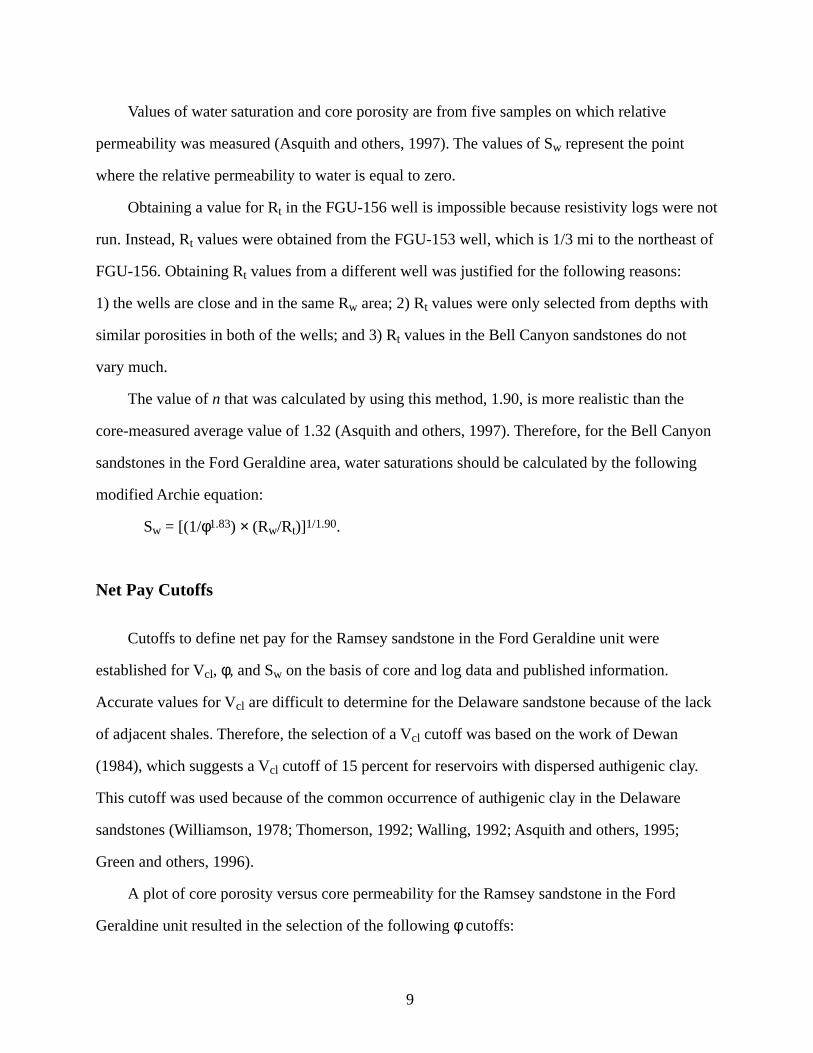
Values of water saturation and core porosity are from five samples on which relative
permeability was measured (Asquith and others, 1997). The values of Sw represent the point
where the relative permeability to water is equal to zero.
Obtaining a value for Rt in the FGU-156 well is impossible because resistivity logs were not
run. Instead, Rt values were obtained from the FGU-153 well, which is 1/3 mi to the northeast of
FGU-156. Obtaining Rt values from a different well was justified for the following reasons:
1) the wells are close and in the same Rw area; 2) Rt values were only selected from depths with
similar porosities in both of the wells; and 3) Rt values in the Bell Canyon sandstones do not
vary much.
The value of n that was calculated by using this method, 1.90, is more realistic than the
core-measured average value of 1.32 (Asquith and others, 1997). Therefore, for the Bell Canyon
sandstones in the Ford Geraldine area, water saturations should be calculated by the following
modified Archie equation:
Sw = [(1/φ1.83) × (Rw/Rt)]1/1.90.
Net Pay Cutoffs
Cutoffs to define net pay for the Ramsey sandstone in the Ford Geraldine unit were
established for Vcl, φ, and Sw on the basis of core and log data and published information.
Accurate values for Vcl are difficult to determine for the Delaware sandstone because of the lack
of adjacent shales. Therefore, the selection of a Vcl cutoff was based on the work of Dewan
(1984), which suggests a Vcl cutoff of 15 percent for reservoirs with dispersed authigenic clay.
This cutoff was used because of the common occurrence of authigenic clay in the Delaware
sandstones (Williamson, 1978; Thomerson, 1992; Walling, 1992; Asquith and others, 1995;
Green and others, 1996).
A plot of core porosity versus core permeability for the Ramsey sandstone in the Ford
Geraldine unit resulted in the selection of the following φ cutoffs:

10
φ ≤ 15 percent for a permeability of 1.0 md
φ ≤ 20 percent for a permeability of 5.0 md
Normalization of five relative permeability curves led to the selection of a Sw cutoff for net
pay at 60 percent, a value at which the relative permeability to oil is about eight times that of
permeability to water. The relative permeability curves were normalized by using the method
outlined by Schneider (1987).
East Ford Unit
Reservoir characterization of the East Ford unit provided an opportunity to test the
transferability of the log-interpretation methods used in the Ford Geraldine unit to another
Delaware sandstone field. Porosity transforms were developed for the East Ford unit, but the
LLD–Rt transform and the Archie parameters calculated for the Ford Geraldine unit were used in
the petrophysical analysis of the East Ford unit. It was not possible to develop these factors
specifically for the East Ford unit because it has a more restricted log suite and no special core
analyses.
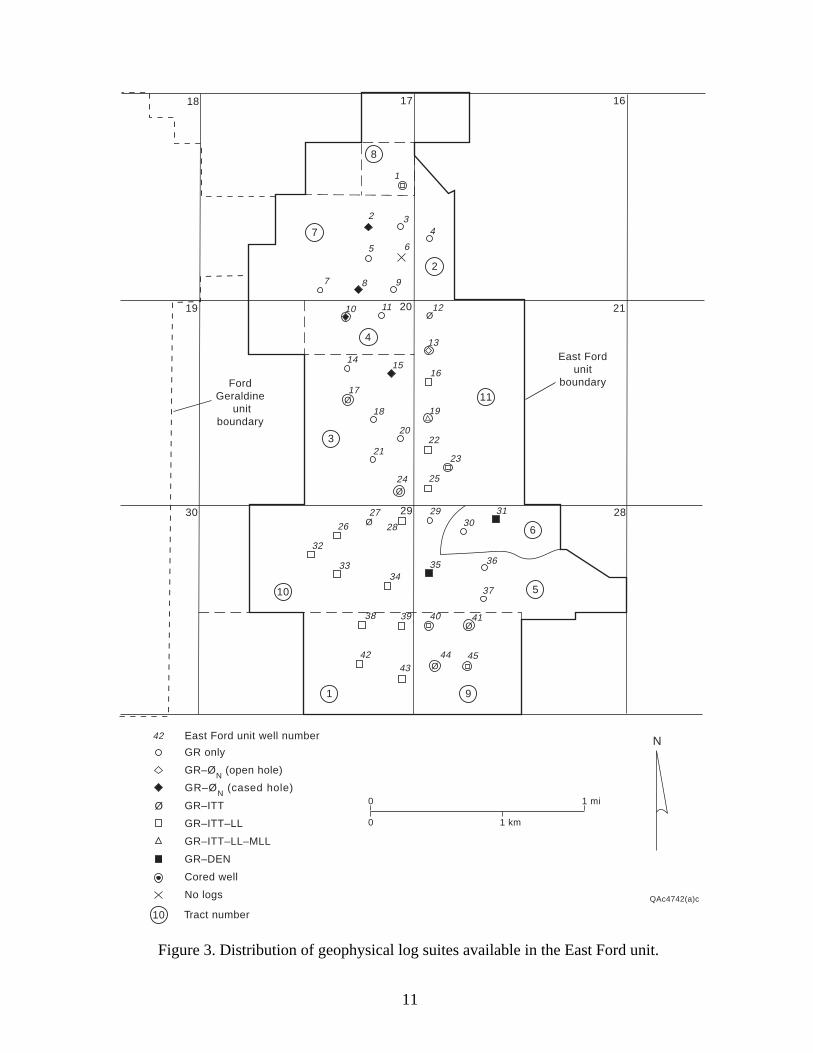
Only 26 wells in the East Ford unit have usable porosity logs. Four other wells have cased-
hole neutron logs (fig. 3), which were not used for quantitative petrophysical analysis. Because
interval-transit-time (ITT) logs were the most common, only the 23 ITT logs were used for
calculating porosity. Seventeen wells have both ITT and resistivity logs.
The gamma-ray logs in the East Ford unit were run in the early 1960’s by several different
companies at different sensitivities. They could not be directly compared, even though all but
one of the logs were recorded in API units, so the gamma-ray logs had to be normalized. High
and low GR values were selected for each well, giving them all different normalizing equations.
11
Figure 3. Distribution of geophysical log suites available in the East Ford unit.
Ø
Ø
Ø
Ø
8
7
2
4
3
11
6
10 5
91
10
0
0
1 mi
1 km
N
East Fordunit
boundary
QAc4742(a)c
GR only
Cored well
GR–ITT
GR–ITT–LL
GR–ITT–LL–MLL
GR–DEN
No logs
2830
19
18
21
1617
29
20
1
2 34
5 6
7 8 9
10 11 12
13
1415
16
18 19
17
2022
2123
24 25
3029 31
28
27
26
32
3433 36
37
35
41403938
4243
44 45
East Ford unit well number
FordGeraldine
unitboundary
42
GR–ØN
(open hole)
GR–ØN
(cased hole)
Ø
Ø
Ø
Tract number

12
Porosity Transforms
Core analyses from 334 samples of the Ramsey interval from 11 wells in the East Ford unit
were available, so we derived new porosity transforms instead of using the equations developed
in the Ford Geraldine unit. The least-squares linear regression line relating core porosity and
permeability is
Permeability (md) = 0.014 × 10^(0.144 × porosity) (fig. 4).
Core depths were shifted to log depths by using core-to-log correction factors determined
for each cored well. A cross plot of ITT versus core porosity was constructed to determine the
ITT-log to core-porosity transform (fig. 5). Several of the ITT logs had zones where the readings
went off scale (>100 µsec/ft) because of hole washout, and these intervals were omitted from the
plot of ITT versus porosity. The reduced-major-axis (RMA) equation relating ITT and core
porosity was used to determine porosity in wells having ITT logs. The RMA equation is
Porosity (percent) = 0.533 (ITT) – 26.5.
Because so few ITT logs were available in the East Ford unit, logs from wells with hole
washout were used in the petrophysical analysis. ITT values were extrapolated into the washed-
out zones from depths where the Ramsey sandstone had good log response, and these
extrapolated values were used to calculate porosity from the RMA equation.
Volume of Clay
Volume of clay (Vcl) was calculated from gamma-ray logs by the same method as the one
used in the Ford Geraldine unit. From a plot of ITT versus normalized gamma-ray response (GR)
from 16 wells in the East Ford unit (fig. 6), a GRcl value of 50 API and GRsh of 89 API were
selected. The Vcl for the Ramsey sandstone was then calculated by
IGR = (GR – 50)/(89 – 50), and
Vcl = 0.33[2^(2 × IGR) – 1.0] (Atlas Wireline, 1985),

13
Figure 4. Cross plot of core porosity versus core permeability with porosity–permeability transformfor the Ramsey sandstone in the East Ford unit, Reeves County, Texas.
Figure 5. Cross plot of interval transit time (ITT) versus core porosity with porosity transform forthe Ramsey sandstone in the East Ford unit.
3 02 01 00Core porosity (percent)
Permeability = 0.014 * 10^(0.144 x porosity)Permeability = 0.014 * 10^(0.144 x porosity)Permeability = 0.014 * 10^(0.144 x porosity)r = 0.79 n = 334
.01
.1
1
10
100
1000
Cor
e pe
rmea
bilit
y (m
d)
QAc4734c
Interval transit time (µsec/ft)
Cor
e po
rosi
ty (
perc
ent)
Porosity = (0.533 x ITT) - 26.5r = 0.54 n = 240
40 50 60 70 80 90 100 1100
10
20
30
QAc4735c

14
Figure 6. Cross plot of interval transit time (ITT) versus gamma ray (GR) for the Ramsey sandstoneinterval, East Ford unit. The data in this figure are from 16 wells, and the cross plot was used todetermine GRcl (50 API), GRsh (89 API), and ITTsh (72 µsec/ft).
10080604020
40
60
80
100
Interval transit time (µsec/ft)
n = 1,251
QAc5304c
GR sh = 89 API
GR clean ss = 50 API
ITT sh = 72 (µsec/ft)
Gam
m r
ay (
AP
I un
its)
15
where IGR is gamma-ray index. A map of Vcl distribution shows that low values occur in the
center of the East Ford unit, and Vcl increases toward the margins of the unit, where the Ramsey
sandstone pinches out into siltstone.
Calculation of Water Saturation
The same approach for calculating water saturation was followed in the East Ford unit as
was developed in the Ford Geraldine unit. Because only one Microlaterolog was run in the East
Ford unit, we used the transform developed in the Ford Geraldine unit, Rt = 1.3002 × LLD +
0.3397, to correct LLD to Rt in East Ford wells.
Formation-Water Resistivity
In preparation for calculating water saturations (Sw), we estimated formation-water
resistivities (Rw) across the Ford East unit from a contour map of formation-water salinities
(fig. 7). Salinity data from four wells in the East Ford unit (EFU 1, 9, 24, and 37) were combined
with those from the Ford Geraldine unit (Dutton and others, 1997a, b) to obtain a more regional
view of water salinity. The contour map of salinity was used to assign salinity values for each of
the East Ford wells. The formation-water resistivity at 75°F was then read from a chart relating
NaCl concentration, temperature, and resistivity (Schlumberger, 1995, chart Gen-9, p. 1–5).
Values of Rw at 75°F ranged from 0.10 to 0.12 ohm-m in the East Ford unit (fig. 7). Formation
temperatures in each well were calculated from the geothermal gradient in the field and the depth
of the middle of the Ramsey sandstone. Values of Rw at formation temperature were then
calculated by Arp’s formula (Asquith and Gibson, 1982): Rtf = Rtemp × (Temp + 6.77)/
( Tf + 6.77),
where
Rtf = resistivity at formation temperature,
Rtemp = resistivity at a temperature other than formation temperature,

16
Figure 7. Isosalinity map with formation-water resistivities (Rw) at 75°F for the East Ford unit.
42
24 25
3029
2827
26
32
31
36
37
3534
33
41403938
43
44 45
13
14 15
18 19
17
2022
2123
8 9
10 11 12
1
23
4
5 6
7
N
East Fordunit
boundary
QAc4743(b)c
2830
19
29
20 21
18 1617
East Ford unit well number
Well location
FordGeraldine
unitboundary
0
0
1 mi
1 km
42
16
Chloride concentration (values in 1000 ppm)
Formation-water resistivity at 75° FRw75
Rw75 = 0.11
656565
606060 656565 707070
606060
Rw75 = 0.10
Rw75 = 0.12
Rw75 = 0.11
Rw75 = 0.12
Rw75 = 0.11

17
Temp = temperature at which resistivity was measured, and
Tf = formation temperature.
Archie Parameters m and n
No special core analyses of cementation exponent (m) or saturation exponent (n) were
available from the East Ford unit, so the values of m and n determined for the Ramsey sandstone
in the Ford Geraldine unit (Asquith and others, 1997) were used. Water saturations (Sw) in the
East Ford unit were calculated by the same modified Archie equation that was developed for the
Ford Geraldine unit:
Sw = [(1/φ1.83) × (Rw/Rt)]1/1.90,
where φ is porosity.
Net-Pay Cutoffs
Net-pay cutoffs for the Ramsey sandstone in the East Ford Geraldine unit were selected for
volume of clay (Vcl), porosity (φ), and water saturation (Sw). The same Vcl cutoff of 15 percent
that was used for the Ford Geraldine unit was also applied to the Ford East unit. A porosity cutoff
of 17.5 percent, corresponding to a permeability of 5 md (fig. 4), was selected. A change in the
slope of the permeability distribution occurs at 5 md, and sandstones having permeability of
≥5 md probably represent the floodable Ramsey sandstones (Dutton and others, 1999b). No
relative permeability curves were available for the East Ford unit, so the water-saturation cutoff
of 60 percent was selected, the same cutoff that was used for the Ford Geraldine unit.
Saturation Distribution
As is common in Delaware sandstone reservoirs, the Ramsey sandstone at the East Ford
unit had high initial Sw, and many wells produced some water at discovery. The Ford Geraldine
18
unit averaged 47.7 percent Sw at discovery, well above the irreducible water saturation of
35 percent (Pittaway and Rosato, 1991), and the Ramsey sandstone at the East Ford unit
probably also had initial water saturation greater than irreducible. Average Sw measured in
334 core analyses of the Ramsey sandstones was 47.1 percent.
Areal distribution of Sw was mapped from geophysical log data supplemented by water-
saturation data from cores. First, we mapped the areal distribution of bulk volume water (BVW)
according to the formula Sw = BVWave/φ using log data from wells having both ITT and
resistivity logs (method described in Asquith and others, 1997). On the basis of this map, BVW
values were then assigned to wells having porosity logs but no resistivity logs. Average Sw
values were calculated in these wells then combined with Sw data from resistivity logs to map Sw
distribution in the East Ford unit. This approach resulted in many wells in the main producing
trend of the field having calculated Sw greater than 50 percent. Such high water saturations were
considered unreasonable because water cuts in these wells are low, so a new method for
calculating water saturation was developed.
A plot of all log-calculated Sw values versus percent water cut in initial potential tests had a
large scatter in the data. Data from some wells were thought to be invalid and were eliminated if
the wells fell into one of the following categories: (1) Wells completed only in the Olds
sandstone; these wells had high water cuts from the Olds sandstone that could not be equated to
the Sw calculated from the Ramsey sandstone. (2) Wells completed in both the Olds and Ramsey
sandstones having high water cuts; these wells probably produced mainly from the Olds
sandstone. (3) Wells without resistivity logs, for which Sw was calculated from the BVW map;
these wells had high calculated Sw values that were inconsistent with their low water cuts.
(4) Other wells with inconsistent log Sw and water-cut data. For a few wells, it was unclear why
the calculated Sw was high despite a low water cut, but these inconsistent wells were also
eliminated from the data base. The remaining data were used to calculate a linear regression line
relating water cut to Sw (fig. 8). A map of Sw across the East Ford unit (fig. 9) was then made
from the valid log-calculated Sw data (fig. 8) combined with Sw data calculated from the water-

19
Figure 8. Plot of valid log-calculated water saturation (Sw) versus percent water cut in initial potentialtests.
1008060402000.4
0.5
0.6
0.7
Initial potential water cut (percent)
Log-
calc
ulat
ed w
ater
sat
urat
ion
Water saturation = 0.44 + 0.0025 (water cut)
r2 = 0.94
12
1
38
25, 40
19
12
Well number
QAc5416c

20
Figure 9. Map of water saturation (Sw) of the Ramsey sandstone in the East Ford unit. The Swvalues are either valid log-calculated data (wells in figure 8) or calculated from the water-cut–Swtransform shown in figure 8.
QAc5400cWell controlWell number424242 Well value12
Contour interval 5 (percent)
N
0
0
1 mi
1 km
East Fordunit
boundary
50 50 50
45 45 45
44 44 44 44 44 44
54 54 54 48 48 48
44 44 44
44 44 44 45 45 45
46 46 46
68 68 68
46 46 46
44 44 44
44 44 44
49 49 49
49 49 49
49 49 49
49 49 49
44 44 44
44 44 44
44 44 44
44 44 44
464646
44 44 44 45 45 45
44 44 44
44 44 44
44 44 44 48 48 48
46 46 46
45 45 45 48 48 48
50 50 50 50 50 50
57 57 57
47 47 47
45 45 45
48 48 48
48 48 48
111
222 333444
555 666
777 888 999
101010 111111 121212
131313
141414151515
161616
181818 191919
202020222222
212121
232323
242424 252525
303030292929 313131272727
363636
373737
353535
414141404040393939383838
434343
444444 454545
343434
454545505050
454545
555555
606060454545
454545
505050505050
282828303030
191919
181818
212121
161616171717
292929
202020

21
cut– Sw transform. Values of Sw ranged from 44 to 55 percent across most of the field and
averaged 48 percent. Sw increases to the east and northeast, which is to be expected because that
direction is down structural dip.
RESULTS
Most aspects of the log-interpretation methodology developed for the Ford Geraldine unit
were used successfully in the East Ford unit. The approach that was used to interpret water
saturation from resistivity logs had to be modified because in some East Ford wells, the log-
calculated water saturation was too high and inconsistent with the actual production. In addition,
the use of bulk-volume water mapping to determine water saturation in wells having no
resistivity logs did not yield results consistent with production. A cross plot of valid log-
calculated water-saturation versus water-cut data provided a transform that was used to estimate
water-saturation from water-cut data in wells without good resistivity logs.
The ability to do quantitative petrophysical analysis allowed us to map porosity,
permeability, net pay, water saturation, porous hydrocarbon volume, and other reservoir
properties in both units (Dutton and others, 1997a, b; 1999a) despite having old, incomplete log
suites. This information, when combined with the primary production data, allowed us to
determine the volume and distribution of remaining oil in place, which is the target of tertiary
recovery.
APPLICATION
The approach to petrophysical analysis that was developed in the Ford Geraldine unit can be
used in other fields in the Delaware sandstone play, as demonstrated by the successful transfer of
the log-interpretation methods to the East Ford unit. Core-analysis and log data from the field
being studied should be used to the greatest extent possible, but where they do not exist, the Ford
Geraldine values provide a reasonable substitute. For example, if core-analysis data are

22
available, they should be used to develop core-porosity to log-porosity transforms specific to that
field, but in a field having no core analyses, the transforms developed in the Ford Geraldine unit
can be used instead. Similarly, if a field has both Laterologs (LLD) and accompanying
Microlaterologs, Microspherically Focused Logs, or Shallow Laterologs, an Rt –LLD transform
specific to that field should be developed, but if these logs are not available, the Ford Geraldine
equation can be used instead. Unless special core analyses have determined m and n in a field,
the values determined for these parameters in the Ford Geraldine unit are the best data available,
and water saturations should be calculated by the following modified Archie equation:
Sw = [(1/φ1.83) × (Rw/Rt)]1/1.90.
When applying this method of petrophysical analysis to a new field, it is important to
compare the results with other field information, such as production data. In fields with poor,
incomplete data, there is probably no unique solution to log interpretation that will always be
successful. Instead, it is necessary to try a variety of techniques and to test their validity using all
available information about the field.
FUTURE ACTIVITIES
In the next phase of this project we will apply the knowledge gained from the reservoir
characterization to increase recovery from the East Ford unit through an enhanced-recovery
program (CO2 flood). Detailed comparison will be made between production from the East Ford
unit during the CO2 flood with the predictions that were made during the reservoir-
characterization phase on the basis of simulations. This comparison will provide an important
opportunity to test the accuracy of reservoir characterization as a predictive tool in resource
preservation of mature fields. Through technology transfer, the knowledge gained in the study of
the East Ford and Ford Geraldine units can be applied to increase production from the more than
100 other Delaware Mountain Group reservoirs in West Texas and New Mexico, which together
contain 1,558 MMbbl of remaining oil.
23
ACKNOWLEDGMENTS
This research was funded by the U.S. Department of Energy under contract no. DE-FC22-
95BC14936 and by the State of Texas under State Match Pool Project 4201 and as part of the
State of Texas Advanced Resource Recovery project. The NPTO Contracting Officer’s
Representative is Daniel Ferguson, and the period of performance is March 31, 1995, through
August 31, 2000. The Bureau of Economic Geology acknowledges support of this research by
Landmark Graphics Corporation via the Landmark University Grant Program. Drafting was by
the Graphics staff of the Bureau of Economic Geology under the direction of Joel L. Lardon.
Others contributing to the publication of this report were Susan Lloyd, word processing, and
Lana Dieterich, editing.
REFERENCES
Archie, G. E., 1942, The electrical resistivity log as an aid in determining some reservoircharacteristics: Petroleum Technology, v. 5, p. 54–62.
Asquith, G. B., Dutton, S. P., Cole, A. G., Razi, M., and Guzman, J. I., 1997, Petrophysics of theRamsey sandstone, Ford Geraldine Unit, Reeves and Culberson Counties, Texas, in DeMis,W. D., ed., Permian Basin oil and gas fields: turning ideas into production: West TexasGeological Society, Publication No. 97-102, p. 61–69.
Asquith, G. B., and Gibson, C. R., 1982, Basic well log analysis for geologists: American Associationof Petroleum Geologists, Methods in Exploration Series, 216 p.
Asquith, G. B., Thomerson, M. D., and Arnold, M. D., 1995, The recognition of possible oil andwater wettability changes in the Permian Delaware Mountain Group sandstones frompetrophysical well logs, in Martin, R. L., ed., In search of new Permian Basin oil and gasfields: West Texas Geological Society Fall Symposium, Publication 95-98, p. 39–50.
Atlas Wireline, 1985, Log interpretation charts: Houston, Texas, Atlas Wireline Services, WesternAtlas International, Inc., 203 p.
Barrett, D. G., 1995, Use of computers to perform old log analysis, in Martin, R. L., ed., In searchof new Permian Basin oil and gas fields: West Texas Geological Society Fall Symposium,Publication 95-98, p. 31–38.
24
Dewan, J. T., 1984, Essentials of modern open-hole log interpretation: Tulsa, Oklahoma, PennWellPublishing Co., 345 p.
Dutton, S. P., Asquith, G. B., Barton, M. D., Cole, A. G., Gogas, J., Malik, M. A., Clift, S. J., andGuzman, J. I., 1997a, Application of advanced reservoir characterization, simulation, andproduction optimization strategies to maximize recovery in slope and basin clastic reservoirs,West Texas (Delaware Basin): The University of Texas at Austin, Bureau of Economic Geology,annual report prepared for the U.S. Department of Energy, DOE/BC/14936-9, 187 p.
Dutton, S. P., Barton, M. D., Asquith, G. B., Malik, M. A., Cole, A. G., Gogas, J., Guzman, J. I., andClift, S. J., 1999a, Geologic and engineering characterization of turbidite reservoirs, FordGeraldine Unit, Bell Canyon Formation, West Texas: The University of Texas at Austin, Bureauof Economic Geology Report of Investigations No. 255, 88 p.
Dutton, S. P., Flanders, W. A., Guzman, J. I., and Zirczy, H. H., 1999b, Application of advancedreservoir characterization, simulation, and production optimization strategies to maximizerecovery in slope and basin clastic reservoirs, West Texas (Delaware Basin): The Universityof Texas at Austin, Bureau of Economic Geology, annual report prepared for the U.S.Department of Energy, DOE/BC/14936-11, OSTI ID: 7432, 106 p.
Dutton, S. P., Malik, M. A., Clift, S. J., Asquith, G. B., Barton, M. D., Cole, A. G., Gogas, J., andGuzman, J. I., 1997b, Geologic and engineering characterization of Geraldine Ford field, Reevesand Culberson Counties, Texas: The University of Texas at Austin, Bureau of EconomicGeology, topical report prepared for the U.S. Department of Energy, 115 p.
Green, K. M., Frailey, S. M., and Asquith, G. B., 1996, Water-flood feasibility study of the BrushyCanyon K-2 zone Red Tank field, Lea County, New Mexico, in DeMis, W. D., and Cole, A. G.,eds., The Brushy Canyon play in outcrop and subsurface: concepts and examples: PermianBasin Section, SEPM, Publication No. 96-38, p. 165–171.
Hiss, W. L., 1975, Stratigraphy and groundwater hydrology of the Capitan aquifer, southeasternNew Mexico and western Texas: University of Colorado, Ph.D. dissertation, 396 p.
Pittaway, K. R., and Rosato, R. J., 1991, The Ford Geraldine unit CO2 flood—update 1990: Societyof Petroleum Engineers Reservoir Engineering, v. 6, no. 4, p. 410–414.
Ruggiero, R. W., 1985, Depositional history and performance of a Bell Canyon sandstone reservoir,Ford-Geraldine field, west Texas: The University of Texas at Austin, Master’s thesis, 242 p.
Schlumberger, 1995, Log interpretation charts: Houston, Schlumberger Wireline & Testing, variouslypaginated.
Schneider, F. N., 1987, Three procedures enhance relative permeability data: Oil and Gas Journal,March, p. 45–51.
25
Thomerson, M. D., 1992, Petrophysical analysis of the Brushy Canyon Formation, Hat MesaDelaware field, Lea County, New Mexico: Texas Tech University, Master’s thesis, 124 p.
Walling, S. D., 1992, Authigenic clay minerals in sandstones of the Delaware Mountain Group:Bell Canyon and Cherry Canyon Formations, Waha field, West Texas: Texas A&M University,Master’s thesis, 63 p.
Williamson, C. R., 1978, Depositional processes, diagenesis and reservoir properties of Permiandeep-sea sandstones, Bell Canyon Formation, Texas-New Mexico: The University of Texas atAustin, Ph.D. dissertation, 262 p.