
New Technique for Measuring and Controlling the Permeability of Polymeric Membranes
13
International Journal of Science and Engineering Applications Volume 4 Issue 5, 2015, ISSN-2319-7560 (Online) 314 ww.ijsea.com w New Technique for Measuring and Controlling the Permeability of Polymeric Membranes M. M. El-Tonsy Physics Department Faculty of Science Mansoura University Mansoura 35516, Egypt I. M. Fouda Physics Department Faculty of Science Mansoura University Mansoura 35516, Egypt M. A. Farid Physics Department Faculty of Science Mansoura University Mansoura 35516, Egypt Abstract: Membranes have wide uses in industry and medicine applications. Polymer membranes are important materials because of their high chemical resistance, but they are of weak mechanical resistance against high pressures. Therefore, it was essential to modify a permeability measuring technique free from high pressure application. The current work represented a modification for the permeability measuring technique of membranes, where ionic salt was added with known concentration to water as common solvent and the electrolyte current was measured behind the membrane. The electrolysis current was correlated to the flow rate of water across a polyvinyl alcohol (PVA) membrane. Some other problems were raised such that polarization on electrodes and changes in electrolyte contents during the long time of the slow process. Pulsed potential on electrodes resolved these problems and other associated problems like rush in current and the double layer capacitance effect. An empirical equation was suggested to evaluate the permeability of polymer membranes by this modified method. Easy and accurate measurement of permeability helped authors to change the permeability of PVA membranes by adding copper nano particles in membrane to reduce its permeability, and adding silicone dioxide micro particles to the PVA membranes to increase its permeability. Authors suggested a mechanism for these permeability changes. Scanning electron microscope images for the filled PVA membranes supported the suggested mechanism.
-
Upload
editor-ijcatr -
Category
Technology
-
view
161 -
download
0
Transcript of New Technique for Measuring and Controlling the Permeability of Polymeric Membranes

International Journal of Science and Engineering Applications
Volume 4 Issue 5 2015 ISSN-2319-7560 (Online)
314 wwijseacomw
New Technique for Measuring and Controlling the
Permeability of Polymeric Membranes
M M El-Tonsy
Physics Department
Faculty of Science
Mansoura University
Mansoura 35516 Egypt
I M Fouda
Physics Department
Faculty of Science
Mansoura University
Mansoura 35516 Egypt
M A Farid
Physics Department
Faculty of Science
Mansoura University
Mansoura 35516 Egypt
Abstract Membranes have wide uses in industry and medicine applications Polymer membranes are important materials
because of their high chemical resistance but they are of weak mechanical resistance against high pressures Therefore it was
essential to modify a permeability measuring technique free from high pressure application The current work represented a
modification for the permeability measuring technique of membranes where ionic salt was added with known concentration
to water as common solvent and the electrolyte current was measured behind the membrane The electrolysis current was
correlated to the flow rate of water across a polyvinyl alcohol (PVA) membrane Some other problems were raised such that
polarization on electrodes and changes in electrolyte contents during the long time of the slow process Pulsed potential on
electrodes resolved these problems and other associated problems like rush in current and the double layer capacitance effect
An empirical equation was suggested to evaluate the permeability of polymer membranes by this modified method Easy and
accurate measurement of permeability helped authors to change the permeability of PVA membranes by adding copper nano
particles in membrane to reduce its permeability and adding silicone dioxide micro particles to the PVA membranes to
increase its permeability Authors suggested a mechanism for these permeability changes Scanning electron microscope
images for the filled PVA membranes supported the suggested mechanism
International Journal of Science and Engineering Applications
Volume 4 Issue 5 2015 ISSN-2319-7560 (Online)
315 wwijseacomw
1 INTRODUCTION
Membrane operation or membrane processes may be regarded as
a unit operation in chemical engineering They are widely used
in industrial applications in different fields like chemicals food
gas water and wastewater treatment pharmaceuticals and more
Membrane systems are based on the use of synthetic membranes
that permit the concentration and separation of solutions without
thermal damage Particles are separated on the basis of their
molecular size and shape using pressure and specially designed
synthetic and semi-permeable membranes [1]
Membrane processes provide efficiency and operational
simplicity high selectivity and permeability for the transport of
certain components It is possible to achieve high compatibility
as between different membrane operations as between membrane
operations and traditional industrial
applications in integrated systems In order to analyze their
economic impact it is necessary for membrane processes to be
characterized by low operational energy good stability under
operative conditions environment compatibility easy scale-up
great flexibility and good control of effectiveness with the
possibility of reaching advanced levels of automation and remote
control [1] The most important property of membranes is their
ability to control the rate of permeation of different species [2]
The permeability is a measure of the ability of a porous medium
to transmit fluids measured in the units of length square or darcies
(1 D = 098692times10minus121198982) [3]
Two models used to describe the mechanism of permeation One
of them is the solution-diffusion model in which permeates
dissolve in the membrane material and then diffuse through the
membrane down a concentration gradient Permeates are
separated because of the differences in the solubility of the
materials in the membrane and the differences in the rates at
which the materials diffuse through the membrane [2] If a
concentration gradient of permeate molecules is formed in the
medium simple statistics show that a net transport of matter will
occur from the high concentration to the low concentration
region For example when two adjacent volume elements with
slightly different permeate concentrations are separated by an
interface then simply because of the difference in the number of
molecules in each volume element more molecules will move
from the concentrated side to the less concentrated side of the
interface than will move in the other direction This concept was
first recognized by Fick theoretically and experimentally [2] In
1856 Darcy investigated the flow of water through sand filters
for water purification [4]
By empirical observation Darcy noticed that fluid flow was
directly proportional to the hydraulic gradient [4] resulting in the
following equation
119902 = 119870119860ℎ2 minus ℎ1
119897
where 119902 represents the volumetric flow rate of water downward
through the cylindrical sand pack of cross-sectional area 119860 and
height 119897 ℎ1 and ℎ2 are the hydraulic head above the standard
datum of the water in the manometer located at the input and
output ports respectively and 119870 is a constant of proportionality
found to be characteristic of the rock media Most of the
techniques for measuring permeability are based on Darcys
equation where pressure (ℎ2 minus ℎ1) is essential parameter Many
polymeric membranes are deformed under pressure and hence
their surface areas are changed releasing markedly error
Therefore it is essential to develop the measuring technique in
order to measure the coefficient of permeability for thin
polymeric membranes with satisfactorily degree of accuracy
The current work aims to design setup and use a modified
measuring system for permeability of a thin polymer membrane
and then use this system as a very helpful technique for
measuring the change in permeability of polymeric membranes
2 THEORETICAL PRINCIPLE
To achieve the goals described in the previous section we start
by designing the system which we going to use in our study The
main idea is to detect and demonstrate the process of
permeability and diffusion through simple electrochemical
reaction To do this we going to design a system consist from two
chambers in the first one of them an electrolyte solution is
contained and the second one a free of ion solution is contained
The membrane under investigation is held in between of them In
this situation the system is kept under equilibrium and the static
pressure on both sides of the membrane is the same where 1198671 =
1198672 The system is illustrated in figure (1)
International Journal of Science and Engineering Applications
Volume 4 Issue 5 2015 ISSN-2319-7560 (Online)
316 wwijseacomw
At the beginning of this process there will be no flow expected
through the membrane due to the time consumed in the swilling
and wicking processes inside the membrane [5] The time
duration consumed in these processes is related to the physical
properties of the membrane under investigation After a while
and according to the ficks law of diffusion the electrolyte starts
to flow from chamber (A) which is high in concentration to
chamber (B) which have the lower concentration and this will be
steady-state flow As the electrolyte in the chamber (B) starts to
reach saturation the process of diffusion starts to slow down The
expected behavior of the above process is described in figure (2)
Figure (2) General behavior of the concentration change in
chamber B
3 EXPERIMENTAL
The main idea on which the suggested technique was
designed depends on the electrolysis phenomenon On this base
it was possible to measure both of molar and ionic permeabilitys
of a polymer membrane by any ionic bonds compound
Setup of the suggested measuring system
As shown in figure (3A) the experimental setup is consisting
from an external container which will be referred as the
electrolyte container and an internal container which will be
referred as the distilled water container The Distilled water
container is placed inside the electrolyte container The circuit
board which will be referred as the electrode PCB is attached to
the distilled water container and connected to the DAQ device
which is connected to the PC
Figure (3A) Schematic diagram for the real used system
The electrolyte container is made of grade A transparent
acrylic sheets of 10 mm thickness and internal dimensions of (25
cm W x 18 cm D x 195 cm H) the resistivity of the acrylic is
about 1015 ohmcm for 6mm thickness sheets and dielectric
strength of 30 Mvm Acrylic sheets are resistant to most
chemicals can be cleaned easily and corrosion resistant So its
very suitable for use in our system The container is approved to
be leak free The distilled water container is constructed from the
same materials used for the electrolyte container with internal
dimensions of (16 cm W x 125 cm D x 20 cm H) The front side
of the container is equipped with circular hole of diameter 45
cm a rubber ring is circulating the hole at distance 5 mm from
the hole contour Four small holes of diameter 4 mm are drilled
around the hole for membrane holder fixation Four stainless
steel screws and bolts are installed and fixed in position using
waterproof epoxy to prevent leakage of the electrolyte through
Time
Swilling
Wicking
Steady-state
Saturation
Ion
Co
nce
ntr
atio
n
Chamber ( A ) Chamber ( B ) 1198671 1198672
Membrane
Figure (1) Schematic structure of the main unit
Electrolyte Container
DAQ Device
PC
Membrane
Distilled Water Container
Graphite rods
Control PCB
International Journal of Science and Engineering Applications
Volume 4 Issue 5 2015 ISSN-2319-7560 (Online)
317 wwijseacomw
the screws opening Figure (3B) shows the membrane fixation
mechanism
Figure (3B) Fixation of the membrane
The circuit board is assembled on a PCB with an additional
depolarization relay The depolarization relay function is to
depolarize the graphite electrodes by applying a charge for
certain period of time in the way that the applied polarities
on the electrodes are reversed from the applied one during
current measurement Note that this time period must be
equal or less than the period used during current
measurement The purpose of adding this relay on the circuit
is to minimize the effect of electrodes polarization in the
case of long term measurements that extends for several
days Figure (3C) shows the circuit
Figure (3C) Electrodes holder and electronic control circuit
System design requirements
Electrode choices
Electrode choice is very important decision in
system design The electrodes should satisfy the
following specifications
a) Very low resistance so it can detect very low currents
as low as 10microA
b) It should be inert electrode which means that the
electrode material should not react with any of the
reacting species
c) The electron transfer step is the only reaction step
Which means that other parallel or consecutive steps
are absent
According to the above requirements graphite seems to be the
perfect electrode for our mission Graphite typical resistivity
range of 25 minus 511990910minus6Ωm at 20degC and conductivity range of
2 minus 3119909105 119878119898 at 20degC [6] Graphite is perfect electrical
conductor even with the commercial grades which have higher
resistivity and lower conductivity the above values of resistivity
still in the range of microΩm which is very accepted in our system
and sill verify our design requirements
Measuring the current through Voltage divider
resistor
Current measurements are troublesome because the current
appears within a loop and the loop must be opened to insert the
measuring instrument Moreover this instrument contains a
characteristic resistance or impedance that most often changes
the circuit parameters and must be compensated to obtain
accurate measurements
This problem can be eliminated by using voltage divider method
Voltage drops are relatively easy to measure with most
instruments because the difference in voltage appears between
any two points in a circuit The circuit does not need to be
disturbed or changed [7]
The known reference resistor should have a value that is close to
the unknown value A low current as 10 microA or less can be
measured accurately
Electrolyte and solvent choice
Stainless steel screw
Stainless steel bolt
Membrane fixation support
Membrane
Rubber ring sealing
Side view of membrane
fixation mechanism on
DAQ
connector
Signal relay indicator
Depolarization relay indicator
Signal relay
X-axis Electrode holder
Depolarization relay
International Journal of Science and Engineering Applications
Volume 4 Issue 5 2015 ISSN-2319-7560 (Online)
318 wwijseacomw
The first requirement of an electrolyte is that it should give
rise to a highly
Conducting solution Potential electrolytes (organic acids and
most
bases) dissociate into ions by ionogenic or ion-forming
chemical reactions with solvent molecules in contrast to true
electrolytes which often give rise to ionic solutions by physical
interactions between ions present in the ionic crystal and solvent
molecules Sodium chloride which is a true electrolyte dissolves
by the solvation of 119873119886+ and 119862119897minus ions in the salt crystals
Observed problems during sysem operation
The fact that system uses the hydrodynamic pressure as a
working princible results in long time measurement reaching
several days Due to this long time measurement two problemes
affecting the accuracy of the recoreded data are observed The
first problem is the polarization of the graphite electrodes and the
second problem is the change in the electrolyte content by
consuming the ions during the electrolysis These problem have
been resolved by using the pulsed potential technique as will be
discussed later on
Membrane preparation
5 gm of PVA (Poly Vinyl Alcohol) from LOBA CHEMIE
dissolved in 100 ml of distilled water the solution placed on
magnetic stirrer for 12 hours at 75 degC the beaker is covered with
aluminum foil to minimize the evaporation
The solution was casted onto glass petri dishes of diameter 70
mm The casted volume is 10 ml in each petri dish The solution
let to dry for several days at room temperature (about 25 degC) until
complete dryness Then the films were peeled off from the
dishes The peeled films are identical in dimensions with
thickness of 015 mm
Electrolyte preparation
An electrolyte solution of volume 3 liters at the target
concentration is prepared by dissolving sodium chloride from
BIO BASIC CANADA INC (MW 5844 Purity gt995 sulfate
lt0001) into distilled water The solution is left for 1-2 hours
for complete dissolution
4 RESULT AND DISCUSSION
Electrolysis of Aqueous NaCl
Figure 4 below shows an idealized drawing of a cell in which an
aqueous solution of sodium chloride is electrolyzed
Figure (4) Ideal cell for aqueous NaCl solution
The 119873119886+ ions migrate toward the negative electrode and the 119862119897minus
ions migrate toward the positive electrode But now there are
two substances that can be reduced at the cathode 119873119886+ ions and
water molecules
At the Cathode (-)
119873119886+ + 119890minus rarr 119873119886 119864119903119890119889
= minus271 119881
21198672119874 + 2 119890minus rarr 1198672 + 2 119874119867minus 119864119903119890119889
= minus083119881
Because it is much easier to reduce water than 119873119886+ ions the only
product formed at the cathode is hydrogen gas
The cathode reaction will be
21198672119874 + 2 119890minus rarr 1198672 + 2 119874119867minus(119886119902)
There are also two substances that can be oxidized at the anode
119862119897minus ions and water molecules
At the Anode (+)
2119862119897minus rarr 10487741198621198972 + 2119890minus 119864119900119909 = minus136 119881
21198672119874 rarr 1198742 + 4119867+ + 4 119890minus 119864119900119909 = minus123 119881
The standard-state potentials for these half-reactions are so close
to each other that we might expect to see a mixture of 1198621198972 and 1198742
International Journal of Science and Engineering Applications
Volume 4 Issue 5 2015 ISSN-2319-7560 (Online)
319 wwijseacomw
gas collect at the anode In practice the only product of this
reaction is 1198621198972
The anode reaction will be
2119862119897minus rarr 10487741198621198972 + 2119890minus 119864119900119909 = minus136 119881
At first glance it would seem easier to oxidize water (119864119900119909= -123
volts) than 119862119897minus ions (119864119900119909 = -136 volts) The solution
concentration of NaCl controls the potential required to oxidize
the 119862119897minus ion The deciding factors are
1- A phenomenon which is known as overvoltage it is
the extra voltage that must be applied to a reaction to
aid it to occur at the rate at which it would occur in an
ideal system The measured overpotential required for
oxygen oxidation on the graphite electrodes is 095 V
(table 1) Hence chlorine gas is formed over hydrogen
gas
2- The NaCl concentration At the cathode the same
reduction reaction occurs in both dilute and
concentrated solutions
For the concentrated electrolyte chlorine gas and
sodium hydroxide are formed at the anode
Table (1) Over-potential for different electrodes
Material of
the
electrode
Hydrogen Oxygen Chlorine
Platinum
(platinized) minus007 V +077 V +008 V
Palladium minus007 V +093 V
Gold minus009 V +102 V
Iron minus015 V +075 V
Platinum (shiny) minus016 V +095 V +010 V
Silver minus022 V +091 V
Nickel minus028 V +056 V
Graphite minus062 V +095 V +012 V
Lead minus071 V +081 V
Zinc minus077 V
Mercury minus085 V
External resistor value and electrode potential
dependence
The electrolyte resistance can be considered as a fixed value
ohmic resistor for fixed value of electrolyte concentration [8]
The main power supply voltage will be shared between the
electrodes and the voltage divider resistor as indicated by the
following diagram (Figure 5)
Figure (5) The position of the external resistor in the circuit
From the above circuit we can see that
119881 = 1198811 + 1198812 (1)
Where
119881 is the power supply applied voltage
1198811 is the voltage across the fixed resistor 119877119865
1198812 is the voltage across the two electrodes immersed in
the electrolyte
The selected maximum value for the power supply is +5V
A setup to simulate the process has been installed using a beaker
filled with electrolyte solution of NaCl of concentration 2 wt
Using two graphite electrodes the current allowed to flow
through the electrolyte Six different values of the fixed voltage
divider resistors are used as follow
10KΩ 47KΩ 26KΩ 1 kΩ 510 Ω 51 Ω
The voltage from the power source is set to increase from zero to
+5V in steps of 01 V per minute with the aid of software timed
program The obtained voltage behavior for 10k 1k and 51 ohm
resistors are shown in figures 6 7 8 respectively while the
current behavior for all the resistors is show in figure (9)
1198811
1198812
119877119878
119881
119877119865
Power Supply
International Journal of Science and Engineering Applications
Volume 4 Issue 5 2015 ISSN-2319-7560 (Online)
320 wwijseacomw
Figure (6) Voltages for external resistance of 10 kΩ
Figure (7) Voltages for external resistance of 1 kΩ
Figure (8) Voltages for external resistance of 51 Ω
Figure (9) I(t) for different external resistors
The use of power source with value of +5V is appropriate
specially when using low voltage divider resistor values The
resistor of value 51 Ω is typical to be used showing appropriate
values of current to be measured and perfect linearity with
voltage in the conducting faradic region
Note that when using a power source of +5V the region
corresponding to voltage values from 0 to 25V (from 0 to 25
minute in figure (9)) will be neglected since minimal number of
ions will be enough to produce a faradic current The non-
faradic current region in figure (9) effect will be minimal since
a limited no of ions will transfer the current from non-faradic to
the faradic region
Polarization of Electrodes
In figure (8) ( where the greater voltage deviation occurred ) we
can relate the value of deviation by the amount of current as seen
in figure (9) where the recorded sum values starts to decrease as
the current start to increase Since the fixed resistor cant show
such behavior we can assume that the phenomenon is related to
the electrodes [9] The reduced value of voltage on the electrode
is caused by voltage drop inside the electrodes causing the
measured value to be lower than expected this phenomena is
called polarization of electrodes and is varied by Current
value applied voltage electrode material and duration of current
flow The magnitude of polarization is more effective by the
increasing of any one of the previous four factors
International Journal of Science and Engineering Applications
Volume 4 Issue 5 2015 ISSN-2319-7560 (Online)
321 wwijseacomw
The effect of long time current flow
In this experiment we going to simulate the best value obtained
for power supply voltage which is 5V for long period of time
The external voltage divider resistor used is the 55Ω At this
value as seen in figure (10) the power supply voltage is kept at
the +5v value during the whole 42 hours of the test and the
corresponding current value reaches more than 180mA The
voltage on the electrodes exceeds 4V which is ideal for the
electrolysis process The voltage on the fixed resistor is about 1V
and the polarization value is minimal
Figure (10) The polarization effect in the electrodes
As seen in figure (10) in the first 20 hours of the test all the values
of power source polarization voltage on electrodes and voltage
on the fixed resistor are showing linear behavior But after that
time the measured values starts to deviate While the power
supply voltage value is kept stable and fixed all other values are
completely changed A major voltage drop in the polarization
curve is observed
The current is started to decrease gradually (as seen in figure 11)
and this decrease in the current is combined with increase in the
solution resistance
The unexpected deviation from the regular behavior is due to the
change in the electrolyte content due to the decrease in the
electrolyte ion content and hence increased solution resistance
In conclusion the DC current value recorded in the electrolysis
process can be related to the electrolyte concentration only for
fast permeation process
In low permeability membranes and at low concentration the
obtained current values will be inaccurate
Figure (11) The electrolyte current shows the increase in
solution resistance
Pulsed potential technique
The suggested modified method is focusing on reducing the time
that the current allowed to pass through the electrolyte by
substituting the continuous potential application on the
electrodes by a pulsed potential for a short period of time thus
reducing the effect of electrode polarization and conserving the
electrolyte content (Figure 12)
Figure (12) (a) continuous application of potential 119933119952 (b)
pulsed potential application with the same 119933119952 amplitude
To achieve our goal the cell design must be modified The
following circuit was used to control the cell potential according
to the new enhancements (Figure 13)
Time Time
Po
ten
tial
Po
ten
tial
119881119900 119881119900
(a) (b)
International Journal of Science and Engineering Applications
Volume 4 Issue 5 2015 ISSN-2319-7560 (Online)
322 wwijseacomw
Figure (13) modified measuring system
The control circuit is demonstrated in figure (14)
Figure (14) The suggested control circuit
In the above circuit the signal coming from the DAQ device is
fed to the transistor 1198791 through the biasing resistor 119877119887to trigger
the relay
The DAQ device controls the time periods 119879119900119899 and 119879119900119891119891to form
the shape of the applied potential pulse
However this new technique is combined with two new problems
associated with the applied pulse technique which is formation
of the rush in current effect and the double layer capacitance
effect Figure (15a) shows the applied pulsed signal the resultant
signal due to the effect of the double layer capacitance is shown
in figure (15b) Figure (16) shows the effect of rush in current
and the minimum required pulse width
Figure (15) Applied pulses (a) and output current affected
by the double layer capacitance (b)
Figure (16) The effect of rush in current on the output
current
Its found by experimental trials and measurements that pulse
separation above 10 second shows no double layer capacitance
effect Also the pulse width of 3 second was enough to
eliminate the effect of the rush in current Figure (17) show the
relation between the applied pulse width and the percentage
deviation from the corresponding DC value
Figure (17) Percentage deviation from DC Value
PC System DAQ System
Power Supply
Control Circuit
Electrochemical Cell
Time
Cu
rren
t
Time
Po
ten
tial
Applied Resultant
(a) (b)
Inrush current magnitude
Cu
rren
t
Peak Current
Time
Steady-state current
value
Pulse width
International Journal of Science and Engineering Applications
Volume 4 Issue 5 2015 ISSN-2319-7560 (Online)
323 wwijseacomw
Permeability investigation using different
concentrations
This test was repeated several times using identical PVA films
with the same dimensions the only changed factor is the
electrolyte concentration In each test the flow rate is calculated
under the steady state condition of flow The rate is obtained as
increase in current by time and is recorded in mAH (milli-
ampere per hour) values Table (2) concludes the obtained flow
rates for every concentration used
Table (2) The flow rate at different concentrations
Concentration (wt) Flow rate (mAh)
0033 0035
0066 0054
0133 00999
0266 0229
0533 061
1066 109
2133 2013
32 249
4266 2944
Note that the flow rate is changing according to the change of
concentration due to the change in the hydrodynamic fluid
pressure but since the membrane dimensions and material are
identical in every test the proportional constant governing the
relation between the flow rate and the concentration is the
membrane permeability The data in table (1) is represented
graphically in figure (18) using logarithmic scale for
concentration
Figure (18) Flow rate as function of concentration
Empirical System Equation
The parameters involved in the permeability process can be
divided into three main groups
Parameters related to the nature of the measurement
technique which are the viscosity and concentration of
the electrolyte
Parameters related to the permeability process itself
which is the flow rate through the membrane
Parameters related to the sample under investigation
which are the sample thickness and area
Viscosity
The viscosity of the solution must be involved in our equation as
many other permeability equations however most equations and
according to their measurement mechanism use the dynamic
viscosity (120583) rather than the kinematic viscosity (120584) The reason
of this is based on the fact that these systems measure the
permeability by the aid of fluid flow through the sample under
investigation Unlike these systems our measurement technique
uses the hydrodynamic fluid pressure for this reason we going to
use the kinematic viscosity instead of the dynamic viscosity
The value 10244 11990910minus61198982119904 is taken as the average value for
this parameter in our equation for the calculation of permeability
over the used range of concentrations
Flow rate
The flow rate in our system is calculated by mAH which is a
non-standard unit So we must convert our flow rate to another
standard unit used for measuring the flow rate
The relation between the system parameters can be expressed by
the following three relations [10]
1 119862 = 624 119909 1018 119890
1 119898119900119897119890 = 964854 119862
1119860 = 1119862119904
(where C= Coulomb e= electron charge A = Ampere s =
second)
International Journal of Science and Engineering Applications
Volume 4 Issue 5 2015 ISSN-2319-7560 (Online)
324 wwijseacomw
This leads to the following relation
1119898119860119867 = 2877119909 10minus12 119898119900119897119904
The previous figure (17) is redrawn after conversion to the IS
units
Its found that the best fit equation for the graph is
119896 = 119876
(1 minus 119890minus120592119862119889119860119887))
Where
119896 is the membrane permeability in 1198982
119876 is the flow rate in 119898119900119897119904119890119888
120584 is the kinematic viscosity in 1198982119904
119862 is the concentration in 1198981199001198971198983
119889 is the membrane thickness in 119898
119860 is the membrane area in 1198982
119887 is a numerical constant of value 5522372 119909 10minus5
Now the modified pulsed technique for measuring permeability
of thin polymer films is ready to be used for permeability
measurements
Applications of the system
The control of the permeability of polymer films is important task
in this work A composite of PVA and nano copper (70 nm) was
prepared as a film using the previously described casting method
The films are filled with the copper nano particles with 5 10 and
20 wt ratios Figure (19) shows the obtained flow rate curves
and table (3) represents the recorded permeability values for the
three films using the system imperial equation
Table (3) Permeability of copper filled PVA films
Filled copper ratio
(wt) Permeability k (119950120784)
0 908211990910minus12
5 88611990910minus12
10 797411990910minus12
20 695511990910minus12
We can see that as the copper particles increase the permeability
decrease compared to the pure PVA films (zero ratio in table 3)
These results agree with the expected one where as the particles
increase in the film more blocking in the flow direction occurs
Figure (19) Flow rate for PVA membranes with different
copper filling concentrations
Another set of PVA films using the same preparation method but
this time the films are filled with mico particles (100-120 microm) of
silicone oxide with 5 10 and 20 wt ratios
The recorded permeability values for the three films using our
system imperial equation are represented in table (4) while the
flow rate curves are shown in figure (20)
Table (4) Permeability of silicon dioxide filled PVA films
Filled silicone oxide
ratio (wt) Permeability k (119950120784)
0 908211990910minus12
5 1211990910minus11
10 925911990910minus12
20 726511990910minus12
Figure (20) Flow rate for PVA membranes with different
silicon dioxide filling concentrations
International Journal of Science and Engineering Applications
Volume 4 Issue 5 2015 ISSN-2319-7560 (Online)
325 wwijseacomw
From figure 19 it is clear that the flow rate for the 5 wt filled
films is greater than the pure PVA one which is on the contrary
of the expected result
A theoretical explanation of what can cause this unexpected
result assume that the filled particles in the micro scale added
new voids between the polymer and the particle surface allowing
the flow to be easier through this voids However another factor
is causing the flow rate to be decreased which is the blocking
effect of the particle itself
Thus the permeability depends on two factors work in opposite
ways The first factor which is the voids allowing more flow rate
and hence increased permeability The second factor which is the
blocking effect due to the particle volume leading to reduced
flow rate and hence decreased permeability The obtained flow
rate is the net of the above two factors
Scanning Electron Microscope image supports the discussed
theoretical principle above is shown in figure (21)
Figure (21) Red arrows aim to the voids around
the silicone oxide micro particles
5 CONCLUSION
Permeability of membranes has great importance where
membranes are of wide industrial and medical applications
Several techniques are designed to measure the permeability of
membranes Through these methods fluids are forced to flow
across the membrane by applying high pressure By measuring
the pressure difference membrane surface area thickness and
flow rate of fluid the permeability is calculated
Recently polymer membranes became one of the basic members
of preamble materials The main disadvantage that restricts the
applicability of polymer membranes is there weak mechanical
resistance against high pressures The current work represented
great modifications for the permeability measuring techniques
This modification is concluded in addition of ionic salt to water
and evaluating the flow rate through the polymer membrane by
direct measurement of electrolysis current behind the membrane
Several problems are raised during the establishment of this idea
technical solutions were applied Finally applying pulsed
potential difference on the used graphite electrodes was an ideal
answer for many side problems By this answer it was possible
to write a form for imperial equation correlates the flow rate
across membrane and hence the permeability with the
electrolyte current This qualified measuring technique could be
used to measure permeability of PVA membranes It could with
aid of the modified technique to change the permeability of PVA
membranes by adding copper nano particles for decreasing
permeability and adding silicone Dioxide micro particles to the
PVA for increasing permeability of the membranes Images by
SEM supported the mechanism of controlling permeability that
assumed by the authors
6 REFERENCES
[1] - Angelo Basile Suzana Pereira Nunes Advanced membrane
science and technology for sustainable energy and
environmental applications [ Woodhead Publishing] pp3-4
(2011)
[2] - Richard W Baker Membrane Technology and
applications 2nd Ed Membrane Technology and Research
Inc[John Wileyamp Sons Ltd New York] pp 15-16 (2000)
International Journal of Science and Engineering Applications
Volume 4 Issue 5 2015 ISSN-2319-7560 (Online)
326 wwijseacomw
[3] - Ali R Zand Yuri Sikorski Matthew S Sanders
Homayun K Navaz A Simple Laboratory Experiment for the
Measurement of Single Phase Permeability Journal of
Physics and Natural Science vol 1 Issue 2(2007)
[4]- Thomas W Engler Fluid Flow in Porous Media
[Petroleum Engineering 524 New Mexico Tech] pp 3-12
(2010)
[5] - Reza Masoodi Krishna M Pillai Wicking in Porous
Materials - Traditional and Modern Modeling
Approaches CRC Press - Taylor amp Francis Group
pp13 (2013)
[6] - ENTEGRIS INC Properties and Characteristics of
Graphite for Semiconductor Industry pp 19
(2013)
[7] - Measurement Computing Corporation Data
Acquisition Handbook wwwMccdaqcom pp 31
(2012)
[8] - John OrsquoM Bockris Amulya K N Reddy Modern
Electrochemistry Second Edition KLUWER
ACADEMIC PUBLISHERS pp429 (2002)
[9] - Bagotsky V S Fundamentals of Electrochemistry
Second Edition [John Wiley amp Sons New York
ndash London] pp 79 (2006)
[10] - Allen J Bard Larry R Faulkner Electrochemical
Methods Fundamentals and applications [John
Wiley amp Sons Inc New York ndash London] pp4
(2001)

International Journal of Science and Engineering Applications
Volume 4 Issue 5 2015 ISSN-2319-7560 (Online)
318 wwijseacomw
The first requirement of an electrolyte is that it should give
rise to a highly
Conducting solution Potential electrolytes (organic acids and
most
bases) dissociate into ions by ionogenic or ion-forming
chemical reactions with solvent molecules in contrast to true
electrolytes which often give rise to ionic solutions by physical
interactions between ions present in the ionic crystal and solvent
molecules Sodium chloride which is a true electrolyte dissolves
by the solvation of 119873119886+ and 119862119897minus ions in the salt crystals
Observed problems during sysem operation
The fact that system uses the hydrodynamic pressure as a
working princible results in long time measurement reaching
several days Due to this long time measurement two problemes
affecting the accuracy of the recoreded data are observed The
first problem is the polarization of the graphite electrodes and the
second problem is the change in the electrolyte content by
consuming the ions during the electrolysis These problem have
been resolved by using the pulsed potential technique as will be
discussed later on
Membrane preparation
5 gm of PVA (Poly Vinyl Alcohol) from LOBA CHEMIE
dissolved in 100 ml of distilled water the solution placed on
magnetic stirrer for 12 hours at 75 degC the beaker is covered with
aluminum foil to minimize the evaporation
The solution was casted onto glass petri dishes of diameter 70
mm The casted volume is 10 ml in each petri dish The solution
let to dry for several days at room temperature (about 25 degC) until
complete dryness Then the films were peeled off from the
dishes The peeled films are identical in dimensions with
thickness of 015 mm
Electrolyte preparation
An electrolyte solution of volume 3 liters at the target
concentration is prepared by dissolving sodium chloride from
BIO BASIC CANADA INC (MW 5844 Purity gt995 sulfate
lt0001) into distilled water The solution is left for 1-2 hours
for complete dissolution
4 RESULT AND DISCUSSION
Electrolysis of Aqueous NaCl
Figure 4 below shows an idealized drawing of a cell in which an
aqueous solution of sodium chloride is electrolyzed
Figure (4) Ideal cell for aqueous NaCl solution
The 119873119886+ ions migrate toward the negative electrode and the 119862119897minus
ions migrate toward the positive electrode But now there are
two substances that can be reduced at the cathode 119873119886+ ions and
water molecules
At the Cathode (-)
119873119886+ + 119890minus rarr 119873119886 119864119903119890119889
= minus271 119881
21198672119874 + 2 119890minus rarr 1198672 + 2 119874119867minus 119864119903119890119889
= minus083119881
Because it is much easier to reduce water than 119873119886+ ions the only
product formed at the cathode is hydrogen gas
The cathode reaction will be
21198672119874 + 2 119890minus rarr 1198672 + 2 119874119867minus(119886119902)
There are also two substances that can be oxidized at the anode
119862119897minus ions and water molecules
At the Anode (+)
2119862119897minus rarr 10487741198621198972 + 2119890minus 119864119900119909 = minus136 119881
21198672119874 rarr 1198742 + 4119867+ + 4 119890minus 119864119900119909 = minus123 119881
The standard-state potentials for these half-reactions are so close
to each other that we might expect to see a mixture of 1198621198972 and 1198742
International Journal of Science and Engineering Applications
Volume 4 Issue 5 2015 ISSN-2319-7560 (Online)
319 wwijseacomw
gas collect at the anode In practice the only product of this
reaction is 1198621198972
The anode reaction will be
2119862119897minus rarr 10487741198621198972 + 2119890minus 119864119900119909 = minus136 119881
At first glance it would seem easier to oxidize water (119864119900119909= -123
volts) than 119862119897minus ions (119864119900119909 = -136 volts) The solution
concentration of NaCl controls the potential required to oxidize
the 119862119897minus ion The deciding factors are
1- A phenomenon which is known as overvoltage it is
the extra voltage that must be applied to a reaction to
aid it to occur at the rate at which it would occur in an
ideal system The measured overpotential required for
oxygen oxidation on the graphite electrodes is 095 V
(table 1) Hence chlorine gas is formed over hydrogen
gas
2- The NaCl concentration At the cathode the same
reduction reaction occurs in both dilute and
concentrated solutions
For the concentrated electrolyte chlorine gas and
sodium hydroxide are formed at the anode
Table (1) Over-potential for different electrodes
Material of
the
electrode
Hydrogen Oxygen Chlorine
Platinum
(platinized) minus007 V +077 V +008 V
Palladium minus007 V +093 V
Gold minus009 V +102 V
Iron minus015 V +075 V
Platinum (shiny) minus016 V +095 V +010 V
Silver minus022 V +091 V
Nickel minus028 V +056 V
Graphite minus062 V +095 V +012 V
Lead minus071 V +081 V
Zinc minus077 V
Mercury minus085 V
External resistor value and electrode potential
dependence
The electrolyte resistance can be considered as a fixed value
ohmic resistor for fixed value of electrolyte concentration [8]
The main power supply voltage will be shared between the
electrodes and the voltage divider resistor as indicated by the
following diagram (Figure 5)
Figure (5) The position of the external resistor in the circuit
From the above circuit we can see that
119881 = 1198811 + 1198812 (1)
Where
119881 is the power supply applied voltage
1198811 is the voltage across the fixed resistor 119877119865
1198812 is the voltage across the two electrodes immersed in
the electrolyte
The selected maximum value for the power supply is +5V
A setup to simulate the process has been installed using a beaker
filled with electrolyte solution of NaCl of concentration 2 wt
Using two graphite electrodes the current allowed to flow
through the electrolyte Six different values of the fixed voltage
divider resistors are used as follow
10KΩ 47KΩ 26KΩ 1 kΩ 510 Ω 51 Ω
The voltage from the power source is set to increase from zero to
+5V in steps of 01 V per minute with the aid of software timed
program The obtained voltage behavior for 10k 1k and 51 ohm
resistors are shown in figures 6 7 8 respectively while the
current behavior for all the resistors is show in figure (9)
1198811
1198812
119877119878
119881
119877119865
Power Supply
International Journal of Science and Engineering Applications
Volume 4 Issue 5 2015 ISSN-2319-7560 (Online)
320 wwijseacomw
Figure (6) Voltages for external resistance of 10 kΩ
Figure (7) Voltages for external resistance of 1 kΩ
Figure (8) Voltages for external resistance of 51 Ω
Figure (9) I(t) for different external resistors
The use of power source with value of +5V is appropriate
specially when using low voltage divider resistor values The
resistor of value 51 Ω is typical to be used showing appropriate
values of current to be measured and perfect linearity with
voltage in the conducting faradic region
Note that when using a power source of +5V the region
corresponding to voltage values from 0 to 25V (from 0 to 25
minute in figure (9)) will be neglected since minimal number of
ions will be enough to produce a faradic current The non-
faradic current region in figure (9) effect will be minimal since
a limited no of ions will transfer the current from non-faradic to
the faradic region
Polarization of Electrodes
In figure (8) ( where the greater voltage deviation occurred ) we
can relate the value of deviation by the amount of current as seen
in figure (9) where the recorded sum values starts to decrease as
the current start to increase Since the fixed resistor cant show
such behavior we can assume that the phenomenon is related to
the electrodes [9] The reduced value of voltage on the electrode
is caused by voltage drop inside the electrodes causing the
measured value to be lower than expected this phenomena is
called polarization of electrodes and is varied by Current
value applied voltage electrode material and duration of current
flow The magnitude of polarization is more effective by the
increasing of any one of the previous four factors
International Journal of Science and Engineering Applications
Volume 4 Issue 5 2015 ISSN-2319-7560 (Online)
321 wwijseacomw
The effect of long time current flow
In this experiment we going to simulate the best value obtained
for power supply voltage which is 5V for long period of time
The external voltage divider resistor used is the 55Ω At this
value as seen in figure (10) the power supply voltage is kept at
the +5v value during the whole 42 hours of the test and the
corresponding current value reaches more than 180mA The
voltage on the electrodes exceeds 4V which is ideal for the
electrolysis process The voltage on the fixed resistor is about 1V
and the polarization value is minimal
Figure (10) The polarization effect in the electrodes
As seen in figure (10) in the first 20 hours of the test all the values
of power source polarization voltage on electrodes and voltage
on the fixed resistor are showing linear behavior But after that
time the measured values starts to deviate While the power
supply voltage value is kept stable and fixed all other values are
completely changed A major voltage drop in the polarization
curve is observed
The current is started to decrease gradually (as seen in figure 11)
and this decrease in the current is combined with increase in the
solution resistance
The unexpected deviation from the regular behavior is due to the
change in the electrolyte content due to the decrease in the
electrolyte ion content and hence increased solution resistance
In conclusion the DC current value recorded in the electrolysis
process can be related to the electrolyte concentration only for
fast permeation process
In low permeability membranes and at low concentration the
obtained current values will be inaccurate
Figure (11) The electrolyte current shows the increase in
solution resistance
Pulsed potential technique
The suggested modified method is focusing on reducing the time
that the current allowed to pass through the electrolyte by
substituting the continuous potential application on the
electrodes by a pulsed potential for a short period of time thus
reducing the effect of electrode polarization and conserving the
electrolyte content (Figure 12)
Figure (12) (a) continuous application of potential 119933119952 (b)
pulsed potential application with the same 119933119952 amplitude
To achieve our goal the cell design must be modified The
following circuit was used to control the cell potential according
to the new enhancements (Figure 13)
Time Time
Po
ten
tial
Po
ten
tial
119881119900 119881119900
(a) (b)
International Journal of Science and Engineering Applications
Volume 4 Issue 5 2015 ISSN-2319-7560 (Online)
322 wwijseacomw
Figure (13) modified measuring system
The control circuit is demonstrated in figure (14)
Figure (14) The suggested control circuit
In the above circuit the signal coming from the DAQ device is
fed to the transistor 1198791 through the biasing resistor 119877119887to trigger
the relay
The DAQ device controls the time periods 119879119900119899 and 119879119900119891119891to form
the shape of the applied potential pulse
However this new technique is combined with two new problems
associated with the applied pulse technique which is formation
of the rush in current effect and the double layer capacitance
effect Figure (15a) shows the applied pulsed signal the resultant
signal due to the effect of the double layer capacitance is shown
in figure (15b) Figure (16) shows the effect of rush in current
and the minimum required pulse width
Figure (15) Applied pulses (a) and output current affected
by the double layer capacitance (b)
Figure (16) The effect of rush in current on the output
current
Its found by experimental trials and measurements that pulse
separation above 10 second shows no double layer capacitance
effect Also the pulse width of 3 second was enough to
eliminate the effect of the rush in current Figure (17) show the
relation between the applied pulse width and the percentage
deviation from the corresponding DC value
Figure (17) Percentage deviation from DC Value
PC System DAQ System
Power Supply
Control Circuit
Electrochemical Cell
Time
Cu
rren
t
Time
Po
ten
tial
Applied Resultant
(a) (b)
Inrush current magnitude
Cu
rren
t
Peak Current
Time
Steady-state current
value
Pulse width
International Journal of Science and Engineering Applications
Volume 4 Issue 5 2015 ISSN-2319-7560 (Online)
323 wwijseacomw
Permeability investigation using different
concentrations
This test was repeated several times using identical PVA films
with the same dimensions the only changed factor is the
electrolyte concentration In each test the flow rate is calculated
under the steady state condition of flow The rate is obtained as
increase in current by time and is recorded in mAH (milli-
ampere per hour) values Table (2) concludes the obtained flow
rates for every concentration used
Table (2) The flow rate at different concentrations
Concentration (wt) Flow rate (mAh)
0033 0035
0066 0054
0133 00999
0266 0229
0533 061
1066 109
2133 2013
32 249
4266 2944
Note that the flow rate is changing according to the change of
concentration due to the change in the hydrodynamic fluid
pressure but since the membrane dimensions and material are
identical in every test the proportional constant governing the
relation between the flow rate and the concentration is the
membrane permeability The data in table (1) is represented
graphically in figure (18) using logarithmic scale for
concentration
Figure (18) Flow rate as function of concentration
Empirical System Equation
The parameters involved in the permeability process can be
divided into three main groups
Parameters related to the nature of the measurement
technique which are the viscosity and concentration of
the electrolyte
Parameters related to the permeability process itself
which is the flow rate through the membrane
Parameters related to the sample under investigation
which are the sample thickness and area
Viscosity
The viscosity of the solution must be involved in our equation as
many other permeability equations however most equations and
according to their measurement mechanism use the dynamic
viscosity (120583) rather than the kinematic viscosity (120584) The reason
of this is based on the fact that these systems measure the
permeability by the aid of fluid flow through the sample under
investigation Unlike these systems our measurement technique
uses the hydrodynamic fluid pressure for this reason we going to
use the kinematic viscosity instead of the dynamic viscosity
The value 10244 11990910minus61198982119904 is taken as the average value for
this parameter in our equation for the calculation of permeability
over the used range of concentrations
Flow rate
The flow rate in our system is calculated by mAH which is a
non-standard unit So we must convert our flow rate to another
standard unit used for measuring the flow rate
The relation between the system parameters can be expressed by
the following three relations [10]
1 119862 = 624 119909 1018 119890
1 119898119900119897119890 = 964854 119862
1119860 = 1119862119904
(where C= Coulomb e= electron charge A = Ampere s =
second)
International Journal of Science and Engineering Applications
Volume 4 Issue 5 2015 ISSN-2319-7560 (Online)
324 wwijseacomw
This leads to the following relation
1119898119860119867 = 2877119909 10minus12 119898119900119897119904
The previous figure (17) is redrawn after conversion to the IS
units
Its found that the best fit equation for the graph is
119896 = 119876
(1 minus 119890minus120592119862119889119860119887))
Where
119896 is the membrane permeability in 1198982
119876 is the flow rate in 119898119900119897119904119890119888
120584 is the kinematic viscosity in 1198982119904
119862 is the concentration in 1198981199001198971198983
119889 is the membrane thickness in 119898
119860 is the membrane area in 1198982
119887 is a numerical constant of value 5522372 119909 10minus5
Now the modified pulsed technique for measuring permeability
of thin polymer films is ready to be used for permeability
measurements
Applications of the system
The control of the permeability of polymer films is important task
in this work A composite of PVA and nano copper (70 nm) was
prepared as a film using the previously described casting method
The films are filled with the copper nano particles with 5 10 and
20 wt ratios Figure (19) shows the obtained flow rate curves
and table (3) represents the recorded permeability values for the
three films using the system imperial equation
Table (3) Permeability of copper filled PVA films
Filled copper ratio
(wt) Permeability k (119950120784)
0 908211990910minus12
5 88611990910minus12
10 797411990910minus12
20 695511990910minus12
We can see that as the copper particles increase the permeability
decrease compared to the pure PVA films (zero ratio in table 3)
These results agree with the expected one where as the particles
increase in the film more blocking in the flow direction occurs
Figure (19) Flow rate for PVA membranes with different
copper filling concentrations
Another set of PVA films using the same preparation method but
this time the films are filled with mico particles (100-120 microm) of
silicone oxide with 5 10 and 20 wt ratios
The recorded permeability values for the three films using our
system imperial equation are represented in table (4) while the
flow rate curves are shown in figure (20)
Table (4) Permeability of silicon dioxide filled PVA films
Filled silicone oxide
ratio (wt) Permeability k (119950120784)
0 908211990910minus12
5 1211990910minus11
10 925911990910minus12
20 726511990910minus12
Figure (20) Flow rate for PVA membranes with different
silicon dioxide filling concentrations
International Journal of Science and Engineering Applications
Volume 4 Issue 5 2015 ISSN-2319-7560 (Online)
325 wwijseacomw
From figure 19 it is clear that the flow rate for the 5 wt filled
films is greater than the pure PVA one which is on the contrary
of the expected result
A theoretical explanation of what can cause this unexpected
result assume that the filled particles in the micro scale added
new voids between the polymer and the particle surface allowing
the flow to be easier through this voids However another factor
is causing the flow rate to be decreased which is the blocking
effect of the particle itself
Thus the permeability depends on two factors work in opposite
ways The first factor which is the voids allowing more flow rate
and hence increased permeability The second factor which is the
blocking effect due to the particle volume leading to reduced
flow rate and hence decreased permeability The obtained flow
rate is the net of the above two factors
Scanning Electron Microscope image supports the discussed
theoretical principle above is shown in figure (21)
Figure (21) Red arrows aim to the voids around
the silicone oxide micro particles
5 CONCLUSION
Permeability of membranes has great importance where
membranes are of wide industrial and medical applications
Several techniques are designed to measure the permeability of
membranes Through these methods fluids are forced to flow
across the membrane by applying high pressure By measuring
the pressure difference membrane surface area thickness and
flow rate of fluid the permeability is calculated
Recently polymer membranes became one of the basic members
of preamble materials The main disadvantage that restricts the
applicability of polymer membranes is there weak mechanical
resistance against high pressures The current work represented
great modifications for the permeability measuring techniques
This modification is concluded in addition of ionic salt to water
and evaluating the flow rate through the polymer membrane by
direct measurement of electrolysis current behind the membrane
Several problems are raised during the establishment of this idea
technical solutions were applied Finally applying pulsed
potential difference on the used graphite electrodes was an ideal
answer for many side problems By this answer it was possible
to write a form for imperial equation correlates the flow rate
across membrane and hence the permeability with the
electrolyte current This qualified measuring technique could be
used to measure permeability of PVA membranes It could with
aid of the modified technique to change the permeability of PVA
membranes by adding copper nano particles for decreasing
permeability and adding silicone Dioxide micro particles to the
PVA for increasing permeability of the membranes Images by
SEM supported the mechanism of controlling permeability that
assumed by the authors
6 REFERENCES
[1] - Angelo Basile Suzana Pereira Nunes Advanced membrane
science and technology for sustainable energy and
environmental applications [ Woodhead Publishing] pp3-4
(2011)
[2] - Richard W Baker Membrane Technology and
applications 2nd Ed Membrane Technology and Research
Inc[John Wileyamp Sons Ltd New York] pp 15-16 (2000)
International Journal of Science and Engineering Applications
Volume 4 Issue 5 2015 ISSN-2319-7560 (Online)
326 wwijseacomw
[3] - Ali R Zand Yuri Sikorski Matthew S Sanders
Homayun K Navaz A Simple Laboratory Experiment for the
Measurement of Single Phase Permeability Journal of
Physics and Natural Science vol 1 Issue 2(2007)
[4]- Thomas W Engler Fluid Flow in Porous Media
[Petroleum Engineering 524 New Mexico Tech] pp 3-12
(2010)
[5] - Reza Masoodi Krishna M Pillai Wicking in Porous
Materials - Traditional and Modern Modeling
Approaches CRC Press - Taylor amp Francis Group
pp13 (2013)
[6] - ENTEGRIS INC Properties and Characteristics of
Graphite for Semiconductor Industry pp 19
(2013)
[7] - Measurement Computing Corporation Data
Acquisition Handbook wwwMccdaqcom pp 31
(2012)
[8] - John OrsquoM Bockris Amulya K N Reddy Modern
Electrochemistry Second Edition KLUWER
ACADEMIC PUBLISHERS pp429 (2002)
[9] - Bagotsky V S Fundamentals of Electrochemistry
Second Edition [John Wiley amp Sons New York
ndash London] pp 79 (2006)
[10] - Allen J Bard Larry R Faulkner Electrochemical
Methods Fundamentals and applications [John
Wiley amp Sons Inc New York ndash London] pp4
(2001)
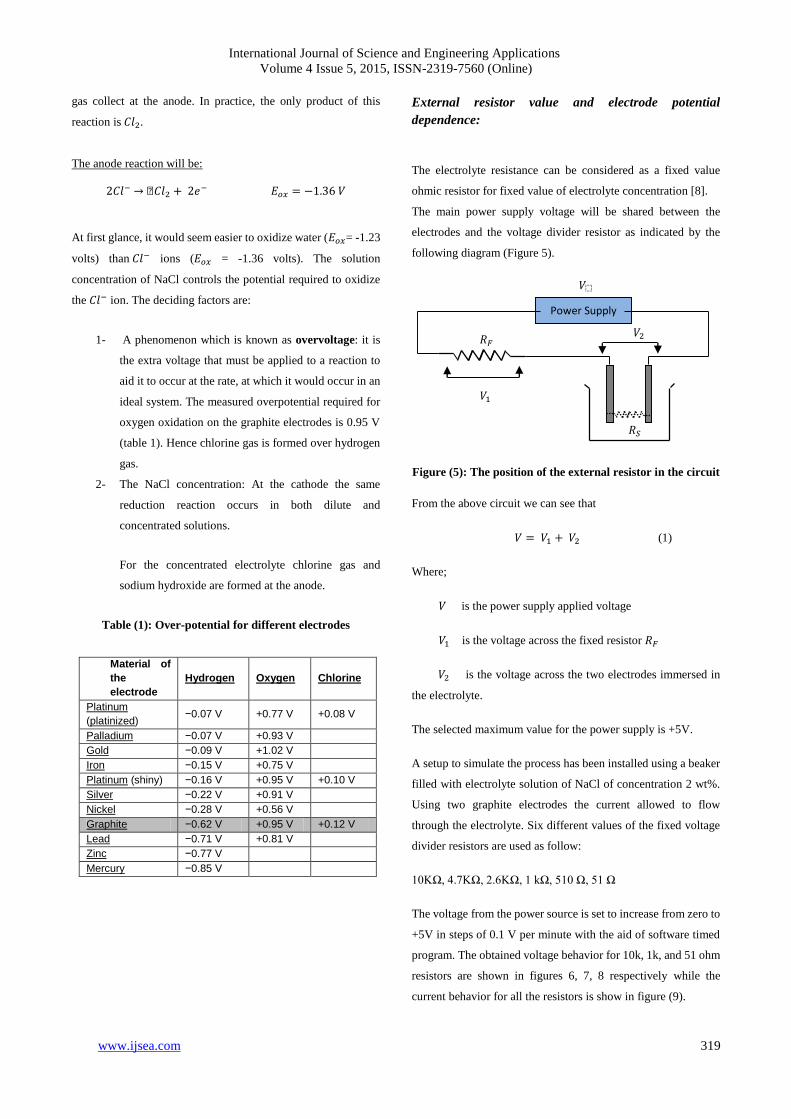
International Journal of Science and Engineering Applications
Volume 4 Issue 5 2015 ISSN-2319-7560 (Online)
326 wwijseacomw
[3] - Ali R Zand Yuri Sikorski Matthew S Sanders
Homayun K Navaz A Simple Laboratory Experiment for the
Measurement of Single Phase Permeability Journal of
Physics and Natural Science vol 1 Issue 2(2007)
[4]- Thomas W Engler Fluid Flow in Porous Media
[Petroleum Engineering 524 New Mexico Tech] pp 3-12
(2010)
[5] - Reza Masoodi Krishna M Pillai Wicking in Porous
Materials - Traditional and Modern Modeling
Approaches CRC Press - Taylor amp Francis Group
pp13 (2013)
[6] - ENTEGRIS INC Properties and Characteristics of
Graphite for Semiconductor Industry pp 19
(2013)
[7] - Measurement Computing Corporation Data
Acquisition Handbook wwwMccdaqcom pp 31
(2012)
[8] - John OrsquoM Bockris Amulya K N Reddy Modern
Electrochemistry Second Edition KLUWER
ACADEMIC PUBLISHERS pp429 (2002)
[9] - Bagotsky V S Fundamentals of Electrochemistry
Second Edition [John Wiley amp Sons New York
ndash London] pp 79 (2006)
[10] - Allen J Bard Larry R Faulkner Electrochemical
Methods Fundamentals and applications [John
Wiley amp Sons Inc New York ndash London] pp4
(2001)


![Journal of u Membrane Science & Technology...research aims, the tradeoff between permeability and selectivity of polymeric membranes has yet remained [10, 15-18]. On the other hand,](https://static.fdocuments.us/doc/165x107/5f862a2f6bec27166c384cc6/journal-of-u-membrane-science-technology-research-aims-the-tradeoff-between.jpg)


