New styrenic materials, a natural alternative to B in...
68
Industrial Materials Recycling Department of Chemical and Biological Engineering CHALMERS UNIVERSITY OF TECHNOLOGY Gothenburg, Sweden 2014 New styrenic materials, a natural alternative to B in ABS ALBERT MARTÍ Supervisor: Mark Foreman Examiner: Christian Ekberg
Transcript of New styrenic materials, a natural alternative to B in...

Industrial Materials Recycling
Department of Chemical and Biological Engineering
CHALMERS UNIVERSITY OF TECHNOLOGY
Gothenburg, Sweden 2014
New styrenic materials, a natural alternative to B in ABS
ALBERT MARTÍ
Supervisor: Mark Foreman
Examiner: Christian Ekberg

2
New styrenic materials, a natural alternative to B in ABS
ALBERT MARTÍ
Industrial Materials Recycling
Department of Chemical and Biological Engineering
Chalmers University of Technology
ABSTRACT
Steps have been made towards a composite containing starch that can replace a plastic based
totally on petroleum (ABS) within this project. The synthesis of composites from styrene, corn
starch and myrcene and, the extrusion of a composite made of modified starch and high impact
polystyrene has been studied. The syntheses of styrene / myrcene copolymers by solution and
suspension polymerization have been studied. Selected materials have been subjected to
mechanical testing. It has been found that the use of myrcene improved the mechanical
properties of the polystyrene based plastic.
KEYWORDS: ABS, terpenes, composite, natural, plastic, polystyrene, starch.

3
Table of contents
1. Introduction ......................................................................................................................... 5
1.1. Objective ....................................................................................................................... 8
2. Background .......................................................................................................................... 9
3. Theory ................................................................................................................................ 12
3.1. Monomers and fillers .................................................................................................. 12
3.1.1. Destabilization of styrene .................................................................................... 16
3.1.2. Destabilization of myrcene .................................................................................. 17
3.2. Plant-based materials synthesis ................................................................................... 22
3.2.2. Extrusion of a benzyl starch-high impact polystyrene blend .............................. 32
3.3. Methods ....................................................................................................................... 34
3.3.1. Proton nuclear magnetic resonance spectroscopy (1H NMR) ............................. 34
3.3.2. Thermogravimetric analysis (TGA) .................................................................... 34
3.3.3. Uniaxial tension test ............................................................................................ 35
4. Hypotheses tested .............................................................................................................. 39
5. Materials ............................................................................................................................ 40
6. Methods .............................................................................................................................. 41
6.1. Experimental procedure .............................................................................................. 41
6.1.1. Destabilization of styrene .................................................................................... 41
6.1.2. Destabilization of myrcene .................................................................................. 42
6.1.3. Synthesis of a polystyrene-myrcene copolymer by solution polymerization ...... 43
6.1.4. Synthesis of a corn starch-polystyrene-myrcene composite by suspension
polymerization ..................................................................................................................... 43
6.1.5. Benzylation of corn starch ................................................................................... 45
6.1.6. Synthesis of a benzyl starch-polystyrene-myrcene composite by suspension
polymerization ..................................................................................................................... 45
6.1.7 Extrusion of a benzyl starch-high impact polystyrene blend .............................. 46
6.2. Performed tests ............................................................................................................ 46
6.2.1. Proton nuclear magnetic resonance spectroscopy (1H NMR) ............................. 46
6.2.2. Thermogravimetric analysis (TGA) .................................................................... 46
6.2.3. Uniaxial tension test ............................................................................................ 46
7. Results and discussion ....................................................................................................... 48
7.1. Destabilization of the monomers ................................................................................. 48
7.2. Synthesis of polystyrene-myrcene copolymer by solution polymerization................. 48
7.2.1. 1H NMR results ................................................................................................... 49
7.3. Uniaxial tension test of solution polymerization copolymers ..................................... 50
7.4. Synthesis of a corn starch-polystyrene-myrcene composite by suspension
polymerization ......................................................................................................................... 50
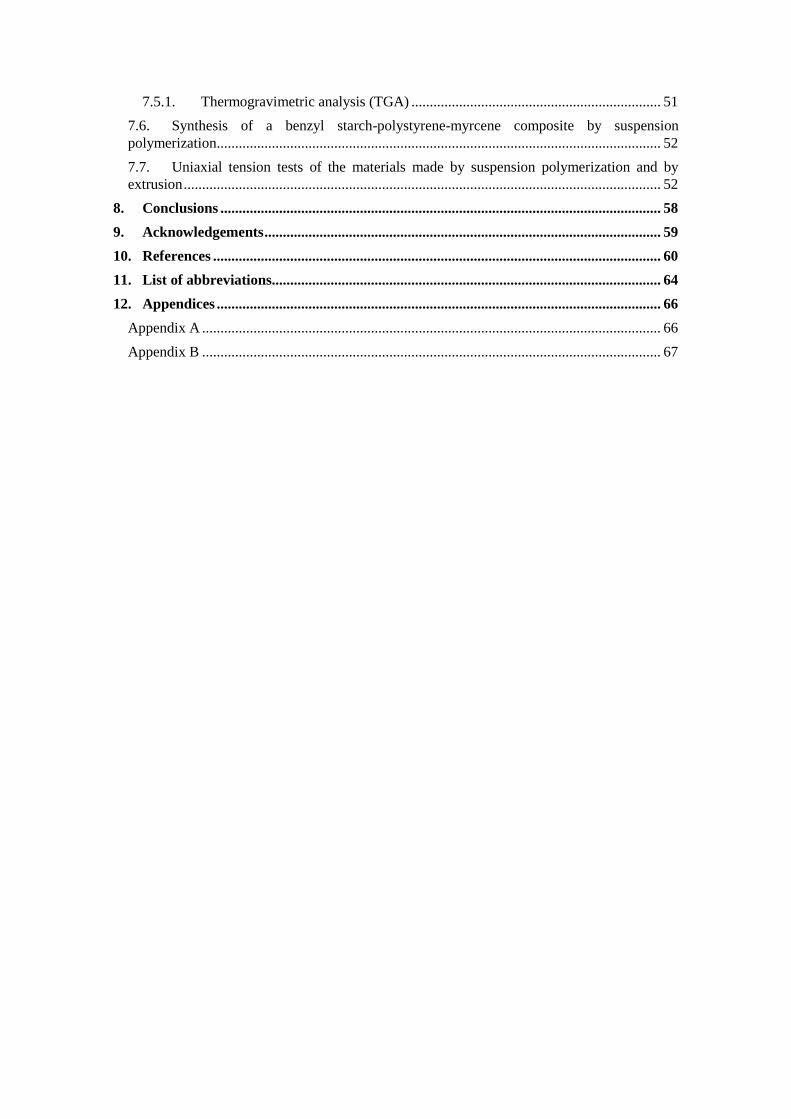
7.5. Benzylation of corn starch ........................................................................................... 51
4
7.5.1. Thermogravimetric analysis (TGA) .................................................................... 51
7.6. Synthesis of a benzyl starch-polystyrene-myrcene composite by suspension
polymerization ......................................................................................................................... 52
7.7. Uniaxial tension tests of the materials made by suspension polymerization and by
extrusion .................................................................................................................................. 52
8. Conclusions ........................................................................................................................ 58
9. Acknowledgements ............................................................................................................ 59
10. References .......................................................................................................................... 60
11. List of abbreviations.......................................................................................................... 64
12. Appendices ......................................................................................................................... 66
Appendix A ............................................................................................................................. 66
Appendix B ............................................................................................................................. 67

5
1. Introduction
A polymer is a macromolecule composed of many repeating small units, or monomers,
connected by covalent bonds. Monomers are joined end to end through chemical reactions with
a process known as polymerization. The average number of monomer units in the polymeric
chain is the degree of polymerization1.
Monomers can be connected in a variety of ways leading different molecular shapes. The
simplest is the linear polymer in which the units are connected to each other in a linear
sequence. An example of a linear polymer would be high density polyethylene (HDPE). An
alternative to the linear polymer is a branched polymer. The side chains, or branches, can be
long or short and are bounded to the main chain. When the branches become interconnected
network structures form. Network polymers, also called cross-linked polymers, have three-
dimensional structures in which each chain is connected to all others by a sequence of junction
points or crosslinks2. One example of a cross-linked polymer would be an epoxy after curing
with ammonia or a polyamine while a second example would be a polystyrene formed with
divinylbenzene present. Polymers which have a tree-like shape arrangement of groups around a
single point are known as dendrimers. One example of a dendrimer is poly(amidoamine)3.
A polymer which contains only a single type of repeat unit is defined as a homopolymer.
Conversely, a copolymer is a polymer formed by two or more different monomers. Several
types of copolymers can be identified depending on the arrangement of the monomers along the
polymer chain. When the monomer distribution is arbitrary a random copolymer is obtained. On
the other hand in an alternating copolymer the different monomers are arranged alternately
along the polymer chain. A strong chemical driving force is needed to make an alternating
copolymer. The most common alternating system is the strong electron donor-acceptor
combination4. In a block copolymer the repeat units exist only in long sequences, or blocks, of
the same type. Graft copolymers have the main chain composed of one individual polymer and
the branches of another one1.
Figure 1. The shapes of (a) linear polymer, (b) branched polymer, (c) cross-linked polymer and (d) dendrimers.
(a) (b) (c) (d)
Figure 2. The arrangement of the monomers in a (a) random copolymer, (b) alternating copolymer, (c) block
copolymer and (d) graft copolymer.

6
Polymers can be natural, semisynthetic and synthetic. Natural polymers include proteins,
cellulose, wool or natural rubber (cis-poly(isoprene)). Semisynthetic polymers are obtained by
the modification of natural polymers these include nitrocellulose, rayon and vulcanized rubber
which are formed from cellulose, cellulose and natural rubber respectively. Synthetic polymers
are obtained industrially. Examples include polystyrene (PS), polyethylene (PE), polypropylene
(PP), polyvinyl chloride (PVC) and nylon 6, 6.
The materials commonly known as plastics are often mixtures of polymers with additives to
form solids which can undergo plastic deformation, this allows them to be shaped and moulded.
Plastics are often produced from crude oil and natural gas5. Depending on the molecular
structure of plastics and, consequently, on their response to heating plastics can be classified in
two main groups: thermoplastics and thermosets. Thermoplastics include polymers with linear
or branched structure that can be melted to be reformed into new object6. Some examples are
polystyrene (PS), polypropylene (PP) and polyethylene (PE). On the other hand thermosets are
rigid polymer networks of high molecular weight. Thus, once formed they degrade rather than
melt when they are heated at high temperatures. Examples of this group include Bakelite and
most epoxy resins (EP)7.
Figure 4. The repeating units of (a) HDPE, (b) PP, (c) PS, (d) PVC and (e) nylon 6, 6.
Figure 3. The repeating units of (a) cis-isoprene, (b) cellulose and (c) nitrocellulose

7
The worldwide annual plastic production increased from 1.5 million tonnes in 1950 to 288
million tonnes in 2012. In the European Union’s 27 Member States the plastics industry
includes more than 62,000 companies with 1.4 million employees and it generated 26.6 billion
euro in 20128. This huge increase of the use of plastics can be justified by their useful properties
such as lightness, cheapness and toughness, as well as the simplicity, versatility and rapidity of
their processing operations. Plastics play a central role in life today. They are used in many
applications such as packaging, building and construction, automotive, electrical and electronics
and agriculture9. Although packaging is still the major application, high technology applications
like aviation and automotive industry are gaining importance.
A commonly used plastic in automotive industry is acrylonitrile-butadiene-styrene
thermoplastic (ABS). ABS consists of cross-linked polybutadiene rubber particles which are
grafted with styrene-acrylonitrile copolymer (SAN) and embedded in a SAN matrix10
. The
acrylonitrile (A) increases the gloss of the plastic and its weather resistance, the butadiene (B)
increases impact strength and the polystyrene (S) improves formability11
. There are many
variables in ABS production such as the rubber particle size and distribution, the amount of
SAN grafted to the rubber, the styrene-acrylonitrile ratio and the cross-links density of the
rubber. Through variation of these variables many different grades of ABS may be obtained
such as high and low viscosity and impact resistance, flame-retardant, in which brominated
additives plus antimony oxide are needed, non-flame retardant and glossy or matt grades10
.
Some disadvantages of the use of plastics exist. Plastics are more difficult to recycle than
traditional materials such as metals and glass because of the degradation of polymer chains12
.
Also their narrow span of densities makes it hard to separate some polymers by density6.
However, metals, glass and paper have no value as fuels whereas plastics do. The increase of
the use of plastics in packaging and agriculture has resulted in serious pollution problems on
land and in the sea. Some plastic litter is so light weight that it can be carried by the wind and
some plastic waste is able to float on the surface of water. These mobile plastic wastes are able
to travel for long distances thus allowing an accumulation of plastic litter in environmentally
sensitive areas such as the seashore12
. Furthermore plastics are often produced from crude oil
and natural gas which are non-renewable resources. Recent studies performed by U.S. Energy
Information Administration (EIA) have shown that the world production peak for crude oil will
be closer to the middle of the 21st century13
. This prediction is in line with the estimation of the
Organization of the Petroleum Exporting Countries (OPEC) which predicts that the world
production peak for crude oil will be in approximately 40 years14
. Therefore a total or partial
replacement of petroleum based plastics with biomass based plastics could reduce the world’s
dependence on oil and offer a means of making plastic after the oil runs out.
Figure 5. The chemical structure of ABS repeating units formed from the different
monomers: (a) acrylonitrile, (b) butadiene and (c) styrene.

8
1.1. Objective
The objective of this project is to synthesise a plant based composite that can replace oil based
plastics such as ABS. In order to obtain a polymer with suitable mechanical properties two
materials will be made and characterised. The first material synthesised was a hybrid plastic
partially made from styrene which is a petroleum based compound and two natural compounds:
corn starch and myrcene, a terpene that comes from plants such as parsley, hops and bay. The
second material was made by extruding a blend of modified corn starch and high impact
polystyrene.
9
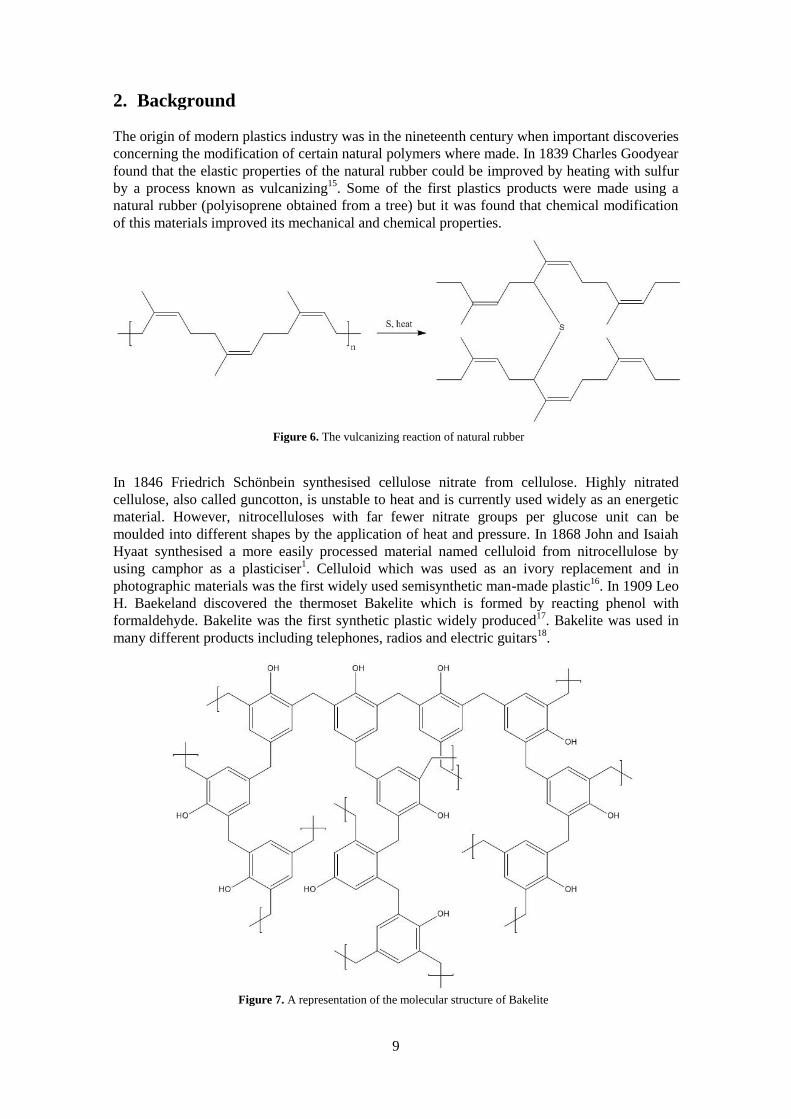
2. Background
The origin of modern plastics industry was in the nineteenth century when important discoveries
concerning the modification of certain natural polymers where made. In 1839 Charles Goodyear
found that the elastic properties of the natural rubber could be improved by heating with sulfur
by a process known as vulcanizing15
. Some of the first plastics products were made using a
natural rubber (polyisoprene obtained from a tree) but it was found that chemical modification
of this materials improved its mechanical and chemical properties.
In 1846 Friedrich Schönbein synthesised cellulose nitrate from cellulose. Highly nitrated
cellulose, also called guncotton, is unstable to heat and is currently used widely as an energetic
material. However, nitrocelluloses with far fewer nitrate groups per glucose unit can be
moulded into different shapes by the application of heat and pressure. In 1868 John and Isaiah
Hyaat synthesised a more easily processed material named celluloid from nitrocellulose by
using camphor as a plasticiser1. Celluloid which was used as an ivory replacement and in
photographic materials was the first widely used semisynthetic man-made plastic16
. In 1909 Leo
H. Baekeland discovered the thermoset Bakelite which is formed by reacting phenol with
formaldehyde. Bakelite was the first synthetic plastic widely produced17
. Bakelite was used in
many different products including telephones, radios and electric guitars18
.
Figure 7. A representation of the molecular structure of Bakelite
Figure 6. The vulcanizing reaction of natural rubber
10
Despite of these important discoveries there was a considerable lack of understanding of the
nature of polymers. It was widely believed that polymers consisted of small joined molecules.
The misconception was corrected by Staudinger in 1920. Staudinger stated that polymers were
composed of very large molecules containing long sequences of simple chemical units linked
together by covalent bonds. He also introduced the word macromolecule to describe polymers1.
The experiments of Staudinger on the synthesis of polyoxymethylene (polyformaldehyde) and
polystyrene and the studies of Carothers on the preparation of polyamides and polyesters in
1929 confirmed the hypothesis17
. Staudinger concepts enabled a rational interpretation of the
previous experiments and set up the bases of the modern polymer industry. In subsequent years
a large number of synthetic polymers were produced for the first time on a large scale. These
include polyethylene (PE), polystyrene (PS), poly(methyl methacrylate) (PMMA), polyvinyl
chloride (PVC) or polytetrafluoroethylene (PTFE), as well as many others1. During the Second
World War plastics played an important role, e.g. polyethylene as insulation in submarine and
radar cables19
or nylon in parachutes and B-29 bomber tires20
. After the war plastics industry
increased dramatically and a large number of new polymeric materials were produced and used
in completely new applications such as silicone gel in breast implants (1962), produced by
Dow-Corning (withdrawn from the market over 15 years ago)21
, and Kevlar that was
developed by DuPont in 1965 for use in a range of products including bullet resistant vests22
.
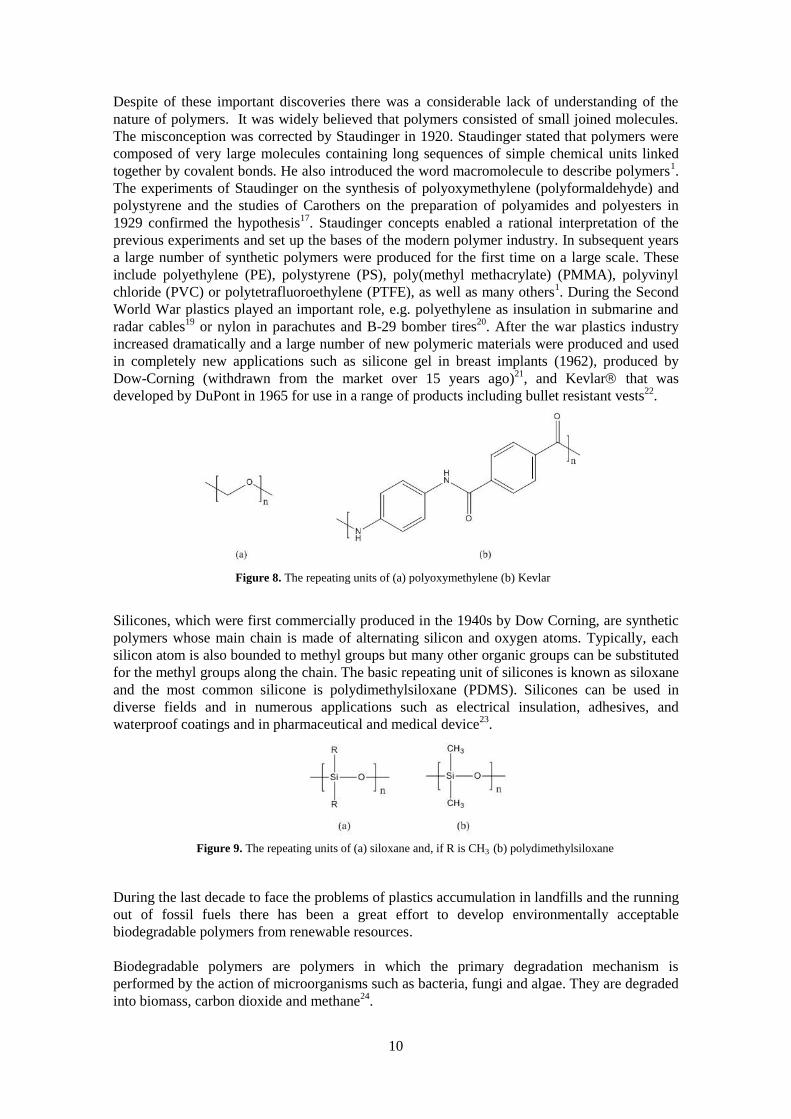
Silicones, which were first commercially produced in the 1940s by Dow Corning, are synthetic
polymers whose main chain is made of alternating silicon and oxygen atoms. Typically, each
silicon atom is also bounded to methyl groups but many other organic groups can be substituted
for the methyl groups along the chain. The basic repeating unit of silicones is known as siloxane
and the most common silicone is polydimethylsiloxane (PDMS). Silicones can be used in
diverse fields and in numerous applications such as electrical insulation, adhesives, and
waterproof coatings and in pharmaceutical and medical device23
.
During the last decade to face the problems of plastics accumulation in landfills and the running
out of fossil fuels there has been a great effort to develop environmentally acceptable
biodegradable polymers from renewable resources.
Biodegradable polymers are polymers in which the primary degradation mechanism is
performed by the action of microorganisms such as bacteria, fungi and algae. They are degraded
into biomass, carbon dioxide and methane24
.
Figure 8. The repeating units of (a) polyoxymethylene (b) Kevlar
Figure 9. The repeating units of (a) siloxane and, if R is CH3 (b) polydimethylsiloxane
11
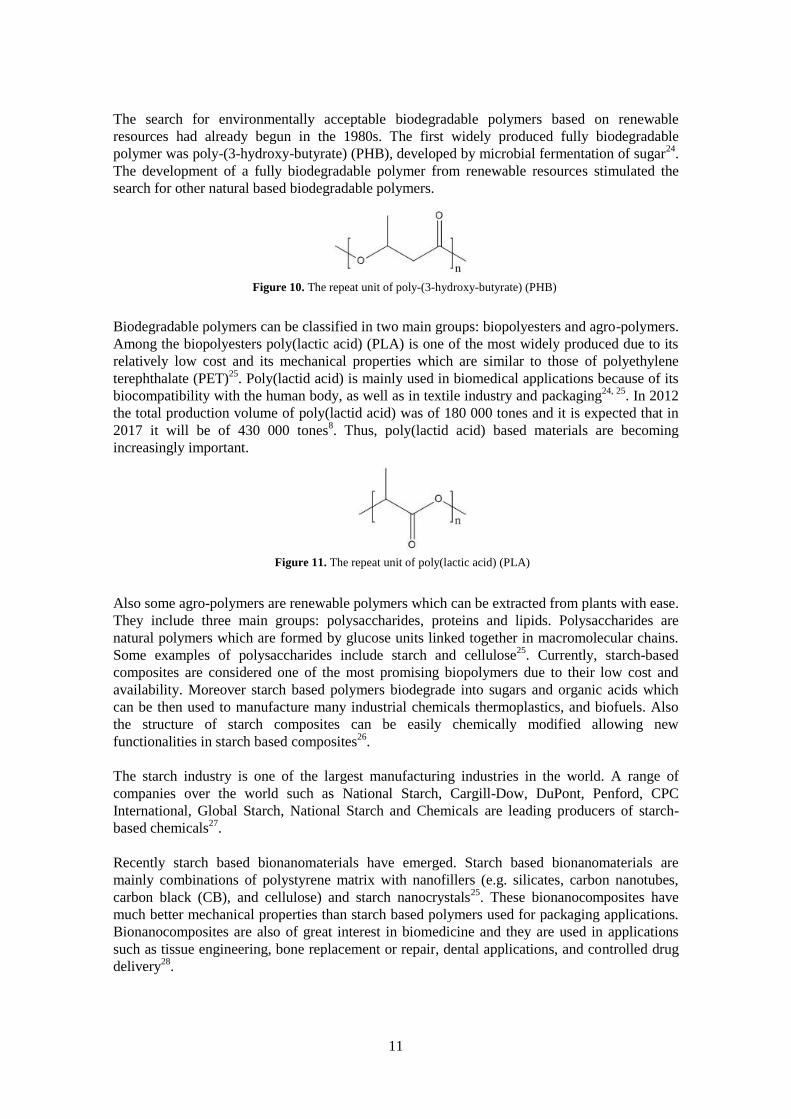
The search for environmentally acceptable biodegradable polymers based on renewable
resources had already begun in the 1980s. The first widely produced fully biodegradable
polymer was poly-(3-hydroxy-butyrate) (PHB), developed by microbial fermentation of sugar24
.
The development of a fully biodegradable polymer from renewable resources stimulated the
search for other natural based biodegradable polymers.
Biodegradable polymers can be classified in two main groups: biopolyesters and agro-polymers.
Among the biopolyesters poly(lactic acid) (PLA) is one of the most widely produced due to its
relatively low cost and its mechanical properties which are similar to those of polyethylene
terephthalate (PET)25
. Poly(lactid acid) is mainly used in biomedical applications because of its
biocompatibility with the human body, as well as in textile industry and packaging24, 25
. In 2012
the total production volume of poly(lactid acid) was of 180 000 tones and it is expected that in
2017 it will be of 430 000 tones8. Thus, poly(lactid acid) based materials are becoming
increasingly important.
Also some agro-polymers are renewable polymers which can be extracted from plants with ease.
They include three main groups: polysaccharides, proteins and lipids. Polysaccharides are
natural polymers which are formed by glucose units linked together in macromolecular chains.
Some examples of polysaccharides include starch and cellulose25
. Currently, starch-based
composites are considered one of the most promising biopolymers due to their low cost and
availability. Moreover starch based polymers biodegrade into sugars and organic acids which
can be then used to manufacture many industrial chemicals thermoplastics, and biofuels. Also
the structure of starch composites can be easily chemically modified allowing new
functionalities in starch based composites26
.
The starch industry is one of the largest manufacturing industries in the world. A range of
companies over the world such as National Starch, Cargill-Dow, DuPont, Penford, CPC
International, Global Starch, National Starch and Chemicals are leading producers of starch-
based chemicals27
.
Recently starch based bionanomaterials have emerged. Starch based bionanomaterials are
mainly combinations of polystyrene matrix with nanofillers (e.g. silicates, carbon nanotubes,
carbon black (CB), and cellulose) and starch nanocrystals25
. These bionanocomposites have
much better mechanical properties than starch based polymers used for packaging applications.
Bionanocomposites are also of great interest in biomedicine and they are used in applications
such as tissue engineering, bone replacement or repair, dental applications, and controlled drug
delivery28
.
Figure 10. The repeat unit of poly-(3-hydroxy-butyrate) (PHB)
Figure 11. The repeat unit of poly(lactic acid) (PLA)

12
3. Theory
3.1. Monomers and fillers
The organic monomers that were used to form the natural based composites in this project are:
styrene and myrcene. Alternatively, corn starch and benzyl starch are used as fillers.
Styrene also known as vinyl benzene is the simplest alkenylbenzene. At room temperature pure
styrene is a colourless liquid with a strong odour (boiling point: 145.2 oC, melting point: -30.6
oC, density at 20
oC: 0.9060 g·cm
-3, vapour pressure at 20
oC: 670 Pa)
29.
Styrene is mainly produced with a two-step process: alkylation of benzene followed by catalytic
dehydrogenation of ethylbenzene. First, benzene is alkylated with ethylene over a solid catalyst
to make ethylbenzene by a Friedel-Crafts reaction. In the second step ethylbenzene is
dehydrogenated at high temperature (600 oC) in presence of a catalyst
30, 31.
Benzene and ethylene (ethene) are commonly obtained from petroleum and coal. Benzene and
ethylene can be obtained from other processes. Benzene can be formed from alkanes (found in
petroleum) by catalytic reforming and ethylene can be obtained from diesel fuel, naphtha and
liquefied petroleum gas (LPG) by steam cracking32
.
Myrcene is a terpene obtained from barberry wax and from oils of bay and verbena. Terpenes
are volatile constituents of plants resins and essential oils. The essential oils are extracted from
plants by distillation33
. The main characteristic of the structure of terpenes is that their carbon
skeleton can be divided into two or more isoprene units. This is known as the isoprene rule34
.
However recent research have shown that not isoprene but mevalonic acid is the true precursor
of terpenes. Mevalonic acid is formed from three acetate units. To synthesise terpenes such as
myrcene the pyrophosphorylation of the primary alcohol with ATP is carried out.
Pyrophosphorylation involves the transfer of phosphate groups (PO43-
) from ATP to mevalonic
acid. The removal of these groups supplies the energy required to carry out the chemical
reaction33
.
Figure 12. A common industrial preparation of styrene
Figure 13. The molecular structure of adenosine triphosphate (ATP)

13
In the next step mevalonic acid loses one carbon in CO2 form by elimination reaction to give a
five carbon precursor. Isopentenyl pyrophosphate is in an equilibrium with dimethylallyl
pyrophosphate by allylic proton transfer33
.
The two five carbons intermediates react with each other to produce geranyl pyrophosphate.
Figure 14. The pyrophosphorylation of mevalonic acid with ATP
Figure 15. The elimination reaction
Figure 17. The formation of geranyl pyrophosphate
Figure 16. The allylic proton transfer equilibrium of mevalonic acid products

14
Geranyl pyrophosphate is the starting point for all terpenes with ten carbons, also known as
diterpenes, such as myrcene. In particular myrcene can be produced by E2 elimination in
presence of a base.
Starch is one of the most abundant polysaccharides in nature and it is produced by plants such
as potato, corn and rice. Amylose and amylopectin are the two major components of starch.
Amylose has a linear structure and is made principally of glucose units linked at 1 and 4 sites.
On the other hand amylopectin is highly branched and is formed by glucose units linked at 1
and 4 sites and glucose units linked at 1 and 6 sites at the branch points.
Figure 18. The synthesis of myrcene by E2 elimination from geranyl pyrophosphate
Figure 19. A short section of an amylose chain (a) and an amylopectin chain (b)

15
Different starches have different proportion of amylose and amylopectin in their structure. Corn
starch was used in this project work, it is very branched because it has a high concentration of
amylopectin whereas potato starch is almost completely linear (almost pure amylose)27
.
Corn starch is obtained from the tissue that surrounds the embryo of the corn grain and refined
by a wet milling process. At first, the corn is cleaned and soaked in steep water at 50 oC for 20
to 48 hours to extract soluble materials from the grain. The steep water contains small quantities
of sulfur dioxide (SO2) to prevent the growth of bacteria and to facilitate the separation of
starch and protein. When the steeping is finished the corn is milled. The steep water is
concentrated by evaporation and used to produce animal feed products, while the grain is
ground in an attrition mill to separate the germ from starch, hulls and gluten. Then water is
added to the mill and a mixture of whole germs and macerated slurry is obtained. The slurry is
added to a hydroclone separator to remove the corn germ from the mixture. The extracted germ
is dried and sold for further processing into corn oil. The slurry is then ground a mill. After the
grinding the hull particles are caught on screens, while the starch and gluten pass through. Next,
the mixture of starch and gluten is separated by centrifugation. The gluten is dried and used in
animal feed. Finally the starch is washed and dewatered and is either sold as corn starch or
further processed into other products such as syrups and ethanol34,35
. The largest producer of
corn starch is the United States of America but this product is also produced in South America,
Europe and Asia.
The other filler used in this project is benzyl starch. This benzyl starch was obtained by
benzylation of corn starch in a sodium hydroxide solution. The alkylation agent used is benzyl
chloride, an alkyl halide. In the reaction sodium hydroxide randomly deprotonates one of the
three hydroxyl groups that are present in the glucose molecule. The alkoxide thus formed is
alkylated in a SN2 reaction. An example benzylation reaction of an amylose starch is shown
below.
The addition of the benzyl groups to corn starch was intended to increase the compatibility of
starch with polystyrene-myrcene copolymer as the benzene rings in benzyl starch are able to
interact with benzyl rings in polystyrene through π-π effects36
. Benzyl starch has been found by
others to be compatible with polyurethanes formed from 4,4-Diphenylmethane diisocyanate
(MDI)37
.
Figure 20. The benzylation of pure amylase starch

16
Most of the monomers that are commercially distributed contain a stabilizer to prevent
premature polymerization during the transport and storage of the monomers. An inhibitor is a
substance that reacts with the free-radical active centre to produce species which are not capable
of undergoing the polymerization reaction. 4-tert-butylcatechol is the inhibitor present in
styrene and butylated hydroxytoluene (BHT) is present the myrcene purchased from Aldrich.
Therefore styrene and myrcene must be destabilized before carrying out the polymerization
reactions
3.1.1. Destabilization of styrene
Styrene can be destabilized by extracting 4-tert-butylcatechol inhibitor from styrene with
sodium hydroxide using gravity to separate the layers. This is an extraction of an organic acid
where polystyrene is the organic phase and the aqueous phase is the solution of sodium
hydroxide (2 M). According to the Nernst distribution law the distribution ratio DHA can be
defined. As only one chemical form of the protonated acid exists then KD and D are the same:
( ) ( ) [ ] [ ] [ ]
( )
But if the organic acid dissociates in the aqueous phase the equation describing the distribution
ratio becomes more complex:
[ ]
[ ] [ ]
[ ][ ]
[ ] ( )
If equation (1) and (2) are combined the following equation is obtained38
:
[ ]
( )
Figure 21. The molecular structures of (a) 4-tert-butylcatechol and (b) butylated hydroxytoluene (BHT)
inhibitors

17
0
20
40
60
80
100
120
0 1 2 3 4 5 6 7 8 9 10 11 12 13 14
D
pH
If arbitrary values of 100 for KD,HA and 0 for KD,A are assumed and when the pKa is set at 9
(phenol relative to water)38
the following graph of DA versus pH can be plotted.
Figure 22. The distribution ratio of 4-tert-butylcatechol (pKa = 9) in different pH and with arbitrary values of KD for
the protonated and deprotonated forms of the compound
So a sodium hydroxide solution is shaken with the styrene and its inhibitor, the inhibitor is
extracted into the aqueous layer. As it can be seen in figure 22, at alkaline pH the distribution
ratio of 4-tert-butylcatechol is very small which means that the fraction of the inhibitor in the
aqueous phase is large.
3.1.2. Destabilization of myrcene
Myrcene can be destabilized by separating myrcene from butylated hydroxytoluene by steam
distillation. Steam distillation is a technique used to distill immiscible mixtures formed by an
organic compound and water. The method is based on the fact that the total vapour pressure is
the sum of the vapour pressures of each pure component which are independent of the other. As
the liquids are not miscible the activities are independent of the mole ratio of the two liquids.
Hence, when the sum of the individual vapour pressures equals the atmospheric pressure the
mixture boils at a lower temperature than either of the pure liquids39
.
As an example of this method a mixture of two components, water and aniline, can be
considered. The vapour pressure as function of temperature of the components can be calculated
with the Clausius-Clapeyron equation.
(
) ( )
Where P is the vapour pressure, L is the DeltaH of vaporization, R is the specific gas constant
and T is the temperature.

18
Table 1. The boiling point and the DeltaH of vaporization for each component40
Substance Boiling Point at 760 mmHg (oC) ∆Hvap (kJ·mol
-1)
Water 100 40.7
Aniline 184 41.9
Gallium 2400 258
Mercury 357 59.11
The total vapour pressure and the vapour pressure of each component as function of temperature
can be plotted.
At 97.73 oC the sum of the individual vapour pressures equals the atmospheric pressure, hence
the mixture boils. This only applies to pairs of immiscible liquids.
( )
Thus, by using this technique aniline can be distilled below 100 oC even though its boiling point
is 184 oC.
0
20000
40000
60000
80000
100000
120000
0 20 40 60 80 100 120
Vap
ou
r P
ress
ure
(P
a)
Temperture (oC)
Aniline
Water
Total
Figure 23. The vapour pressure as a function of the temperature for every component and for the mixture

19
0
1
2
3
4
5
6
7
8
0 20 40 60 80 100
Pe
rce
nta
ge o
f an
ilin
e (
mo
l/m
ol)
in
vap
ou
r
Temperture (oC)
0
5000
10000
15000
20000
25000
30000
35000
50 100 150 200 250 300
Vap
ou
r p
reas
sure
(P
a)
Temperture (oC)
Total
Mercury
Gallium
The relative amount of aniline in the vapour phase, and hence the distillate, is directly
proportional to the individual vapour pressures.
Another example that can be considered is a mixture of gallium and mercury. In this case unlike
aniline and water both substances are fully miscible with each other. Assuming that the activity
coefficients are all equal to 1 the total vapour pressure and the vapour pressure of a 1:1 (by
moles) of mixture mercury and gallium can be calculated as a function of the temperature.
Figure 24. The percentage of aniline in the vapour phase
Figure 25. The vapour pressure of the two components as a function of the temperature (over the range 50 to 300oC)
20
0,001
0,01
0,1
1
10
0,1 1 10 100
Me
rcu
ry p
arti
al p
ress
ure
Mole percentage of mercury in mixture
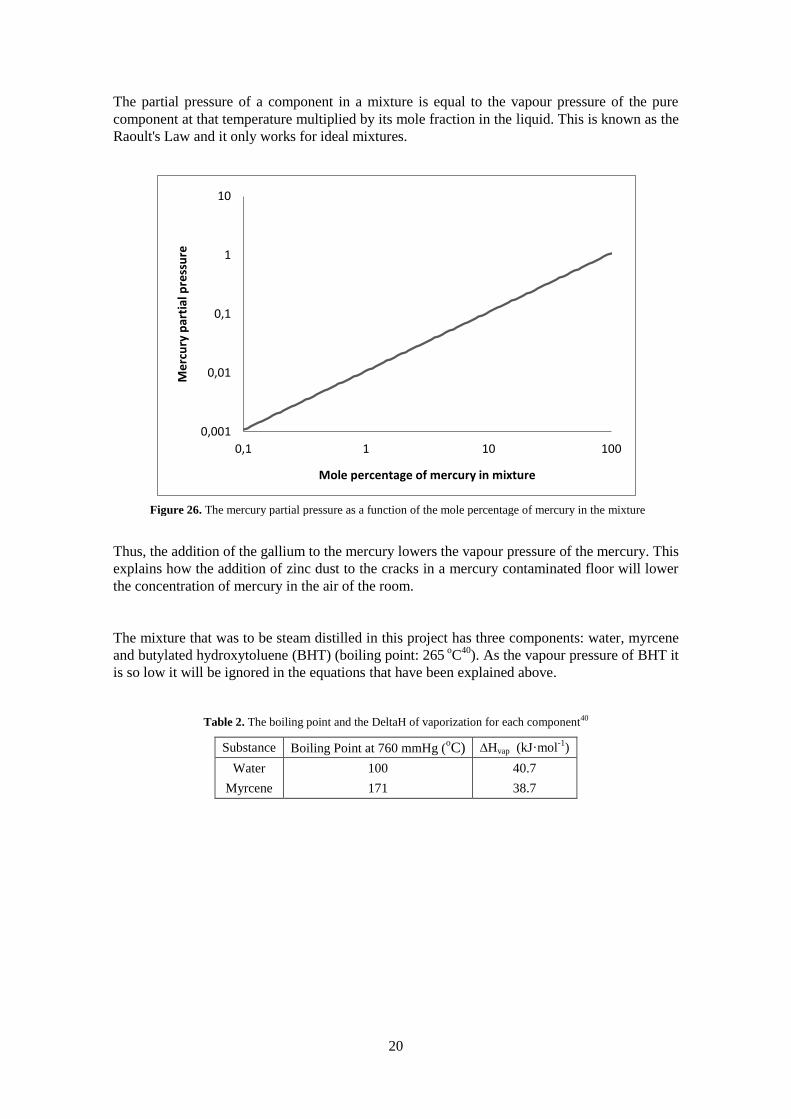
The partial pressure of a component in a mixture is equal to the vapour pressure of the pure
component at that temperature multiplied by its mole fraction in the liquid. This is known as the
Raoult's Law and it only works for ideal mixtures.
Thus, the addition of the gallium to the mercury lowers the vapour pressure of the mercury. This
explains how the addition of zinc dust to the cracks in a mercury contaminated floor will lower
the concentration of mercury in the air of the room.
The mixture that was to be steam distilled in this project has three components: water, myrcene
and butylated hydroxytoluene (BHT) (boiling point: 265 oC
40). As the vapour pressure of BHT it
is so low it will be ignored in the equations that have been explained above.
Table 2. The boiling point and the DeltaH of vaporization for each component40
Substance Boiling Point at 760 mmHg (oC) ∆Hvap (kJ·mol
-1)
Water 100 40.7
Myrcene 171 38.7
Figure 26. The mercury partial pressure as a function of the mole percentage of mercury in the mixture

21
The total vapour pressure and the vapour pressure of each component as function of temperature
can be plotted.
At 97.4 oC the sum of the individual vapour pressures equals the atmospheric pressure, hence
the mixture boils.
The relative amounts of each component in the vapour phase, and hence the distillate, can be
calculated. The amount in moles of each component in the vapour phase is directly proportional
to their individual vapour pressures:
Therefore the distillate contains 0.105 mole myrcene per mole of water. Translated into weight,
the distillate contains 14.3 g myrcene per 18 g of water, or circa 45% myrcene by weight.
Thus, by using this technique myrcene can be separated from butylated hydroxytoluene and any
polymeric impurities by distillation below 100 oC even though its boiling point is 171
oC.
After carrying out the steam distillation of myrcene, water and remaining traces of BHT are
removed from myrcene by using the same method as that used for styrene.
0
20000
40000
60000
80000
100000
120000
15 30 45 60 75 90
Vap
ou
r P
ress
ure
(P
a)
Temperature (oC)
Mixture
Water
Myrcene
Figure 27. The vapour pressure as a function of the temperature for every component and for the mixture

22
3.2. Plant-based materials synthesis
Three plant-based materials were synthesised: a polystyrene-myrcene copolymer, a polystyrene-
myrcene-corn starch composite and a polystyrene-myrcene-benzyl starch composite. In all cases
the chemical reaction is a free radical chain-growth polymerization reaction. In chain-growth
addition polymerization there is a series of reactions each of which consumes a reactive species
and produces another similar species. Therefore each individual step requires the reactive
species formed in the previous one. The reactive species can be free radicals, cations, or
anions41
. In the polymerization reactions of the three plant-based materials the reactive particle
involved is a free-radical. Free radicals have the advantage of being very mobile in most
solvents as they are often weakly bonded (solvated) to the solvent.
In addition to the general class of the synthesis reaction (addition vs condensation) the reaction
conditions determine the polymer structure and, consequently, the polymer properties. For
example the same monomer in an emulsion polymerization can form very fine particles while
larger particles are formed in suspension polymerizations.
The same monomer can react in two different addition reactions to form different products. For
example the conversion of ethylene (ethane) into polyethylene. The high pressure free radical
polymerization of ethylene produces side branched polyethylene. On the other hand ethylene
polymerized with Zeigler-Natta catalyst (a non radical process) is very linear. The branched
polyethylene also known as low density polyethylene (LDPE) is flexible, is a good electrical
isolator and has a low tensile strength. It is used to make plastic film wrap, cables, bags and
plastic items that need to be moulded. Linear polyethylene also known as high density
polyethylene (HDPE) is stronger and more resistant to chemicals than low density polyethylene
and it is mainly used for items requiring blow moulding techniques, such as toys, automobile
parts and bottles7. Thus, LDPE and HDPE are completely different polymers even while they
are formed from the same monomer.
Two other important related factors that must be considered during polymer synthesis are
viscosity and heat dissipation. Polymer melts and polymer solutions have a very high viscosity
because of the shape and length of their molecular chains. During the polymers synthesis the
viscosity of the reaction mixture increases greatly. This can cause difficulties in pumping,
stirring and heat dissipation. Heat dissipation is crucial as nearly all chain growth
polymerizations are strongly exothermic and polymers are poor conductors of heat. Inefficient
removal of heat can lead to an autoacceleration and to a fast increase of the temperature. The
autoacceleration of the polymerization reaction is known as the gel effect. The gel effect is
consequence of the increase in viscosity of the reaction mixture due to the formation of polymer
molecules that slow termination reactions. (The gel effect will be discussed later in great detail).
The gel effect can be avoided by carrying out the polymerization reaction at low conversions as
gel effect occurs at intermediate or high degrees of conversion42
. Alternatively the monomer can
be diluted in a solvent which reduces the increase of viscosity.
There are many different methods to perform free-radical polymerization. In this project work
the polystyrene-myrcene copolymer will be synthesised by the solution polymerization method
and the polystyrene-myrcene-corn starch composite and a polystyrene-myrcene-benzyl starch
composite will be synthesised by the suspension polymerization method.
The solution polymerization method is characterised by the addition of a solvent to the reaction
mixture to reduce the viscosity and facilitate heat dissipation reducing the risk of
autoacceleration. However this solvent addition has some disadvantages. The rate and degree of
polymerization are reduced as the monomer concentration is decreased. Also the solvent has to
be carefully chosen as it can lead to a further reduction in the degree of polymerization.

23
Furthermore, the polymer obtained has to be separated from the mixture by either evaporation
of the solvent or precipitation of the polymer by adding the solution to an excess of non-solvent.
For these reasons solution polymerization is only used in industry to produce polymers that later
on will be used in solution43
. Some examples include surface coatings and industrial glues.
Another way to solve the viscosity and heat dissipation problems is the suspension
polymerization method. In this method the reaction mixture is suspended as small droplets in an
inert non-solvent medium. Each droplet acts as a small bulk reactor and it is suspended by
agitation and by dispersing agent such a surfactant or inert solid. The high surface area of the
droplets and the low viscosity of the aqueous continuous phase allows good heat dissipation
which helps to keep the rate of reaction under control despite the autoacceleration. The product
is obtained in the form of beads (typically 0.1-2 mm diameter) and can be easily separated by
filtration. This polymerization method is widely used on an industry scale to produce
polystyrene, polyvinylchloride and poly(methyl methacrylate)43
.
In the case of the production of the polystyrene-myrcene-corn starch composite corn starch
rather than being incorporated into the solid polymer it acts as a dispersing agent during the
suspension polymerization method and as a filler of the final composite.
In the polystyrene-myrcene-benzyl starch composite production the benzyl starch is also used as
a dispersing agent and as a filler. The benzyl starch is less hydrophilic than untreated starch. As
the benzene rings in benzyl starch interact with benzyl rings in styrene and polystyrene through
π-π effects the styrene is more able to wet the benzyl starch. Hence, it was expected that the
benzyl starch will form a solid which is more compatible with polystyrene-myrcene copolymer
than untreated corn starch36
.
As explained above the three plant-based materials synthesised are formed by a free-radical
polymerization reactions in which the monomers were converted into polymers. This
polymerization mechanism can be divided in three main steps: initiation, where the free radicals
are formed, propagation, where the products are evolved, and termination, when the active
centres are deactivated.
3.2.1.1. Initiation
Initiation is the first step of the free-radical polymerization mechanism. In this step free radicals
are formed by the decomposition of an initiator. The initiator used was AIBN (2,2′-Azobis(2-
methylpropionitrile)) which is a thermal initiator and one of the most important azo compounds.
AIBN breaks down to form two free radicals as shown in the reaction below44
.
Figure 28. The thermal decomposition of AIBN

24
Another substance that is commonly used as an initiator is benzyl peroxide (BPO). Benzyl
peroxide is also a thermal initiator and it decomposes as follows44
:
Figure 29. The thermal decomposition of BPO
However, in this project AIBN is used instead of benzoyl peroxide because benzoyl peroxide is
explosive. It can ignite at temperatures above 80 oC and it is also sensitive to shock and
friction45
. The storage and use of explosives in industrial materials recycling is forbidden as it
would violate the radioactivity license of nuclear chemistry.
The decomposition of AIBN follows a first order rate law because at a given temperature and in
a given solvent the reaction rate depends linearly only on the AIBN concentration.
[ ]
[ ] ( )
The reaction rate has units of moles per time and k is the rate constant (time-1
). Moreover the
time required for half of the quantity of AIBN to be decomposed (t1/2
) can be calculated with the
following equation for a first order reaction:
⁄
( )
Using the Arrhenius equation, the exponential decay law, and decomposition rate (kd) data
obtained at different temperatures the amount of AIBN is required for the polymerization
reaction at a different temperature and total reaction time can be predicted.
Table 3. The decomposition rates for AINB at different temperatures with Benzene as a solvent46
.
Temperature (oC) Decomposition rate (kd) (s
-1)
50 2.09·10-6
60 8.45·10-6
70 3.17·10-5
Using a semi-logarithmic graph the Arrhenius equation can be used to make a prediction of the
decomposition rate at a new temperature.
( ) (
) ( ) ( )
(
) ( )
Where A is a pre-exponential factor, Ea is the activation energy, R is the universal gas constant
and T is the temperature (K). It is important to note that if the solvent is changed then both the
activation energy and the pre-exponential factor can change.

25
Figure 30. The Arrhenius equation
Once the decomposition rate is known the exponential decay law can be applied to determine
how much AIBN is left after a desired reaction time or, equally, how much AIBN has been
consumed.
( ) ( ) ( )
Where N is the quantity of AIBN at reaction time t, N0 is the initial quantity of AIBN and k is
the decomposition rate (time-1
).
When then initiator has been decomposed the free radicals generated are added either to the
double bonds of styrene or myrcene monomers. The reaction of styrene with the 2-cyanoprop-2-
yl radical is shown below.
Figure 31. The initiation step of styrene
The reason why this styrene free radical, rather than the other possible radical, is formed is
because it is stabilized by resonance as shown in the figure below.
y = -15755x + 35,691 R² = 0,9992
-14
-12
-10
-8
-6
-4
-2
0
0,0026 0,0027 0,0028 0,0029 0,003 0,0031 0,0032
Ln(k)
1/T (K-1)
Figure 32. The free radical stabilization by resonance of Styrene
26
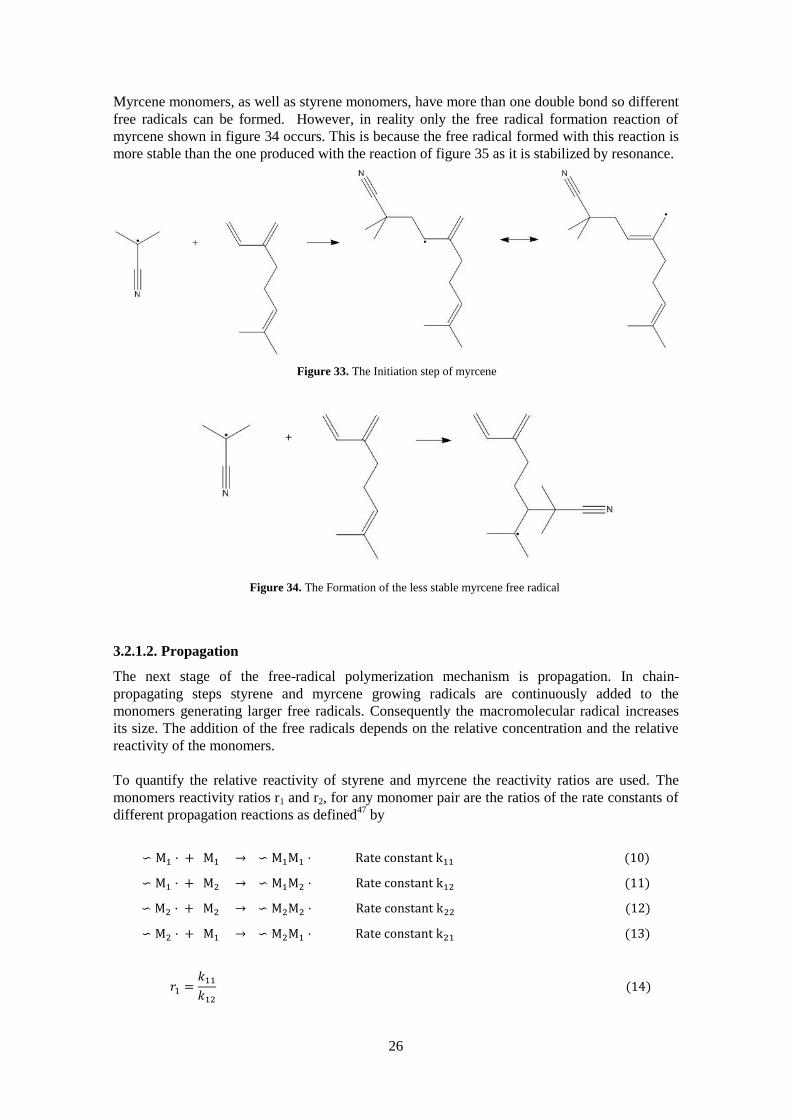
Myrcene monomers, as well as styrene monomers, have more than one double bond so different
free radicals can be formed. However, in reality only the free radical formation reaction of
myrcene shown in figure 34 occurs. This is because the free radical formed with this reaction is
more stable than the one produced with the reaction of figure 35 as it is stabilized by resonance.
3.2.1.2. Propagation
The next stage of the free-radical polymerization mechanism is propagation. In chain-
propagating steps styrene and myrcene growing radicals are continuously added to the
monomers generating larger free radicals. Consequently the macromolecular radical increases
its size. The addition of the free radicals depends on the relative concentration and the relative
reactivity of the monomers.
To quantify the relative reactivity of styrene and myrcene the reactivity ratios are used. The
monomers reactivity ratios r1 and r2, for any monomer pair are the ratios of the rate constants of
different propagation reactions as defined47
by
( )
( )
( )
( )
( )
Figure 33. The Initiation step of myrcene
Figure 34. The Formation of the less stable myrcene free radical

27
( )
M· represents a polymer chain ending in a radical derived from monomer M·.
In the table below the reactivity ratios for styrene and isoprene couple are given47
. Due to the
lack of data for myrcene, isoprene is used as a surrogate. This assumption was made as myrcene
and isoprene are both 3-alkyl butadienes.
Table 4. The reactivity ratios for three couples at 50 oC
M1 M2 r1 r2
Isoprene Styrene 7.6 0.14
Styrene Maleic anhydride 0.04 0.015
Ethylene Tetrafluoroethylene 0,61 0,024
As it can be seen in the table above for isoprene-styrene couple the reactivity ratio r1 is quite
high while the reactivity ratio r2 is very small. Thus, k11 is much higher than k12 and k21 is much
higher than k22. Then, from the propagation reactions it can be noticed that myrcene monomers
are more likely to be added to the polymer chain than styrene monomers.
By using the reactivity ratios the relationship between the composition of a copolymer and the
composition of the initial monomer mixture can be determined by
( )
( ) ( )
Where m1 and m2 are the moles of monomer 1 and 2 entering the copolymer, M1 and M2 are the
moles of monomer 1 and 2 in the monomer mixture, and r1 and r2 are the monomers reactivity
ratios48
.
The reactivity ratios can also be used as a guide to the type of copolymer structure which is
likely to be formed in the polymerization reaction. When the product of the reactivity ratios
(r1·r2) is close to zero the formation of an alternating polymer is favoured whereas when the
product is close to one a statistically random copolymer is preferably formed4. The product of
reactivity ratios can be greater than one. As an example the monomer reactivity ratios product
for styrene-maleic anhydride copolymer, which is a well-known alternating copolymer, is 6·10-
4. On the other hand (r1·r2) for myrcene-styrene copolymer is 1.064 which is close to one.
Another example of mixture of monomers which has a strong tendency to form an alternating
polymer is polyethylene-tetrafluoroethylene. The product of their reactivity ratios is 0.015
which is close to zero.
Figure 35. The repeating unit formed from maleic anhydride

28
One commonly used empirical scheme for monomer reactivity ratios prediction is the Q-e
scheme. In the Q-e scheme, developed by Alfrey and Price, two important factors that influence
are the relative reactivity of the monomers and the polarization of the radical4.
In the Q-e scheme the monomer reactivity ratios are given by the following equations4:
[ ( )] ( )
[ ( )] ( )
Where Q is a measure of the monomer reactivity and e1 and e2 quantify the polarization
characteristics of the radical and the reactive monomer, respectively.
Q and e are empirical parameters that are calculated using the results from kinetics experiments;
styrene has been defined as having a Q value of 1 and e value of -0.8 4. In the table 5 the values
of Q and e are given for styrene, isoprene, maleic anhydride and isobutyl vinyl ether.
Table 5. The Q and e values for styrene, isoprene, maleic anhydride and isobutyl vinyl ether 49
Monomers Q e
Styrene 1 -0.8
Isoprene 3.33 -1.22
Maleic anhydride 0.23 2.25
Isobutyl vinyl ether 0.023 -1.77
The electronic effects are described by the e values. Electron poor free radicals such as those
which contain carbonyl groups, cyanide or ester groups have high e values, while electron rich
free radicals such as those which contain ether groups have lower values. For example maleic
anhydride which contains two carbonyl groups has a high e value whereas isobutyl vinyl ether
which contains an ether group has a low e value.
The Q-e scheme can also be used as a qualitative tool to predict copolymer structure. It has been
determined that monomers with similar Q and e values will tend to form statistically random
copolymers with the same proportion of incorporated monomers as in the feed, while when the
Q values are similar but e values are high and of opposite sign the alternating copolymer is
formed. As it can be seen in the table above styrene and isoprene have similar e values. On the
other hand styrene and maleic anhydride, an alternating copolymer, have e values of opposite
signs.
Therefore, according to the reactivity ratios product for myrcene-styrene copolymer as well as
Q-e scheme it can be reasonably assumed that polystyrene-myrcene copolymer synthesised is a
statistically random copolymer.

29
In the chain-propagating steps the free radicals formed during chain-initiating steps are added
either to styrene or myrcene monomers
.
Figure 36. The first and second steps of propagation from a myrcene free radical formed in the initiation step
Figure 37. The first and second steps of propagation from a styrene free radical formed in the initiating step
During propagation steps successive additions of a large number of monomer molecules occur.
In each addition step the consumption of a free radical is accompanied by the formation of a
new larger free radical. The time required for each propagation step typically is of the order of a
millisecond. Thus, several thousand additions can take place within a few seconds. Propagation
continues until the termination stage is reached.

30
3.2.1.3. Termination
The last step of the polymerization reaction is termination. In this stage the active centres are
deactivated and the growth of the polymer chain is terminated.
During this stage a phenomenon known as the gel effect can occur. The gel effect consists of the
autoacceleration of the rate of the polymerization reaction. It is consequence of the increase in
viscosity of the reaction mixture due to the formation of polymer molecules that slow
termination reactions. This increase of viscosity can cause difficulties in heat dissipation which
can lead to a fast increase of the temperature as nearly all chain growth polymerizations are
strongly exothermic and polymers are bad heat conductors. The gel effect can be avoided by
carrying out the polymerization reaction at low conversions as gel effect occurs at intermediate
or high degrees of conversion42
.
The two common mechanisms of termination are combination and disproportionation of two
free radicals. In a combination reaction two growing free radicals join together by a covalent
bond to form a large polymer molecule. As an example consider the polystyrene combination
reaction.
Alternatively, in a disproportionation reaction a hydrogen atom is abstracted from one growing
free radical by another. As a result two polymer molecules, one with a terminal saturated group
and one with a terminal unsaturated group, are formed.
As it can be noticed in the reactions above the polymer chains formed by disproportionation
have initiator fragments at only one end while combination yields polymer molecules with
initiator fragments at both ends.
During the polymerization some other reactions that can cause premature termination occur.
The most important is chain transfer. In chain transfer an atom or other group is transferred
Figure 38. The combination reaction of two polystyrene radicals
Figure 39. The disproportionation reaction of radicals

31
from a compound present in the reaction mixture to the growing chain of the polymer causing
the premature termination50
. These radical transfer reactions can be represented as
( )
Where XA can be monomer, initiator, solvent, or other substance and X is the atom or group
transferred.
As it can be seen in the reaction above the product of chain transfer is an inert polymer molecule
and, often, a new free radical capable of starting the growth of a new chain. As a result the
length of the polymer chains is decreased50
.
An example of transfer of a hydrogen atom between a growing chain of polystyrene and a
polystyrene monomer is presented below.
Figure 40. The hydrogen transfer between a growing chain of polystyrene and a polystyrene monomer
Another example is low density polyethylene synthesis (LDPE), where the radical transfers to a
carbon near the final atom. As a result the side chains of LDPE are generated. This
intermolecular transfer process is also termed backbiting. The figure below illustrates this
process. Backbiting has a significant influence on the structure, and hence, the properties of the
final polymer50
.
Figure 41. The mechanism of backbiting in LDPE synthesis

32
The presence of oxygen during the polymerization process can also cause the premature
termination. Oxygen binds to carbon centred radicals and form non radical products thus
stopping the reaction50
. To avoid oxygen inhibition many polymerization reactions are
performed in an inert atmosphere of nitrogen gas. The reaction by which the oxygen terminates
a growing chain of polystyrene is shown below.
Figure 42. The reaction of oxygen inhibition of a polystyrene growing chain
While peroxy compounds can decompose to form radicals the net effect of the oxygen is to
greatly reduce the radical concentration in the reaction mixture.
3.2.2. Extrusion of a benzyl starch-high impact polystyrene blend
After the synthesis of three different plant based materials a benzyl starch-high impact
polystyrene blend was extruded.
The high impact polystyrene (HIPS) is a multiphase material formed by a continuous rigid
polystyrene phase together with disperse rubber particles, typically polybutadiene51
. As in the
case of ABS the rubber phase increases the impact strength of the material and makes HIPS
tougher solid than pure52
. High impact polystyrene is used in several applications in which
impact resistance, machinability, and low cost are required. These include packaging, toys and
computers cases.
In a normal extrusion process the polymer, typically in pellet form, is fed into the extruder
cylinder through the hopper. The pellets are supplied to the screw which rotates within a heated
cylinder, or barrel. Pellets move forward along the barrel between the flights of the screw and
the hot walls of the cylinder. As pellets move along the barrel they melt due to the heat
delivered by the heating elements. The melted polymer is squeezed at high pressure by the
screw into the die. The shape and size of the die determines the dimensions of the profile of the
plastic strip or thread which comes out of the extruder. This extruded plastic is normally hot;
after it emerges from the die it rapidly cools which helps to maintain the profile of the extruded
matter. Finally the product formed is cut or rolled.
Typically an extruder can be divided into three distinct zones: the feed zone, the compression
zone and the material zone. The feed zone, where no heating takes place, is the one that receives
the polymer pellets. In the compression zone the material is melted and pressurised. Finally in

33
the material zone is a constant flow rate is imparted to the melt polymer9, 54
. A picture of a
regular extruder is shown below.
In this project an extruder used to mix benzyl starch and high impact polystyrene is an extruder
(AEV 330, Brabender Technologie). In this case a specific shape of the profile of the plastic
strip or thread which comes out of the extruder is not required. Instead, the profile is ground into
powder to, later on, press plates.
Another commonly used method for polymer processing is compression moulding. The mould
used in this processing method is in two parts, the lower half which usually contains a cavity
and the upper half which has a projection that matches the shaped cavity when the mould is
closed. During the process the polymer material is placed in the open mould cavity. Then upper
part is lowered and the polymer is compressed; it is simultaneously heated by the heated mould.
When the mould is closed the hot polymer flows and fills the mould completely. After holding
the two halves of the mould together the mould is opened and the part removed9, 54
.
In this project the machine used to make the polymers plates is (TP 200, Fontune Holland). The
mould used is rectangular and has a cavity of 0.5 mm deep.
In addition to the extrusion and compression moulding methods there are other methods used
for polymer processing which are not discussed in this project such as injection moulding, blow
moulding and the bubble blown method9, 54
.
Figure 43. A typical single screw extruder and die54
Figure 44. The production of objects by compression molding49

34
3.3. Methods
3.3.1. Proton nuclear magnetic resonance spectroscopy (1H NMR)
Nuclear magnetic resonance (NMR) spectroscopy is a versatile analytical tool widely used to
identify individual compounds and to determine the structure of most organic molecules.
Protons (spin=½) are a commonly used nuclide in nuclear magnetic spectroscopy.
Atomic nuclei possessing angular moment or spin have an associated magnetic moment. 1H
NMR is based on the fact that without an external applied magnetic field the nuclei have a
random orientation. However when an external magnetic field is applied the nuclei become
aligned either with (α orientation) or against (β orientation) the external magnetic field. The α
orientation is lower in energy; therefore more nuclei are aligned with the field than against the
field. In 1H NMR technique energy is supplied in the form of electromagnetic radiation to pump
the excess α oriented nuclei into the β state. The resonance is detected and converted into the
peaks of the 1H NMR spectrum
55, 56. In
1H NMR spectrum the signal intensity is plotted versus
the chemical shift (δ). The chemical shift is defined by the difference of the frequency of the
resonance expressed to that of the standard compound. For both proton and carbon MNR the
methyl resonance of tetramethylsilane (TMS) is used as the standard. The chemical shift is
expressed in parts per million (ppm) thus making it independent of the field strength56
.
( ) ( )
( )
Once 1
H NMR spectrum is obtained the following information can be extracted. The peak
positions, which depend on chemical environment, provide information about the different types
of hydrogens present in the molecule. The peak area, which depends on the number of
contributing nuclei, provides information about the relative number of hydrogen atoms in a
given environment. Moreover the fine structure of peak gives information about the presence of
hydrogen neighbours a hydrogen has. This is due to the fact that the magnetic field of one
nucleus has an effect on others. This effect which is expressed through bonds is known as
coupling. The number of lines is normally that can be seen is given by
( )
Where I is the nuclear spin and n is the number of nuclei. More than one coupling can occur to a
given nuclei56
.
3.3.2. Thermogravimetric analysis (TGA)
Thermogravimetric analysis (TGA) is analytical technique used to determinate the thermal
stabilities of materials and the size of any thermally induced mass change by monitoring the
weight change of a sample as a function of temperature or time when it is heated. The sample is
subjected to a controlled temperature program in a controlled atmosphere which can be air or an
inert atmosphere57, 58
.
In a TGA experiment the sample, placed in a pan, is hung from a recording thermobalance
which continuously measures its weight change as function of the temperature. The pan is
placed in a furnace and is heated or cooled during the experiment. The variation of the
temperature of the furnace chamber and of the temperature near the sample is measured by a
thermocouple. A sample is normally within flowing gas which maintains a constant
environment for the sample. This gas may be inert or a reactive gas that flows over the sample
and exits through an exhaust. In many cases a TGA experiment is performed using a linear

35
temperature ramp. It is common to choose a final temperature far in excess of the last
temperature induced change to ensure that that all chemical reactions are completed at the end
of the run58
.
In TGA curves the temperature at which the material undergoes thermal degradation beginning
(To) and the amount of inert residue remaining are provided (Mres). Commonly TGA
experiments can be used to determine the water or volatile solvent content of a sample57
.
3.3.3. Uniaxial tension test
The uniaxial tension test is a widely used test for evaluating materials. In this test the sample of
the material is gripped at the two ends by a test machine. Then a uniaxial load, a load which is
applied in only one direction, is applied by the machine, resulting in the gradual elongation and
eventual fracture of the sample.
The axial load and the change of the length of the sample are monitored and recorded. From the
data recorded several important mechanical properties of a material can be determined. These
include elastic deformation properties, such as Young’s modulus and Poisson’s ratio, yield
strength and ultimate tensile strength and ductility properties, such as elongation and reduction
in area59, 60
.
Typically the tensile test specimen has two shoulders from which the sample is gripped and a
reduced gauge section in between over which measurements are made. The cross sectional area
of the gauge section is reduced to be sure that deformation and failure are localized in this
region. Tensile test specimens are often standardized according to the ISO or ASTM
organizations. The specimens used in this project are standardized according to ISO 527-5A60
.
The primary output from a tensile test is the load, the tensile force that acts on the sample, as a
function of the increase in gauge length, or elongation. As the load and the elongation depend
on the dimensions of the sample they are normalized with respect to specimen dimensions.
Thus, engineering stress (s), or nominal stress, and engineering strain (e), or nominal strain, are
defined
( )
Where F is the tensile load and A0 is the initial cross-sectional area of the gauge section.
( )
Where L0 is the initial gauge length and ΔL is the nominal change in length.
Figure 45. A standardized tensile test specimen of a copolymer of benzyl starch with 50 % (w/w)
HIPS

36
Another possible way to work with data that is independent of the sample dimensions is to
define the true stress and the true strain. True stress (σ) uses the instantaneous area of the
specimen at any given point, as opposed to the initial area that uses nominal stress60
.
( )
Where F is the tensile load and Ai is the instantaneous cross-sectional area of the gauge section.
Assuming material volume remains constant true strain (ε), or logarithm strain, is defined as
∫
(
) ( )
Where L0 is the initial gauge length and Li is the instantaneous gauge length.
True and nominal values are related by the following expressions60
( ) ( )
( ) ( )
The differences between using true and nominal stress and strain are very small at very low
strains. Nominal stress and nominal strain are more commonly used during uniaxial tension test.
Thus, all mechanical properties explained below are based on nominal stress and nominal
strain60
.
The resulting curve stress versus strain is independent of specimen dimensions. From the stress-
strain curve several important mechanical properties can be determined. In figure 47 a typical
stress-strain curve for a rubber and glass materials is shown.
In general rubber materials have no linear range. Alternatively, glasses at room temperature
often have only an elastic range.
Figure 46. A typical stress strain curves for rubber and glass materials
Glass
Rubber

37
A stress-strain curve for an elastic-plastic material is shown below.
In the curve two different sections can be differentiated: the elastic region and the plastic region.
The initial portion of the curve is the elastic region. In this region the deformation is elastic
which means that the deformation is reversible. In the elastic deformation when the force is no
longer applied, the sample fully recovers its initial dimensions. In this region the strain is
proportional to the applied stress. The slope of this region is referred to as modulus of Young
(E). The Young’s modulus is a basic intrinsic physical property of all materials that measures
the resistance of a material to elastic deformation when stress is applied. It can be determined as
the ratio of the applied stress on a sample to the strain produced60
.
( )
Another mechanical property that can be determined in the elastic range is the Poisson’s ratio.
The Poisson’s ratio (ν) is the ratio of lateral contraction strain to axial strain in the direction of
the applied load.
( )
Where x is the direction of the applied load in the tensile test.
As the stress rises the stress-strain behaviour ceases to be linear. This region is defined as the
plastic region at which the deformation of the sample is irreversible. The stress value at which
the plastic deformation is initiated is defined as the yield stress (σy) of the material. However,
most materials do no exhibit the presence of this yielding point on the stress-strain curve.
Figure 47. A typical stress-strain curve for a plastic-elastic material

38
Therefore the yield stress is usually defined as the stress at which the plastic strain is 0.2 %.
Beyond the yield point there is elastic and plastic deformation60
.
Tensile strength (TS) is the highest value of stress. Tensile strength often implies the end of
uniform elongation and the start of localized necking60
.
Moreover the ability of a material to deform plastically without fracturing, or ductility, can be
studied. The most common way to determine the ductility of a material is by calculating the
percent elongation at break, which is defined simply as
( )
( )
Where L0 is the initial gauge length and Lf is the length of the gauge section at fracture.
Ductility can also be estimated by calculating the percent reduction of area. It is defined as
( )
( )
Where A0 is the initial cross-sectional area of the gauge section and Af is the cross-sectional
area at fracture60
.
Some other mechanical properties which are not discussed in this project can be determined
with tensile test such as the shear modulus, elastic limit, proportional limit, as well as many
others.
Figure 48. Necking in a Stress-strain curve for curve for a plastic-elastic material
Tensile
strength Fracture
stress

39
4. Hypotheses tested
1. It is possible to form a plastic from styrene, corn starch and myrcene with suitable
mechanical properties that can replace oil based plastics such as ABS.
2. The solid formed from the reaction of starch with benzyl chloride is more suitable for
forming a composite with polystyrene than untreated starch.
3. It is possible to obtain a material with mechanical properties similar to those of ABS by
extruding a benzyl starch-high impact polystyrene blend.

40
5. Materials
Styrene (Reagent Plus S4972-1 L with 4-tert-butylcatechol as stabilizer, ≥99%) and myrcene
(M100005-100 mL with 1000 ppm of butylated hydroxytoluene (BHT) as stabilizer) were
provided by Aldrich. AIBN (98%) was provided by ACROS. Corn starch was purchased from a
local supermarket {Majsstärkelse (MaizenaTM
) from Unilever}.
All the other organic reagents were purchased from either Aldrich or ACROS. Inorganic
reagents were purchased form either Aldrich or British Drug Houses (BDH).

41
6. Methods
In this section the experimental procedure followed during the laboratory experiments is
explained in detail. Furthermore the design and the methodology followed during the test are
described.
6.1. Experimental procedure
In order to obtain a plant based composite similar to ABS the following laboratory experiments
were carried out. All organic chemistry and polymer chemistry experiments were performed
while wearing eye protection and a lab coat. When the hands needed to be protected nitrile
rubber surgical gloves were worn
6.1.1. Destabilization of styrene
As it has been mentioned in the section 3 purchased styrene contained a free radical inhibitor: 4-
tert-butylcatechol. Therefore styrene must be destabilized before carrying out the
polymerization reaction.
The 4-tert-butylcatechol inhibitor was removed from styrene by separating it with sodium
hydroxide using a separation funnel. To do it the following procedure was used. Styrene (50 ml)
and aqueous 2M sodium hydroxide (50 ml) were added to a 500 ml separation funnel. The
separation funnel was shaken to mix the two liquids, after allowing the mixture to settle a
yellowish organic phase and a red aqueous phase were seen.
This is because phenols and catechols tend to form coloured quinones on exposure to oxygen
when in alkaline media. While a copper catalyst makes the reaction go faster, it will happen
without a catalyst61
. Then the aqueous phase was removed via the tap at the bottom of the funnel
and more of sodium hydroxide solution (50 ml) was added before shaking again. The process
was repeated several times until the aqueous phase was no longer red or pink. Finally the
styrene was washed with water to remove the sodium hydroxide remaining until the pH of the
aqueous layer was between 5 and 7. The pH was measured with a pH-indicator paper (Merck
Millipore International, pH 1-10 universal indicator). Unwanted destabilized styrene was added
to the non-halogenated solvent waste.
Figure 49. The first shaking of styrene with sodium hydroxide to remove its inhibitor (4-tert-
butylcatechol )

42
6.1.2. Destabilization of myrcene
Purchased myrcene contained butylated hydroxytoluene as an inhibitor. Therefore myrcene, as
well as styrene, must be destabilized before carrying out the polymerization reaction.
6.1.2.1. Method 1
Based on what was known about the destabilization of styrene the same method was tried for
myrcene. An attempt was made to remove butylated hydroxytoluene inhibitor from myrcene by
separating myrcene with sodium hydroxide by using gravity to separate the two liquids. It was
intended myrcene (5 ml) and aqueous 2M sodium hydroxide (5 ml) were added to a 100 ml
separation funnel. Then the aqueous phase had to be removed via the tap and sodium hydroxide
solution (5 ml) had to be added again. The process should have been repeated several times until
the aqueous phase was no longer coloured. Finally the myrcene had to be washed with water to
remove the remaining sodium hydroxide until the pH of the aqueous solution was between 5
and 7.
However when the separation funnel was shaken the formation of an emulsion was seen.
Something increased the stability of the emulsion by decreasing the surface tension between the
two liquids; this is an example of the third phase problem. Therefore it was impossible to
remove the aqueous phase from to the viscous milky white mixture. Finally the destabilization
of myrcene by this method was rejected.
6.1.2.2. Method 2
The second attempt that was tried was the removal of butylated hydroxytoluene (BHT) from
myrcene by separating myrcene with sodium hydroxide by centrifugation. To do it myrcene (1
ml) and aqueous 2M sodium hydroxide (1 ml) were added to a 3.5 ml glass tube. Once the glass
tube was shaken the formation of a viscous milky white mixture was seen. To break the
emulsion the glass tube was put in a centrifuge (Labofuge 200, Heraeus) during 5 minutes at
500 rpm. After the centrifugation two different colourless phases were seen. The lightest phase
(myrcene) was then removed with 1 ml pipet (Starstedt) and added to another 3.5 ml glass tube
with aqueous 2M sodium hydroxide (1 ml). Finally the same process was carried out three times
more to remove as much inhibitor as possible. Unwanted destabilized myrcene was added to the
non-halogenated solvent waste.
Although the inhibitor extraction appeared to have worked, further results indicated that a large
amount of the stabilizer was still present in myrcene. Hence, another destabilization method was
tried.
6.1.2.3. Method 3
The last method that was evaluated for the destabilization of myrcene was the removal of
butylated hydroxytoluene from myrcene by steam distillation. First of all water (500 ml) was
added to a 1 L three necked round bottom flask (two B19 sidenecks and a central neck of B29).
To this a still head joined to a Liebig condenser (B19, 200 mm active length) was attached. The
condenser was connected to a refrigerated circulator (Julabo F25, DPC) with water at 5 oC as a
coolant. The three necked flask was then heated electrically with a heating mantle. As soon as
the sum of the individual vapour pressures of water and myrcene was equal to the atmospheric
pressure (760 mmHg) water and myrcene were co-distilled. The distillate (water and myrcene
without inhibitor) was collected in a separation funnel with a distillation adapter. During this
process water was continuously added to the three necked flask. Finally the two immiscible
layers of distilled water and myrcene were separated using a separation funnel.

43
6.1.3. Synthesis of a polystyrene-myrcene copolymer by solution polymerization
Once styrene and myrcene were destabilized the polymerization of a styrene-myrcene
copolymer was performed. The first polymerization method tried was solution polymerization.
The destabilized myrcene-styrene mixture (40 ml) was placed in a 250 ml two-neck round
bottom flask (central neck of B24 and sideneck of B19), to this toluene (100 ml) and AIBN (200
mg) of were added. The reaction flask which was placed in an oil bath was equipped with a
Liebig condenser (B19, 200 mm active length) connected to a refrigerated circulator (Julabo
F25, DPC) delivering water at 5 oC as a coolant. The reaction mixture was stirred at 500 rpm
with a magnetic stirrer (RTC Basic, IKA) and the flask was flushed with nitrogen gas for 30
minutes to remove oxygen. After 30 minutes the sideneck on the flask was sealed and the oil
bath set to a 120 oC. When the solution started to boil the stirring rate was decreased to 300 rpm.
The reaction mixture was allowed to boil under reflux (24 hours).
After 24 hours boiling the reaction mixture was added to an agitated (300 rpm) 500 ml beaker
filled with ethanol (300 ml). Immediately the precipitation of a soft white polymer was seen.
The precipitate was stirred (300 rpm) (10 minutes). After this time the ethanol was removed by
decanting and added to the non-halogenated solvent waste. The solid remaining was dissolved
in a small volume of toluene. The beaker was covered with aluminium foil and it was left with
stirring (2 hours). The polymer solution was added carefully to an agitated (600 rpm) 1 L
spherical flask with flat bottom flask containing ethanol (1 L). As in the first precipitation
immediately the appearance of a soft white polymer was seen. Then it was left with agitation (3
hours). Later on the precipitate was separated from the liquid (mainly ethanol with some
toluene) by filtration. The spherical flask with flat bottom was washed several times to be sure
that the entire polymer was removed from the flask. A filter paper (circle 90 mm grade Ø,
Whatmman), a Büchner funnel and a 2 L Büchner flask were used to collect the polymer. The
filtrated solid was allowed to dry in air 30 minutes. After 30 minutes it was transferred to a jar
and allowed to dry for 1 week.
The myrcene used in this polymerization was destabilized using sodium hydroxide and the
emulsion broken by centrifugation.
In the table below the amounts of the chemical reagents added as well as the reaction times are
detailed.
Table 6. The reaction conditions of solution polymerization for different composition polystyrene-myrcene
copolymers
Synthesised polymer Styrene (ml) Myrcene (ml) AIBN (g) Reaction time (h)
Pure polystyrene 40.0 0.0 0.2950 22
Polystyrene 1 % (v/v) myrcene 39.6 0.4 0.2002 21
Polystyrene 2 % (v/v) myrcene 39.2 0.8 0.1993 19
Polystyrene 5 % (v/v) myrcene 38.0 2.0 0.2016 19
Polystyrene 10 % (v/v) myrcene 36.0 4.0 0.2017 21
Polystyrene 20 % (v/v) myrcene 28.8 7.2 0.1992 20
Pure myrcene 0.0 10.0 0.0693 24
6.1.4. Synthesis of a corn starch-polystyrene-myrcene composite by suspension
polymerization
The second polymerization method tried was suspension polymerization. The destabilized
styrene and water (500 ml) were placed in a 1 L ground glass flange flask with an inside flange
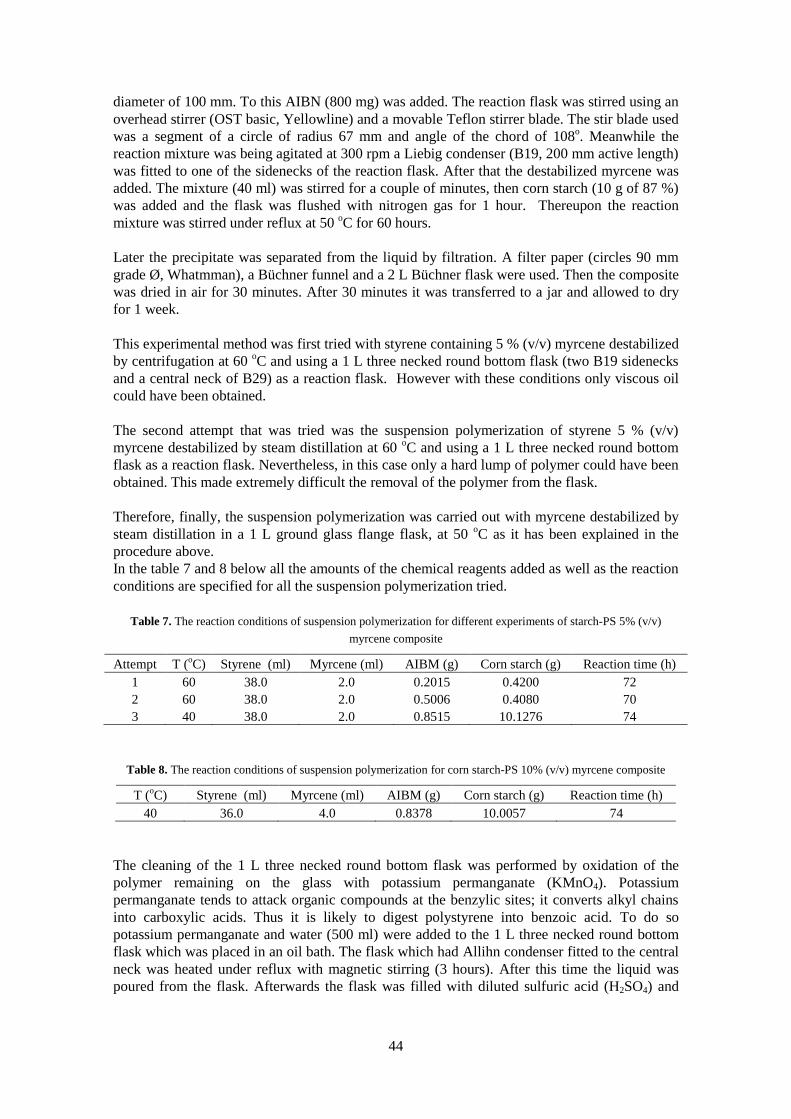
44
diameter of 100 mm. To this AIBN (800 mg) was added. The reaction flask was stirred using an
overhead stirrer (OST basic, Yellowline) and a movable Teflon stirrer blade. The stir blade used
was a segment of a circle of radius 67 mm and angle of the chord of 108o. Meanwhile the
reaction mixture was being agitated at 300 rpm a Liebig condenser (B19, 200 mm active length)
was fitted to one of the sidenecks of the reaction flask. After that the destabilized myrcene was
added. The mixture (40 ml) was stirred for a couple of minutes, then corn starch (10 g of 87 %)
was added and the flask was flushed with nitrogen gas for 1 hour. Thereupon the reaction
mixture was stirred under reflux at 50 oC for 60 hours.
Later the precipitate was separated from the liquid by filtration. A filter paper (circles 90 mm
grade Ø, Whatmman), a Büchner funnel and a 2 L Büchner flask were used. Then the composite
was dried in air for 30 minutes. After 30 minutes it was transferred to a jar and allowed to dry
for 1 week.
This experimental method was first tried with styrene containing 5 % (v/v) myrcene destabilized
by centrifugation at 60 oC and using a 1 L three necked round bottom flask (two B19 sidenecks
and a central neck of B29) as a reaction flask. However with these conditions only viscous oil
could have been obtained.
The second attempt that was tried was the suspension polymerization of styrene 5 % (v/v)
myrcene destabilized by steam distillation at 60 oC and using a 1 L three necked round bottom
flask as a reaction flask. Nevertheless, in this case only a hard lump of polymer could have been
obtained. This made extremely difficult the removal of the polymer from the flask.
Therefore, finally, the suspension polymerization was carried out with myrcene destabilized by
steam distillation in a 1 L ground glass flange flask, at 50 oC as it has been explained in the
procedure above.
In the table 7 and 8 below all the amounts of the chemical reagents added as well as the reaction
conditions are specified for all the suspension polymerization tried.
Table 7. The reaction conditions of suspension polymerization for different experiments of starch-PS 5% (v/v)
myrcene composite
Attempt T (oC) Styrene (ml) Myrcene (ml) AIBM (g) Corn starch (g) Reaction time (h)
1 60 38.0 2.0 0.2015 0.4200 72
2 60 38.0 2.0 0.5006 0.4080 70
3 40 38.0 2.0 0.8515 10.1276 74
Table 8. The reaction conditions of suspension polymerization for corn starch-PS 10% (v/v) myrcene composite
T (oC) Styrene (ml) Myrcene (ml) AIBM (g) Corn starch (g) Reaction time (h)
40 36.0 4.0 0.8378 10.0057 74
The cleaning of the 1 L three necked round bottom flask was performed by oxidation of the
polymer remaining on the glass with potassium permanganate (KMnO4). Potassium
permanganate tends to attack organic compounds at the benzylic sites; it converts alkyl chains
into carboxylic acids. Thus it is likely to digest polystyrene into benzoic acid. To do so
potassium permanganate and water (500 ml) were added to the 1 L three necked round bottom
flask which was placed in an oil bath. The flask which had Allihn condenser fitted to the central
neck was heated under reflux with magnetic stirring (3 hours). After this time the liquid was
poured from the flask. Afterwards the flask was filled with diluted sulfuric acid (H2SO4) and

45
was placed into an ultrasonic bath (2 hours). Finally the solid was removed from the flask easily
with the aid of a spatula.
6.1.5. Benzylation of corn starch
Corn starch (57.24 g of a 81 % grade) was added to the 1 L ground glass flange flask
(containing already water {500 ml}). The reaction flask was then stirred using an overhead
stirrer (Yellowline OST basic) and a movable Teflon stirrer blade. The stir blade used was a
segment of a circle of radius 67 mm and angle of the chord of 108o. Meanwhile the reaction
mixture was being agitated at 800 rpm a Liebig condenser (B19, 200 mm active length) was
fitted to one of the sidenecks of the reaction flask. The condenser was connected to a
refrigerator circulator (Julabo F25, DPC) which was set to deliver water at 5 oC. Because of the
corrosive nature of hot concentrated sodium hydroxide solution towards borosilicate glass it is
important to use a PTFE sleeve between all ground glass joints or to use vacuum tap grease to
prevent the surfaces sticking together.
A solution of sodium hydroxide was prepared by adding sodium hydroxide (87 g) to water (160
ml). The sodium hydroxide solution was added drop wise over 15 minutes from a 250 ml
dropping funnel to a stirred (300 rpm) of corn starch in water (500 ml) at 40 oC. The stirring rate
was increased to 700 rpm before benzyl chloride (110 ml) was added drop wise over 15 minutes
to the reaction flask. At this point the starch started to separate from the water because it was
becoming hydrophobic. Then the reaction mixture was boiled under reflux (2 hours) with
stirring at 300 rpm at 110 oC.
After being allowed to cool (circa 1 hour) the solid product obtained was transferred to a 1 L
beaker full of water. Then the solid was cut up into small pieces with a pair of scissors and it
was let in water overnight. Twice per day the solid was regularly cut up with scissors and the
water of the beaker was changed. As the days passed by the solid became harder as the sodium
hydroxide remaining was being gradually removed.
When the pH of the water measured with a pH-indicator paper (Merck Millipore International,
pH 1-10 universal indicator) was between 5 and 7 the water was removed and benzyl starch was
ground with a pestle and sieved. Then it was collected by filtration again using a filter paper
(circle 90 mm grade Ø, Whatmman), a Büchner funnel and a 2 L Büchner flask. Afterwards the
filtrated solid was placed in a 1 L beaker full of water all night long. Later benzyl starch was
collected again by filtration and placed in a desiccator with silica gel as a drying agent to dry.
Then the solid was dried to a constant mass before the benzyl starch was placed in a vacuum
oven at 30 oC for further drying.
6.1.6. Synthesis of a benzyl starch-polystyrene-myrcene composite by suspension
polymerization
The same method described in section 6.1.4 was followed for the suspension polymerization of
a benzyl starch-polystyrene 10 % (v/v) myrcene composite. However in this case instead of
adding corn starch (10 g) to the reaction mixture the equivalent benzyl starch (15.5575 g) was
added. In the table 9 the amounts of the chemical reagents added as well as the reaction
conditions are specified.
Table 9. The reaction conditions of suspension polymerization for benzyl starch PS 10% (v/v) myrcene composite
T (oC) Styrene (ml) Myrcene (ml) AIBM (g) Benzyl starch (g) Reaction time (h)
40 36.0 4.0 0.8484 15.5868 73

46
6.1.7. Extrusion of a benzyl starch-high impact polystyrene blend
After the synthesis of three different plant based composites two benzyl starch-high impact
polystyrene blends were extruded. The high impact polystyrene used was (Polystyrol 454 C,
BASF) and the mixtures were extruded with an extruder (AEV 330, Brabender Technologie).
The two blends were a 20% (w/w) benzyl starch HIPS and benzyl starch 50% (w/w) HIPS. In
both cases the total mass of the mixture was 45 g and the temperature of the extruder was set at
135 oC. The procedure followed in the two extrusions is explained below.
The powdered benzyl starch and high impact polystyrene in pellet form were added to the
extruder chamber. The screw rotation rate was set at 0.06 rpm (3 minutes) to melt and mixt the
two components. After that the screw rotation rate was increased to 50 rpm (5 minutes) to
facilitate the mixing process. Then the mixture was allowed to cool for (2 minutes) and removed
from the extruder with the aid of a spatula. Finally the product obtained was ground into powder
to make plates.
6.2. Performed tests
6.2.1. Proton nuclear magnetic resonance spectroscopy (1H NMR)
To determine if some myrcene had been incorporated into the polystyrene in the styrene-
myrcene solution copolymerization a proton nuclear magnetic resonance spectroscopy was
performed.
Pure polystyrene and polystyrene 1, 2, 5, and 10 % (v/v) myrcene copolymers were tested. The
samples were prepared by dissolving the polymers (0.03 g) in chloroform-d (CDCl3) (1 ml).
The solutions were then transferred to a 5 mm outside diameter glass tubes of 25 mm in length
specially made for 1H NMR spectroscopy. Finally the samples were analysed and the
1H NMR
spectrums were obtained.
6.2.2. Thermogravimetric analysis (TGA)
To determine if the synthesised benzyl starch could be pressed into plates and mixed and
extruded with high impact polystyrene a thermogravimetric analysis was performed. (TGA
7/DX, PerkinElmer) was used. The test was performed in two different controlled atmospheres:
air and nitrogen gas. The samples were placed in a standardised aluminium pan (PerkinElmer)
and hanged from a recording thermobalance. In both cases the initial temperature of the sample
was 25 oC, the temperature increase rate of 10
oC per minute and the gas flow was 20 ml per
minute. The test was performed up to 550 oC. The sample was held 1 minute at the initial and
the final temperature. All data were collected and analysed with Pyris software.
6.2.3. Uniaxial tension test
To determinate the mechanical properties of the synthesised corn starch based polymers uniaxial
tension test was carry out. To make the tension test specimens it was necessary to make polymer
plates first.
Corn starch based polymers plates were made with a (TP 200, Fontune Holland) hotpressing
machine. First the mould was filled with the powdered polymer and placed above a metal sheet.
The volume of the mould had been previously measured to know how many grams of polymer
had to be put to fill the mould completely. Once the mould was filled it was covered by another
metal plaque and placed into the machine. The temperature was set at 135 oC. The polymer was
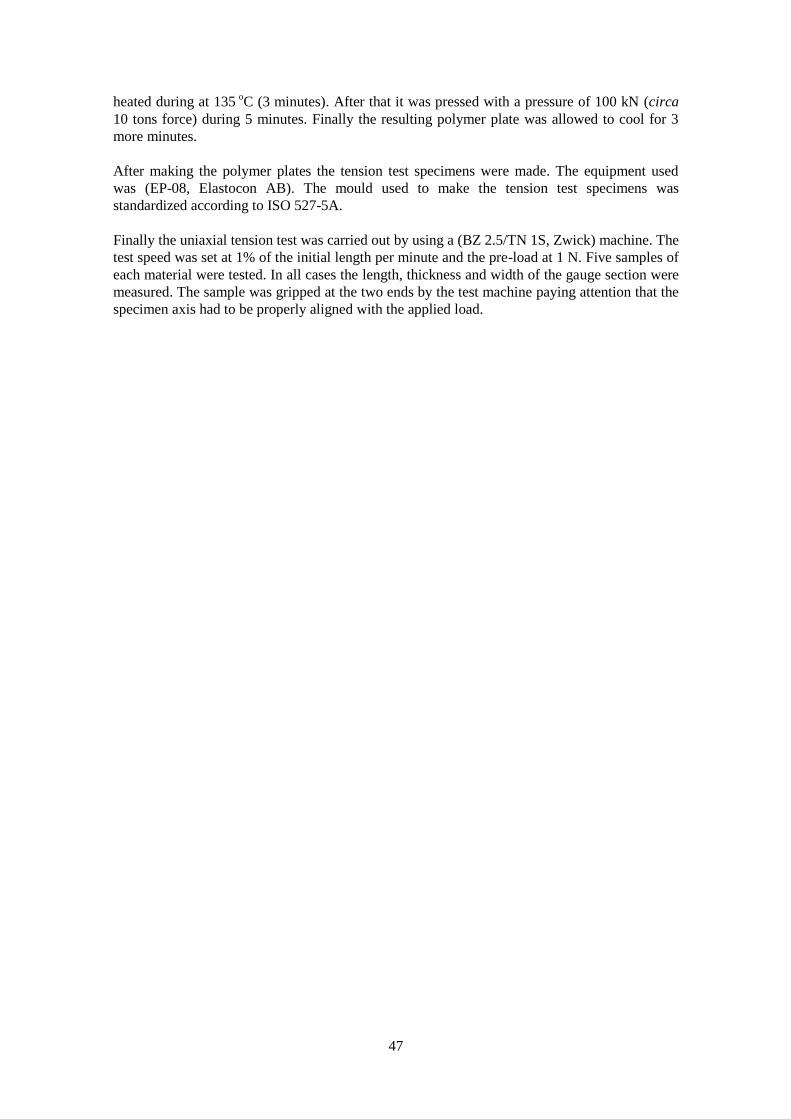
47
heated during at 135 o
C (3 minutes). After that it was pressed with a pressure of 100 kN (circa
10 tons force) during 5 minutes. Finally the resulting polymer plate was allowed to cool for 3
more minutes.
After making the polymer plates the tension test specimens were made. The equipment used
was (EP-08, Elastocon AB). The mould used to make the tension test specimens was
standardized according to ISO 527-5A.
Finally the uniaxial tension test was carried out by using a (BZ 2.5/TN 1S, Zwick) machine. The
test speed was set at 1% of the initial length per minute and the pre-load at 1 N. Five samples of
each material were tested. In all cases the length, thickness and width of the gauge section were
measured. The sample was gripped at the two ends by the test machine paying attention that the
specimen axis had to be properly aligned with the applied load.
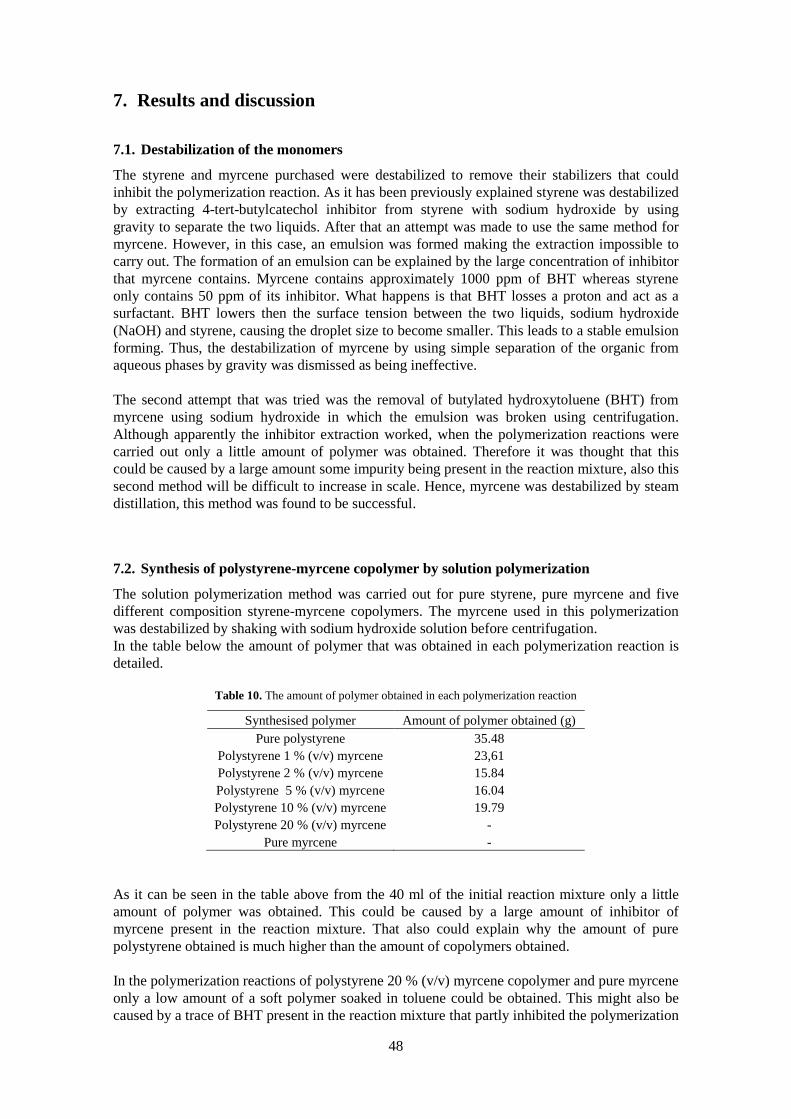
48
7. Results and discussion
7.1. Destabilization of the monomers
The styrene and myrcene purchased were destabilized to remove their stabilizers that could
inhibit the polymerization reaction. As it has been previously explained styrene was destabilized
by extracting 4-tert-butylcatechol inhibitor from styrene with sodium hydroxide by using
gravity to separate the two liquids. After that an attempt was made to use the same method for
myrcene. However, in this case, an emulsion was formed making the extraction impossible to
carry out. The formation of an emulsion can be explained by the large concentration of inhibitor
that myrcene contains. Myrcene contains approximately 1000 ppm of BHT whereas styrene
only contains 50 ppm of its inhibitor. What happens is that BHT losses a proton and act as a
surfactant. BHT lowers then the surface tension between the two liquids, sodium hydroxide
(NaOH) and styrene, causing the droplet size to become smaller. This leads to a stable emulsion
forming. Thus, the destabilization of myrcene by using simple separation of the organic from
aqueous phases by gravity was dismissed as being ineffective.
The second attempt that was tried was the removal of butylated hydroxytoluene (BHT) from
myrcene using sodium hydroxide in which the emulsion was broken using centrifugation.
Although apparently the inhibitor extraction worked, when the polymerization reactions were
carried out only a little amount of polymer was obtained. Therefore it was thought that this
could be caused by a large amount some impurity being present in the reaction mixture, also this
second method will be difficult to increase in scale. Hence, myrcene was destabilized by steam
distillation, this method was found to be successful.
7.2. Synthesis of polystyrene-myrcene copolymer by solution polymerization
The solution polymerization method was carried out for pure styrene, pure myrcene and five
different composition styrene-myrcene copolymers. The myrcene used in this polymerization
was destabilized by shaking with sodium hydroxide solution before centrifugation.
In the table below the amount of polymer that was obtained in each polymerization reaction is
detailed.
Table 10. The amount of polymer obtained in each polymerization reaction
Synthesised polymer Amount of polymer obtained (g)
Pure polystyrene 35.48
Polystyrene 1 % (v/v) myrcene 23,61
Polystyrene 2 % (v/v) myrcene 15.84
Polystyrene 5 % (v/v) myrcene 16.04
Polystyrene 10 % (v/v) myrcene 19.79
Polystyrene 20 % (v/v) myrcene -
Pure myrcene -
As it can be seen in the table above from the 40 ml of the initial reaction mixture only a little
amount of polymer was obtained. This could be caused by a large amount of inhibitor of
myrcene present in the reaction mixture. That also could explain why the amount of pure
polystyrene obtained is much higher than the amount of copolymers obtained.
In the polymerization reactions of polystyrene 20 % (v/v) myrcene copolymer and pure myrcene
only a low amount of a soft polymer soaked in toluene could be obtained. This might also be
caused by a trace of BHT present in the reaction mixture that partly inhibited the polymerization

49
reaction. Also during the filtration of the polymer the filtrate was a milky white liquid. Thus, an
alternative explanation could be that the myrcene made the polymer product more soluble in
ethanol, leading to a loss of product.
7.2.1. 1H NMR results
To determine if some myrcene had been incorporated into the copolymer a proton nuclear
magnetic resonance 1H NMR was performed.
1H NMR was done for pure polystyrene and
polystyrene 1, 2, 5, and 10 % (v/v) myrcene copolymers. To discuss the results a 1H NMR
spectrum for pure polystyrene ad polystyrene 10 % (v/v) myrcene copolymer is attached below.
All other 1H NMR spectrums are shown in Appendix A.
Figure 51. The 1H NMR spectrum of polystyrene 10 % (v/v) myrcene copolymer
Figure 50. The 1H NMR spectrum of pure polystyrene

50
As it can be observed in the 1H NMR spectrum of pure polystyrene there are two main peaks.
The peak between 1 and 2.4 ppm corresponds to the alkyl groups, of polystyrene whereas the
peak between 6 and 8 ppm corresponds to the benzene rings.
If the two 1H NMR spectrum are compared it can be seen that in the
1H NMR spectrum of
polystyrene 10 % (v/v) myrcene copolymer a new peak has appeared at approximately 5 ppm.
This new peak corresponds to the double bounds of myrcene. Moreover the peak between 1 and
2.4 ppm is quite different due to the methyl groups of myrcene. Therefore, it can be concluded
that there is some myrcene incorporation. However the peak intensity is quite low. Thus, it may
be possible that polymyrcene is partially soluble in ethanol. Hence, some myrcene containing
polymer could be lost in the filtration process.
7.3. Uniaxial tension test of solution polymerization copolymers
After determining that myrcene had incorporated into the copolymers they were pressed to
make plates. Although it was possible to make the polymer plates it was impossible to obtain
samples suitable for mechanical testing due to their brittle nature. Another polymerization
method (suspension) was then employed. One of the reasons for using the suspension method is
that it is impossible for an ethanol soluble polymyrcene to be lost from the product. Even if the
myrcene reacts much faster than the styrene and forms a homopolymer which is mixed with the
other homopolymer (polystyrene) then the polymyrcene could still improve the properties of the
plastic.
7.4. Synthesis of a corn starch-polystyrene-myrcene composite by suspension
polymerization
As it has been explained at section 4.1.4 this method was first performed with styrene
containing 5 % (v/v) myrcene destabilized by centrifugation at 60 oC and using a 1 L three
necked round bottom flask as a reaction flask. However with these conditions only viscous oil
could have been obtained. To increase the purity of the myrcene used it was decided to
destabilise myrcene by steam distillation.
The second attempt that was tried was the suspension polymerization of styrene containing 5 %
(v/v) myrcene destabilized by steam distillation at 60 oC and using a 1 L three necked round
bottom flask as a reaction flask. While a polymerisation formed a solid product we were
dismayed to find that the product was in the form of a single lump which was about the size of a
man’s fist. The formation of a hard lump was reasoned to be due to the myrcene lowering the
glass temperature of the mixture of styrene and polystyrene forming a glue like blob during the
polymerization which then turned solid as the glass temperature rose as the styrene was
converted. The glass temperature is that at which the material changes from a hard and
relatively brittle state into a molten or rubber-like state. It was decided to run the reaction at a
lower temperature and use more starch to decrease the size of the droplets. The change of the
polymerization reaction’s temperature increased the amount of initiator required to carry out the
process. As a third measure to prevent a similar debacle the reaction flask was changed from
one with a B29 joint to a flange flask (opening circa 100 mm internal diameter) to enable the
removal of the product even in the event of a single lump forming.
In suspension polymerisation it is sometimes necessary to adjust several parameters to get the
reaction to form small pellets. The method was carried out with myrcene destabilized by steam
distillation in a 1 L ground glass flange flask, at 50 oC. In the table below the amount of
polymer that was obtained in each polymerization reaction is detailed.

51
0
20
40
60
80
100
0 100 200 300 400 500 600
Weight (%)
T (oC)
TGA Benzyl Starch Air
TGA Benzyl Starch N2
Table 11. The amount of polymer obtained in each polymerization reaction
Synthesised polymer Amount of polymer obtained (g)
Corn starch-polystyrene 5% (v/v) myrcene 31
Corn starch-polystyrene 10% (v/v) myrcene 42
7.5. Benzylation of corn starch
Benzyl starch was obtained from the benzylation of corn starch with benzyl chloride. After that
to be able to determinate if the synthesised benzyl starch could be pressed into plates and mixed
and extruded with high impact polystyrene a thermogravimetric analysis was performed.
7.5.1. Thermogravimetric analysis (TGA)
The thermogravimetric analysis of the synthesised benzyl starch in air and in nitrogen gas gave
similar results below 300 oC.
Figure 52. The TGA results for benzyl starch in air and in nitrogen gas with a sample initial temperature of 25oC and
a temperature rate of 10 oC/min
As it can be observed in figure the above in both cases the first weight decrease happens
between 100 oC and 150
oC. This decrease may correspond to the evaporation of the water
remaining in the sample. The most important decrease takes place around 300 oC for benzyl
starch in air and around 340 oC for benzyl starch in nitrogen gas. These may be caused due to
simple dehydration of C6H10O5 units to C6. This would be a 44 % mass loss. However the mass loss looks
bigger.
The sample exposed to nitrogen atmosphere was not fully burned whereas the one exposed to
air was. This is reasonable as it is easier for the sample to burn in an atmosphere which contains
oxygen than in an inert atmosphere.
In the end it was concluded that benzyl starch can be pressed into plates because its thermal
decomposition happens above 135 oC which is the maximum temperature reached in the
polymer plates pressing. Therefore benzyl starch will not decompose during the polymer plates
pressing.
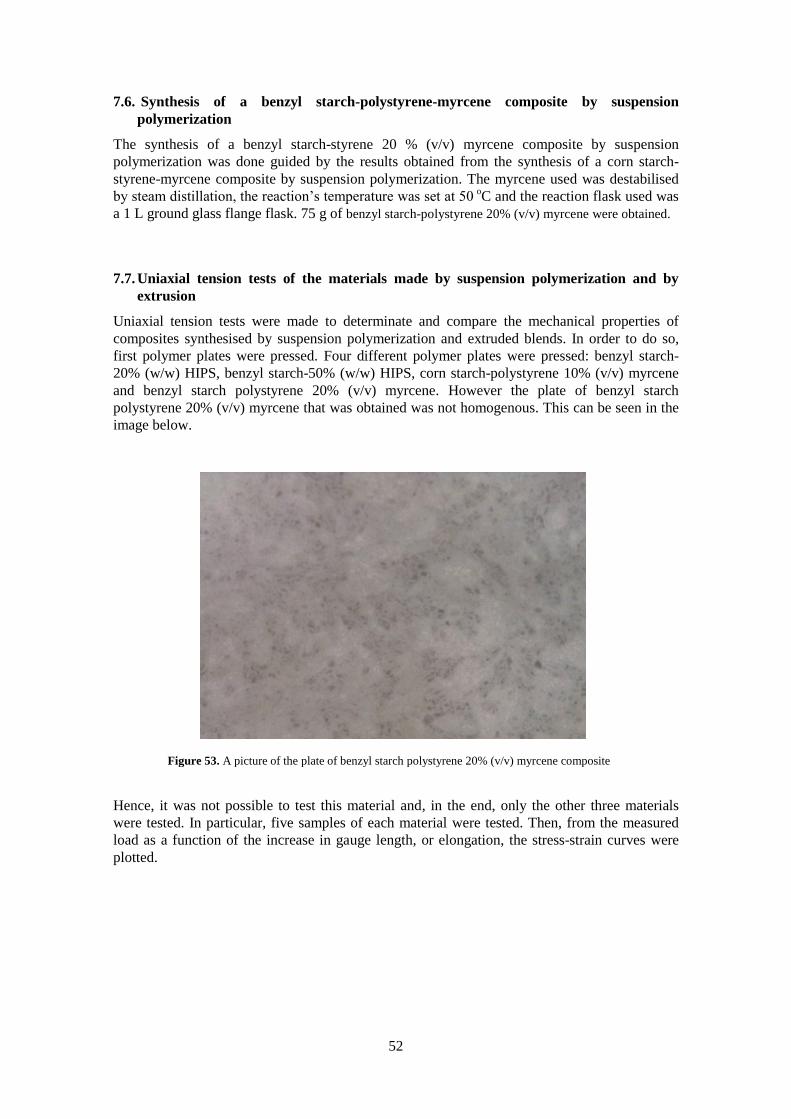
52
7.6. Synthesis of a benzyl starch-polystyrene-myrcene composite by suspension
polymerization
The synthesis of a benzyl starch-styrene 20 % (v/v) myrcene composite by suspension
polymerization was done guided by the results obtained from the synthesis of a corn starch-
styrene-myrcene composite by suspension polymerization. The myrcene used was destabilised
by steam distillation, the reaction’s temperature was set at 50 oC and the reaction flask used was
a 1 L ground glass flange flask. 75 g of benzyl starch-polystyrene 20% (v/v) myrcene were obtained.
7.7. Uniaxial tension tests of the materials made by suspension polymerization and by
extrusion
Uniaxial tension tests were made to determinate and compare the mechanical properties of
composites synthesised by suspension polymerization and extruded blends. In order to do so,
first polymer plates were pressed. Four different polymer plates were pressed: benzyl starch-
20% (w/w) HIPS, benzyl starch-50% (w/w) HIPS, corn starch-polystyrene 10% (v/v) myrcene
and benzyl starch polystyrene 20% (v/v) myrcene. However the plate of benzyl starch
polystyrene 20% (v/v) myrcene that was obtained was not homogenous. This can be seen in the
image below.
Hence, it was not possible to test this material and, in the end, only the other three materials
were tested. In particular, five samples of each material were tested. Then, from the measured
load as a function of the increase in gauge length, or elongation, the stress-strain curves were
plotted.
Figure 53. A picture of the plate of benzyl starch polystyrene 20% (v/v) myrcene composite

53
0
2
4
6
8
10
0 0,1 0,2 0,3 0,4 0,5 0,6 0,7 0,8
Stre
ss (
MP
a)
Elongation (%)
Sample 1
Sample 2
Sample 3
0
2
4
6
8
10
0 0,1 0,2 0,3 0,4 0,5 0,6 0,7 0,8
Stre
ss (
MP
a)
Elongation (%)
Sample 4
Sample 5
The stress-strain curves of corn starch-polystyrene 10% (v/v) myrcene samples are shown below
as an example. All other stress-strain curves are shown in Appendix B.
The stress-strain curves that can be seen above, as well as stress-strain curves that are shown in
Appendix B, are typical curves of a brittle material. As it can be observed in the curves the five
samples break at extremely low strains and they do not show plastic deformation. There is no
yielding point, thus the ultimate strength and the breaking strength are the same and the material
can fail suddenly without much warning. Moreover the area under the curves is quite low.
Hence, the material is only capable to absorb small quantities of energy before failure (128.5 to
170.31 kJ).
Figure 54. The stress-strain curve for the samples 1, 2 and 3 of corn starch-polystyrene 10% (v/v) myrcene
composite
Figure 55. The stress-strain curve for the samples 4 and 5 of corn starch-polystyrene 10% (v/v) myrcene
composite

54
0
200
400
600
800
1000
1200
1400
Yo
ung's
mo
dulu
s at
0.1
-0.3
% (
MP
a)
Young's modulus
Benzyl starch
20% (w/w) HIPS
Corn starch-
PS 10% (v/v)
myrcene
Benzyl starch
50% (w/w) HIPS
0
0,2
0,4
0,6
0,8
1
1,2
1,4
Elo
ngat
ion a
t b
reak
(%
)
Elongation at break
Benzyl starch
50% (w/w) HIPS Benzyl starch 20%
(w/w) HIPS
Corn starch-
PS 10% (v/v)
myrcene
To further characterize the three composites Young’s modulus, elongation at break and tensile
strength were determined. Young’s modulus (E) of the each material was calculated as the
Young’s modulus average of the five samples tested. Young’s modulus of each sample was
calculated as the slope of the elastic region between 0.1 and 0.3 % elongation of the stress-strain
curve. In the figure below the Young’s modulus (E) of the each material as well as the standard
deviation are detailed.
The elongation at break of each material was calculated as the average of the elongation at break
of the five samples tested. Elongation at break of each sample was calculated according to the
equation (30).
Figure 57. The elongation at break of the three synthesised materials
Figure 56. The Young’s modulus of the three synthesised materials

55
0
2
4
6
8
10
12
14
Ten
sile
str
ength
(M
Pa)
Tensile strength
Benzyl starch
20% (w/w) HIPS
Corn starch-
PS 10% (v/v)
myrcene
Benzyl starch 50%
(w/w) HIPS
Another mechanical property than can be determined is the tensile strength (TS). Tensile
strength at break is the highest value of stress.
As it can be seen in figure 57 Young’s modulus of corn starch-polystyrene 10% (v/v) myrcene
composite is higher than Young’s modulus of the other two composites. The higher the Young’s
modulus is the more stiff an object or substance is. Thus, corn starch-polystyrene 10% (v/v)
myrcene composite is more rigid and stiff than the other two materials.
On the other hand in figure 58 it can be seen that benzyl starch 50% (w/w) HIPS breaks at
higher elongation than the other two materials. Nevertheless, as it has been observed in stress-
strain curves, elongation at break of the three polymers is low. Thus, the three materials are very
fragile and do not deform plastically without fracturing. As fragile materials they are only
capable to absorb little quantities of energy before failure.
Moreover in figure 59 it can be observed that benzyl starch 50% (w/w) HIPS can withstand
higher stresses than the other two composites before the failure.
To be able to determine the effect of HIPS in benzyl starch composites and to compare the
mechanical properties of the synthesised materials to those of virgin HIPS and ABS the tensile
test results of HIPS V180 and ABS V180 obtained by S. Tostar and E. Stenvall in the study of
the influence of extrusion conditions on mechanical and thermal properties of virgin and
recycled PP, HIPS, ABS and their ternary blends are used62
.
Figure 58. The tensile strength of the three synthesised materials

56
0
200
400
600
800
1000
1200
1400
You
ng'
s m
od
ulu
s at
0.1
-0.3
% (
MP
a)
Young's modulus
Benzyl starch
20% (v/v) HIPS Ref. HIPS Ref. ABS Corn starch-
PS 10% (v/v)
myrcene
Benzyl starch
5% (v/v) HIPS
0
10
20
30
40
50
60
70
80
90
Elo
nga
tio
n a
t b
reak
(%
)
Elongation at break
Benzyl starch
50% (v/v) HIPS
Benzyl starch
20% (v/v) HIPS
Corn starch-
PS 10% (v/v)
myrcene
Ref. HIPS Ref. ABS
Figure 60. The elongation at break of the synthesised materials, reference ABS and HIPS56
Figure 59. The Young’s modulus of the synthesized materials, reference HIPS and ABS61
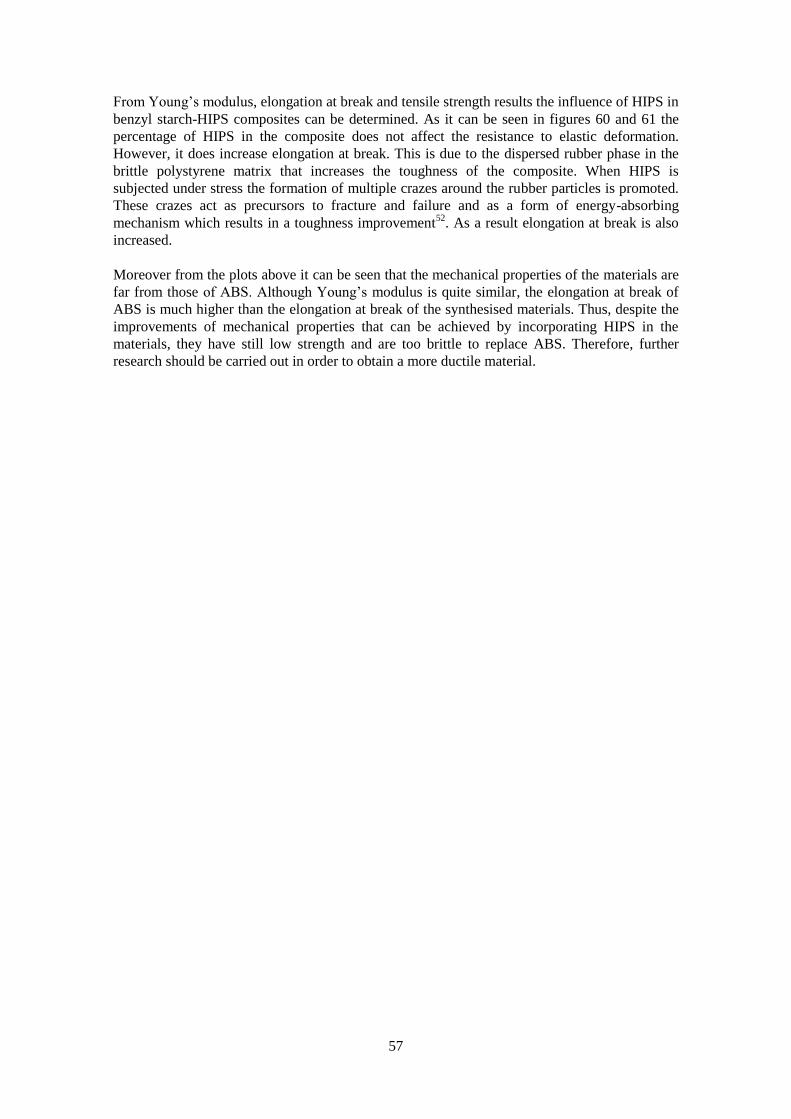
57
From Young’s modulus, elongation at break and tensile strength results the influence of HIPS in
benzyl starch-HIPS composites can be determined. As it can be seen in figures 60 and 61 the
percentage of HIPS in the composite does not affect the resistance to elastic deformation.
However, it does increase elongation at break. This is due to the dispersed rubber phase in the
brittle polystyrene matrix that increases the toughness of the composite. When HIPS is
subjected under stress the formation of multiple crazes around the rubber particles is promoted.
These crazes act as precursors to fracture and failure and as a form of energy-absorbing
mechanism which results in a toughness improvement52
. As a result elongation at break is also
increased.
Moreover from the plots above it can be seen that the mechanical properties of the materials are
far from those of ABS. Although Young’s modulus is quite similar, the elongation at break of
ABS is much higher than the elongation at break of the synthesised materials. Thus, despite the
improvements of mechanical properties that can be achieved by incorporating HIPS in the
materials, they have still low strength and are too brittle to replace ABS. Therefore, further
research should be carried out in order to obtain a more ductile material.

58
8. Conclusions
It was seen that the synthesis of polystyrene-myrcene-starch composites by solution
polymerization and suspension polymerization methods follows a free-radical polymerization
mechanism. It was reasoned by looking at the reactivity ratios that the obtained polymer is a
random copolymer.
It was found that the amount of stabilizer in the initial monomers has a great influence in the
destabilization step. Large concentration of myrcene inhibitor lowered the surface tension of
the rafinnate and the extract in the decantation method causing the droplet size to become
smaller. This led to a stable emulsion forming. Thus, myrcene had to be destabilized by steam
distillation.
It was possible to modify corn starch using benzyl chloride by treating the starch with sodium
hydroxide and heating. It was reasoned that benzene rings in benzyl starch are able to interact
with benzyl rings in polystyrene through π-π effects. Hence, benzyl chloride formed a solid
which is more compatible with polystyrene-myrcene composite than corn starch.
After that it was observed that polystyrene-myrcene copolymers synthesised by solution
polymerization were too brittle to for mechanical characterization. Alternatively polystyrene-
myrcene-starch composites made by suspension polymerization, as well as the extruded benzyl
starch-HIPS composites, could be mechanical tested.
Then mechanical properties of benzyl starch-20% (w/w) HIPS, benzyl starch-50% (w/w) HIPS,
corn starch-polystyrene 10% (v/v) myrcene were studied. From the uniaxial tension test it was
determined that these materials were also quite brittle as they broke at low strains and didn’t
show any plastic deformation. The corn starch-polystyrene 10% (v/v) myrcene composite was
found to be more rigid and stiff than the other two composites as it had a higher Young’s
modulus. Alternatively, the benzyl starch 50% (w/w) HIPS broke at higher elongation than the
other two materials.
Furthermore the influence of HIPS in benzyl starch-HIPS composites was studied. It was found
that the fraction of HIPS in the composite increases the elongation at break but not the Young’s
modulus. It was reasoned that it is caused by the rubber phase dispersed in the brittle
polystyrene matrix that promotes the formation of crazes which act as a form of energy-
absorbing mechanism. Finally, when comparing the mechanical properties of the ABS and the
composites, it was concluded that the materials had low strength and were too brittle to replace
a plastic such as ABS.
While it has not been able to make a bioplastic that can be used on a large scale, the fact that it
was able to do mechanical testing does suggest that a progress has been made in comparison to
the solids made in the Winter of 201236
(the solids were so brittle that it was impossible to make
the tensile test specimens).
Further research is required to synthesise a plant based composite with suitable mechanical
properties. Starch based nanomaterials are a good starting point to achieve this goal as it has
been found that they have much better mechanical properties than the starch based polymers.

59
9. Acknowledgements
I want to express my most sincere thanks to:
- my Supervisor Mark Foreman for giving me the opportunity to work on this project and
for all his teaching about organic chemistry.
- Sandra Tostar and Erick Stenvall for your help with the characterization polymers and
with the discussion of the results
- Pilar, my Spanish mate, for your company during this semester and for your help with this
report
- to all the people who work in the Industrial Materials Recycling and Nuclear Chemistry
departments
- to my father and mother, and sister who have supported me throughout my university studies
and made it possible for me to become a Chemical Engineer one day, without you this
would not be possible.
- to all my friends
60
10. References
1. R. J. Young, P. A. Lovell, Introduction to Polymers, Springer-Science and Business
Media, Hong Kong, 2nd edn., 1991, ch. 1, pp. 1-11.
2. A. Ravve, Principles of Polymer Chemistry, Springer, New York, 3rd edn., 2012, ch. 1,
pp. 2-5.
3. A. Caminade, C.Turrin, R. Laurent, A.Ouali, B. Devaloux-Nicot, Dendrimers. Towards
Catalytic, Material and Biomedical Uses, Wiley, Somerset, 2011, ch.1, pp.5-7.
4. Alternating Copolymers, ed. J. M. G. Cowie, Plenum Press, Stirling, 1985, ch. 1, pp. 9.
5. D. M. Bryce, Plastic Injection Molding, Society of Manufacturing Engineers, Dearborn,
1999, ch.2, pp. 35.
6. S. Tostar, Thesis for the Degree of Licentiate of Engineering, Chalmers University of
Technology, 2013.
7. N. G. McCrum, C. P. Buckley, C. B. Bucknall, Principles of Polymer Engineering,
Oxford Science Publications, New York, 1996, ch. 1, pp. 9-14.
8. Plastics Europe, http://www.plasticseurope.org/documents/document/20131018104201-
plastics_the_facts_2013.pdf, (accessed April 2014).
9. N. G. McCrum, C. P. Buckley, C. B. Bucknall, Principles of Polymer Engineering,
Oxford Science Publications, New York, 1996, ch. 1, pp. 264-267.
10. M.E. Adams, D. J. Buckley, R. E. Colborn, W. P. England, D. N. Schissel,
Acrylonitrile-Butadiene-Styrene Polymers, Rapra Review Reports no. 70, Rapra
Technology, Shawbury, 1997.
11. P. W. Klein, Fundamentals of Plastics Thermoforming, Morgan & Claypool, Goteborg,
2009, c ch. 2, pp. 13.
12. G. Scott, Polymers and the Environment, The Royal Society of Chemistry, Cambridge,
1999, ch.4, pp. 68-92.
13. U.S. Energy Information Administration,
http://www.eia.gov/pub/oil_gas/petroleum/feature_articles/2004/worldoilsupply/oilsupp
ly04.html, (accessed April 2014).
14. The Organization of the Petroleum Exporting Countries,
http://www.opec.org/opec_web/static_files_project/media/downloads/publications/OB0
32001.pdf, (accessed April 2014).
15. R. T. Morrision, R. N. Boid, Organic chemistry, New York University, Boston, 5th
edn., 1987, ch. 10, pp. 408-409.
16. N. G. McCrum, C. P. Buckley, C. B. Bucknall, Principles of Polymer Engineering,
Oxford Science Publications, New York, 1996, ch. 1, pp. 3.
17. G. Patterson, A Prehistory of Polymer Science, Springer, Fargo, 2012, ch. 2, pp. 14-15.
18. C. D. Gutsche, Calixarenes, Monographs in Supramolecular Chemistry, Cambridge,
1989, ch. 1, pp. 6.
19. J. L. Meikle, American Plastic, A Cultural History, Rutgers University Press, New
Brunswick, 1995, ch. 7, pp. 189.
20. The Cambridge History of Western Textiles II, ed. D. Jenkins, Cambridge University
Press, Cambridge, 2003, pp. 951.
61
21. The Independent, http://www.independent.co.uk/news/world/24bn-breastimplant-offer-
1247358.html, (accessed May 2014).
22. British Plastics Federation.
http://www.bpf.co.uk/Plastipedia/Plastics_History/Default.aspx, (accessed April 2014).
23. Handbook of polymer applications in medicine and medical devices, ed. S. Ebnesajjad,
K. Modjarrad, Elsevier, Chadds Ford, 2014, ch. 7 , pp. 131–143.
24. Degradable Polymers. Principles and Applications, ed. G. Scott, Springer-Business
Media, Aston, 2nd edn., 2002, ch. 1, pp. 1-15.
25. Monomers, Polymers and Composites from Renewable Resources, ed. M. Belgacem, A.
Gandini, Elsevier, 2008, ch. 21, pp. 433-448.
26. Starch-Based Polymeric Materials and Nanocomposites. Chemistry, Processing, and
Applications, ed. J. Ahmed, B. K. Tiwari, S. H. Imam, M.A. Rao, CRC Press, London,
2012, ch. 15, pp. 301-319.
27. Starch-Based Polymeric Materials and Nanocomposites. Chemistry, Processing, and
Applications, ed. J. Ahmed, B. K. Tiwari, S. H. Imam, M.A. Rao, CRC Press, London,
2012, ch. 2, pp. 5-10.
28. Starch-Based Polymeric Materials and Nanocomposites. Chemistry, Processing, and
Applications, ed. J. Ahmed, B. K. Tiwari, S. H. Imam, M.A. Rao, CRC Press, London,
2012, ch. 17, pp. 361-368.
29. Polymer Handbook, ed. J. Brandrup, E. H. Immergut, Wiley-Interscience, New York,
2nd edn., 1975, ch. VII, pp. 8.
30. International Agency for Research of Cancer, Some Traditional Herbal Medicines,
Some Mitocoxins, Naphthalene and Styrene, IARC Press, Lyon, 2002, vol. 82, ch.5,
pp. 437-445.
31. R. T. Morrision, R. N. Boid, Organic chemistry, New York University, Boston, 5th
edn., 1987, ch. 15, pp. 560-561.
32. R. T. Morrision, R. N. Boid, Organic chemistry, New York University, Boston, 5th
edn., 1987, ch. 15, pp. 531-545.
33. J. Clayden, N. Greeves, S. Warren, P. Wothers, Organic Chemistry, Oxford University
Press, Oxford, 2001, ch. 51, pp. 1437-1447.
34. W. H. Brown, E. P. Rogers, General Organic and Biochemistry, Brooks/Cole
Publishing Company, Belmont, 3rd edn., 1987, ch. 7, pp. 366.
35. J. Robson, Starch Manufacturing: A Profile, EPA Contract Number 68-D1-0143, U.
S.Environmental Protection Agency, Research Triangle Park, 1994.
36. M. Foreman, Conversion of starch into a material suitable for use in composites with
traditional thermoplastics such as polystyrene, unpublished work.
37. X. Cao, Z. Lina, Miscibility and Properties of Polyurethane/Benzyl Starch Semi-
Interpenetrating Polymer Networks, 2005, 43, pp. 603–615.
38. Principles and Practice of Solvent Extraction, ed. J. Rydberg, C. Musikas, G. R.
Choppin, Marcel Dekker, New York, 1992, ch. 4, pp. 107-113.
39. L. M. Harwood, C. J. Moody, Experimental Organic Chemistry. Principles and
practice, Blackwell Scientific Publications, Oxford, 1990, ch. 3, pp. 151-153.
40. Handbook of Chemistry and Physics, ed. R. C. Weast, G. L .Tuve, S. M. Selby, I.
Sunshine, The Chemical Rubber CO, Ohio, 52th edition, 1972, ch. D, pp. 158.

62
41. R. T. Morrision, R. N. Boid, Organic chemistry, New York University, Boston, 5th
edn., 1987, ch. 8, pp. 334-335.
42. D. Braun, H. Cherdron, M. Rehahn, H. Ritter, B. Voit, Polymer Synthesis: Theory and
Practice. Fundamentals, Methods, Experiments, Springer, Berlin, 5th edn., 2013, ch. 2,
pp. 42-48.
43. R. J. Young, P. A. Lovell, Introduction to Polymers, Springer-Science and Business
Media, Hong Kong, 2nd edn., 1991, ch. 1, pp. 73-74.
44. D. Braun, H. Cherdron, M. Rehahn, H. Ritter, B. Voit, Polymer Synthesis: Theory and
Practice. Fundamentals, Methods, Experiments, Springer, Berlin, 5th edn., 2013, ch. 3,
pp. 157-163.
45. P. Patnaik, A Compressive Guide to the Hazardous Properties of Chemical Substances,
John W Wiley & Sons, New Jersey, 3rd edn., 2007 , ch. 43, pp.731.
46. Polymer Handbook, ed. J. Brandrup, E. H. Immergut, W. McDowell, Wiley-
Interscience, New York, 2nd edn., 1975, ch. 2, pp. 3.
47. Polymer Handbook, ed. J. Brandrup, E. H. Immergut, W. McDowell, Wiley-
Interscience, New York, 2nd edn., 1975, ch. 2, pp. 225.
48. Polymer Handbook, ed. J. Brandrup, E. H. Immergut, W. McDowell, Wiley-
Interscience, New York, 2nd edn., 1975, ch. 2, pp. 105.
49. Polymer Handbook, ed. J. Brandrup, E. H. Immergut, W. McDowell, Wiley-
Interscience, New York, 2nd edn., 1975, ch. 2, pp. 400.
50. A. Ravve, Principles of Polymer Chemistry, Springer, New York, 3rd edn., 2012, ch. 3,
pp. 92-96.
51. G. Morales, R. Díaz de León, P. Acuña, R. Flores, A. Montalvo, Polymer Engineering
& Science, Society of Plastics Engineers, Paris, 2006, vol. 46, pp. 1333-1341.
52. S. Socrate, M. C. Boyce, A. Lazzeri, Mechanics of Materials, 2001, 33, pp. 155–175.
53. N. Bruna, P. Boursona, S. Marguerona, Vibrational Spectroscopy, 2013, 67, 55-60.
54. M. Y. Kariduraganavar. A. A. Kittur, R. R. Kamble, Natural and Synthetic Biomedical
Polymers, ed. S. Kumbar, C. Laurencin, M. Deng, Elsevier, San Diego, 2014, ch. 1, pp.
1-25.
55. L. D. S. Yadav, Organic Spectroscopy, Springer-Science and Business Media,
Dordrecht, 2005, ch. 5, pp. 133-146.
56. L. M. Harwood, C. J. Moody, Experimental Organic Chemistry. Principles and
practice, Blackwell Scientific Publications, Oxford, 1990, ch. 5, pp. 315-326.
57. W. J. Sichina, Characterization of Polymers Using TGA, PETech-78, Perkin Elmer
Instruments.
58. Thermal Analysis of Rubbers and Rubbery Materials, ed. N. R. Choudhury, P. P. De, N.
K. Dutta, iSmithers, Shawbury, 2010, ch. 2, pp. 22-28.
59. J. R. Davis, Tensile Testing, ASM International, Cleveland, 2nd edn., 2004, ch. 1, pp. 2-
12.
60. J. R. Davis, Tensile Testing, ASM International, Cleveland, 2nd edn., 2004, ch. 3, pp.
37-57.
61. R Timothy, M. Swerdloff, M. Rogic, J. Am. Chem. Soc., 1981, pp 5795–5804.

63
62. E. Stenvall, S. Tostar, A. Boldizar, M. R. St. J. Foreman, The Influence of Extrusion
Conditions on Mechanical and Thermal Properties of Virgin and Recycled PP, HIPS,
ABS and Their Ternary Blends, International Polymer Processing, 28, ch. 5, pp. 541-
549.

64
11. List of abbreviations
ABS Acrylonitrile butadiene styrene
AIBN 2,2′-Azobis(2-methylpropionitrile)
ASTM American Society for Testing and Materials
ATP Adenosine triphosphate
BHT Butylated hydroxytoluene
BPO Benzyl Peroxide
CB Carbon black
CDCl3 Chloroform-d
CO2 Carbon dioxide
Cr2O3 Chromium (III) oxide
EIA Energy Information Administration
EP Epoxy resins
H Hydrogen
HDPE High density polyethylene
HIPS High impact polystyrene
1H NMR Proton nuclear magnetic resonance
H2SO4 Sulfuric acid
ISO International Organization for Standardization
KMnO4 Potassium permanganate
LDPE Low density polyethylene
LPG Liquefied petroleum gas
NaOH Sodium Hydroxide
OPEC Organization of the Petroleum Exporting Countries
PE Polyethylene
PP Polypropylene
PS Polystyrene
PVC Polyvinyl chloride
PTFE Polytetrafluoroethylene
PHB Poly-(3-hydroxy-butyrate)
PLA Poly(lactic acid)
PET Polyethylene terephthalate
PMMA Poly(methyl methacrylate)
PO43-
Phosphate group
SAN Styrene acrylonitrile resin
SO2 Sulfur dioxide

65
TMS Tetramethylsilane
TGA Thermogravimetric analysis
TS Tensile strength
US United States
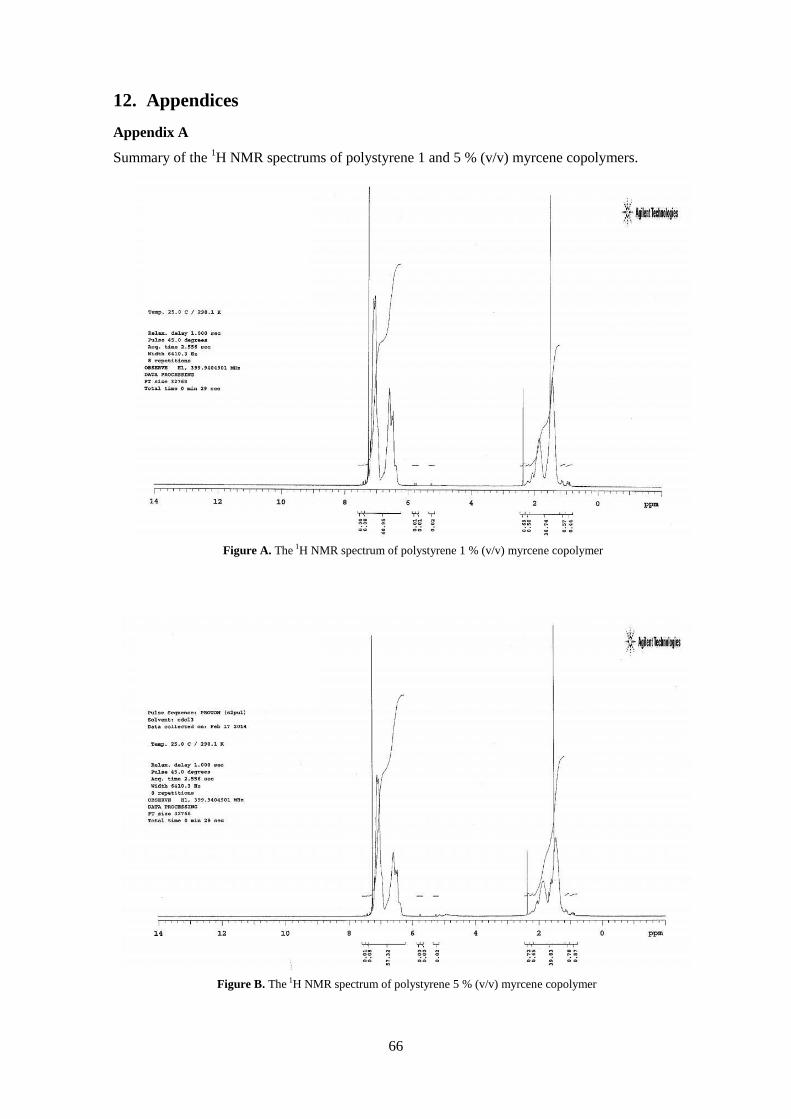
66
12. Appendices
Appendix A
Summary of the 1H NMR spectrums of polystyrene 1 and 5 % (v/v) myrcene copolymers.
Figure A. The 1H NMR spectrum of polystyrene 1 % (v/v) myrcene copolymer
Figure B. The 1H NMR spectrum of polystyrene 5 % (v/v) myrcene copolymer
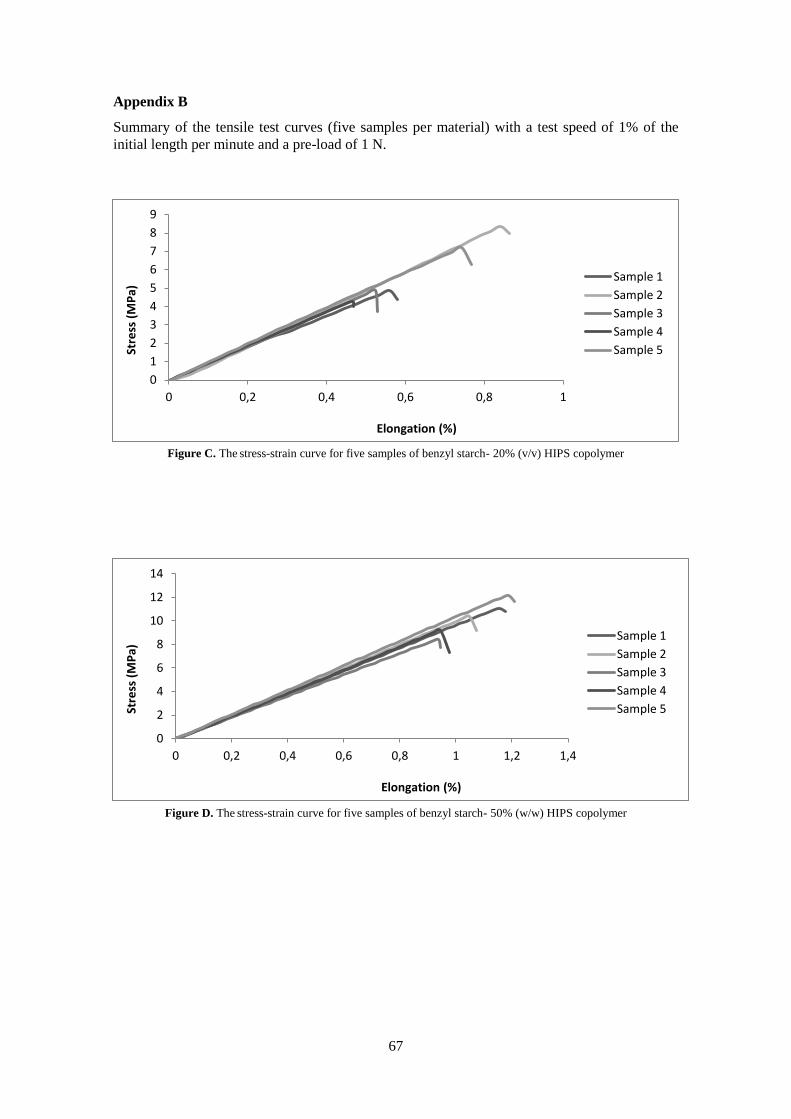
67
0
1
2
3
4
5
6
7
8
9
0 0,2 0,4 0,6 0,8 1
Stre
ss (
MP
a)
Elongation (%)
Sample 1
Sample 2
Sample 3
Sample 4
Sample 5
0
2
4
6
8
10
12
14
0 0,2 0,4 0,6 0,8 1 1,2 1,4
Stre
ss (
MP
a)
Elongation (%)
Sample 1
Sample 2
Sample 3
Sample 4
Sample 5
Appendix B
Summary of the tensile test curves (five samples per material) with a test speed of 1% of the
initial length per minute and a pre-load of 1 N.
Figure C. The stress-strain curve for five samples of benzyl starch- 20% (v/v) HIPS copolymer
Figure D. The stress-strain curve for five samples of benzyl starch- 50% (w/w) HIPS copolymer

68