New Physics at CDF? - Cornell Universitypt267/files/talks/MultiMuon.pdfNew Physics at CDF? ... to...
23
New Physics at CDF? A Halloween “ghost” story. Flip Tanedo 4 November 2008 CIHEP Collider Club Study of multi-muon events produced in pp collisions at !s = 1.96 TeV arXiv:0810.5357 (31 Oct 08)
Transcript of New Physics at CDF? - Cornell Universitypt267/files/talks/MultiMuon.pdfNew Physics at CDF? ... to...
New Physics at CDF?A Halloween “ghost” story.
Flip Tanedo4 November 2008
CIHEP Collider Club
Study of multi-muon events produced in pp collisions at !s = 1.96 TeV
arXiv:0810.5357 (31 Oct 08)

Hype

Caveat Emptor
• This is a controversial result
• Only 2/3 of CDF on the author list
• Lots of hype from blogs, etc.Latched on to Nima-Neal DM hype
• Work in progress.
• I don’t have the answers.Maybe you do.
Happy Halloween

• True story?Actually a potential signal of new physics
• Fairy tale? Signal turns back into a pumpkin at midnight
• Morality play?Not literally true, but teaches us lessons
I’ll tell you a story. Then you tell me what kind of story it was.
Johannes Pumpkin is burning to find out if
the CDF anomaly is new physics!
4

bb inconsistencies
• should be " 1
• R = 1.15 ± 0.21 when using 2nd’ry vertex ID
• R = 3.0 ± 0.6 when using semileptonic decays
• Invariant mass spectrum doesn’t fit well with simulation of sequential semileptonic b decays
• Time-integrated mixing probability of b hadrons “significantly larger” than LEP
5
R2b = (!bb)exp/(!bb)NLO
New result: R fixed
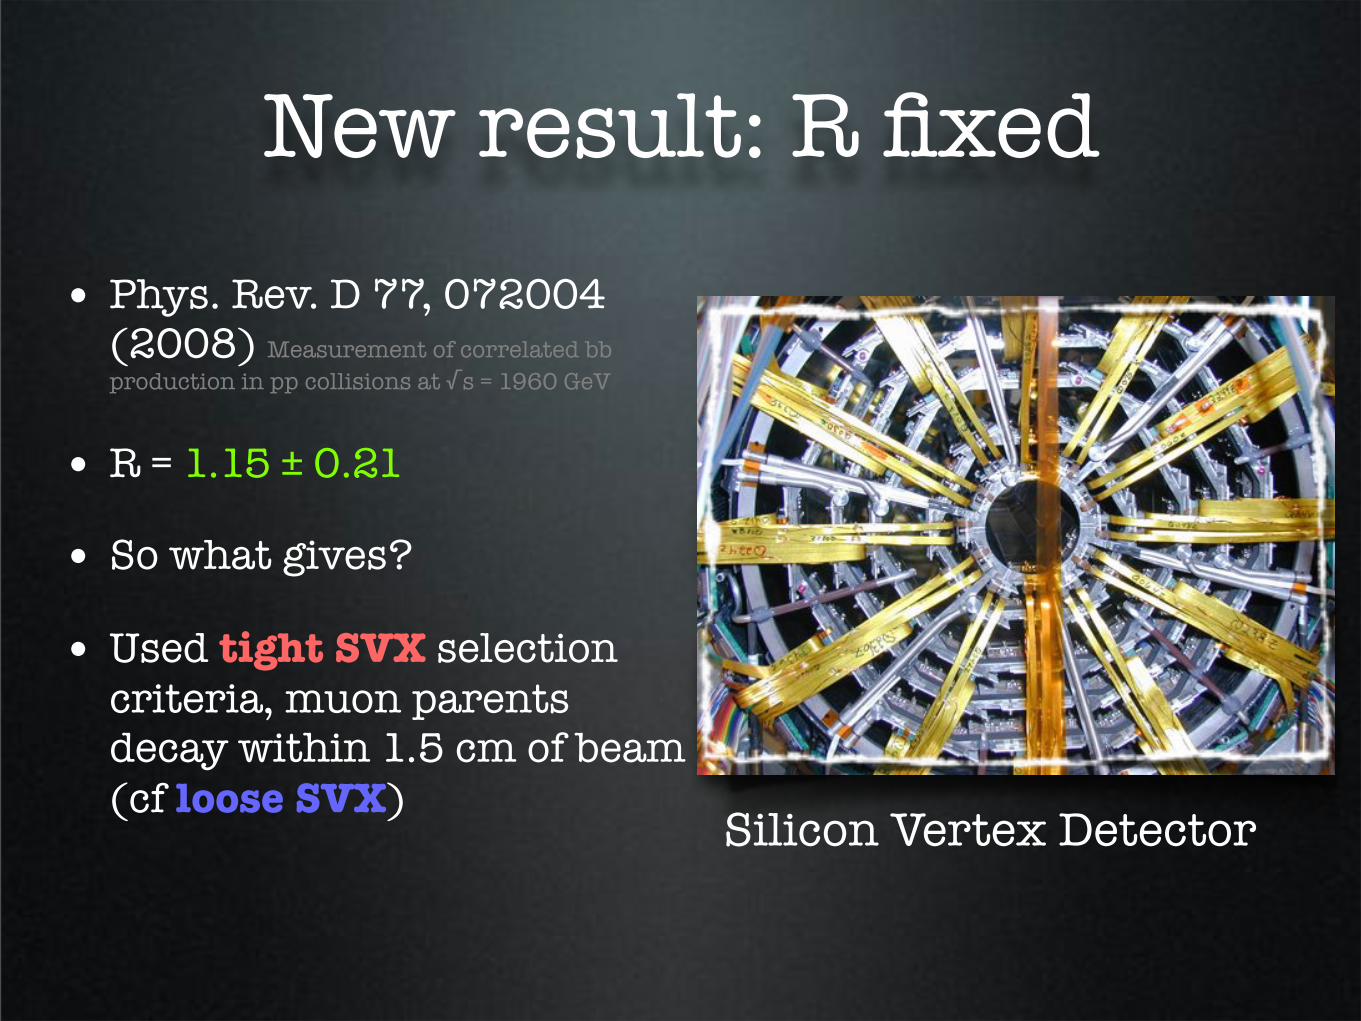
• Phys. Rev. D 77, 072004 (2008) Measurement of correlated bb
production in pp collisions at !s = 1960 GeV
• R = 1.15 ± 0.21
• So what gives?
• Used tight SVX selection criteria, muon parents decay within 1.5 cm of beam(cf loose SVX)
Silicon Vertex Detector

The call is coming from inside the house
• Anomalously large number of muons produced outside the beam pipe
• “ghost” muons
• Unusual multiplicity of muons in B events
(historically how they were discovered)
OUTSIDE
BEAM PIPE
... and that’s why Neve decided to purchase a cell phone

The call is coming from inside the house
• Anomalously large number of muons produced outside the beam pipe
• “ghost” muons
• Unusual multiplicity of muons in B events
(historically how they were discovered)
OUTSIDE
BEAM PIPE
d (cm)
0 0.5 1 1.5 2M
uo
ns /
(0
.00
8 c
m)
1
10
210
310
410
510
610
FIG. 7: Impact parameter distribution of muons contributed by ghost (•) and QCD (histogram)
events. Muon tracks are selected with loose SVX requirements. The detector resolution is! 30 µm,
whereas bins are 80 µm wide.
1/ptrackT )2/!2
1/pT] to measure the di!erence between the momentum vectors of the undecayed
pions or kaons (h) and that of the closest reconstructed tracks 3. Figure 9 shows the "
distribution as a function of R, the decay distance from the beamline. One notes that most
of the decays at radial distances R " 120 cm yield misreconstructed tracks. The numbers
3 The assumed experimental resolutions are !![rad] = !" = 10!3 and !1/pT= 2 · 10!3 [GeV/c]!1.
21
ghost
qcd
Impact parameter distribution
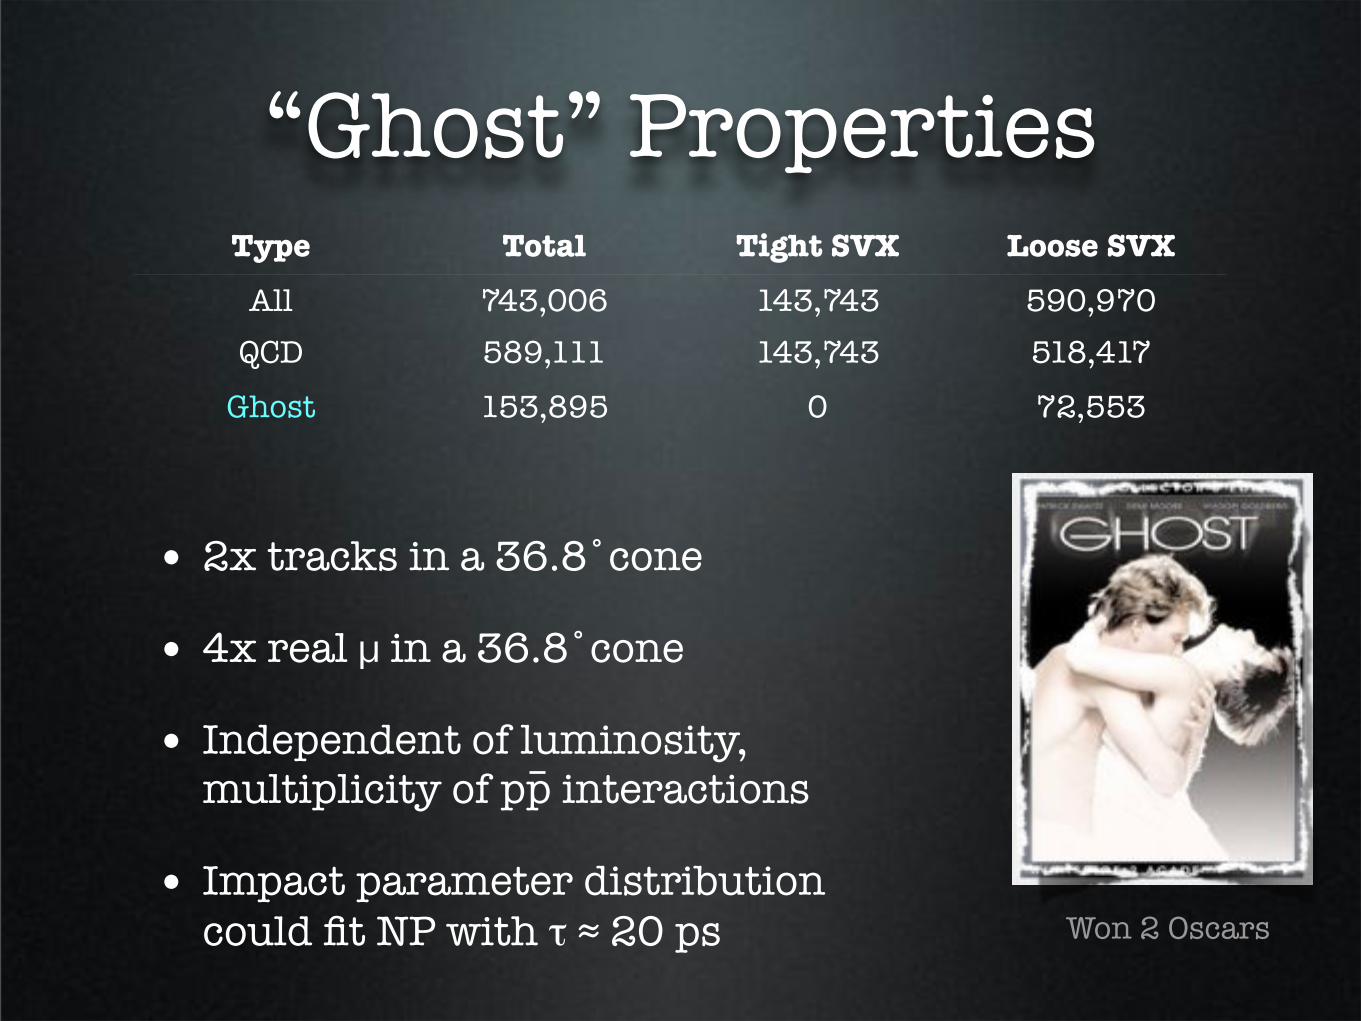
“Ghost” Properties
• 2x tracks in a 36.8˚cone
• 4x real # in a 36.8˚cone
• Independent of luminosity, multiplicity of pp interactions
• Impact parameter distribution could fit NP with ! " 20 ps
Type Total Tight SVX Loose SVX
All 743,006 143,743 590,970
QCD 589,111 143,743 518,417
Ghost 153,895 0 72,553
Won 2 Oscars

“Ghost” Properties
• 2x tracks in a 36.8˚cone
• 4x real # in a 36.8˚cone
• Independent of luminosity, multiplicity of pp interactions
• Impact parameter distribution could fit NP with ! " 20 ps
Type Total Tight SVX Loose SVX
All 743,006 143,743 590,970
QCD 589,111 143,743 518,417
Ghost 153,895 0 72,553
“Lepton Jet”
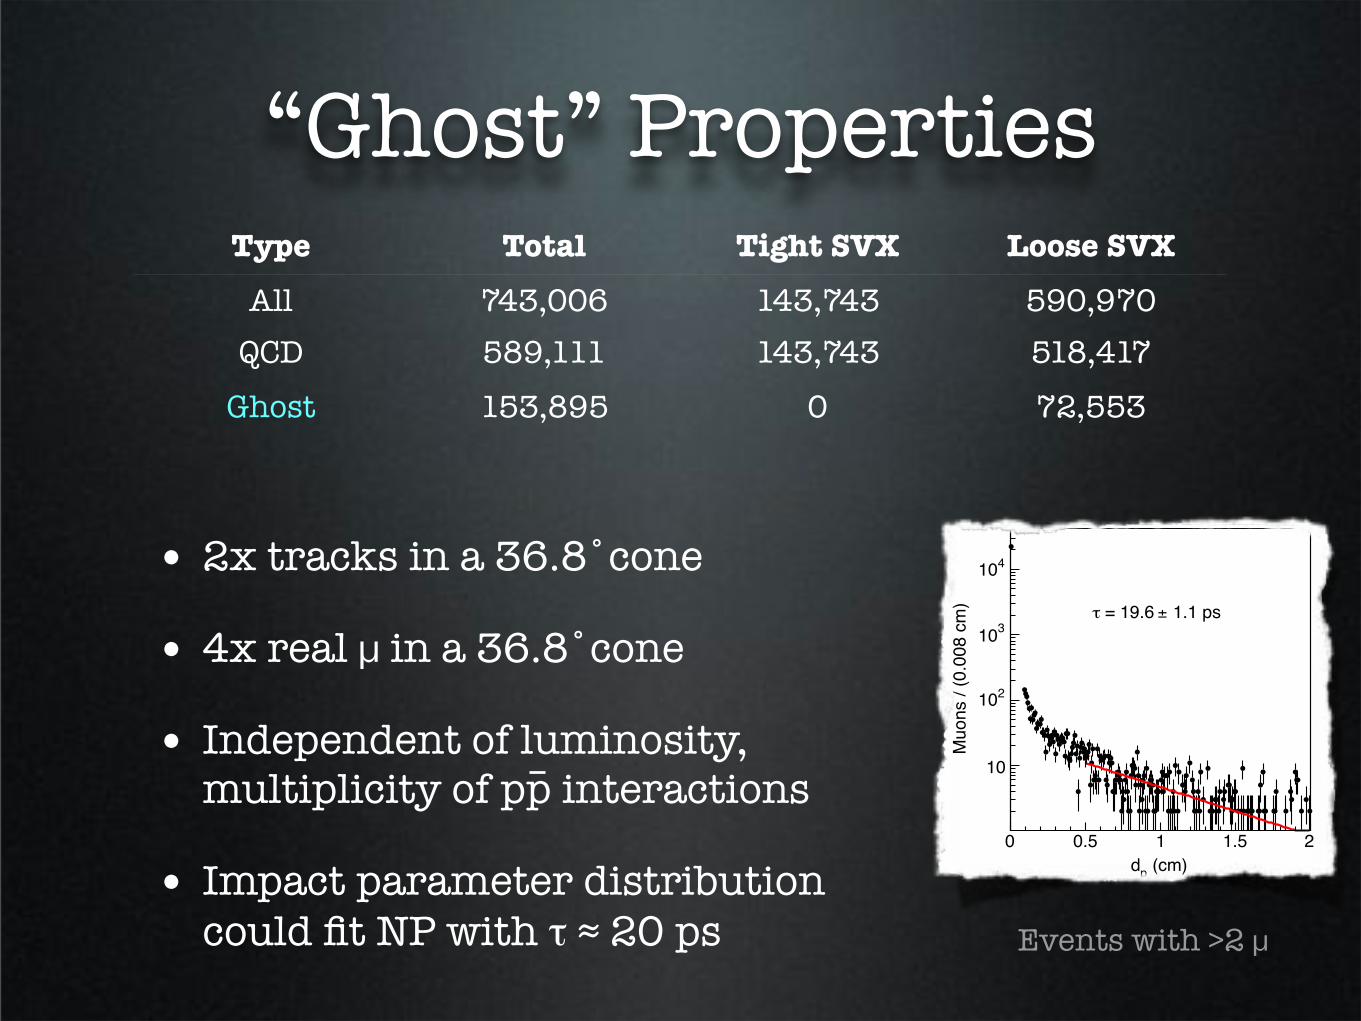
“Ghost” Properties
• 2x tracks in a 36.8˚cone
• 4x real # in a 36.8˚cone
• Independent of luminosity, multiplicity of pp interactions
• Impact parameter distribution could fit NP with ! " 20 ps
Type Total Tight SVX Loose SVX
All 743,006 143,743 590,970
QCD 589,111 143,743 518,417
Ghost 153,895 0 72,553
Events with >2 #
(cm)p
d
0 0.5 1 1.5 2
Mu
on
s /
(0
.00
8 c
m)
10
210
310
410
510
0.5 ps± = 16.8 !
(cm)sd
0 0.5 1 1.5 2
Mu
on
s /
(0
.00
8 c
m)
10
210
310
410
510
0.5 ps± = 21.1 !
(cm)p
d
0 0.5 1 1.5 2
Mu
on
s /
(0
.00
8 c
m)
10
210
310
410
1.1 ps± = 19.6 !
(cm)sd
0 0.5 1 1.5 2
Mu
on
s /
(0
.00
8 c
m)
10
210
310
410
0.8 ps± = 22.4 !
FIG. 25: Muon impact parameter distributions for events containing (top) only two muons or
(bottom) more than two muons in a cos! ! 0.8 cone. We call dp and ds the impact parameter of
initial and additional muons, respectively. The solid lines represent fits to the data distribution
with an exponential function. The fit result is shown in each plot.
muons due to ghost events in Fig. 7 is derived using muon tracks that pass the loose SVX
selection in order to minimize the possible contribution of interactions in the detector systems
surrounding the SVXII detector. As mentioned earlier, this requirement sculpts the impact
parameter distribution of muons arising from the decay of particles with a lifetime much
larger than that of b quarks. The smaller number of events that contain two or more muons
46
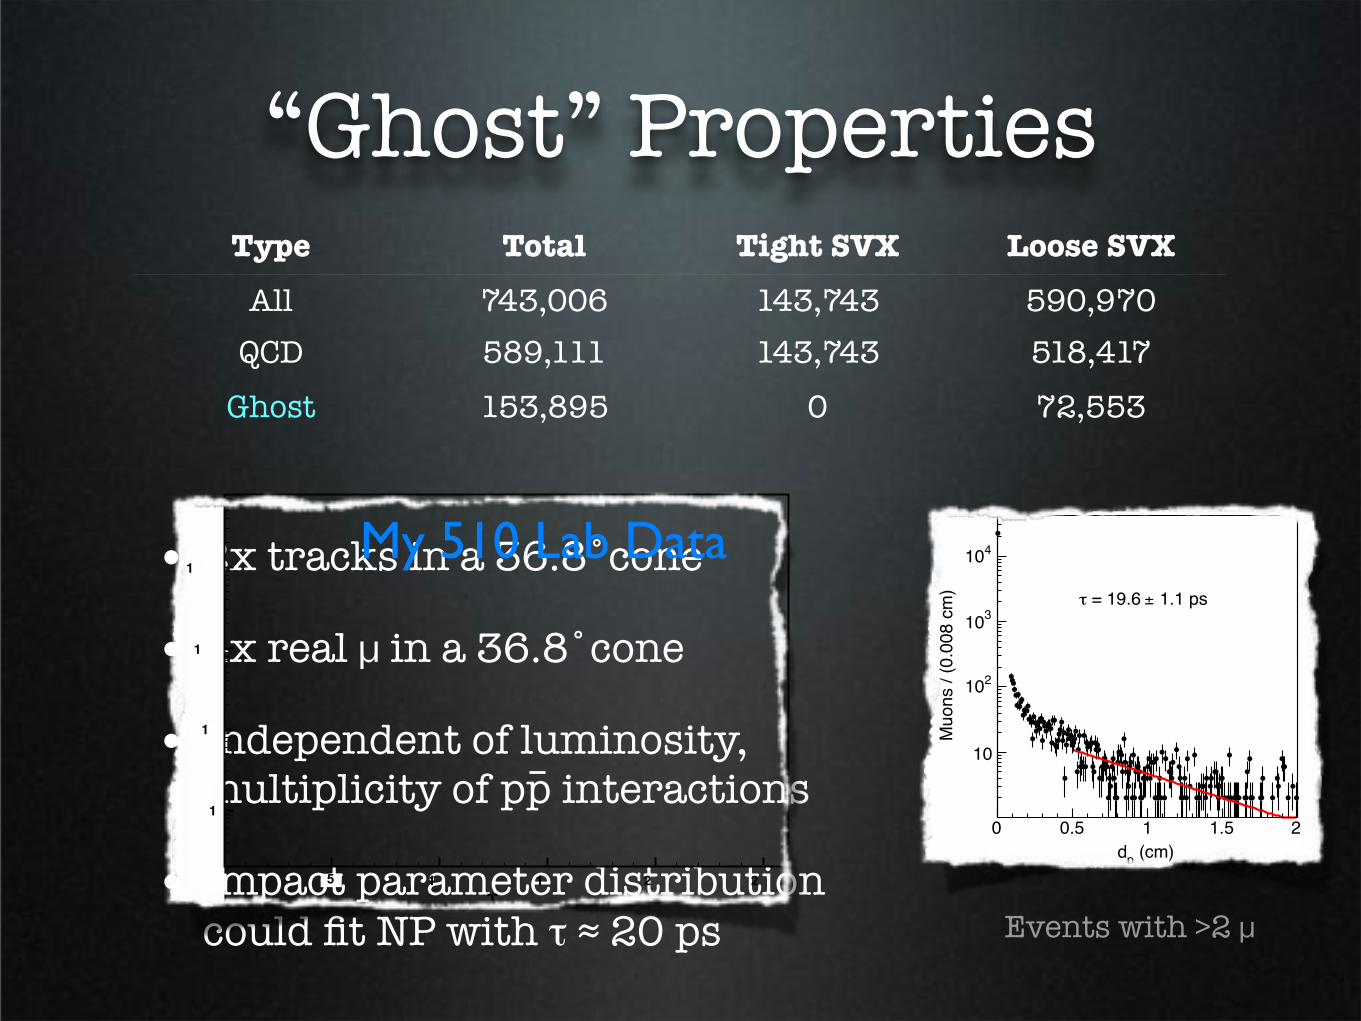
My 510 Lab Data

But is it real?i.e. can we get rid of it?

But is it real?Could it be ordinary QCD?
• “QCD” = Drell Yan, !, Z0,
heavy flavor, ...
• We expect 96% of QCD within 1.5 cm of beam
• Highly boosted hadrons?Don’t see any signature in the invariant mass distribution.
• Can also compare detector efficiencies
)2
(GeV/cµµM
0 50 100
)2E
ve
nts
/ (
3 G
eV
/c
10
210
310
410
510
610
(a)
)2
(GeV/cµµM
0 50 100
SV
XII
eff
icie
ncy
0.1
0.2
0.3
0.4
0.5
0.6
(b)
FIG. 5: Invariant mass distribution (a) of the dimuon pairs used in the study. The e!ciency (b) of
the tight SVX requirements as a function of the dimuon invariant mass in the data (•) is compared
to that in the heavy flavor simulation (!).
of the dimuon invariant mass. The e!ciency of tight SVX requirements in the data is below
that in the simulation only for dimuon invariant masses smaller than 40 GeV/c2, and then
rises to the expected value of 0.257 where events are mostly contributed by prompt Z0
decays. This feature does not favor the first hypothesis (a).
A long-lived particle contribution is suggested by the comparison of the impact parameter
distribution of dimuons that pass the loose and tight SVX requirements. The request that
muons pass loose SVX requirements is momentarily used to reduce the possible contribution
of muons from secondary interactions occurring beyond the SVXII detector. We note that
loose SVX requirements sculpt the impact parameter distribution of muons arising from
the decay of objects with a lifetime much longer than that of b hadrons, such as !, K, or
K0S mesons. Two-dimensional impact parameter distributions are shown in Fig. 6. One-
dimensional distributions are shown in Fig. 7. The impact parameter distribution of muons
in ghost events di"ers from that of the QCD contribution. According to the heavy flavor
simulation [6], dimuons with impact parameter larger than 0.12 cm only arise from bb̄ pro-
duction. We fit the impact parameter distribution in Fig. 8 with the function A exp("d/(c"))
in the range 0.12" 0.4 cm. The best fit returns c" = 469.7± 1.3 µm in agreement with the
value 470.1 ± 2.7 µm expected for the b-hadron mixture at the Tevatron [5]. We conclude
19

But is it real?Could it be in-flight decays of K, $?
• Particles with ! > heavy flavor lifetime
• In-flight decay to #’s lead to misreconstructed tracks
• Simulated with HERWIG
• Can account for 35% of ghosts, but only 10% of those with d % 0.5 cm
!
1 102
10
R (
cm
)
0
50
100
150
(a)
!
1 102
10
R (
cm
)
0
50
100
150
(b)
FIG. 9: Distribution of ! (see text) as a function of the distance R of the (a) K and (b) ! decay
vertices from the beamline. For comparison, the analogous distribution for real muons from heavy
flavor decays does not extend beyond ! = 9.
TABLE III: Number of pions and kaons corresponding to a misreconstructed track (! ! 5) with
pT ! 3 GeV/c and |"| " 0.7, that decay inside the tracking volume, produce CMUP muons with
a L1 primitive, and pass di"erent SVX selections.
Selection ! K
Tracks 2667199 1574610
In-flight-decays 14677 40561
CMUP+L1 1940 5430
Loose SVX 897 3032
Tight SVX 319 1135
CMUP pair due to bb̄ production with the same kinematic acceptance (pT ! 3 GeV/c and
|!| " 0.7). The ratio of the number of pions to that of kaons is approximately 5/1. Each
simulated track in the kinematic acceptance is weighted with the corresponding in-flight-
partons with transverse momentum larger than 3 GeV/c [6].
23
!2 =13
!h ! !track
"2!
+(#h ! #track)2
"2"
+ (1ph
T
! 1ptrack
T
)/"21/pT
Measure of $, K momentum vs. closest reconstructed tracks
QCD

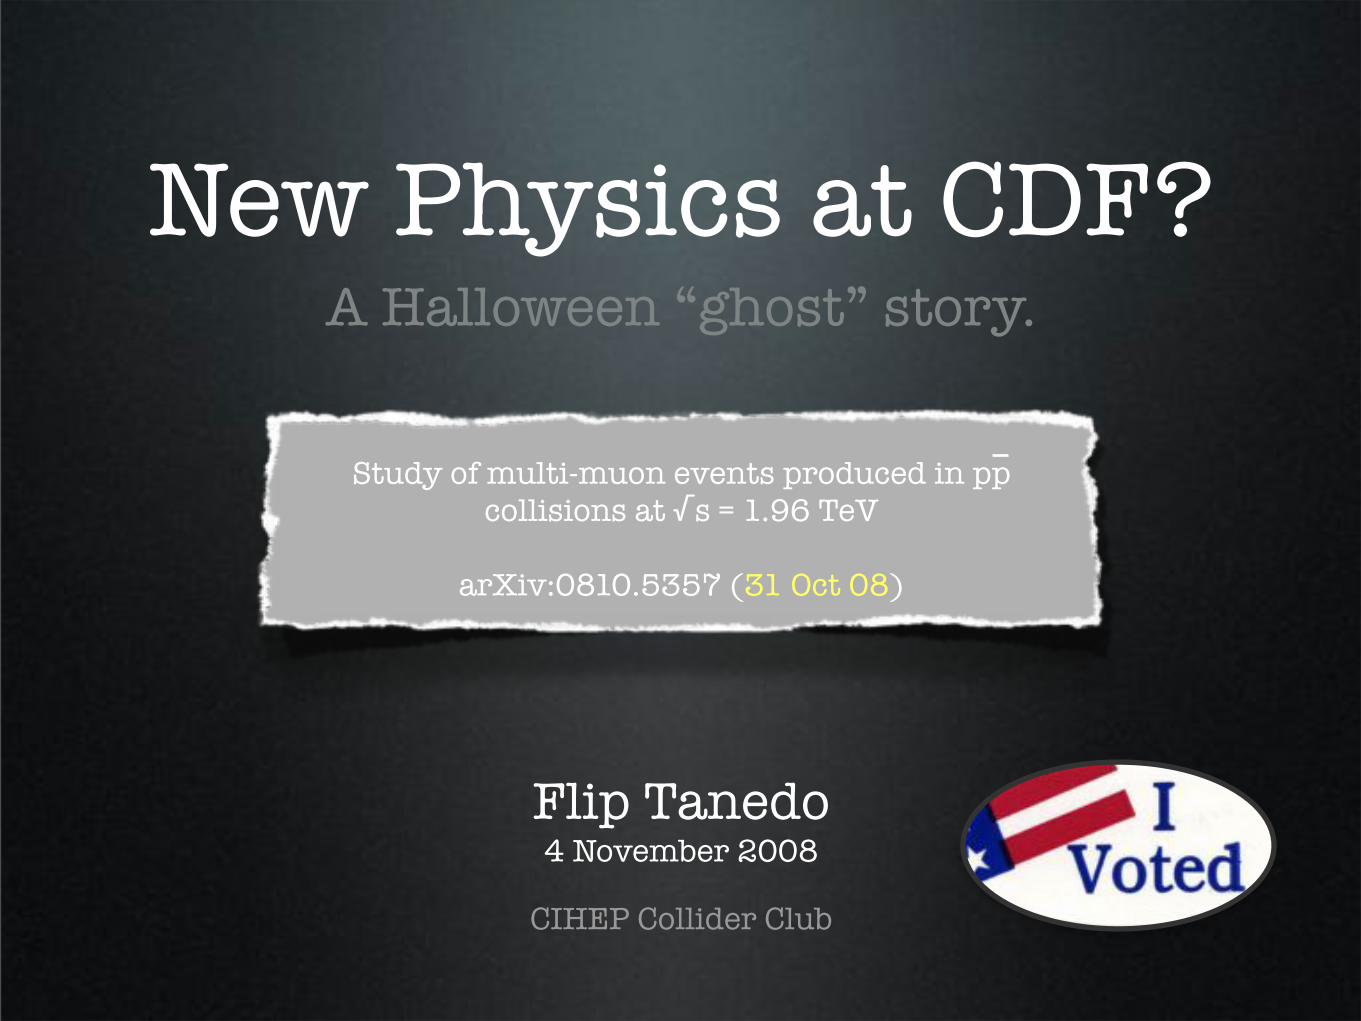
But is it real?Could it be punchthough of K0
s or hyperons?
• Hadrons from K0s and
hyperon decay can mimic muons
• e.g. K0s "$+$-
• Explains about 8% of ghost events
)2
M (GeV/c
0.4 0.45 0.5 0.55 0.6
)2
Events
/ (
0.0
02 G
eV
/c
1000
2000
3000(a)
d (cm)
0 0.5 1 1.5 2
Muons / (
0.0
08 c
m)
1
10
210
310
410
510
610
(b)
FIG. 11: Distributions of (a) the invariant mass of pairs of initial muons and opposite sign tracks
and of (b) the impact parameter of initial muons, produced by K0S decays, that pass the loose SVX
selection. The solid line represents a fit described in the text. In the impact parameter distribution,
the combinatorial background is removed with a sideband subtraction method. For comparison,
the vertical scale in (b) is kept the same as in Fig. 7.
data set for K0S ! !+!! decays in which a pion punchthrough mimics the muon signal.
We combine all initial muon tracks with all opposite sign tracks with pT " 0.5 GeV/c
contained in a 40!
cone around the direction of the initial muons. Muon-track combinations
are constrained to arise from a common space point. They are discarded if the three-
dimensional vertex fit returns a "2 larger than 10. Figure 11 (a) shows the invariant mass
distribution of the K0S candidates reconstructed assuming that both tracks are due to pions.
A fit of the data with a Gaussian function to model the signal plus a second order polynomial
to model the background yields a signal of 5348± 225 K0S mesons. The impact parameter
distribution of initial muons produced by K0S decays is shown in Fig. 11 (b). The data also
contain a smaller number of cases in which the initial muon is mimicked by the products of
hyperon decays. Using a similar technique, we have searched the data for ! ! p!! decays
and we find a signal of 678± 60 ! baryons (see Fig. 12). Since in both case the kinematic
acceptance times reconstruction e"ciency is approximately 50%, source (c) (# 12000 events)
explains # 8% of the ghost events.
The final source (d) of ghost events, secondary interactions in the detector volume, is
25
)2
M (GeV/c
0.4 0.45 0.5 0.55 0.6
)2
Events
/ (
0.0
02 G
eV
/c
1000
2000
3000(a)
d (cm)
0 0.5 1 1.5 2
Muons / (
0.0
08 c
m)
1
10
210
310
410
510
610
(b)
FIG. 11: Distributions of (a) the invariant mass of pairs of initial muons and opposite sign tracks
and of (b) the impact parameter of initial muons, produced by K0S decays, that pass the loose SVX
selection. The solid line represents a fit described in the text. In the impact parameter distribution,
the combinatorial background is removed with a sideband subtraction method. For comparison,
the vertical scale in (b) is kept the same as in Fig. 7.
data set for K0S ! !+!! decays in which a pion punchthrough mimics the muon signal.
We combine all initial muon tracks with all opposite sign tracks with pT " 0.5 GeV/c
contained in a 40!
cone around the direction of the initial muons. Muon-track combinations
are constrained to arise from a common space point. They are discarded if the three-
dimensional vertex fit returns a "2 larger than 10. Figure 11 (a) shows the invariant mass
distribution of the K0S candidates reconstructed assuming that both tracks are due to pions.
A fit of the data with a Gaussian function to model the signal plus a second order polynomial
to model the background yields a signal of 5348± 225 K0S mesons. The impact parameter
distribution of initial muons produced by K0S decays is shown in Fig. 11 (b). The data also
contain a smaller number of cases in which the initial muon is mimicked by the products of
hyperon decays. Using a similar technique, we have searched the data for ! ! p!! decays
and we find a signal of 678± 60 ! baryons (see Fig. 12). Since in both case the kinematic
acceptance times reconstruction e"ciency is approximately 50%, source (c) (# 12000 events)
explains # 8% of the ghost events.
The final source (d) of ghost events, secondary interactions in the detector volume, is
25
K0s
Invariant mass and impact parameter distribution for opposite-sign muons.
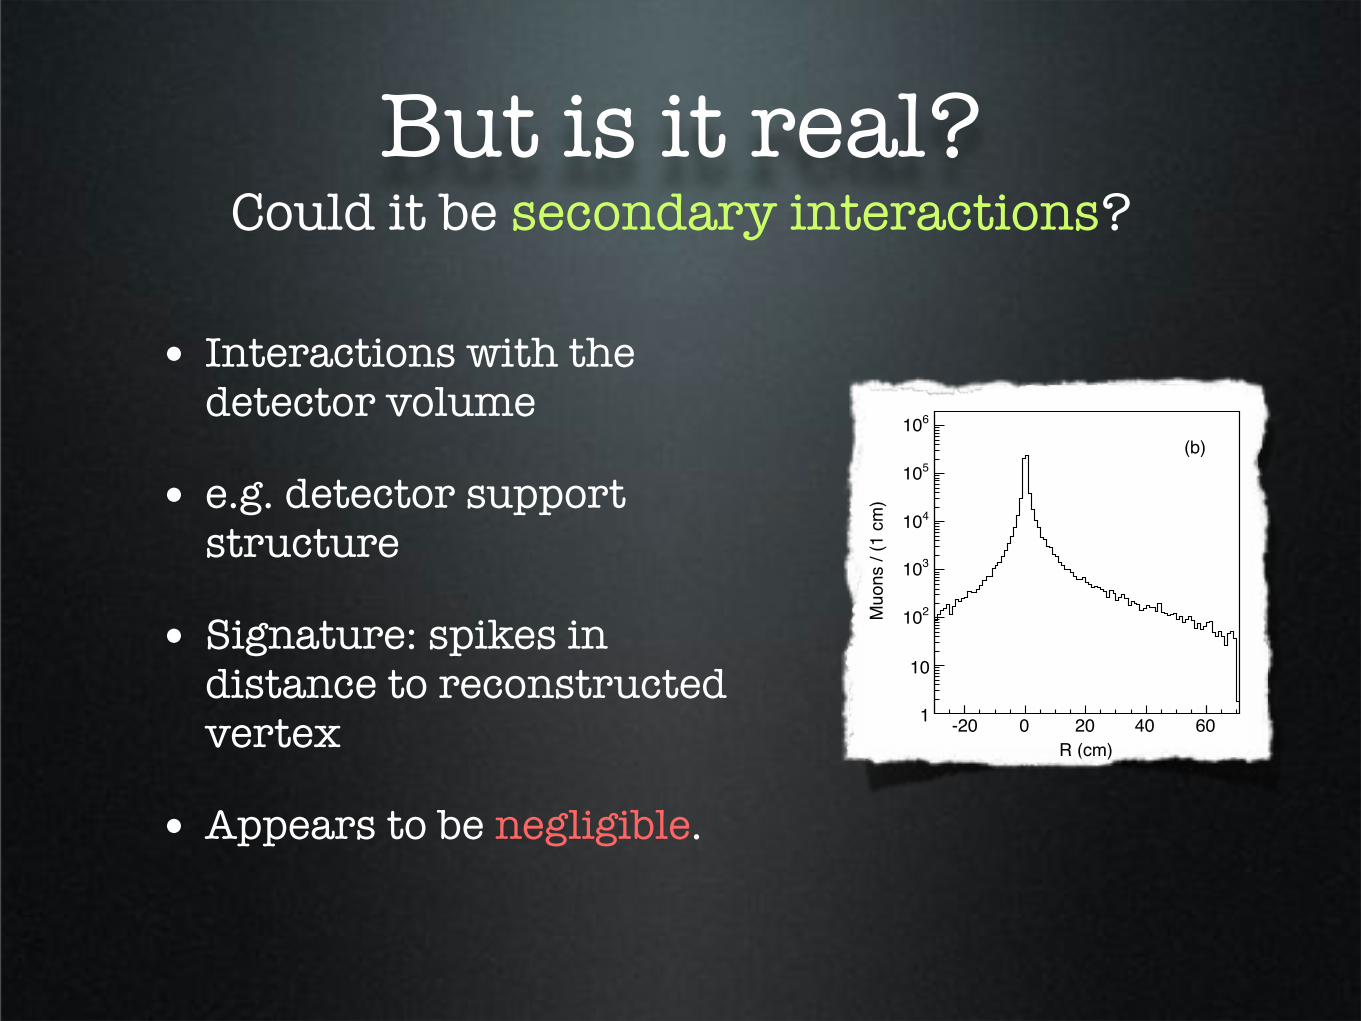
But is it real?Could it be secondary interactions?
• Interactions with the detector volume
• e.g. detector support structure
• Signature: spikes in distance to reconstructed vertex
• Appears to be negligible.
R (cm)
-20 0 20 40 60
Muons / (
1 c
m)
1
10
210
310
410
510
610
(a)
R (cm)
-20 0 20 40 60
Muons / (
1 c
m)
1
10
210
310
410
510
610
(b)
FIG. 13: Distributions of R, the signed distance of muon-track vertices from the nominal beam
line for (a) QCD and (b) ghost events (see text).
transverse to the beam line, is shown in Fig. 13. The distance R is negative when the
secondary vertex is in the hemisphere opposite to that containing the momentum of the
muon-track system. Secondary interactions are characterized by spikes at R values where
the detector material is concentrated, such as SVX supports or the COT inner support
cylinder. From the absence of visible spikes, we conclude that the contribution of multi-
prong secondary interactions to initial muons in ghost events is negligible. At the same time,
we cannot exclude some contribution to ghost events from elastic or quasi-elastic nuclear
scattering of hadronic tracks in the detector material.
Our estimate of the size of possible sources of ghost events underpredicts the observed
number of ghost events by approximately a factor of two (154000 observed and 69000 ac-
counted for). However, given the possible large uncertainty of the in-flight-decay prediction
and the possible contribution of elastic or quasi-elastic nuclear scattering in the detector
material, at this point of our study we cannot exclude that the ghost sample can be com-
pletely accounted for by a combination of all the above-studied background sources. Were
ghost events all due to these ordinary sources, they would not contain a significant number
of additional real muons. Therefore, these sources are unlikely to be the origin of the excess
of low-mass dileptons reported in Ref. [3]. That study is repeated in the next section.
27

But is it real?Does anything else fake multiple muons?
• All of the previous points could plausibly be a conspiracy of Monte Carlos, experiment
• But these backgrounds would not account for the additional number of real muons (2x QCD)
• Apply tight SVX to multi-# sample,
• efficiency drops from 0.193 to 0.166
• QCD fakes have much fewer additional muons, would expect efficiency to increase to 0.244 (QCD expectation)

But is it real?Does anything else fake multiple muons?
• In a cone with cos " < 0.82x as many tracks, 4x #
• “Surprisingly large number of tracks with pT % 2 GeV
• Shapes of impact parameter distribution for 2nd’ry differs from QCD; large tail, like primary #s (correlated)
• Estimate fakes with D0
decays; doesn’t match high multiplicity tail of ghosts
)2
(GeV/cµµM
0 5 10 15 20
)2M
uo
n p
airs /
(0
.5 G
eV
/c
2000
4000
6000
8000Ghost
!cos
-1 -0.5 0 0.5 1
Mu
on
pa
irs /
(0
.01
)
2000
4000
6000
8000Ghost
)2
(GeV/cµµM
0 5 10 15 20
)2M
uo
n p
airs /
(0
.5 G
eV
/c
2000
4000
6000
8000QCD
!cos
-1 -0.5 0 0.5 1
Mu
on
pa
irs /
(0
.01
)
5000
10000
15000
QCD
FIG. 18: Events with OS initial muon pairs and an additional muon combined with the opposite-
charge initial muon. We show the invariant mass, Mµµ, and opening angle, !, distributions of these
combinations for the QCD and ghost contributions.
tribution of additional muons in ghost events extends to much larger values and is consistent
with that of the initial muons. However, the impact parameters of the additional and initial
muons are loosely correlated (the correlation factor is !dpds = 0.03).
The contribution of fake muons is evaluated by weighting all tracks with pT ! 2 GeV/c,
|"| " 1.1, and contained in a cos # ! 0.8 cone, with the fake probabilities shown in Fig. 14.
Table VII lists the number of these tracks for QCD and ghost events. The QCD and
36
)2
M (GeV/c
0 1 2 3 4 5
)2M
(G
eV
/c
0
1
2
3
4
5
(a)
Number of tracks
0 5 10 15
Nu
mb
er
of
tra
cks
0
5
10
15
(b)
FIG. 33: Two-dimensional distributions of (a) the invariant mass, M , of all muons and (b) the
total number of tracks contained in a 36.8!
cone when both cones contain at least two muons. The
QCD and fake muon contributions have been subtracted.
of all muons contained in the 27990 cones containing at least two muons is consistent with
that of the 3016 events in which both cones contain at least two muons. Figure 35 shows
the invariant mass distribution of all muons and all tracks with pT ! 2 GeV/c in events in
which both cones contains two or more muons.
Following the procedure outlined in Sec. VIIA, we count the number of secondary vertices
of two-track systems in events with two cones containing at least two muons. Figure 36
shows the average number of secondary vertices in one cone as a function of the number of
secondary vertices in the other cone.
VIII. CONCLUSIONS
We have studied a sample of events containing at least two central muons with pT !
3 GeV/c and invariant mass 5 " mµµ " 80 GeV/c2. The data sets were collected with
the CDF II detector at the Fermilab Tevatron collider, and correspond to integrated lu-
minosities up to 2100 pb!1. Similar data samples have been previously used by the CDF
and DØ collaborations to derive measurements of the correlated !b"µ,b̄"µ cross section that
are inconsistent with the NLO theoretical prediction. A similar data set was used by the
55

Caveat Emptor II
• When only “best” muon tracks selected, signal significance decreases
• Estimating the fake rate is hard
• Tagging events is hard; pT cut only below 3-5
GeV ... muons are relatively soft
• Analysis is still ongoing... still a few kinks

What’s next?
• Does D0 see the same thing?
• B analysis is subtle, don’t expect much from the LHC in early years
• B factories?
• Continue CDF analysis
• 1st priority: study electrons
In one slide...
• CDF may have found an excess of high-multiplicity, high-impact parameter muons
• Doesn’t seem to be background, but
this has not yet been ruled out.
• Analysis is ongoing.
• Model-building “circus” has already begun (prematurely?)
Paper trail
• Phys. Rev. D 77 072004 (2008)Main study using tight vs loose SVX
• arXiv:0810.5730Model-building paper...