“An Attempt at Exhausting an Augmented Place in Paris.” Georges ...

© Copyright 2016 National Council on Compensation Insurance, Inc. All Rights Reserved.
November 3, 2016
[email protected] 818-707-8374
[email protected] 561-893-3115
NEW MEXICO

© Copyright 2016 National Council on Compensation Insurance, Inc. All Rights Reserved.
Greetings from
Where the good news keeps flowing like a river …
Frequency Declining
Underwriting Results
Improving
Residual Market
Shrinking
2

© Copyright 2016 National Council on Compensation Insurance, Inc. All Rights Reserved.
State of the Industry
Legislative Issues Nationwide
New Mexico Workers Compensation
New Mexico’s Residual Market
Guest Speaker: Rachel Bayless, New Mexico Workers’ Compensation Administration
The State of the Economy
Claim Frequency
Indemnity and Medical Severity
Emerging Issues: Oil and Gas Jobs
New Mexico Workers Compensation State Advisory Forum
3

© Copyright 2016 National Council on Compensation Insurance, Inc. All Rights Reserved.
State of the Industry

© Copyright 2016 National Council on Compensation Insurance, Inc. All Rights Reserved.
State of the Workers Compensation Market
Combined ratios: Underwriting gains achieved on
both calendar year and accident year bases
Net written premium volume increased for the
fifth consecutive year
Lost-time claim frequency again decreased
Lost-time claim severity changes were small—
increasing for indemnity and decreasing for
medical
Residual market premium remains manageable
5

© Copyright 2016 National Council on Compensation Insurance, Inc. All Rights Reserved.
p Preliminary Source: NAIC’s Annual Statement data Includes state insurance fund data for the following states: AZ, CA, CO, HI, ID, KY, LA, MD, MO, MT, NM, OK, OR, RI, TX, and UT Each calendar year total for state funds includes all funds operating as a state fund in that year
31.0 31.3 29.8 30.5 29.1
26.3 25.2 24.2 23.3 22.3 25.0 26.1
29.2 31.1
34.7 37.8 38.6 37.6
33.8 30.3 29.9
32.3 35.1
36.9 38.5 39.7
35.3 35.7 34.3
35.4 33.6
30.1 28.5
27.0 25.9
25.0
28.6
32.1
37.7
42.3
46.5 47.8
46.5
44.3
39.3
34.6 33.8
36.4
39.5
41.8
44.2 45.5
0
10
20
30
40
50
90 91 92 93 94 95 96 97 98 99 00 01 02 03 04 05 06 07 08 09 10 11 12 13 14 15p
$ Billions
Calendar Year
State Funds ($B)
Private Carriers ($B)
6
Countrywide Workers Compensation Net Written Premium Growth Continued
Private Carriers and State Funds

© Copyright 2016 National Council on Compensation Insurance, Inc. All Rights Reserved.
p Preliminary Sources: NAIC’s Annual Statement Statutory Page 14 and NCCI’s Financial Call data Dividend ratios are based on calendar year statistics NCCI benchmark level does not include a profit and contingency provision Based on data valued as of 12/31/2015 for all states where NCCI provides ratemaking services, excluding TX
-7.1 -7.4 -7.1 -8.5
-10.5
-14.6
-17.7
-22.6 -23.2
-19.2
-14.3
-4.0 -1.7
2.1 0.7
-2.2 -4.7
-7.4 -8.4 -8.8 -7.7
-3.8 -0.2
1.0 0.7
-25
-15
-5
5
91 92 93 94 95 96 97 98 99 00 01 02 03 04 05 06 07 08 09 10 11 12 13 14 15p
Percent
Policy Year
Rate/Loss Cost Departure Schedule Rating Dividends
7
Countrywide Workers Compensation Impact of Discounting on Premium
NCCI States—Private Carriers

© Copyright 2016 National Council on Compensation Insurance, Inc. All Rights Reserved.
117
123 121
109
102
97
100 101
107
115
118
122
111 110
107
103
93
101 101
110
115 115
109
102 100
94
85
90
95
100
105
110
115
120
125
90 91 92 93 94 95 96 97 98 99 00 01 02 03 04 05 06 07 08 09 10 11 12 13 14 15p
Percent
Calendar Year
4% lower
Countrywide Workers Compensation Combined Ratio—Underwriting Gain Achieved
Private Carriers
p Preliminary Source: NAIC’s Annual Statement data
8

© Copyright 2016 National Council on Compensation Insurance, Inc. All Rights Reserved.
Countrywide Workers Compensation Combined Ratio Components
Private Carriers
p Preliminary Source: NAIC’s Annual Statement data
55 59 60 54
15 14
24 25
1 1
90 91 92 93 94 95 96 97 98 99 00 01 02 03 04 05 06 07 08 09 10 11 12 13 14 15p
Calendar Year
Loss Ratio
Loss Adjustment Expense (LAE) Ratio
Underwriting Expense Ratio
Percent
Dividends
9
© Copyright 2016 National Council on Compensation Insurance, Inc. All Rights Reserved.
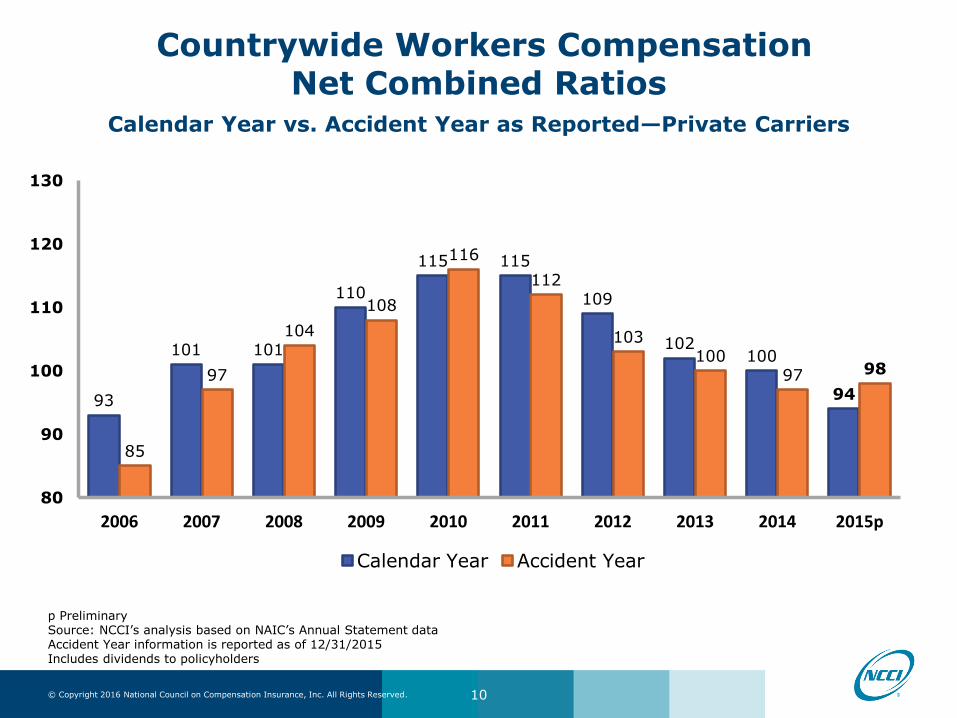
Countrywide Workers Compensation Net Combined Ratios
Calendar Year vs. Accident Year as Reported—Private Carriers
p Preliminary Source: NCCI’s analysis based on NAIC’s Annual Statement data Accident Year information is reported as of 12/31/2015 Includes dividends to policyholders
93
101 101
110
115 115
109
102 100
94
85
97
104
108
116
112
103 100
97 98
80
90
100
110
120
130
2006 2007 2008 2009 2010 2011 2012 2013 2014 2015p
Calendar Year Accident Year
10

© Copyright 2016 National Council on Compensation Insurance, Inc. All Rights Reserved.
p Preliminary
Bureau premium level changes reflect approved changes in advisory rates, loss costs, assigned risk rates, and rating values, relative to those previously approved in NCCI states only
IN and NC are filed in cooperation with state rating bureaus
Countrywide Workers Compensation Approved Changes in Bureau Premium Level
By Effective Year for NCCI States
11
0.6
-1.2 -0.5
2.5
0.4
-0.2 -0.3
-3 -3.8
-5.1
-2.6
-1.3
2.1
-0.2
-1.4
-4.5
-2.5
-10
-5
0
5
00 01 02 03 04 05 06 07 08 09 10 11 12 13 14 15 16p
Percent
Calendar Year
Cumulative Change of –19.4% (1999–2016p)

© Copyright 2016 National Council on Compensation Insurance, Inc. All Rights Reserved.
19
30
27 26
0 1 1 1
19
7
10
1
2013/2014 Season 2014/2015 Season 2015/2016 Season 2016/2017 Season
Less Than 0% No Filing 0% and Greater
12
NCCI Voluntary Market Filing Activity
Number of State Loss Cost/Rate Filings by Filing Season

© Copyright 2016 National Council on Compensation Insurance, Inc. All Rights Reserved.
Current NCCI Voluntary Market Loss Cost/Rate Level Changes
Excludes Law-Only Filings
-14.7
-14.4
-12.9
-12.8
-10.2
-9.9
-9.9
-9.1
-9.0
-9.0
-8.8
-8.4
-7.5
-6.6
-5.5
-5.0
-4.7
-4.7
-4.3
-3.7
-3.7
-3.4
-1.3
-1.2
0.1
2.5
2.6
2.8
-12.8
-12.1
-10.9
-9.8
-6.1
-5.5
-5.5
-4.0
-2.4
1.3
-25
-20
-15
-10
-5
0
5
10
15
WVNC IL AZ TN AL CT OKMD TX LA IN NHNM UT KS RI OR MS AK NV VA KY FL IA AR NE DCMOMT CO SD ID ME HI SC VT GA
Approved Pending
Reflects the most recent experience filing in each jurisdiction Due to the timing of the individual loss cost/rate filings, the figures shown may include changes from prior filing seasons
Percent
13

© Copyright 2016 National Council on Compensation Insurance, Inc. All Rights Reserved.
Current Voluntary Market Rates/Loss Costs Western NAIC Zone
Hawaii* 1/1/17 +1.3%
Idaho 1/1/17 –1.2%
Colorado* 1/1/17 –2.4%
Montana 7/1/16 –3.4%
Alaska* 1/1/17 –5.5%
Nevada 3/1/16 –5.5%
Oregon 1/1/17 –6.6%
Utah 12/1/16 –8.8%
New Mexico 1/1/17 –9.0%
Texas 7/1/16 –9.9%
Arizona 1/1/17 –12.8%
14
*Pending

© Copyright 2016 National Council on Compensation Insurance, Inc. All Rights Reserved.
Workers Compensation Legislation: What Happened, What Didn’t Happen, and What’s Coming

© Copyright 2016 National Council on Compensation Insurance, Inc. All Rights Reserved.
2016 Legislative Sessions
CA
OR
ID
WA
MT
NV
AK
UT
AZ
CO
NM
WY
TX
OK
KS
NE
SD
ND
MN
IA
MO
AR
LA
IL
WI
MI
IN OH
MS AL GA
FL
TN
KY
SC
NC
VA WV
PA
NY
NJ
ME
VT NH
MD
DE
CT RI
DC
MA
HI
States With
2015/2016 Carryover
States With 2016/2017 Biennium
States With No
Carryover
States With No Regular Session in
2016
16

© Copyright 2016 National Council on Compensation Insurance, Inc. All Rights Reserved.
Top Five Workers Compensation-Related Legislation Topics in 2016
First Responder Presumption
Employer/Employee Definition
Medical Cost Management
Independent Contractors and Misclassification
Exclusive Remedy
17

© Copyright 2016 National Council on Compensation Insurance, Inc. All Rights Reserved.
Drug Formulary
States Recently Instituting Drug Formularies:
Tennessee Rule 0800-02-25, effective August 28, 2016
California AB 1124, effective July 1, 2017
Recent Legislation Proposing Formularies:
Nebraska LB 1005, deferred due to prioritization
Louisiana HB 725, died in committee
Recent Regulations Proposing Formularies:
Arizona—Rules R20-5-1301 through 1312
Nevada Guidelines
Feasibility Study:
North Carolina, having completed the study required in HB 97, recommends further review and postponing implementation to no earlier than July 1, 2018
18

© Copyright 2016 National Council on Compensation Insurance, Inc. All Rights Reserved.
Opt-Out
Introduced, but no further action was taken:
South Carolina Employee Injury Benefit Plan Alternative (HB 4197)
Tennessee Employee Injury Benefit Alternative (HB 997/SB 721)
19

© Copyright 2016 National Council on Compensation Insurance, Inc. All Rights Reserved.
Number of Requests to NCCI for Pricing of Law/Regulation Changes in the Last Five Years
20
*2016 data as of 7/21/2016
120
172
136 147
107
0
25
50
75
100
125
150
175
200
2012 2013 2014 2015 2016*

© Copyright 2016 National Council on Compensation Insurance, Inc. All Rights Reserved.
2016 Law-Only Filings
Alaska (approved): –3.7% impact of
medical fee schedule changes
Florida (approved): +14.5% impact of state Supreme Court rulings
in the cases of Castellanos and
Westphal combined with recently enacted
medical reimbursement changes (SB 1402)
Oklahoma (approved):
+3.4 impact of state Supreme Court ruling
in Maxwell
Tennessee (approved):
–2.7% impact of Rule 0800-02-25 (Drug
Formulary and Medical Treatment
Guidelines)
21

© Copyright 2016 National Council on Compensation Insurance, Inc. All Rights Reserved.
NCCI’s Role in the Legislative Process
Monitors the effects of law changes/court rulings after they are enacted
After the legislature has adjourned:
Prepares circulars on substantive changes Makes filings if needed
•Files rate/loss costs to address changes when the cost impact is significant
•Files rule/program changes, if needed
Before and during the legislative session:
Provides examples of how an issue is treated in other states Analyzes the cost impact of various options being considered and updates the impact analysis if a bill is amended
22

© Copyright 2016 National Council on Compensation Insurance, Inc. All Rights Reserved.
New Mexico Legislature Convened a Special Session
The New Mexico state legislature has convened for
a special session to resolve a major budget shortfall and consider stiffer criminal sentencing laws
New Mexico finished the budget year in June with a $131 million deficit after exhausting operating reserves, as a sustained downturn in energy markets cut into state revenues and rippled through the economy
At last count, the $6.2 billion general fund spending plan for the current year exceeds estimated revenues by $458 million
23

© Copyright 2016 National Council on Compensation Insurance, Inc. All Rights Reserved.
Key Takeaways
Legislative activity for 2016 is about average for an election year
No significant workers compensation measures have progressed
Opt-out proposals in South Carolina and Tennessee stalled
The financial impact of legislation, regulations, and judicial decisions priced in 2016 on states’ WC systems ranged from –3.7% to +19.6%
New terminology has emerged regarding the gig economy and independent contractors: “Qualified Marketplace Contractor”
24

© Copyright 2016 National Council on Compensation Insurance, Inc. All Rights Reserved.
New Mexico Workers Compensation

© Copyright 2016 National Council on Compensation Insurance, Inc. All Rights Reserved.
New Mexico Workers Compensation System—
An Overview
Premium continues to
increase
Improvement in the
combined ratio
Frequency continues to
decline
Medical costs have been volatile in
recent years
26

© Copyright 2016 National Council on Compensation Insurance, Inc. All Rights Reserved.
New Mexico’s Workers Compensation Premium Volume
Direct Written Premium in $ Millions
$279 $280 $261
$232 $218
$231 $252
$273 $291 $296
2006 2007 2008 2009 2010 2011 2012 2013 2014 2015
Source: NAIC’s Annual Statement data
Calendar Year
27

© Copyright 2016 National Council on Compensation Insurance, Inc. All Rights Reserved.
Impact of Discounting on Workers Compensation Premium in New Mexico
10.5%
10.7%
12.9%
15.2% 14.2%
10.6%
2.1% 4.0%
7.0% 6.3%
4.0%
-10%
-5%
0%
5%
10%
15%
20%
2005 2006 2007 2008 2009 2010 2011 2012 2013 2014 2015p
Policy Year
Rate/Loss Cost Departure Schedule Rating Dividends
P Preliminary Based on data through 12/31/2015 Dividend ratios are based on calendar year statistics
Percent
28

© Copyright 2016 National Council on Compensation Insurance, Inc. All Rights Reserved.
New Mexico Accident Year Combined Ratios
112% 116%
94% 91% 87%
2011 2012 2013 2014 2015
Sources: NCCI’s financial data and NAIC’s Annual Statement data
Accident Year
29
© Copyright 2016 National Council on Compensation Insurance, Inc. All Rights Reserved.
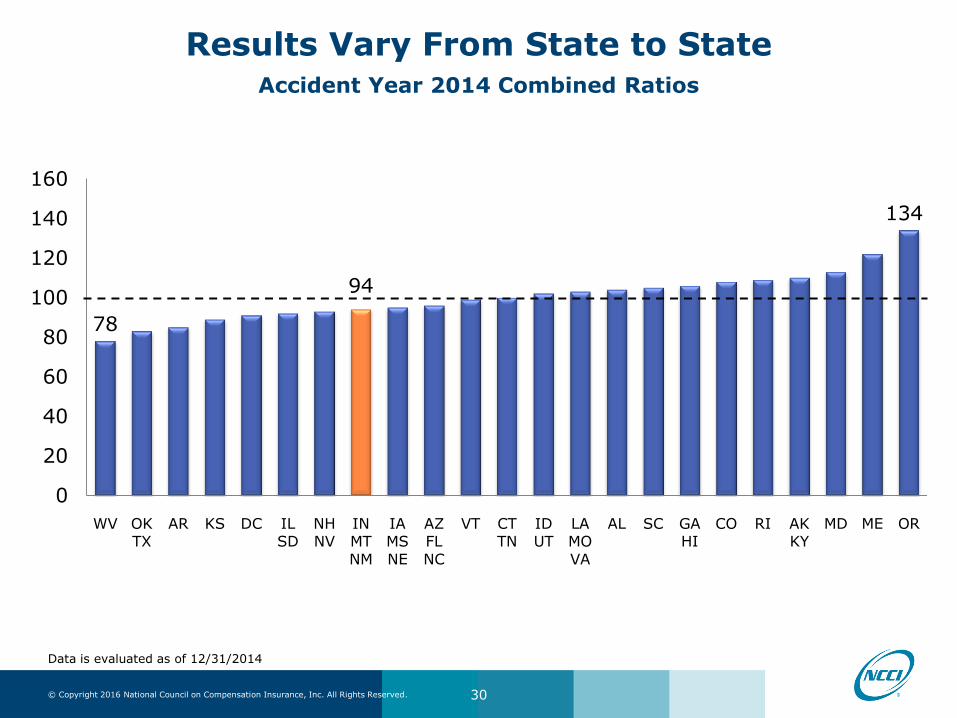
Results Vary From State to State
Accident Year 2014 Combined Ratios
78
94
134
0
20
40
60
80
100
120
140
160
WV OKTX
AR KS DC ILSD
NHNV
INMT
NM
IAMS
NE
AZFL
NC
VT CTTN
IDUT
LAMO
VA
AL SC GAHI
CO RI AKKY
MD ME OR
Data is evaluated as of 12/31/2014
30

© Copyright 2016 National Council on Compensation Insurance, Inc. All Rights Reserved.
New Mexico January 1, 2017 Loss Cost Filing
Experience
–7.6%
Experience Period
–4.9%
Loss Development
–2.9%
Trend
–3.7%
Indemnity 0.0%
Medical –5.9%
Benefits
+0.5%
Indemnity (SAWW)
+0.4%
Medical (Schedule)
+0.5%
LAE
+0.3%
Flat Factor
+1.4%
Overall Loss Cost Level Change: –9.0%
Changes due to:
31
Assigned Risk Rate Level Change: –7.0%

© Copyright 2016 National Council on Compensation Insurance, Inc. All Rights Reserved.
New Mexico January 1, 2017 Filing— Average Changes by Industry Group
Manufacturing
-10.5%
Contracting
-7.8%
Office and Clerical
-12.3%
Goods and Services
-9.3%
Miscellaneous
-8.0%
Overall -9.0%
32

© Copyright 2016 National Council on Compensation Insurance, Inc. All Rights Reserved.
$1.53
$1.24
$1.41
$0.60
$1.00
$0.86
$1.37
NM AZ CO TX UT Region Country
Based on the latest NCCI approved rates and loss costs in the various states
Current Average Voluntary Pure Loss Costs Using New Mexico’s Payroll Distribution
Pure Loss Cost—All Classes
33

© Copyright 2016 National Council on Compensation Insurance, Inc. All Rights Reserved.
New Mexico’s Indemnity and Medical Loss Ratios
0.47
0.39
0.71
0.55
0.0
0.1
0.2
0.3
0.4
0.5
0.6
0.7
0.8
2007 2008 2009 2010 2011 2012 2013 2014
Lo
ss R
ati
o
Policy Year
Indemnity Medical
Based on NCCI’s financial data at current benefit level and developed to ultimate
34

© Copyright 2016 National Council on Compensation Insurance, Inc. All Rights Reserved.
New Mexico’s Residual Market

© Copyright 2016 National Council on Compensation Insurance, Inc. All Rights Reserved.
Where Does NCCI Provide Residual Market Services?
36

© Copyright 2016 National Council on Compensation Insurance, Inc. All Rights Reserved.
Residual Market Snapshot
All Pools, Policy Year 2015 as of 12/31/15*
2015 Written Premium—$1.2 billion*
2015 Operating Losses—$66 million*
2015 Combined Ratio—106%*
2015 Residual Market Share—8%*
*Incomplete policy year projected to ultimate, preliminary
37

© Copyright 2016 National Council on Compensation Insurance, Inc. All Rights Reserved.
Workers Compensation Residual Market Premium
NCCI-Serviced Workers Compensation Residual Market Pools as of 12/31/2015
2.1
2.6
2.8
3.5
4.0
4.4
4.8
4.1
3.1
2.0
1.0
0.6
0.3 0.3 0.4
0.6
1.1
1.4 1.5
1.4 1.2
0.9
0.7 0.5 0.5 0.5
0.8
1.1 1.2 1.2
0
1
2
3
4
5
$ Billions
*Incomplete policy year projected to ultimate, preliminary
38

© Copyright 2016 National Council on Compensation Insurance, Inc. All Rights Reserved.
Residual Market Share— NCCI Plan States
(Includes Direct Assignments)
Plan Premium as a Percentage of Direct Written Premium
10.8%
9.2%
7.5%
6.3%
4.9%
3.8% 3.5% 4.0%
5.3%
6.6% 6.8% 6.3%
0%
5%
10%
15%
2004 2005 2006 2007 2008 2009 2010 2011 2012 2013 2014 2015*
Calendar Year
*Preliminary For all NCCI Plan-administered states
39

© Copyright 2016 National Council on Compensation Insurance, Inc. All Rights Reserved.
New Mexico Residual Market Share
Plan Premium as a Percentage of Direct Written Premium
3.0%
3.7%
5.6%
7.0%
6.0%
0%
1%
2%
3%
4%
5%
6%
7%
8%
2011 2012 2013 2014 2015*
Calendar Year
*Preliminary
40
© Copyright 2016 National Council on Compensation Insurance, Inc. All Rights Reserved.
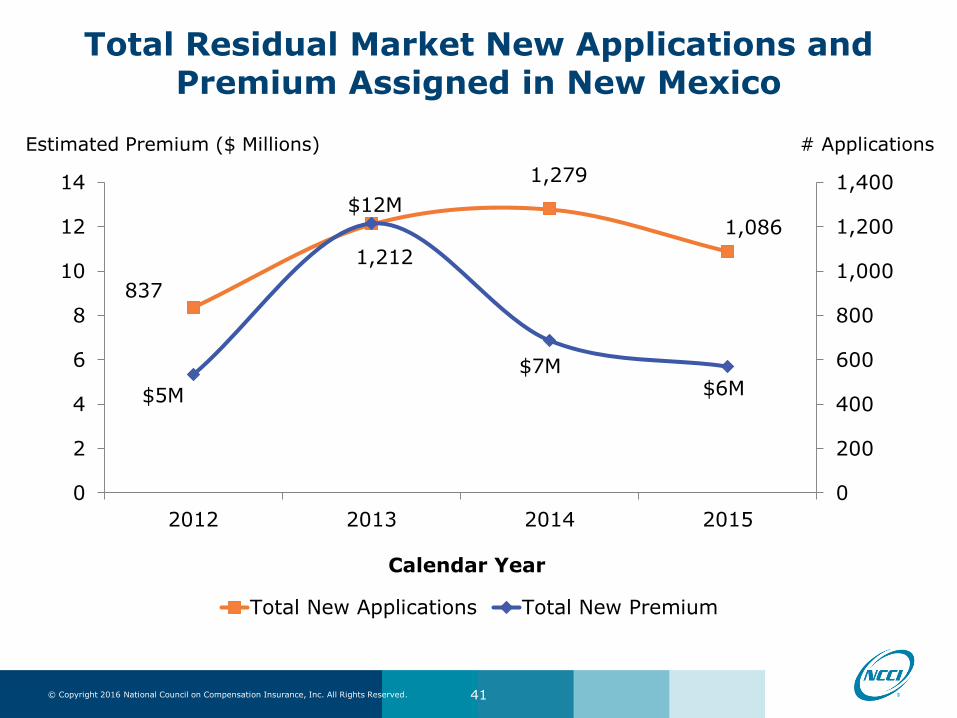
Total Residual Market New Applications and Premium Assigned in New Mexico
837
1,212
1,279
1,086
$5M
$12M
$7M $6M
0
2
4
6
8
10
12
14
2012 2013 2014 2015
0
200
400
600
800
1,000
1,200
1,400
Calendar Year
Total New Applications Total New Premium
Estimated Premium ($ Millions) # Applications
41

© Copyright 2016 National Council on Compensation Insurance, Inc. All Rights Reserved.
New Mexico’s Total Residual Market Plan Policy Counts
As of 12/31/15
4,109
3,521
2,818
2,392 2,221 2,135 2,210
2,657
3,018 2,923
-
500
1,000
1,500
2,000
2,500
3,000
3,500
4,000
4,500
2006 2007 2008 2009 2010 2011 2012 2013 2014 2015
Policy Year
42

© Copyright 2016 National Council on Compensation Insurance, Inc. All Rights Reserved.
New Mexico’s Total Residual Market Plan Estimated Premium Volume
Premium in $ Millions as of 12/31/15
$18.8
$12.6
$7.7
$5.6 $5.4 $5.6
$8.9
$16.1 $16.2
$12.6
$0
$2,000,000
$4,000,000
$6,000,000
$8,000,000
$10,000,000
$12,000,000
$14,000,000
$16,000,000
$18,000,000
$20,000,000
2006 2007 2008 2009 2010 2011 2012 2013 2014 2015
Policy Year
43

© Copyright 2016 National Council on Compensation Insurance, Inc. All Rights Reserved.
New Mexico Residual Market Change in Total Estimated Annual Premium
As of 12/31/15
Size of Risk 2014 2015 Change
$0 - $2,499 $1.8 $1.8 0.1%
$2,500 - $4,999 $0.9 $0.9 -4.5%
$5,000 - $9,999 $1.4 $1.4 -3.3%
$10,000 - $49,999 $4.3 $4.1 -5.2%
$50,000 - $99,999 $2.1 $1.9 -9.6%
$100,000 and over $5.7 $2.6 -53.9%
Total $16.2 $12.6 -22.0%
44
© Copyright 2016 National Council on Compensation Insurance, Inc. All Rights Reserved.
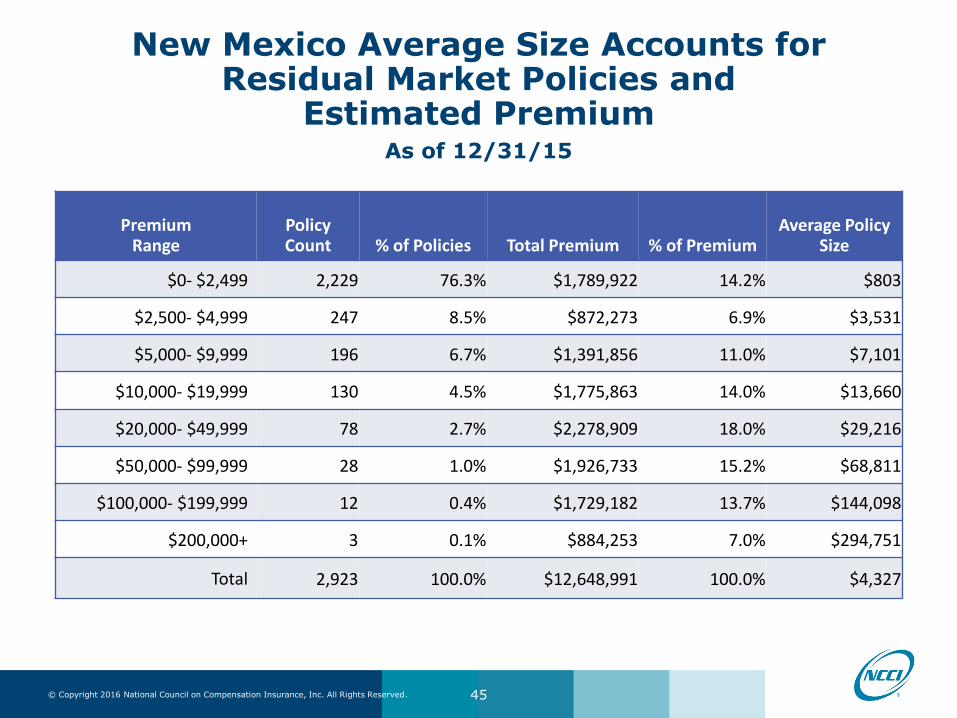
New Mexico Average Size Accounts for Residual Market Policies and
Estimated Premium
As of 12/31/15
Premium Range
Policy Count % of Policies Total Premium % of Premium
Average Policy Size
$0- $2,499 2,229 76.3% $1,789,922 14.2% $803
$2,500- $4,999 247 8.5% $872,273 6.9% $3,531
$5,000- $9,999 196 6.7% $1,391,856 11.0% $7,101
$10,000- $19,999 130 4.5% $1,775,863 14.0% $13,660
$20,000- $49,999 78 2.7% $2,278,909 18.0% $29,216
$50,000- $99,999 28 1.0% $1,926,733 15.2% $68,811
$100,000- $199,999 12 0.4% $1,729,182 13.7% $144,098
$200,000+ 3 0.1% $884,253 7.0% $294,751
Total 2,923 100.0% $12,648,991 100.0% $4,327
45

© Copyright 2016 National Council on Compensation Insurance, Inc. All Rights Reserved.
Assigned Risk Plan Policies and Estimated Premium
By State as of 12/31/15
State Total Policy Count Total Premium
AK 7,942 $34,799,717
AL 1,600 $11,393,989
AR 6,754 $24,040,907
AZ 6,065 $50,248,061
CT 14,367 $54,842,636
DC 1,407 $7,669,642
GA 19,679 $63,596,139
IA 4,665 $42,135,106
ID 721 $1,847,445
IL 33,414 $113,034,967
IN 9,052 $59,161,370
KS 8,914 $33,727,603
MS 2,690 $19,405,030
NH 5,774 $27,178,283
NM 2,923 $12,648,991
NV 4,698 $21,703,511
OR 9,383 $43,279,101
SC 11,690 $32,766,784
SD 1,762 $10,274,905
TN 5,927 $30,186,362
VA 15,719 $67,814,456
VT 4,116 $20,406,876
WV 2,520 $16,620,769
Total 181,782 $798,782,650
46

© Copyright 2016 National Council on Compensation Insurance, Inc. All Rights Reserved.
New Mexico Residual Market Reinsurance Pool Net Operating Results
Estimated Net Operating Gain/(Loss), Projected to Ultimate as of 12/31/2015
$951
$1,377
$3,094
$2,159
($412)
-$1,000 -$500 $0 $500 $1,000 $1,500 $2,000 $2,500 $3,000 $3,500
2011
2012
2013
2014
2015
Operating Gain/(Loss) (000's)
Po
licy Y
ear
47

© Copyright 2016 National Council on Compensation Insurance, Inc. All Rights Reserved.
Residual Market Underwriting Results
All Pools Serviced by NCCI as of 12/31/2015
-86
-56 -69
-101 -87
-47 -58
-68 -53
-34 -42
-66
-250
-200
-150
-100
-50
0
50
2004 2005 2006 2007 2008 2009 2010 2011 2012 2013 2014 2015*
$ Millions
Policy Year
*Incomplete policy year projected to ultimate, preliminary
48

© Copyright 2016 National Council on Compensation Insurance, Inc. All Rights Reserved.
New Mexico’s Assigned Risk Programs
Assigned Risk Adjustment Program (ARAP)
Differential/Surcharge
Take-Out Credit (TOC) Program
Workers Compensation Premium Adjustment for Qualifying Classifications
Voluntary Coverage Assistance Program (VCAP® Service)
49

© Copyright 2016 National Council on Compensation Insurance, Inc. All Rights Reserved. 50

© Copyright 2016 National Council on Compensation Insurance, Inc. All Rights Reserved.
Residual Market Summary
National
Stable residual market share
Manageable operating results
Slow growth in 2014 and 2015
New Mexico
Decrease in residual market share
Self-funded operating results
Please visit ncci.com for additional state and countrywide information.
51

© Copyright 2016 National Council on Compensation Insurance, Inc. All Rights Reserved.
Guest Speaker: Rachel Bayless New Mexico Workers’ Compensation Administration

© Copyright 2016 National Council on Compensation Insurance, Inc. All Rights Reserved.
Nationwide Economic Outlook

© Copyright 2016 National Council on Compensation Insurance, Inc. All Rights Reserved.
National Economic Indicator Potential Impact on the Workers Compensation Market
Private employment is expected to continue to grow slowly
Premium increases from higher payroll and higher expected claim frequency for new workers
Wage growth is poised to accelerate Upward pressure on payroll and premium as well as indemnity severity
Medical inflation is trending up Increased pressure on medical costs per claim
In December 2015, the Federal Reserve began raising the federal funds rate
Higher interest rates mean better returns on invested funds
National Economic Highlights and Their Impact on Workers Compensation
54

© Copyright 2016 National Council on Compensation Insurance, Inc. All Rights Reserved.
1.8
2.2 2.0
2.2 2.4
2.0
1.7
0
1
2
3
2011 2012 2013 2014 2015 2016f 2017f
f Forecast Private Nonfarm Employment Frequency of observation: annual; latest historical data point: 2015; forecast years: 2016 and 2017 Sources: US Bureau of Labor Statistics and Moody’s Analytics
Forecast Is for Continued but Slowing Growth in the Private Sector
US Private Employment Growth Annual Growth Rate Percent
55

© Copyright 2016 National Council on Compensation Insurance, Inc. All Rights Reserved.
3.0 2.8
1.1
3.1 3.1
3.5
4.3
0
1
2
3
4
5
2011 2012 2013 2014 2015 2016f 2017f
f Forecast Wages are for Total Private Industry Frequency of observation: annual; latest historical data point: 2015; forecast years: 2016 and 2017 Sources: US Bureau of Labor Statistics, Moody’s Analytics, and NCCI
Wages Are Forecast to Accelerate Significantly by 2017
US Average Weekly Wage Growth Annual Growth Rate Percent
56
© Copyright 2016 National Council on Compensation Insurance, Inc. All Rights Reserved.
0
5
10
15
20
2007 2008 2009 2010 2011 2012 2013 2014 2015 2016
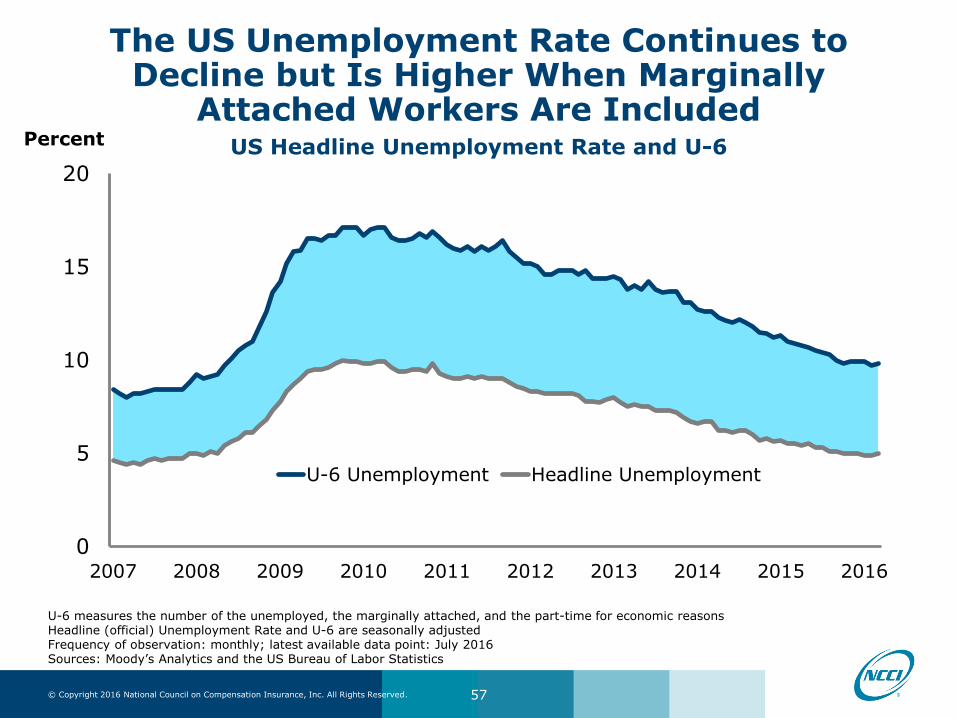
U-6 Unemployment Headline Unemployment
U-6 measures the number of the unemployed, the marginally attached, and the part-time for economic reasons Headline (official) Unemployment Rate and U-6 are seasonally adjusted Frequency of observation: monthly; latest available data point: July 2016 Sources: Moody’s Analytics and the US Bureau of Labor Statistics
The US Unemployment Rate Continues to Decline but Is Higher When Marginally
Attached Workers Are Included
US Headline Unemployment Rate and U-6 Percent
57

© Copyright 2016 National Council on Compensation Insurance, Inc. All Rights Reserved.
3.0
3.7
2.5 2.4 2.6
3.7 3.5
0
1
2
3
4
2011 2012 2013 2014 2015 2016f 2017f
f Forecast Medical Care Consumer Price Index, Urban Consumers Frequency of observation: annual; latest historical data point: 2015; forecast years: 2016 and 2017 Sources: US Bureau of Labor Statistics and Moody’s Analytics
Medical Inflation Is Forecast to Accelerate
US Medical Consumer Price Index Growth Rate
58
Percent

© Copyright 2016 National Council on Compensation Insurance, Inc. All Rights Reserved.
3.0
1.6
2.3 2.6
2.4
1.6
2.6
0
1
2
3
4
2011 2012 2013 2014 2015 2016 2017f
f Forecast Frequency of observation: interest rate as of June Latest historical data point: June 2016 Sources: Federal Reserve Board and Moody’s Analytics
Interest Rates Are Expected to Increase in 2017
10-Year Treasury Notes
59
Percent

© Copyright 2016 National Council on Compensation Insurance, Inc. All Rights Reserved.
National Economic Indicator Potential Impact on the Workers Compensation Market
Oil and natural gas prices are low Low energy prices benefit most producers—a positive for workers compensation because manufacturing accounts for 16% of premiums. However, layoffs in the energy sector negatively impact energy-dependent states.
Economic weakness in Europe and China should keep the dollar strong
A strong dollar may cut employment in export-centric industries, particularly equipment manufacturing and technology. This is a negative due to the large share of premiums in manufacturing.
Housing starts are increasing New residential construction should boost demand for construction workers—a positive because construction accounts for 24% of premiums.
Current Economic Headlines— National Economic Highlights and Their Impact
on Workers Compensation
60

© Copyright 2016 National Council on Compensation Insurance, Inc. All Rights Reserved.
$95 $94 $98
$93
$49 $44
$57
0
25
50
75
100
125
2011 2012 2013 2014 2015 2016f 2017f
f Forecast Petroleum Crude Oil Spot Price: West Texas Intermediate Frequency of observation: annual; latest historical data point: 2015; forecast years: 2016 and 2017 Sources: US Energy Information Administration and Moody’s Analytics
Oil Prices Are Forecast to Accelerate Next Year
West Texas Intermediate
61
US $ per Barrel
© Copyright 2016 National Council on Compensation Insurance, Inc. All Rights Reserved.
-800
-700
-600
-500
-400
-300
80
90
100
110
120
130
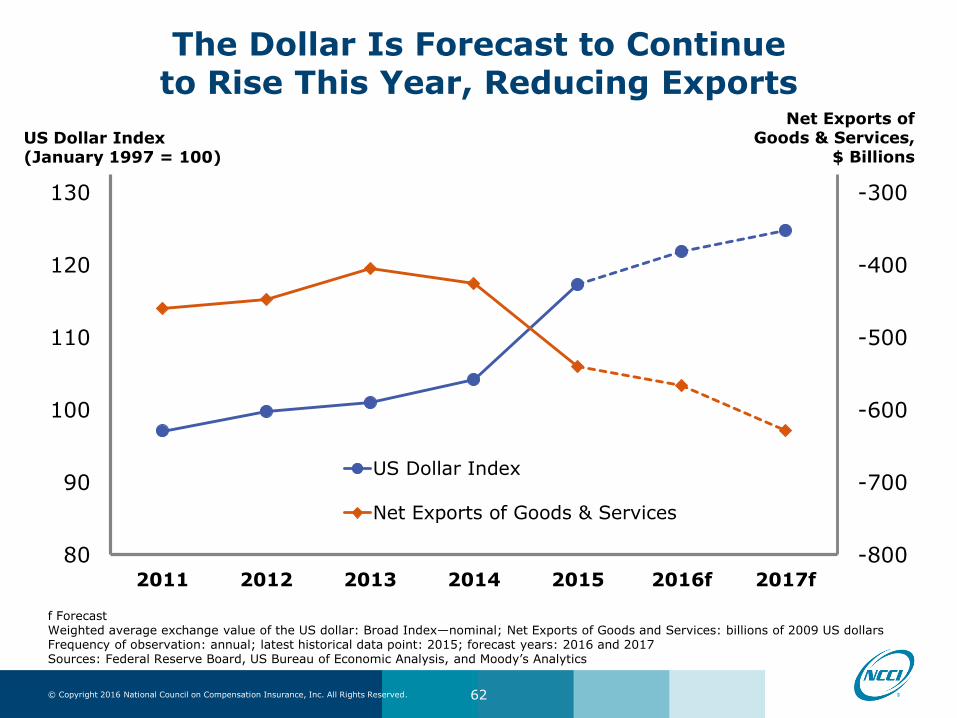
2011 2012 2013 2014 2015 2016f 2017f
US Dollar Index
Net Exports of Goods & Services
f Forecast Weighted average exchange value of the US dollar: Broad Index—nominal; Net Exports of Goods and Services: billions of 2009 US dollars Frequency of observation: annual; latest historical data point: 2015; forecast years: 2016 and 2017 Sources: Federal Reserve Board, US Bureau of Economic Analysis, and Moody’s Analytics
The Dollar Is Forecast to Continue to Rise This Year, Reducing Exports
62
US Dollar Index (January 1997 = 100)
Net Exports of Goods & Services,
$ Billions

© Copyright 2016 National Council on Compensation Insurance, Inc. All Rights Reserved.
0.6
0.8 0.9
1.0 1.1
1.2
1.7
0.0
0.5
1.0
1.5
2.0
2011 2012 2013 2014 2015 2016f 2017f
f Forecast Total Housing Starts Frequency of observation: annual; latest historical data point: 2015; forecast years: 2016 and 2017 Sources: US Census Bureau and Moody’s Analytics
Housing Starts Are Expected to Continue to Rise
Total Housing Starts
63
Millions

© Copyright 2016 National Council on Compensation Insurance, Inc. All Rights Reserved.
How Does the New Mexico Economy Compare?

© Copyright 2016 National Council on Compensation Insurance, Inc. All Rights Reserved.
Private Nonfarm Employment, seasonally adjusted Frequency of observation: monthly; latest available data point: July 2016; percentage change for the 12 months ending July 2016 Source: US Bureau of Labor Statistics (BLS), www.bls.gov
Change in Private Employment
Comparison of Private Employment Growth Across States
65
65

© Copyright 2016 National Council on Compensation Insurance, Inc. All Rights Reserved.
Percentage change for the latest 12 months as of July 2016 Current Employment Statistics Survey, seasonally adjusted; frequency of observation: monthly Source: US Bureau of Labor Statistics (BLS), www.bls.gov
Change in Employment by Industry
Employment in Most Industries Has Increased in the Past 12 Months
66
NM +6.6 141,600 17 +8,800
US +2.9
NM +2.6 191,100 23 +4,900
US +0.7
NM +2.5 95,500 11 +2,300
US +2.8
NM +1.8 101,500 12 +1,800
US +2.8
NM +1.5 13,400 2 +200
US +1.0
NM +0.9 43,700 5 +400
US +3.3
NM +0.3 28,800 3 +100
US +1.1
NM –0.9 33,000 4 –300
US +2.0
NM –1.6 137,100 17 –2,300
US +1.4
NM –6.1 26,100 3 –1,700
US –0.3
NM –26.1 18,700 2 –6,600
US –16.0
Government
Industrial Sector 12-Month Percent Change, July 2016
Sector
Size
Natural Resources and Mining
12-Month
Change
Education and Health Services
%
Share
Trade, Transportation, and Utilities
Manufacturing
Leisure and Hospitality
Professional and Business Services
Information
Construction
Other Services
Financial Activities

© Copyright 2016 National Council on Compensation Insurance, Inc. All Rights Reserved.
0.4
2.8
1.1 1.1
3.1 3.1
0
1
2
3
4
2013 2014 2015
New Mexico United States
Wages are for Total Private Industry Frequency of observation: annual; latest available data point: 2015 (preliminary) Source: US Bureau of Labor Statistics (BLS), www.bls.gov
Change in Average Weekly Wages
Wage Growth Is Below the Rest of the Nation
67
Percent

© Copyright 2016 National Council on Compensation Insurance, Inc. All Rights Reserved.
6.7 6.6 6.4 6.2
5.3 4.9
0
2
4
6
8
July 2014 July 2015 July 2016
New Mexico United States
Headline Unemployment Rate, seasonally adjusted Frequency of observation: monthly; latest available data point: July 2016 Source: US Bureau of Labor Statistics (BLS), www.bls.gov
Headline Unemployment Rate
The Unemployment Rate Is Above the National Average
68
Percent

© Copyright 2016 National Council on Compensation Insurance, Inc. All Rights Reserved.
New Mexico’s unemployment rate is above the US rate
Employment growth is below the US rate:
Education and Health Services is the top-performing sector in the state, with growth outpacing the national rate
Government, Leisure and Hospitality, and Professional and Business Services have also added numerous jobs
The Natural Resources and Mining; Manufacturing; Trade, Transportation, and Utilities; and Financial Activities sectors have all declined
New Mexico wage growth is below the US average
New Mexico’s Economic Highlights
69

© Copyright 2016 National Council on Compensation Insurance, Inc. All Rights Reserved.
Claim Frequency
© Copyright 2016 National Council on Compensation Insurance, Inc. All Rights Reserved.
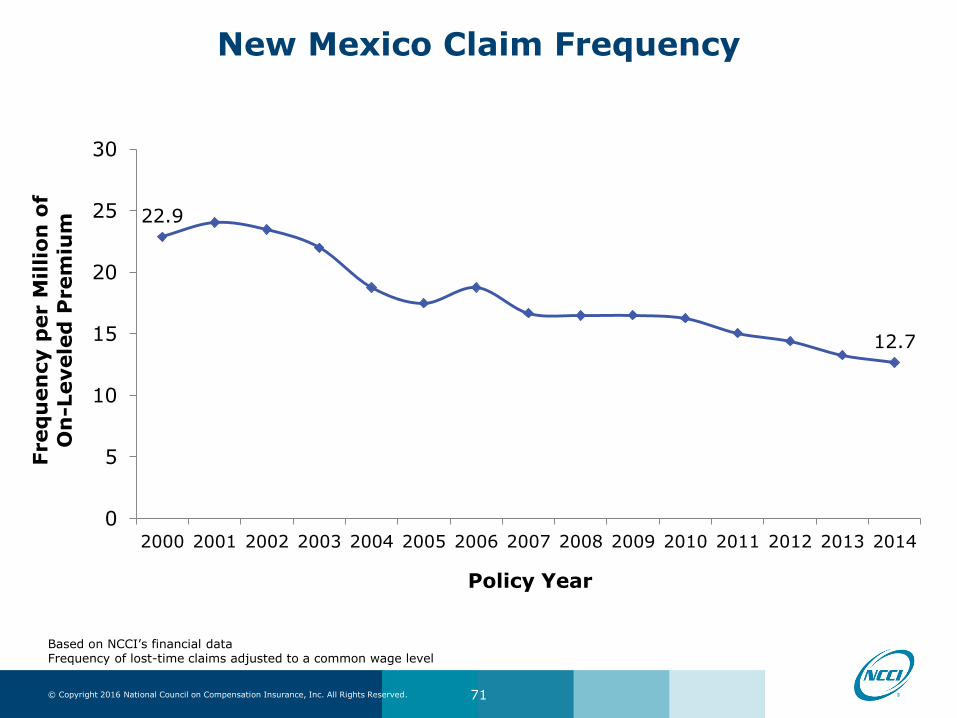
New Mexico Claim Frequency
22.9
12.7
0
5
10
15
20
25
30
2000 2001 2002 2003 2004 2005 2006 2007 2008 2009 2010 2011 2012 2013 2014
Freq
uen
cy p
er M
illi
on
of
On
-Levele
d P
rem
ium
Policy Year
Based on NCCI’s financial data Frequency of lost-time claims adjusted to a common wage level
71

© Copyright 2016 National Council on Compensation Insurance, Inc. All Rights Reserved.
New Mexico Workers Compensation Lost-Time Claim Frequency
Lost-Time Claims
5%
-2%
-6%
-15%
-7%
7%
-11%
-1%
0%
-2%
-7%
-4%
-8%
-5%
2001 2002 2003 2004 2005 2006 2007 2008 2009 2010 2011 2012 2013 2014
Policy Year
Cumulative Change of –44.7% (2000–2014)
Percent Change
Based on data through 12/31/2015, developed to ultimate
72
© Copyright 2016 National Council on Compensation Insurance, Inc. All Rights Reserved.
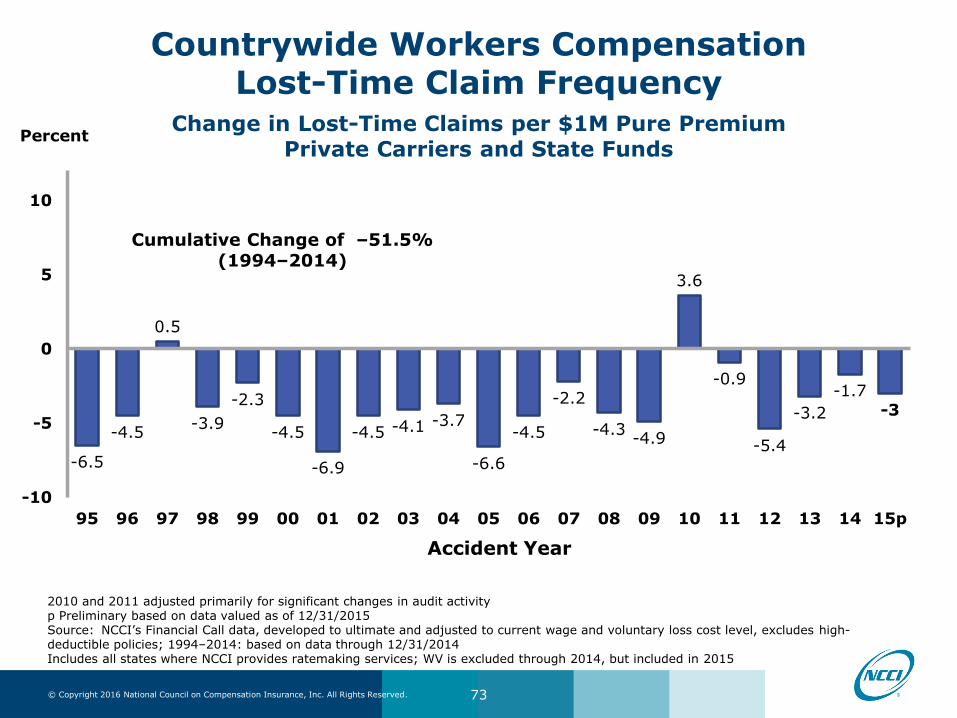
2010 and 2011 adjusted primarily for significant changes in audit activity p Preliminary based on data valued as of 12/31/2015 Source: NCCI’s Financial Call data, developed to ultimate and adjusted to current wage and voluntary loss cost level, excludes high- deductible policies; 1994–2014: based on data through 12/31/2014 Includes all states where NCCI provides ratemaking services; WV is excluded through 2014, but included in 2015
-6.5
-4.5
0.5
-3.9
-2.3
-4.5
-6.9
-4.5 -4.1 -3.7
-6.6
-4.5
-2.2
-4.3 -4.9
3.6
-0.9
-5.4
-3.2
-1.7 -3
-10
-5
0
5
10
95 96 97 98 99 00 01 02 03 04 05 06 07 08 09 10 11 12 13 14 15p
Percent
Accident Year
Cumulative Change of –51.5% (1994–2014)
73
Countrywide Workers Compensation Lost-Time Claim Frequency
Change in Lost-Time Claims per $1M Pure Premium Private Carriers and State Funds

© Copyright 2016 National Council on Compensation Insurance, Inc. All Rights Reserved.
New Mexico’s Average Claim Frequency
Frequency per 100,000 Workers—All Claims
794
615
945
624
678
679
2,720
3,021
3,269
1,817
3,239
2,374
Total 3,514
Total 3,636
Total 4,214
Total 2,441
Total 3,917
Total 3,053
NM
AZ
CO
TX
UT
Reg
Lost Time Medical Only
Based on NCCI’s Statistical Plan data
74

© Copyright 2016 National Council on Compensation Insurance, Inc. All Rights Reserved.
New Mexico’s Distribution of Claims by Injury Type
Regional states are AZ, CO, TX, and UT Based on NCCI’s Statistical Plan data
New Mexico
Region
Countrywide
76%
78%
77%
15%
14%
14%
9%
8%
9%
0%
0%
0%
0% 20% 40% 60% 80% 100%
Medical Only Temporary Total Permanent Partial Fatal & Permanent Total
75

© Copyright 2016 National Council on Compensation Insurance, Inc. All Rights Reserved.
Key Takeaways—Claim Frequency
Claim frequency is a key
cost driver
Both countrywide
and New Mexico claim
frequency declined in the latest
year
New Mexico’s distribution of claims is comparable to the region
76

© Copyright 2016 National Council on Compensation Insurance, Inc. All Rights Reserved.
Indemnity and Medical Severity

© Copyright 2016 National Council on Compensation Insurance, Inc. All Rights Reserved.
Medical Benefits Constitute the Majority of Total Benefit Costs in New Mexico
Indemnity
41%
Indemnity
36%
Indemnity
39%
Medical
59%
Medical
64%
Medical
61%
0% 20% 40% 60% 80% 100%
New Mexico
Region
Countrywide
Regional states are AZ, CO, TX, and UT Based on NCCI’s financial data
78

© Copyright 2016 National Council on Compensation Insurance, Inc. All Rights Reserved.
New Mexico’s Average Indemnity Claim Severity
25.5
16.7
30.6
4
9
14
19
24
29
34
2000 2001 2002 2003 2004 2005 2006 2007 2008 2009 2010 2011 2012 2013 2014
In
dem
nit
y A
verag
e
Cla
im S
everit
y (
$ '0
00
s)
Policy Year
Adjusted to Current Wage Level Actual
. 30.4
AY 15
Based on NCCI’s financial data for lost-time claims at current benefit level and developed to ultimate
79

© Copyright 2016 National Council on Compensation Insurance, Inc. All Rights Reserved.
$1
6.7
$1
8.3
$1
8.0
$1
8.5
$2
0.8
$2
1.0
$2
3.6
$2
4.4
$2
3.9
$2
3.2
$2
3.8
$2
4.4
$2
6.8
$2
6.3
$3
0.6
9.2% -1.3% 2.9%
12.1% 1.0%
12.4% 3.5% -2.1%
-2.8% 2.6% 2.5%
9.6% -1.9%
16.5%
2000 2001 2002 2003 2004 2005 2006 2007 2008 2009 2010 2011 2012 2013 2014
Policy Year
New Mexico’s Average Indemnity Claim Severity
Lost-Time Claim Severity in $ Thousands
Based on data through 12/31/2015, on-leveled and developed to ultimate
Cumulative Change of +82.8% (2000–2014)
80
© Copyright 2016 National Council on Compensation Insurance, Inc. All Rights Reserved.
$9
.8
$1
0.4
$1
1.2
$1
2.2
$1
3.5
$1
4.8
$1
6.2
$1
6.7
$1
7.5
$1
7.6
$1
8.2
$1
9.3
$2
0.5
$2
2.4
$2
2.6
$2
2.1
$2
2.2
$2
2.2
$2
2.9
$2
3.2
$2
3.5
+5.9% +7.7%
+9.0%
+10.1%
+10.1%
+9.2% +3.1%
+4.6% +1.0% +3.1%
+5.9%
+6.6%
+9.3% +0.6% -2.2% +0.9% -0.1%
+2.9% +1.5% +1.0%
5
10
15
20
25
95 96 97 98 99 00 01 02 03 04 05 06 07 08 09 10 11 12 13 14p 15p
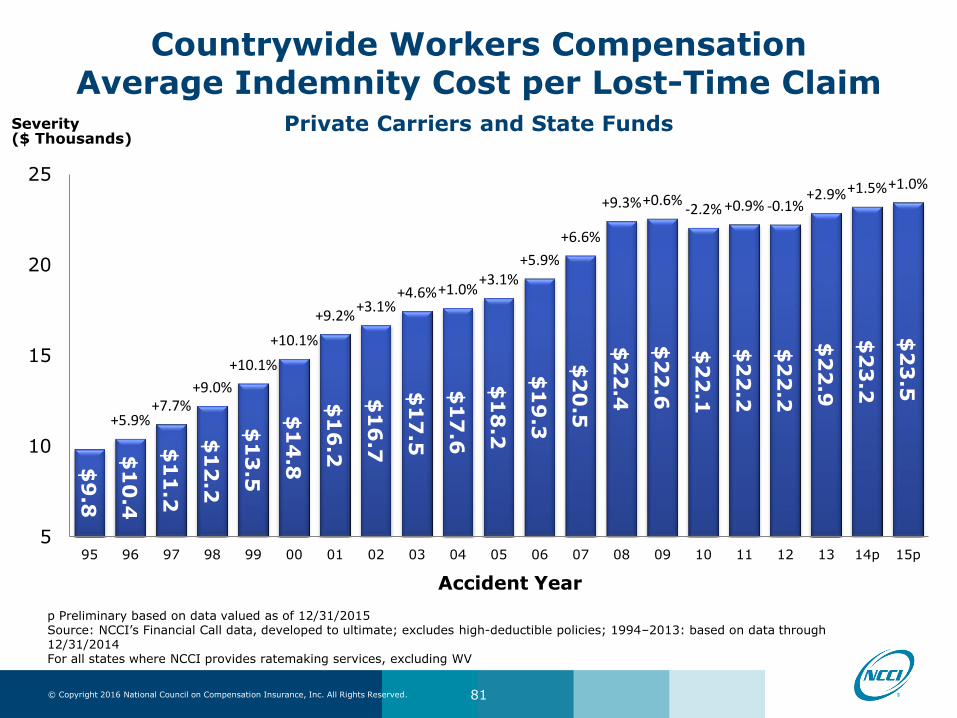
Countrywide Workers Compensation Average Indemnity Cost per Lost-Time Claim
Private Carriers and State Funds Severity ($ Thousands)
Accident Year
p Preliminary based on data valued as of 12/31/2015 Source: NCCI’s Financial Call data, developed to ultimate; excludes high-deductible policies; 1994–2013: based on data through 12/31/2014 For all states where NCCI provides ratemaking services, excluding WV
81

© Copyright 2016 National Council on Compensation Insurance, Inc. All Rights Reserved.
p Preliminary based on data valued as of 12/31/2015 Sources: Severity: NCCI’s Financial Call data, developed to ultimate, excludes high-deductible policies; 1994–2013: based on data through 12/31/2014 US Average Weekly Wage: 1994–2007 and 2012–2014, Quarterly Census of Employment and Wages; 2008–2011, NCCI; 2015p, NCCI and Moody’s Economy.com Includes all states where NCCI provides ratemaking services; WV is included in 2014 and subsequent
5
10
15
20
25
95 96 97 98 99 00 01 02 03 04 05 06 07 08 09 10 11 12 13 14p 15p
Severity ($ Thousands)
Accident Year
Cumulative Change in Excess of Wage Growth (1995–2015p): +23%
Cumulative Change (1995–2015p): +138%
82
Countrywide Workers Compensation Average Indemnity Cost per Lost-Time Claim
Private Carriers and State Funds—NCCI States
© Copyright 2016 National Council on Compensation Insurance, Inc. All Rights Reserved.
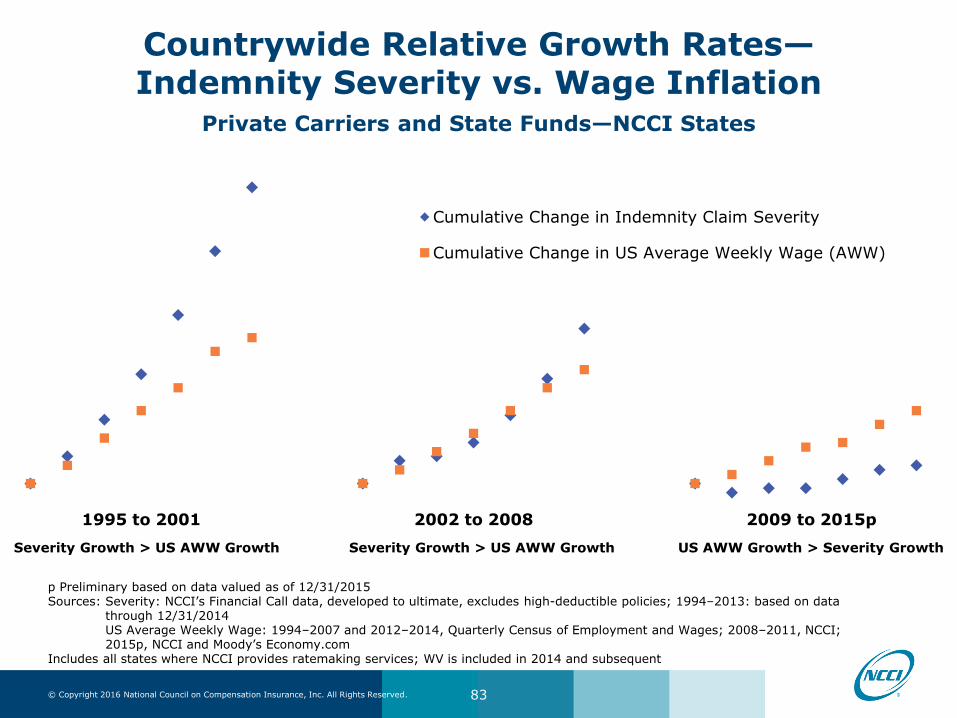
p Preliminary based on data valued as of 12/31/2015 Sources: Severity: NCCI’s Financial Call data, developed to ultimate, excludes high-deductible policies; 1994–2013: based on data through 12/31/2014 US Average Weekly Wage: 1994–2007 and 2012–2014, Quarterly Census of Employment and Wages; 2008–2011, NCCI; 2015p, NCCI and Moody’s Economy.com Includes all states where NCCI provides ratemaking services; WV is included in 2014 and subsequent
1995 to 2001 2002 to 2008 2009 to 2015p
Cumulative Change in Indemnity Claim Severity
Cumulative Change in US Average Weekly Wage (AWW)
Severity Growth > US AWW Growth
Severity Growth > US AWW Growth
US AWW Growth > Severity Growth
83
Countrywide Relative Growth Rates— Indemnity Severity vs. Wage Inflation
Private Carriers and State Funds—NCCI States

© Copyright 2016 National Council on Compensation Insurance, Inc. All Rights Reserved.
$30.6
$18.4
$23.4
$19.7
$13.2
NM AZ CO TX UT
Based on NCCI’s financial data for lost-time claims
Average Indemnity Claim Severity in the Region
Lost-Time Claim Severity in $ Thousands
84

© Copyright 2016 National Council on Compensation Insurance, Inc. All Rights Reserved.
New Mexico’s Indemnity Loss Distribution by Injury Type
85
Regional states are AZ, CO, TX, and UT Based on NCCI’s Statistical Plan data
31%
25%
24%
60%
52%
61%
4%
8%
5%
5%
15%
10%
0% 20% 40% 60% 80% 100%
Temporary Total Permanent Partial Permanent Total Fatal
New Mexico
Region
Countrywide

© Copyright 2016 National Council on Compensation Insurance, Inc. All Rights Reserved.
New Mexico’s Average Medical Claim Severity
31.6
20.8
43.8
4
9
14
19
24
29
34
39
44
49
2000 2001 2002 2003 2004 2005 2006 2007 2008 2009 2010 2011 2012 2013 2014
Med
ical A
verag
e
Cla
im S
everit
y (
$ '0
00
s)
Policy Year
Adjusted to Current Wage Level Actual
. 44.1
AY 15
Based on NCCI’s financial data for lost-time claims at current benefit level and developed to ultimate
86

© Copyright 2016 National Council on Compensation Insurance, Inc. All Rights Reserved.
$2
0.8
$2
6.0
$2
3.9
$2
9.0
$3
0.7
$3
2.8
$3
3.8
$3
7.0
$3
6.9
$3
8.6
$3
8.9
$3
8.4
$4
3.5
$3
8.1
$4
3.8
24.9% -7.7%
21.1% 5.9%
6.7% 3.2%
9.3% -0.2% 4.6% 0.7% -1.2%
13.4%
-12.5%
14.9%
2000 2001 2002 2003 2004 2005 2006 2007 2008 2009 2010 2011 2012 2013 2014
Policy Year
New Mexico’s Average Medical Claim Severity
Lost-Time Claim Severity in $ Thousands
Based on data through 12/31/2015, on-leveled and developed to ultimate
Cumulative Change of +110.6% (2000–2014)
87

© Copyright 2016 National Council on Compensation Insurance, Inc. All Rights Reserved.
Countrywide Workers Compensation Average Medical Cost per Lost-Time Claim
Private Carriers and State Funds
$9
.1
$9
.8
$1
0.8
$1
1.6
$1
2.9
$1
3.8
$1
5.7
$1
7.1
$1
8.4
$1
9.4
$2
0.9
$2
2.1
$2
3.4
$2
5.0
$2
6.2
$2
6.3
$2
6.8
$2
7.3
$2
8.0
$2
8.8
$2
8.5
+7.4% +10.1%
+8.3% +10.6%
+7.3%
+13.5% +8.8%
+7.7% +5.4%
+7.8% +5.8%
+5.9%
+7.0% +4.5% +0.4% +2.2 +2.0%
+2.3% +3.0%
-1.0%
5
10
15
20
25
30
95 96 97 98 99 00 01 02 03 04 05 06 07 08 09 10 11 12 13 14p 15p
Accident Year
p Preliminary based on data valued as of 12/31/2015 Source: NCCI’S Financial Call data, developed to ultimate, excludes high-deductible policies; 1994–2013: based on data through 12/31/2014 Includes all states where NCCI provides ratemaking services; WV is included in 2014 and subsequent
Severity ($ Thousands)
88
© Copyright 2016 National Council on Compensation Insurance, Inc. All Rights Reserved.
5
10
15
20
25
30
35
95 96 97 98 99 00 01 02 03 04 05 06 07 08 09 10 11 12 13 14p 15p
Severity ($ Thousands)
Accident Year
p Preliminary based on data valued as of 12/31/2015 Sources: Severity: NCCI’s Financial Call data, developed to ultimate, excludes high-deductible policies; 1994–2013: based on data through 12/31/2014 US Medical CPI: US Bureau of Labor Statistics Includes all states where NCCI provides ratemaking services; WV is included in 2014 and subsequent
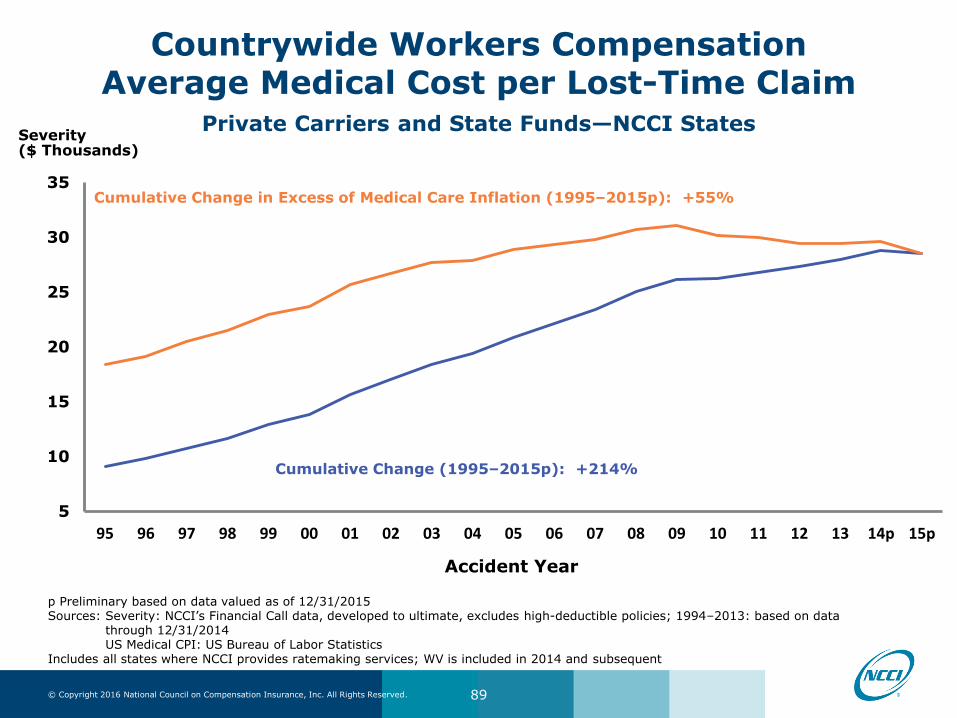
Countrywide Workers Compensation Average Medical Cost per Lost-Time Claim
Private Carriers and State Funds—NCCI States
89
Cumulative Change in Excess of Medical Care Inflation (1995–2015p): +55%
Cumulative Change (1995–2015p): +214%

© Copyright 2016 National Council on Compensation Insurance, Inc. All Rights Reserved.
1995 to 2001 2002 to 2008 2009 to2015p
Cumulative Change in Lost-Time Medical Claim Severity
Cumulative Change in US Medical Consumer Price Index (CPI)
p Preliminary based on data valued as of 12/31/2015 Sources: Severity: NCCI’s Financial Call data, developed to ultimate; excludes high-deductible policies; 1994–2013: based on data through 12/31/2014 US Medical CPI: US Bureau of Labor Statistics Includes all states where NCCI provides ratemaking services; WV is included in 2014 and subsequent
Countrywide Relative Growth Rates— Medical Severity vs. Medical Care Inflation
Private Carriers and State Funds—NCCI States
90
Severity Growth > US MCPI Growth
Severity Growth > US MCPI Growth
US MCPI Growth > Severity Growth

© Copyright 2016 National Council on Compensation Insurance, Inc. All Rights Reserved.
$43.8
$48.5
$31.1
$26.1
$36.7
NM AZ CO TX UT
Based on NCCI’s financial data for lost-time claims
Average Medical Claim Severity in the Region
Lost-Time Claim Severity in $ Thousands
91

© Copyright 2016 National Council on Compensation Insurance, Inc. All Rights Reserved.
New Mexico’s Medical Loss Distribution by Injury Type
29%
25%
17%
48%
48%
65%
9%
12%
9%
13%
14%
9%
1%
1%
0%
0% 20% 40% 60% 80% 100%
Temporary Total Permanent Partial Permanent Total Medical Only Fatal
New Mexico
Region
Countrywide
Regional states are AZ, CO, TX, and UT Based on NCCI’s Statistical Plan data
92

© Copyright 2016 National Council on Compensation Insurance, Inc. All Rights Reserved.
Key Takeaways—Benefit Costs
Indemnity costs have increased in
recent policy periods
Medical costs have been
volatile in recent policy periods
Indemnity and
medical severities are
high compared to the region
Indemnity share
of benefits is similar to the region and to countrywide
93

© Copyright 2016 National Council on Compensation Insurance, Inc. All Rights Reserved.
Emerging Issues: Oil and Gas Jobs

© Copyright 2016 National Council on Compensation Insurance, Inc. All Rights Reserved.
Overview
US Crude Oil
Where is it?
Historical overview
Benchmark—gasoline prices
Oil Jobs
Wages
State specifics
Job Shifting
Consumer Impact
95

© Copyright 2016 National Council on Compensation Insurance, Inc. All Rights Reserved.
US Oil Reserves
Source: US Energy Information Administration (2013), www.eia.gov/todayinenergy/detail.cfm?id=20952
96

© Copyright 2016 National Council on Compensation Insurance, Inc. All Rights Reserved.
The History of US Crude
Sources: US Energy Information Administration (2016, www.eia.gov/dnav/pet/hist/LeafHandler.ashx?n=PET&s=RWTC&f=A) and Thomas Reuters
$0
$20
$40
$60
$80
$100
$120
19
86
19
87
19
88
19
89
19
90
19
91
19
92
19
93
19
94
19
95
19
96
19
97
19
98
19
99
20
00
20
01
20
02
20
03
20
04
20
05
20
06
20
07
20
08
20
09
20
10
20
11
20
12
20
13
20
14
20
15
West Texas Intermediate Spot Price per Barrel

© Copyright 2016 National Council on Compensation Insurance, Inc. All Rights Reserved.
Average Gasoline Prices
Source: US Energy Information Administration, Short-Term Energy Outlook, Real Prices Viewer (December 2015)
98

© Copyright 2016 National Council on Compensation Insurance, Inc. All Rights Reserved.
The “Boom and Bust” of Oil and Gas Jobs
Source: US Bureau of Labor Statistics, http://data.bls.gov/timeseries/CES1021100001?data_tool=XGtable
99

© Copyright 2016 National Council on Compensation Insurance, Inc. All Rights Reserved.
Annual Average Crude Oil Price and Number of Active Oil and Gas Rigs, 1988–2014
Sources: Crude Oil Price—US Energy Information Administration, US Department of Energy Rig Count—Baker Hughes, Inc. (1993–2011 Sum of annual average for Active Rotary Rigs for the United States) National Institute for Occupational Safety and Health, www.cdc.gov/niosh/programs/oilgas/economics.html
0
200
400
600
800
1000
1200
1400
1600
1800
2000
$0
$20
$40
$60
$80
$100
$120
US
Oil
Rig
s in
Op
erat
ion
US
Cru
de
Pri
ce p
er B
arre
l
Year
100

© Copyright 2016 National Council on Compensation Insurance, Inc. All Rights Reserved.
Age Does Matter
Source: US Energy Information Administration (2016), www.eia.gov/todayinenergy/detail.cfm?id=25472 Well age reflects the difference between the calendar year and the year that the well started producing
101

© Copyright 2016 National Council on Compensation Insurance, Inc. All Rights Reserved.
Oil and Gas Extraction Average Hourly Earnings
Source: US Bureau of Labor Statistics, http://data.bls.gov/timeseries/CEU1021100008?data_tool=XGtable
102

© Copyright 2016 National Council on Compensation Insurance, Inc. All Rights Reserved.
Oil and Gas Extraction Jobs by State
Shown as a Percentage of Total Private Nonfarm Labor
0% .01–.10% .11–.50% .51–2.0%
Sources: US Bureau of Labor Statistics and Moody’s Analytics
103

© Copyright 2016 National Council on Compensation Insurance, Inc. All Rights Reserved.
Growing Industries
Source: US Bureau of Labor Statistics
104

© Copyright 2016 National Council on Compensation Insurance, Inc. All Rights Reserved.
Petroleum-Derived Consumer Products
Body Lotion
Breath Mints and Gum
Buttons
Carpet
Cell Phone
Cosmetics
Curtains
Deodorant
Dishes
Glasses
Hair Conditioner
Hair Shampoo
Hairbrush and Comb
Ibuprofen and Aspirin
Ice Cube Trays
Nail Polish
Pillows
Razors
Shaving Cream
Shoes
Soap
Socks
Toothbrush and Toothpaste
Trash Bags
Umbrellas
Vitamins
105

© Copyright 2016 National Council on Compensation Insurance, Inc. All Rights Reserved.
Oil Prices Are Forecast to Accelerate Next Year
West Texas Intermediate
$95 $94 $98
$93
$49 $41
$56
0
25
50
75
100
125
2011 2012 2013 2014 2015 2016f 2017f
f Forecast Petroleum Crude Oil Spot Price: West Texas Intermediate Frequency of observation: annual; latest historical data point: 2015; forecast years: 2016 and 2017 Sources: US Energy Information Administration and Moody's Analytics
US $ per Barrel
106

© Copyright 2016 National Council on Compensation Insurance, Inc. All Rights Reserved.
Summary
US Oil Production—increased
Technology/Oil Prices—decreasing jobs
Low Oil Prices—less expensive consumer goods and increasing jobs in other sectors
107

© Copyright 2016 National Council on Compensation Insurance, Inc. All Rights Reserved.
Closing Remarks Thank You!

© Copyright 2016 National Council on Compensation Insurance, Inc. All Rights Reserved.
Q & A

© Copyright 2016 National Council on Compensation Insurance, Inc. All Rights Reserved.
Glossary

© Copyright 2016 National Council on Compensation Insurance, Inc. All Rights Reserved.
Glossary
Assigned Risk Adjustment Program (ARAP)—An assigned risk market program that surcharges residual market risks based on the magnitude of their experience rating modification.
Calendar Year (CY)—Experience of earned premium and loss transactions occurring within the calendar year beginning January 1, irrespective of the contractual dates of the policies to which the transactions relate and the dates of the accidents.
Calendar-Accident Year (AY)—The accumulation of loss data on all accidents with the date of occurrence falling within a given calendar year. The premium figure is the same as that used in calendar year experience.
Claim Frequency—The number of claims per unit of exposure; for example, the number of claims per million dollars of premium or per 100 workers.
111

© Copyright 2016 National Council on Compensation Insurance, Inc. All Rights Reserved.
Glossary
Claim Severity—The average cost of a claim. Severity is calculated by dividing total losses by the total number of claims.
Combined Ratio—The sum of the (1) loss ratio, (2) expense ratio, and (3) dividend ratio for a given time period.
Detailed Claim Information (DCI)—An NCCI Call that collects detailed information on an individual workers compensation lost-time claim basis, such as type of injury, whether or not an attorney was involved, timing of the claim’s report to the carrier, etc.
Direct Written Premium (DWP)—The gross premium income adjusted for additional or return premiums, but excluding any reinsurance premiums.
112

© Copyright 2016 National Council on Compensation Insurance, Inc. All Rights Reserved.
Glossary
Indemnity Benefits—Payments by an insurance company to cover an injured worker’s time lost from work. These benefits are also referred to as “wage replacement” benefits.
Loss Ratio—The ratio of losses to premium for a given time period.
Lost-Time (LT) Claims—Claims resulting in indemnity benefits (and usually medical benefits) being paid to or on behalf of the injured worker for time lost from work.
Medical-Only Claims—Claims resulting in only medical benefits being paid on behalf of an injured worker.
Net Written Premium (NWP)—The gross premium income adjusted for additional or return premiums and including any additions for reinsurance assumed and any deductions for reinsurance ceded.
113

© Copyright 2016 National Council on Compensation Insurance, Inc. All Rights Reserved.
Glossary
Permanent Partial (PP)—A disability that is permanent but does not involve a total inability to work. The specific definition and associated workers compensation benefits are defined by statute and vary by jurisdiction.
Policy Year (PY)—The year of the effective date of the policy. Policy year financial results summarize experience for all policies with effective dates in a given calendar year period.
Schedule Rating—A debit and credit plan that recognizes variations in the hazard-causing features of an individual risk.
Take-Out Credit Program—An assigned risk program that encourages carriers to write current residual market risks in the competitive voluntary marketplace.
Temporary Total (TT)—A disability that totally disables a worker for a temporary period of time.
114

© Copyright 2016 National Council on Compensation Insurance, Inc. All Rights Reserved.
Appendix

© Copyright 2016 National Council on Compensation Insurance, Inc. All Rights Reserved.
NCCI’s Workers Compensation Resources
Financial Aggregate Calls
Used for aggregate ratemaking
Statistical Plan for Workers Compensation and Employers Liability Insurance (Statistical Plan)
Used for class ratemaking
Detailed Claim Information
In-depth sample of lost-time claims
Policy Data
Policy declaration page information
116

© Copyright 2016 National Council on Compensation Insurance, Inc. All Rights Reserved.
Financial Aggregate Calls
Collected Annually
Policy and calendar-accident year basis
Statewide and assigned risk data
Premiums, Losses, and Claim Counts
Evaluated as of December 31
Purpose
Basis for overall aggregate rate indication
Research
117

© Copyright 2016 National Council on Compensation Insurance, Inc. All Rights Reserved.
Policy Year Financial Aggregate Data
1/1/2013 12/31/2013 1/1/2012 1/1/2016 12/31/2016
Policy Expiration Date
Policy Effective Date
Policy
Year
2012
Policy
Year
2013
Policy
Year
2016
118

© Copyright 2016 National Council on Compensation Insurance, Inc. All Rights Reserved.
Calendar-Accident Year Financial Aggregate Data
119
1/1/2014 12/31/2014 1/1/2013 1/1/2017 12/31/2017
Policy Expiration Date
Policy Effective Date
Calendar-
Accident
Year
2013
Calendar-
Accident
Year
2014
Calendar-
Accident
Year
2017

© Copyright 2016 National Council on Compensation Insurance, Inc. All Rights Reserved.
Statistical Plan for Workers Compensation and Employers Liability Insurance
(Statistical Plan) Data
Experience by Policy Detail
Exposure, premium, and experience rating modifications
Individual claims by injury type
Purposes
Classification relativities
Experience Rating Plan
Research
120

© Copyright 2016 National Council on Compensation Insurance, Inc. All Rights Reserved.
Valuation of Statistical Plan Data
Policy
Effective 18 Months
1st
Report
Valuation
2nd
Report
Valuation
3rd
Report
Valuation
4th
Report
Valuation
5th
Report
Valuation
30 Months 42 Months
54 Months 66 Months
121