New London County Real Estate Update
4
March 2016 All Home Types Single Family Condo/Coop New London County, CT Presented by Linda Davis REMAX Home Team Email: [email protected] Mobile Phone: 860-625-4089 Web: www.simplyledyard.com
-
Upload
linda-davis-in-ledyard-ct -
Category
Real Estate
-
view
71 -
download
3
Transcript of New London County Real Estate Update

March 2016All Home Types
Single FamilyCondo/Coop
New London County, CT
Presented byLinda DavisREMAX Home TeamEmail: [email protected] Phone: 860-625-4089Web: www.simplyledyard.com

March 2016New London County, CT
Presented by
Linda Davis
REMAX Home TeamEmail: [email protected] Phone: 860-625-4089Web: www.simplyledyard.com
New Listings 603
64.3% 18.7%from Feb 2016:
367from Mar 2015:
508
YTD 2016 2015 +/-1,418 1,252 13.3%
5-year Mar average: 535
New Pendings 195
15.4% 23.4%from Feb 2016:
169from Mar 2015:
158
YTD 2016 2015 +/-579 490 18.2%
5-year Mar average: 222
Closed Sales 225
24.3% 12.5%from Feb 2016:
181from Mar 2015:
200
YTD 2016 2015 +/-634 480 32.1%
5-year Mar average: 203
MedianSold Price
$179,900
-2.8% -1.1%from Feb 2016:
$185,000from Mar 2015:
$181,950
YTD 2016 2015 +/-$180,000 $179,000 0.6%
5-year Mar average: $187,370
Closed Sales Median Sold Price ($1,000s)
M A M J J A S O N D J F M A M J J A S O N D J F M
2014 2015 2016
100
150
200
250
300
350
400
$180
$190
$200
$210
$220
$170
$230
Active Listings 2,116
Min2,035
Max2,424
5-year Mar average
2,116
2,161
Feb 2016 Mar 20151,943 2,035
MedianDays to Contract
69
Min64
Max92
5-year Mar average
69
76
Feb 2016 Mar 2015 YTD70 64 70
Avg Sold toOLP Ratio
90.5%
Min87.9%
Max90.7%
5-year Mar average
90.5%
89.3%
Feb 2016 Mar 2015 YTD 88.0% 90.7% 89.4%
Copyright © 2016 RealEstate Business Intelligence, LLC. All Rights Reserved.Data Source: CoreLogic. Statistics calculated April 08, 2016.
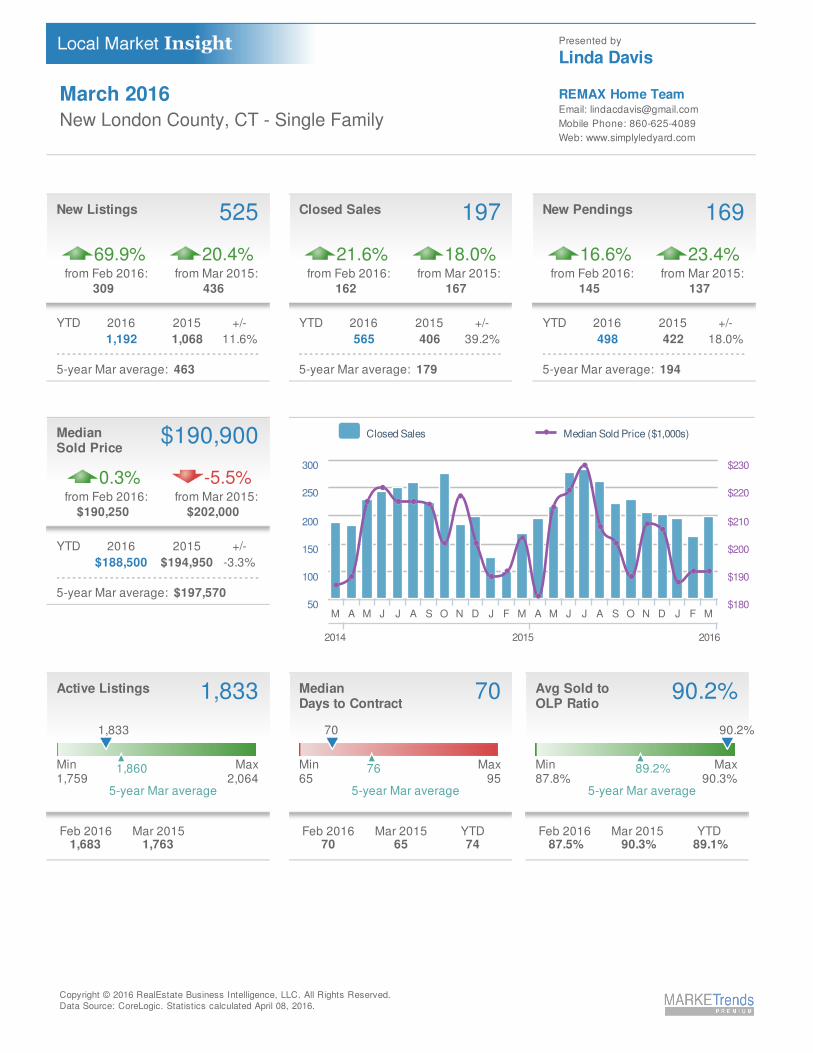
March 2016New London County, CT - Single Family
Presented by
Linda Davis
REMAX Home TeamEmail: [email protected] Phone: 860-625-4089Web: www.simplyledyard.com
New Listings 525
69.9% 20.4%from Feb 2016:
309from Mar 2015:
436
YTD 2016 2015 +/-1,192 1,068 11.6%
5-year Mar average: 463
New Pendings 169
16.6% 23.4%from Feb 2016:
145from Mar 2015:
137
YTD 2016 2015 +/-498 422 18.0%
5-year Mar average: 194
Closed Sales 197
21.6% 18.0%from Feb 2016:
162from Mar 2015:
167
YTD 2016 2015 +/-565 406 39.2%
5-year Mar average: 179
MedianSold Price
$190,900
0.3% -5.5%from Feb 2016:
$190,250from Mar 2015:
$202,000
YTD 2016 2015 +/-$188,500 $194,950 -3.3%
5-year Mar average: $197,570
Closed Sales Median Sold Price ($1,000s)
M A M J J A S O N D J F M A M J J A S O N D J F M
2014 2015 2016
100
150
200
250
300
50 $180
$190
$200
$210
$220
$230
Active Listings 1,833
Min1,759
Max2,064
5-year Mar average
1,833
1,860
Feb 2016 Mar 20151,683 1,763
MedianDays to Contract
70
Min65
Max95
5-year Mar average
70
76
Feb 2016 Mar 2015 YTD70 65 74
Avg Sold toOLP Ratio
90.2%
Min87.8%
Max90.3%
5-year Mar average
90.2%
89.2%
Feb 2016 Mar 2015 YTD 87.5% 90.3% 89.1%
Copyright © 2016 RealEstate Business Intelligence, LLC. All Rights Reserved.Data Source: CoreLogic. Statistics calculated April 08, 2016.

March 2016New London County, CT - Condo/Coop
Presented by
Linda Davis
REMAX Home TeamEmail: [email protected] Phone: 860-625-4089Web: www.simplyledyard.com
New Listings 78
34.5% 8.3%from Feb 2016:
58from Mar 2015:
72
YTD 2016 2015 +/-226 184 22.8%
5-year Mar average: 72
New Pendings 26
8.3% 23.8%from Feb 2016:
24from Mar 2015:
21
YTD 2016 2015 +/-81 68 19.1%
5-year Mar average: 28
Closed Sales 28
47.4% -15.2%from Feb 2016:
19from Mar 2015:
33
YTD 2016 2015 +/-69 74 -6.8%
5-year Mar average: 24
MedianSold Price
$141,000
18.0% -5.9%from Feb 2016:
$119,500from Mar 2015:
$149,900
YTD 2016 2015 +/-$127,500 $105,750 20.6%
5-year Mar average: $147,630
Closed Sales Median Sold Price ($1,000s)
M A M J J A S O N D J F M A M J J A S O N D J F M
2014 2015 2016
20
30
40
50
10
60
70
$80
$100
$120
$140
$160
$60
$180
Active Listings 283
Min272
Max360
5-year Mar average
283
301
Feb 2016 Mar 2015260 272
MedianDays to Contract
46
Min46
Max144
5-year Mar average
46
78
Feb 2016 Mar 2015 YTD78 55 46
Avg Sold toOLP Ratio
92.2%
Min88.1%
Max92.9%
5-year Mar average
92.2%
90.1%
Feb 2016 Mar 2015 YTD 92.7% 92.9% 92.3%
Copyright © 2016 RealEstate Business Intelligence, LLC. All Rights Reserved.Data Source: CoreLogic. Statistics calculated April 08, 2016.